Embed Size (px)
Citation preview
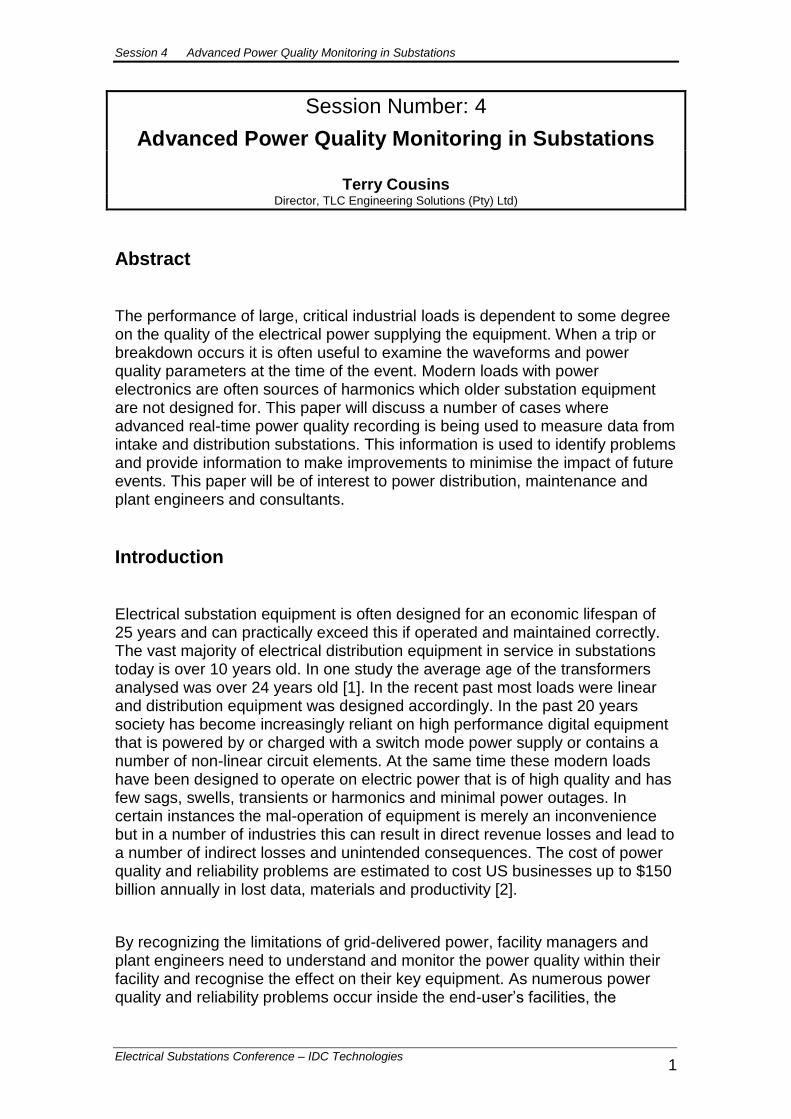
Session 4 Advanced Power Quality Monitoring in Substations
Electrical Substations Conference – IDC Technologies 1
Session Number: 4
Advanced Power Quality Monitoring in Substations
Terry Cousins Director, TLC Engineering Solutions (Pty) Ltd)
Abstract
The performance of large, critical industrial loads is dependent to some degree on the quality of the electrical power supplying the equipment. When a trip or breakdown occurs it is often useful to examine the waveforms and power quality parameters at the time of the event. Modern loads with power electronics are often sources of harmonics which older substation equipment are not designed for. This paper will discuss a number of cases where advanced real-time power quality recording is being used to measure data from intake and distribution substations. This information is used to identify problems and provide information to make improvements to minimise the impact of future events. This paper will be of interest to power distribution, maintenance and plant engineers and consultants.
Introduction
Electrical substation equipment is often designed for an economic lifespan of 25 years and can practically exceed this if operated and maintained correctly. The vast majority of electrical distribution equipment in service in substations today is over 10 years old. In one study the average age of the transformers analysed was over 24 years old [1]. In the recent past most loads were linear and distribution equipment was designed accordingly. In the past 20 years society has become increasingly reliant on high performance digital equipment that is powered by or charged with a switch mode power supply or contains a number of non-linear circuit elements. At the same time these modern loads have been designed to operate on electric power that is of high quality and has few sags, swells, transients or harmonics and minimal power outages. In certain instances the mal-operation of equipment is merely an inconvenience but in a number of industries this can result in direct revenue losses and lead to a number of indirect losses and unintended consequences. The cost of power quality and reliability problems are estimated to cost US businesses up to $150 billion annually in lost data, materials and productivity [2].
By recognizing the limitations of grid-delivered power, facility managers and plant engineers need to understand and monitor the power quality within their facility and recognise the effect on their key equipment. As numerous power quality and reliability problems occur inside the end-user’s facilities, the
Session 4 Advanced Power Quality Monitoring in Substations
Electrical Substations Conference – IDC Technologies 2
constant monitoring of power system and related equipment performance can be used as a cost-effective production and maintenance tool.
This paper examines substation recordings and requirements for a large synchronous motor, a substation feeding a UPS data centre for a bank and the intake substation to a large industrial plant. The plant is a large load adjacent to a residential area. Load fluctuations generate harmonics and flicker which has to be controlled to an acceptable level. Power quality recorders are used to monitor the incoming supply and alarm when the preset levels are exceeded. Data centres require very high availability from its power system. Power quality recorders are used to monitor the incoming supply as well as the condition of UPS equipment, inverters and standby generators. A large synchronous motor is used to power a compressor at a large petrochemical facility. Unscheduled downtime at this facility can translate to loss of production. Power quality issues with the incoming supply were suspected to cause unscheduled trips. The power quality along with other process variables are now continuously monitored by power quality recorders to ensure that the any trip can be analysed to ensure all plant equipment operates correctly and maintenance issues are identified.
Case 1: Monitoring a Compressor Motor
Equipment
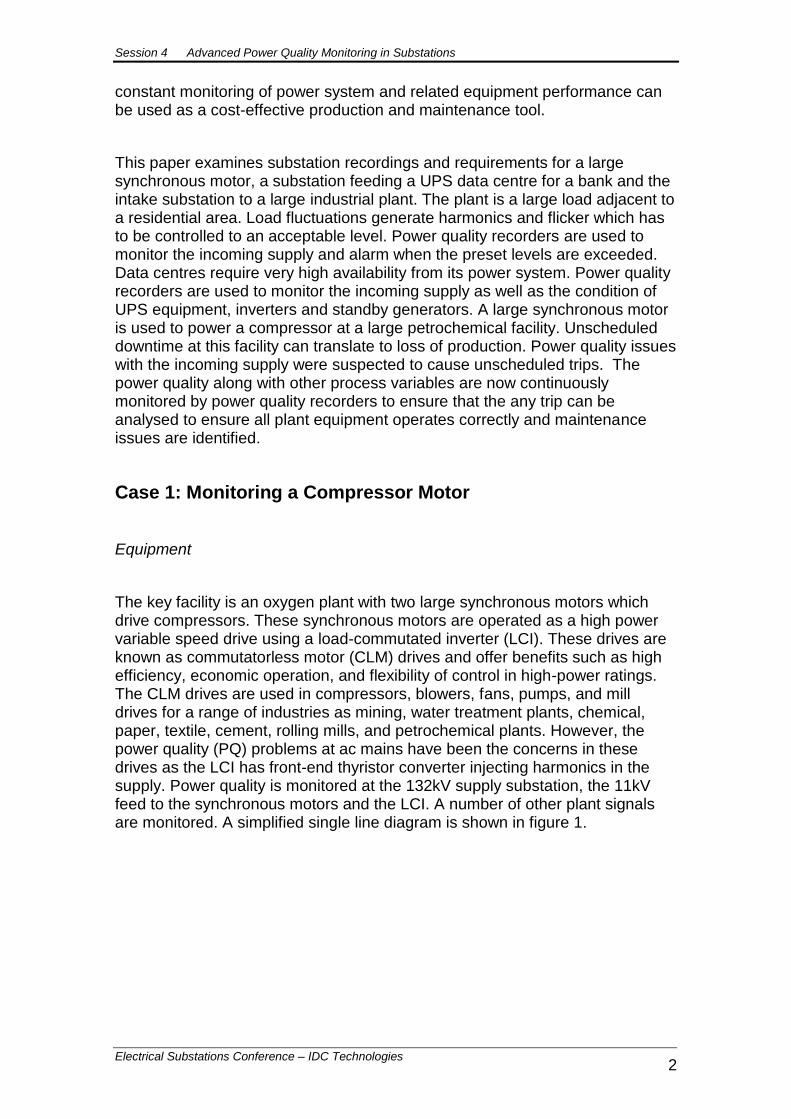
The key facility is an oxygen plant with two large synchronous motors which drive compressors. These synchronous motors are operated as a high power variable speed drive using a load-commutated inverter (LCI). These drives are known as commutatorless motor (CLM) drives and offer benefits such as high efficiency, economic operation, and flexibility of control in high-power ratings. The CLM drives are used in compressors, blowers, fans, pumps, and mill drives for a range of industries as mining, water treatment plants, chemical, paper, textile, cement, rolling mills, and petrochemical plants. However, the power quality (PQ) problems at ac mains have been the concerns in these drives as the LCI has front-end thyristor converter injecting harmonics in the supply. Power quality is monitored at the 132kV supply substation, the 11kV feed to the synchronous motors and the LCI. A number of other plant signals are monitored. A simplified single line diagram is shown in figure 1.
Session 4 Advanced Power Quality Monitoring in Substations
Electrical Substations Conference – IDC Technologies 3
Figure 1: Simplified Single Line Diagram of Compressor Motor Supply
The PQ monitoring system consists of a several 19” cabinets with rack mount equipment. The 132kV substation data recorder (SSDR) is about 800m from the compressor motor substation data recorder (CMDR). As the recorders need to operate synchronously they are time synchronised using GPS time references and interconnected with a fibre optic data cable. All the data is archived to a central server which also monitors the status of the PQ recording system. Configuration of either PQ recorder can be done from the central archiver. An adjacent plant is also equipped with an advanced PQ recorder similar to the equipment described in this paper and it is planned to be connected to the same central archiver. A block diagram of the system is shown in figure 2.
Session 4 Advanced Power Quality Monitoring in Substations
Electrical Substations Conference – IDC Technologies 4
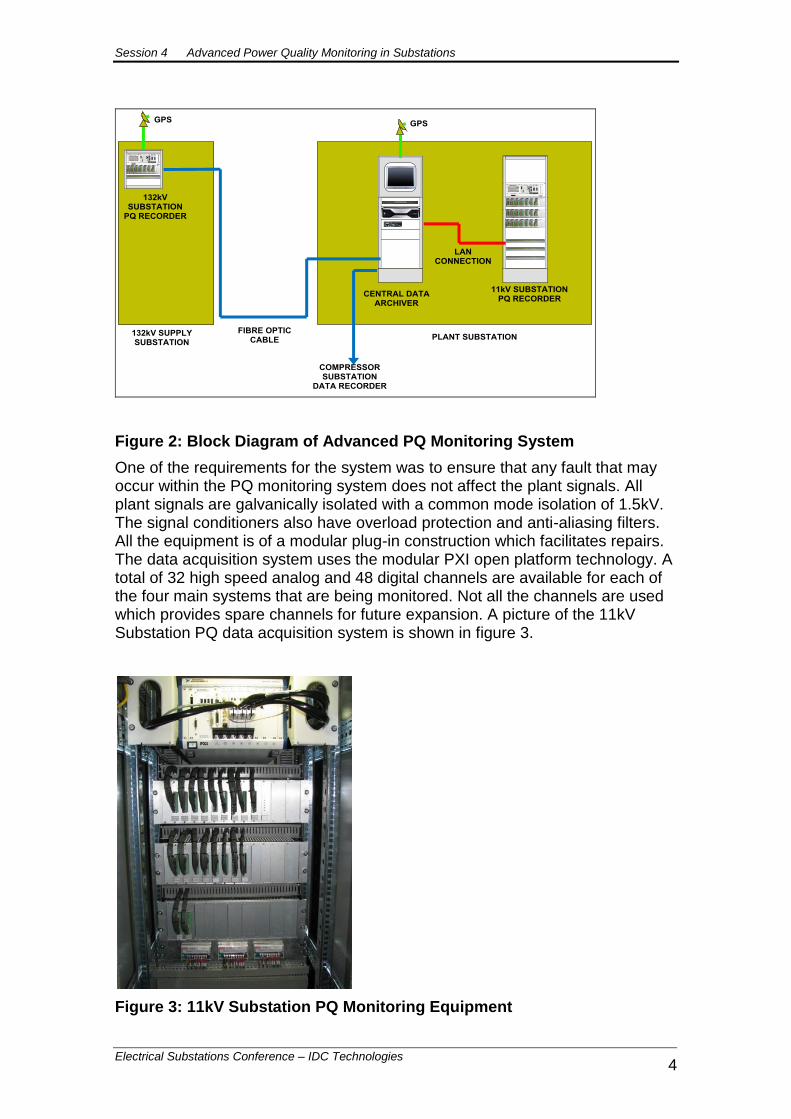
Figure 2: Block Diagram of Advanced PQ Monitoring System
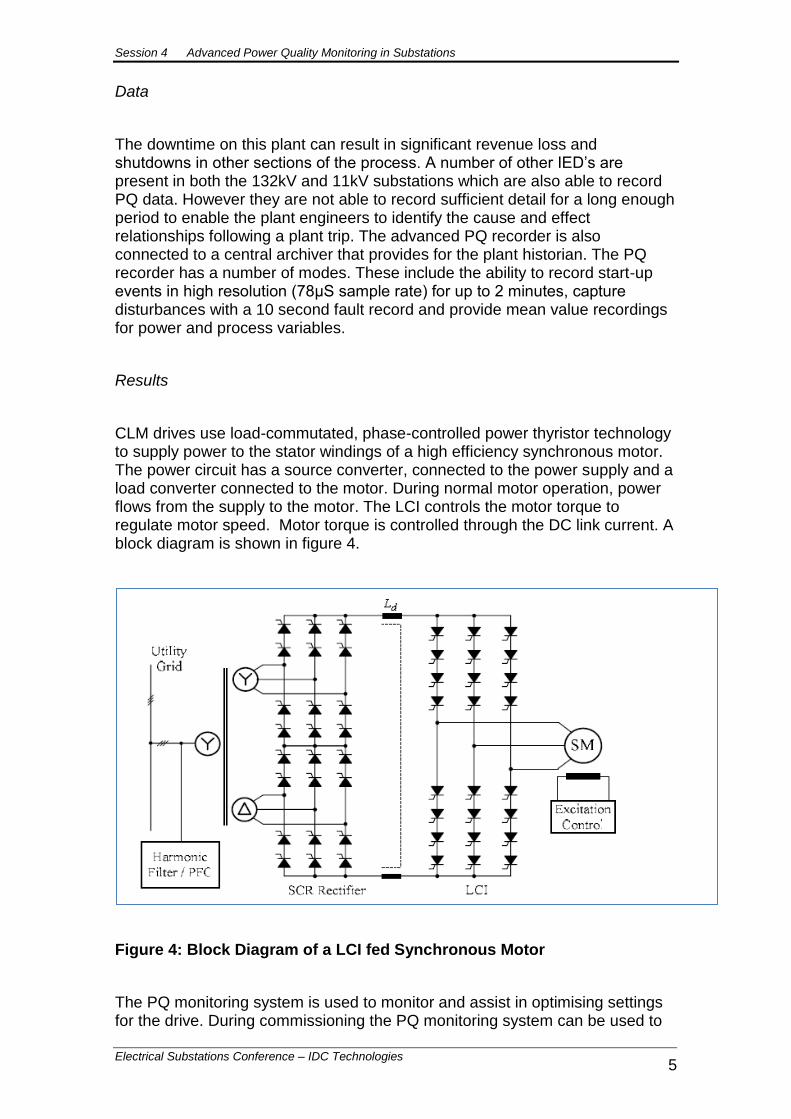
One of the requirements for the system was to ensure that any fault that may occur within the PQ monitoring system does not affect the plant signals. All plant signals are galvanically isolated with a common mode isolation of 1.5kV. The signal conditioners also have overload protection and anti-aliasing filters. All the equipment is of a modular plug-in construction which facilitates repairs. The data acquisition system uses the modular PXI open platform technology. A total of 32 high speed analog and 48 digital channels are available for each of the four main systems that are being monitored. Not all the channels are used which provides spare channels for future expansion. A picture of the 11kV Substation PQ data acquisition system is shown in figure 3.
Figure 3: 11kV Substation PQ Monitoring Equipment
Session 4 Advanced Power Quality Monitoring in Substations
Electrical Substations Conference – IDC Technologies 5
Data
The downtime on this plant can result in significant revenue loss and shutdowns in other sections of the process. A number of other IED’s are present in both the 132kV and 11kV substations which are also able to record PQ data. However they are not able to record sufficient detail for a long enough period to enable the plant engineers to identify the cause and effect relationships following a plant trip. The advanced PQ recorder is also connected to a central archiver that provides for the plant historian. The PQ recorder has a number of modes. These include the ability to record start-up events in high resolution (78μS sample rate) for up to 2 minutes, capture disturbances with a 10 second fault record and provide mean value recordings for power and process variables.
Results
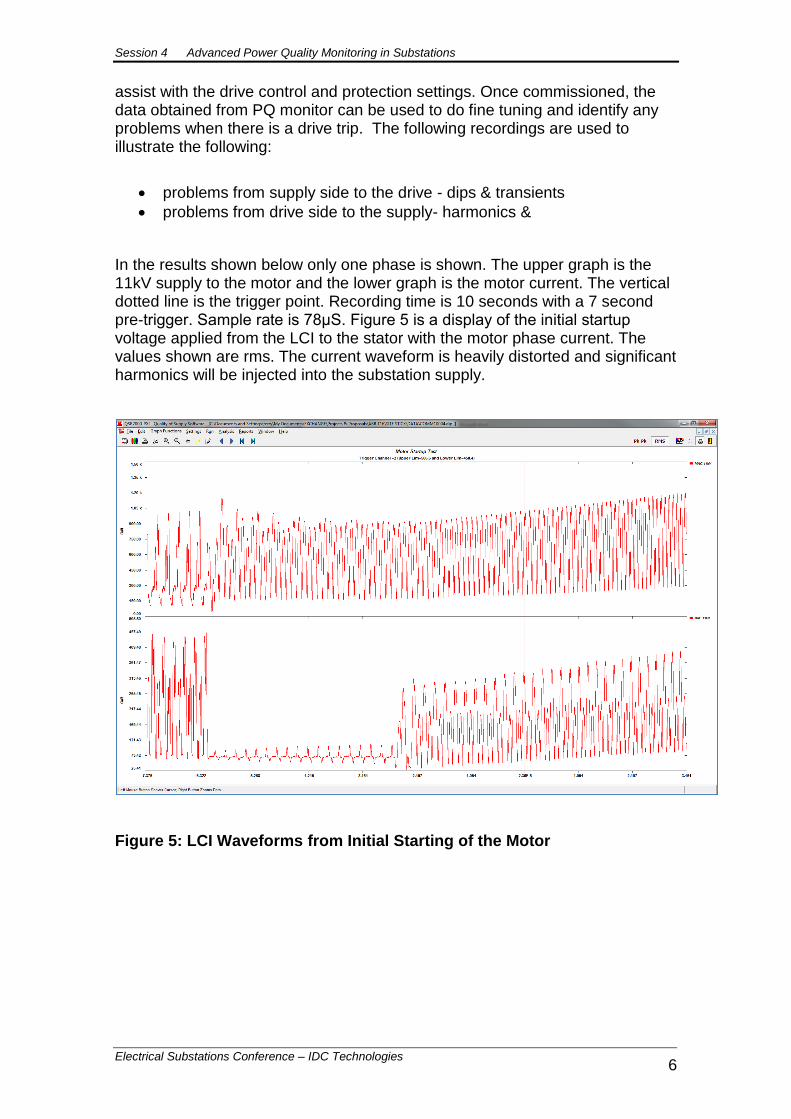
CLM drives use load-commutated, phase-controlled power thyristor technology to supply power to the stator windings of a high efficiency synchronous motor. The power circuit has a source converter, connected to the power supply and a load converter connected to the motor. During normal motor operation, power flows from the supply to the motor. The LCI controls the motor torque to regulate motor speed. Motor torque is controlled through the DC link current. A block diagram is shown in figure 4.
Figure 4: Block Diagram of a LCI fed Synchronous Motor
The PQ monitoring system is used to monitor and assist in optimising settings for the drive. During commissioning the PQ monitoring system can be used to
Session 4 Advanced Power Quality Monitoring in Substations
Electrical Substations Conference – IDC Technologies 6
assist with the drive control and protection settings. Once commissioned, the data obtained from PQ monitor can be used to do fine tuning and identify any problems when there is a drive trip. The following recordings are used to illustrate the following:
problems from supply side to the drive - dips & transients
problems from drive side to the supply- harmonics &
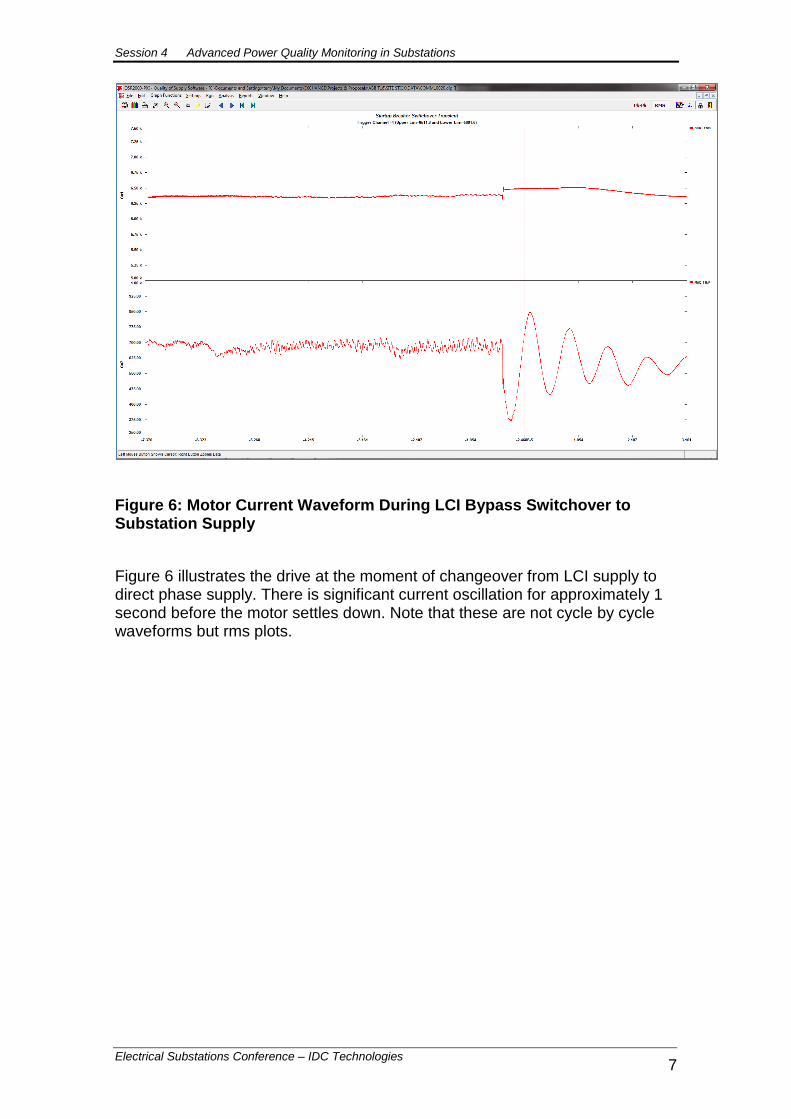
In the results shown below only one phase is shown. The upper graph is the 11kV supply to the motor and the lower graph is the motor current. The vertical dotted line is the trigger point. Recording time is 10 seconds with a 7 second pre-trigger. Sample rate is 78μS. Figure 5 is a display of the initial startup voltage applied from the LCI to the stator with the motor phase current. The values shown are rms. The current waveform is heavily distorted and significant harmonics will be injected into the substation supply.
Figure 5: LCI Waveforms from Initial Starting of the Motor
Session 4 Advanced Power Quality Monitoring in Substations
Electrical Substations Conference – IDC Technologies 7
Figure 6: Motor Current Waveform During LCI Bypass Switchover to Substation Supply
Figure 6 illustrates the drive at the moment of changeover from LCI supply to direct phase supply. There is significant current oscillation for approximately 1 second before the motor settles down. Note that these are not cycle by cycle waveforms but rms plots.
Session 4 Advanced Power Quality Monitoring in Substations
Electrical Substations Conference – IDC Technologies 8
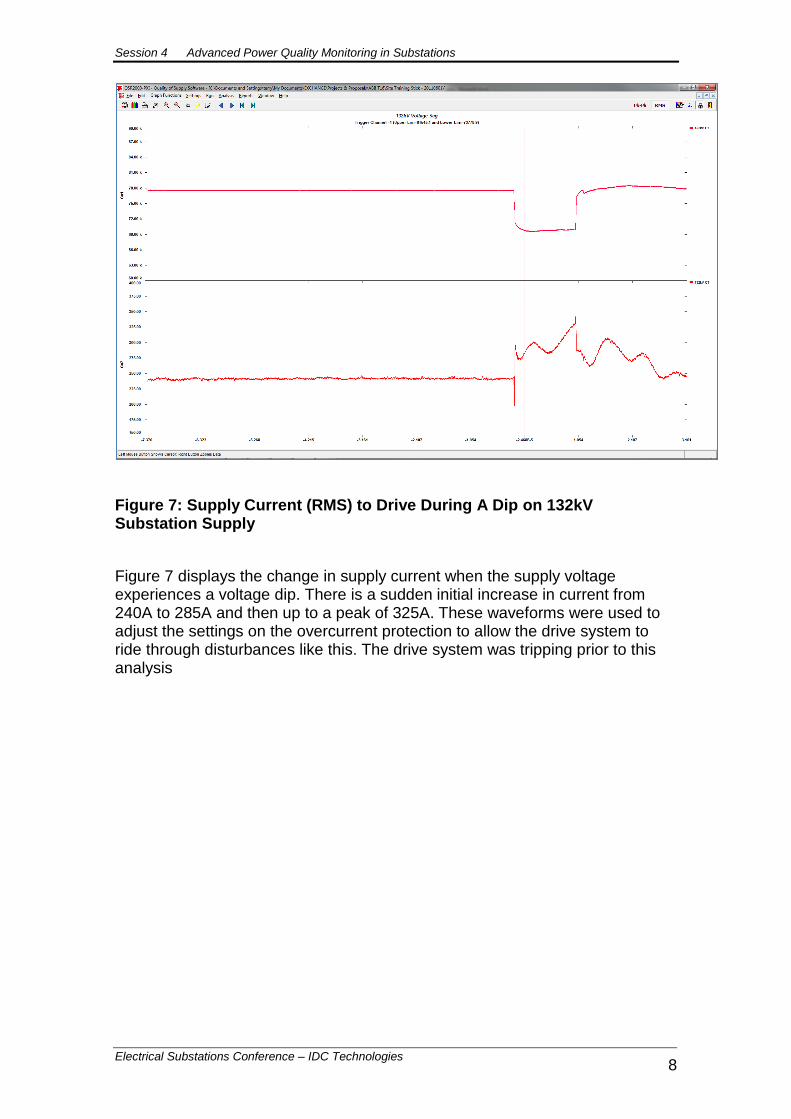
Figure 7: Supply Current (RMS) to Drive During A Dip on 132kV Substation Supply
Figure 7 displays the change in supply current when the supply voltage experiences a voltage dip. There is a sudden initial increase in current from 240A to 285A and then up to a peak of 325A. These waveforms were used to adjust the settings on the overcurrent protection to allow the drive system to ride through disturbances like this. The drive system was tripping prior to this analysis
Session 4 Advanced Power Quality Monitoring in Substations
Electrical Substations Conference – IDC Technologies 9
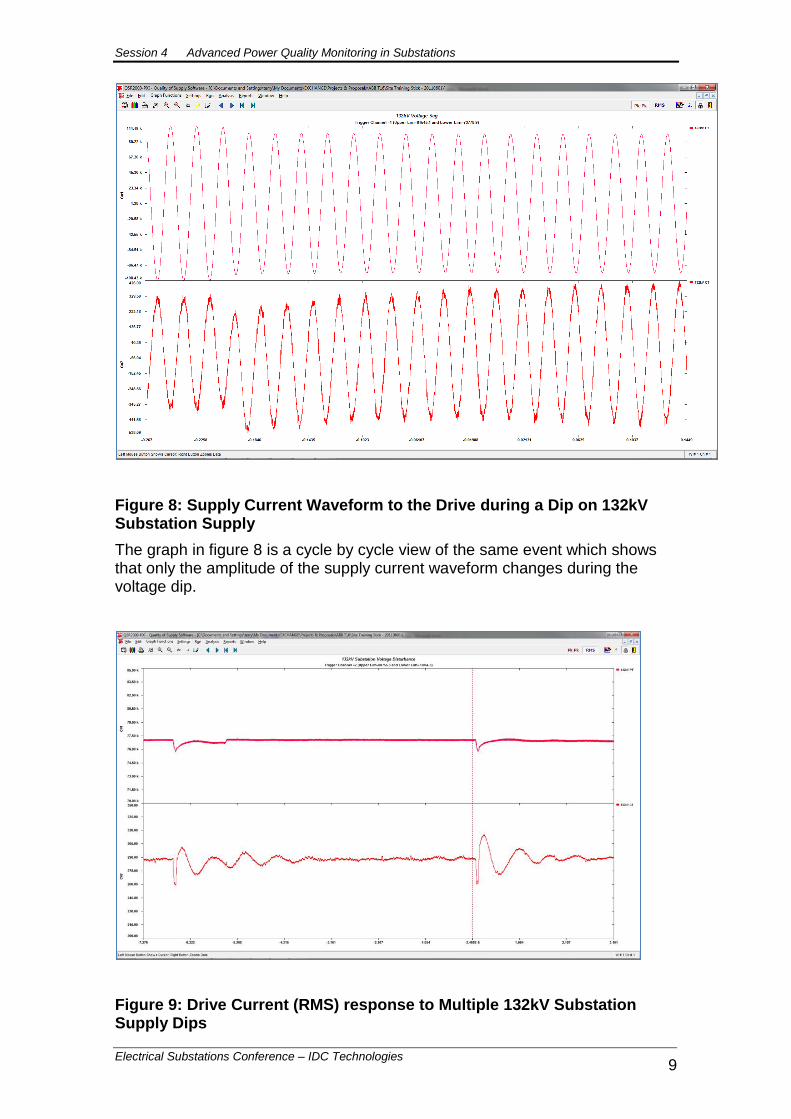
Figure 8: Supply Current Waveform to the Drive during a Dip on 132kV Substation Supply
The graph in figure 8 is a cycle by cycle view of the same event which shows that only the amplitude of the supply current waveform changes during the voltage dip.
Figure 9: Drive Current (RMS) response to Multiple 132kV Substation Supply Dips

Session 4 Advanced Power Quality Monitoring in Substations
Electrical Substations Conference – IDC Technologies 10
The ability of the drive to recover from a supply dip depends on the connected load, system inertia and the energy stored in the drive DC link. The graph in figure 9 illustrates the current oscillations and settling time in response to two supply dips approximately 6 seconds apart. The current oscillations settle in about 3 seconds. If the voltage dips were closer together than this the drive may trip. The drive control system can be tuned to ensure that the oscillations are damped.
The above graphs have illustrated transient or event based recordings. Advanced power quality monitoring also collects mean value graphs for PQ trends. The graph in figure 10 illustrates the change in RMS supply voltage at the 132kV intake substation over a period of 7 days. The variation in supply voltage is just over 1.5%. Alarms can be set in the PQ system to notify if the supply voltage changes by more than a preset percentage.
Figure 10: 132kV Substation Supply Voltage (10 minute mean value) Variation with Time
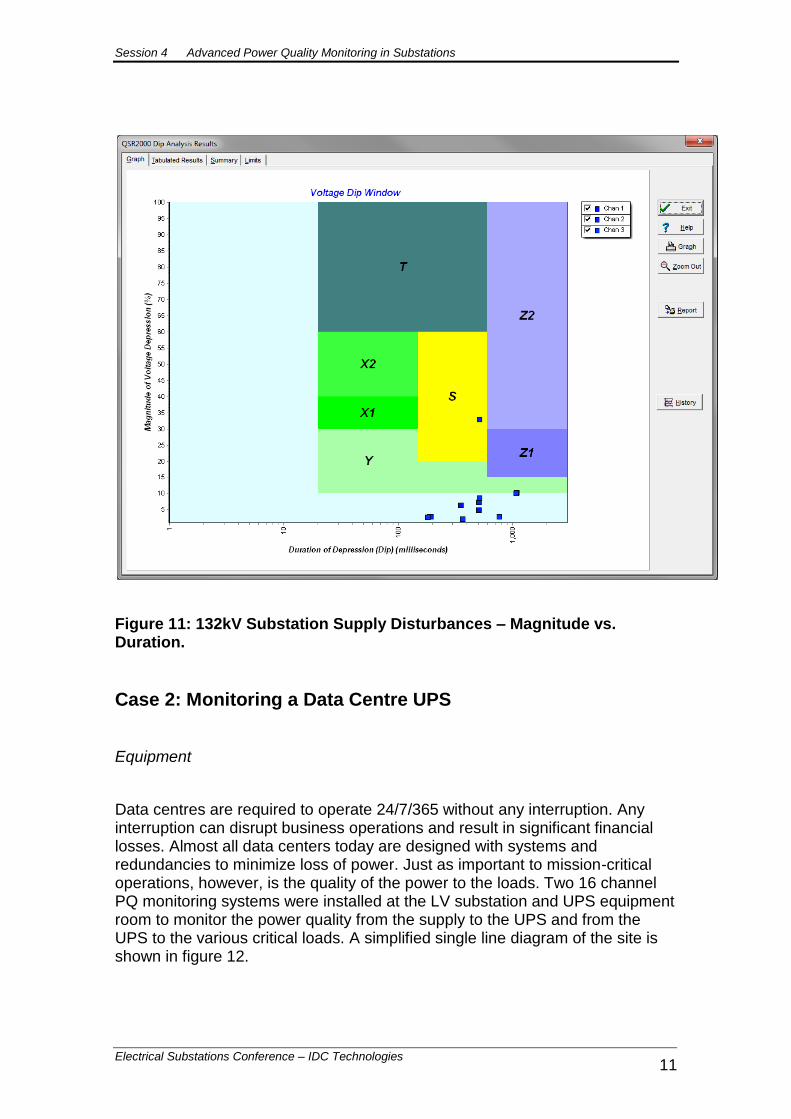
It is also useful to determine the number of supply disturbances (dips and surges) that are present on the supply and plot these in a magnitude – duration graph as shown in figure 11. The magnitude duration plot has minimum dip immunity tolerance zones as per the NRS048 [3] displayed. Based on the NRS document motor drive should be able to tolerate supply voltage disturbances up to 20% magnitude in the S and Z1 zones. The graph below indicates only one captured event that exceeded this for the time period under study.
Session 4 Advanced Power Quality Monitoring in Substations
Electrical Substations Conference – IDC Technologies 11
Figure 11: 132kV Substation Supply Disturbances – Magnitude vs. Duration.
Case 2: Monitoring a Data Centre UPS
Equipment
Data centres are required to operate 24/7/365 without any interruption. Any interruption can disrupt business operations and result in significant financial losses. Almost all data centers today are designed with systems and redundancies to minimize loss of power. Just as important to mission-critical operations, however, is the quality of the power to the loads. Two 16 channel PQ monitoring systems were installed at the LV substation and UPS equipment room to monitor the power quality from the supply to the UPS and from the UPS to the various critical loads. A simplified single line diagram of the site is shown in figure 12.
Session 4 Advanced Power Quality Monitoring in Substations
Electrical Substations Conference – IDC Technologies 12
UPS A UPS B
LV BUSBAR
CRITICAL LOADS
NON-CRITICALLOADS
UTILITY SUPPLY
STANDBYGENERATORS
AUTOMATIC CHANGEOVER
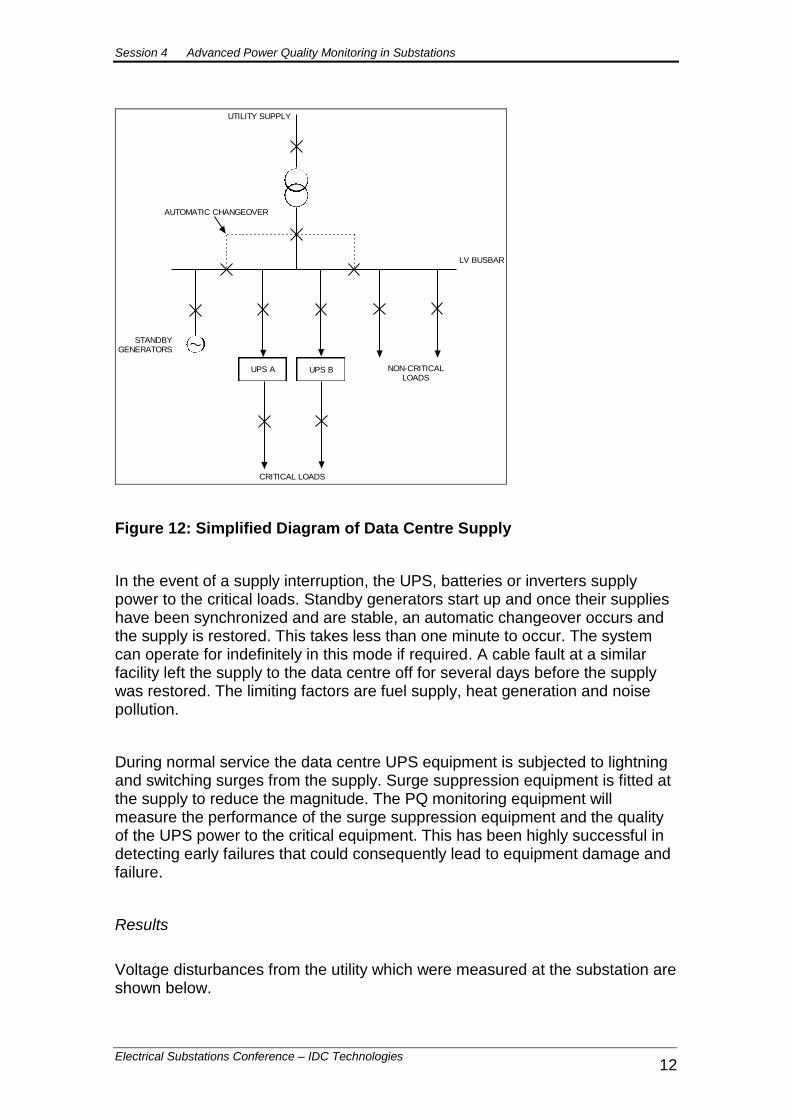
Figure 12: Simplified Diagram of Data Centre Supply
In the event of a supply interruption, the UPS, batteries or inverters supply power to the critical loads. Standby generators start up and once their supplies have been synchronized and are stable, an automatic changeover occurs and the supply is restored. This takes less than one minute to occur. The system can operate for indefinitely in this mode if required. A cable fault at a similar facility left the supply to the data centre off for several days before the supply was restored. The limiting factors are fuel supply, heat generation and noise pollution.
During normal service the data centre UPS equipment is subjected to lightning and switching surges from the supply. Surge suppression equipment is fitted at the supply to reduce the magnitude. The PQ monitoring equipment will measure the performance of the surge suppression equipment and the quality of the UPS power to the critical equipment. This has been highly successful in detecting early failures that could consequently lead to equipment damage and failure.
Results
Voltage disturbances from the utility which were measured at the substation are shown below.
Session 4 Advanced Power Quality Monitoring in Substations
Electrical Substations Conference – IDC Technologies 13
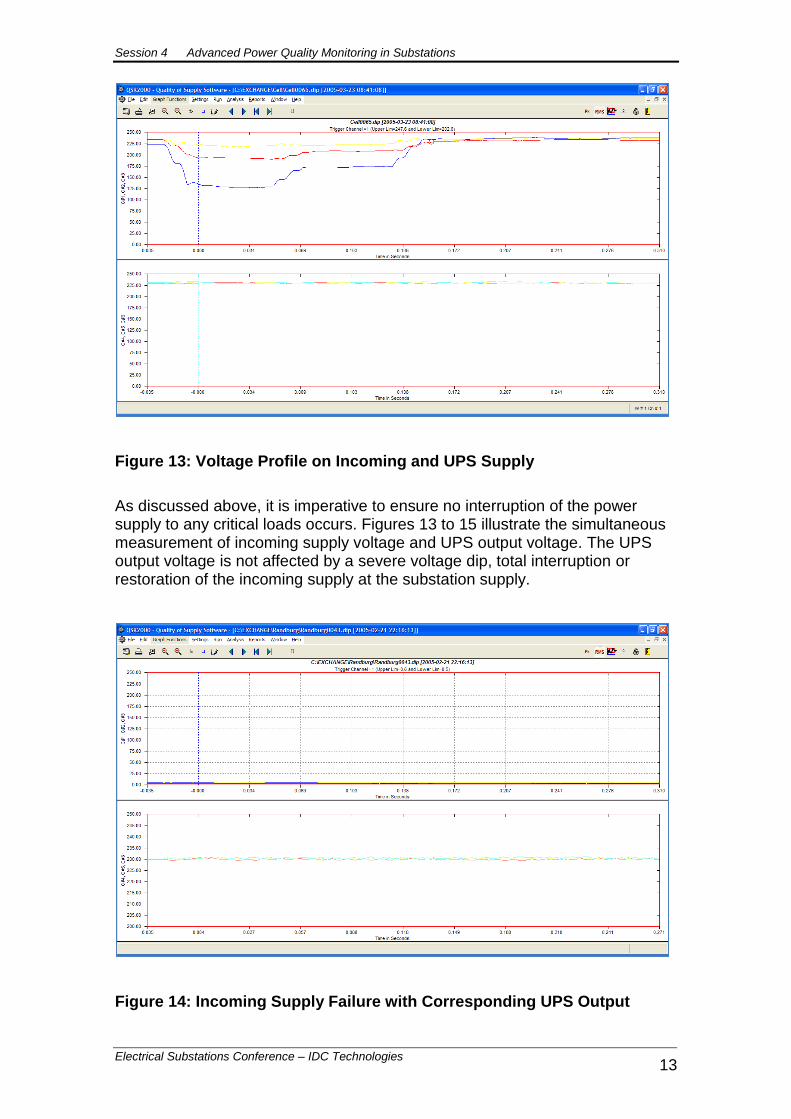
Figure 13: Voltage Profile on Incoming and UPS Supply
As discussed above, it is imperative to ensure no interruption of the power supply to any critical loads occurs. Figures 13 to 15 illustrate the simultaneous measurement of incoming supply voltage and UPS output voltage. The UPS output voltage is not affected by a severe voltage dip, total interruption or restoration of the incoming supply at the substation supply.
Figure 14: Incoming Supply Failure with Corresponding UPS Output
Session 4 Advanced Power Quality Monitoring in Substations
Electrical Substations Conference – IDC Technologies 14
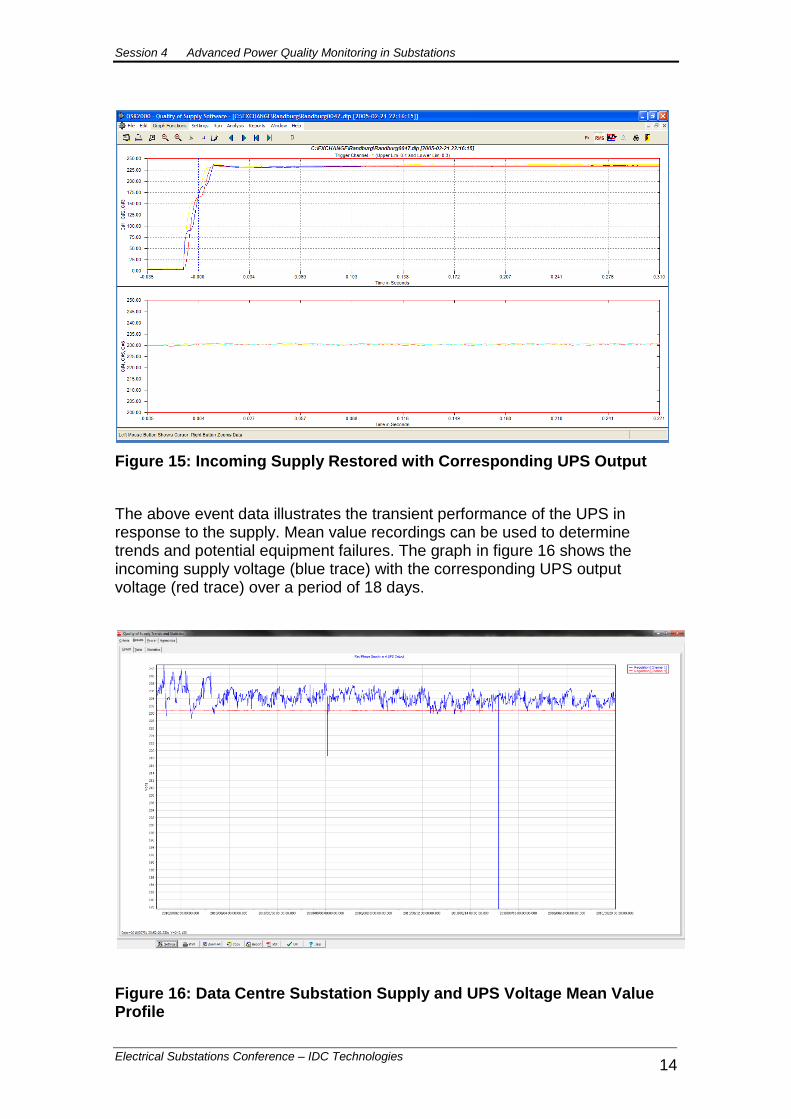
Figure 15: Incoming Supply Restored with Corresponding UPS Output
The above event data illustrates the transient performance of the UPS in response to the supply. Mean value recordings can be used to determine trends and potential equipment failures. The graph in figure 16 shows the incoming supply voltage (blue trace) with the corresponding UPS output voltage (red trace) over a period of 18 days.
Figure 16: Data Centre Substation Supply and UPS Voltage Mean Value Profile
Session 4 Advanced Power Quality Monitoring in Substations
Electrical Substations Conference – IDC Technologies 15
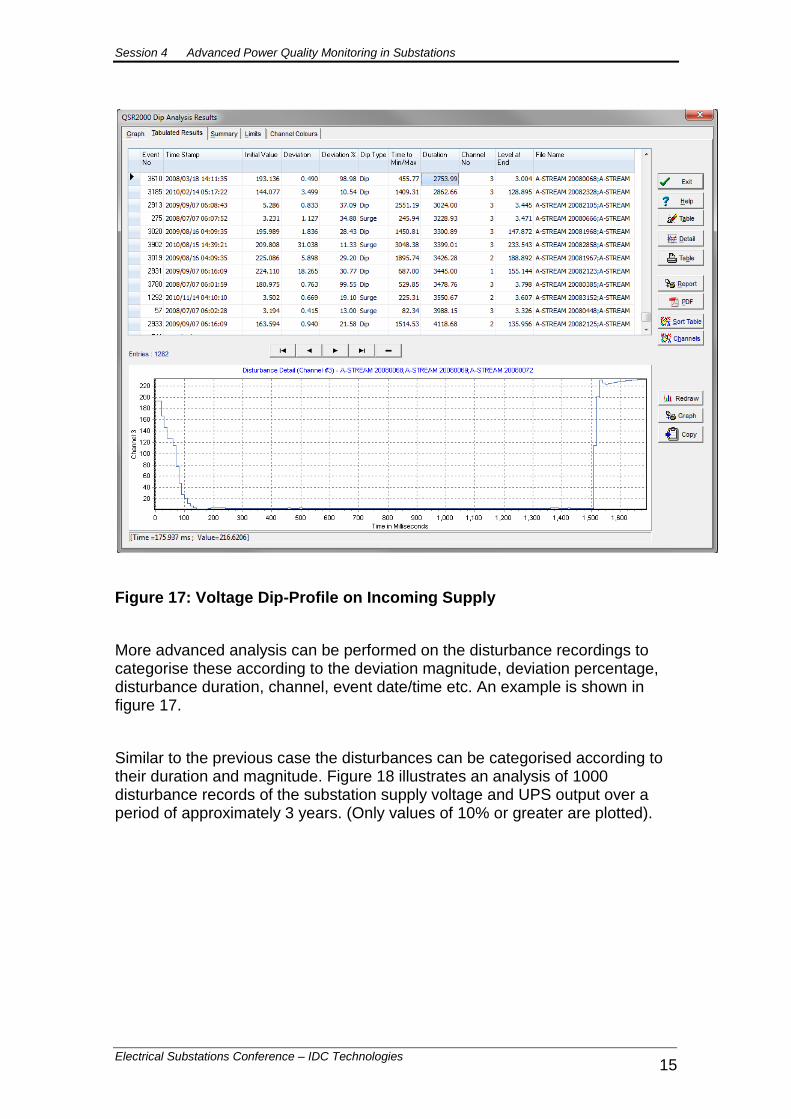
Figure 17: Voltage Dip-Profile on Incoming Supply
More advanced analysis can be performed on the disturbance recordings to categorise these according to the deviation magnitude, deviation percentage, disturbance duration, channel, event date/time etc. An example is shown in figure 17.
Similar to the previous case the disturbances can be categorised according to their duration and magnitude. Figure 18 illustrates an analysis of 1000 disturbance records of the substation supply voltage and UPS output over a period of approximately 3 years. (Only values of 10% or greater are plotted).
Session 4 Advanced Power Quality Monitoring in Substations
Electrical Substations Conference – IDC Technologies 16
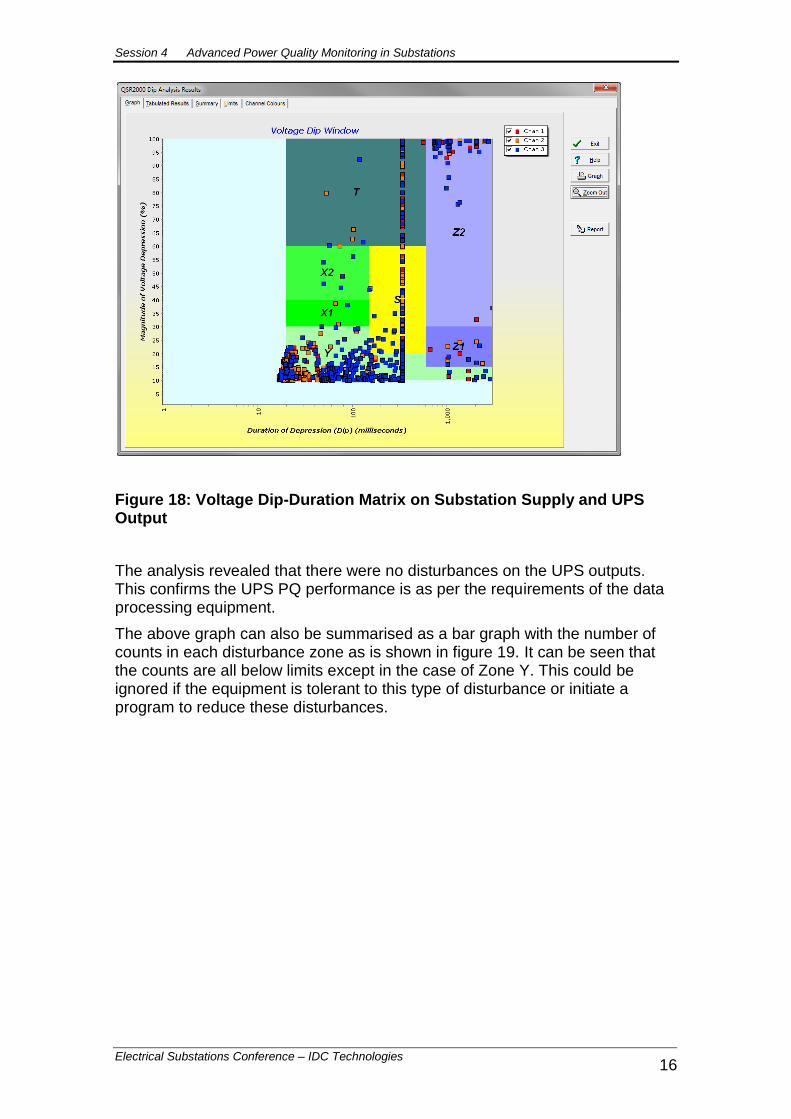
Figure 18: Voltage Dip-Duration Matrix on Substation Supply and UPS Output
The analysis revealed that there were no disturbances on the UPS outputs. This confirms the UPS PQ performance is as per the requirements of the data processing equipment.
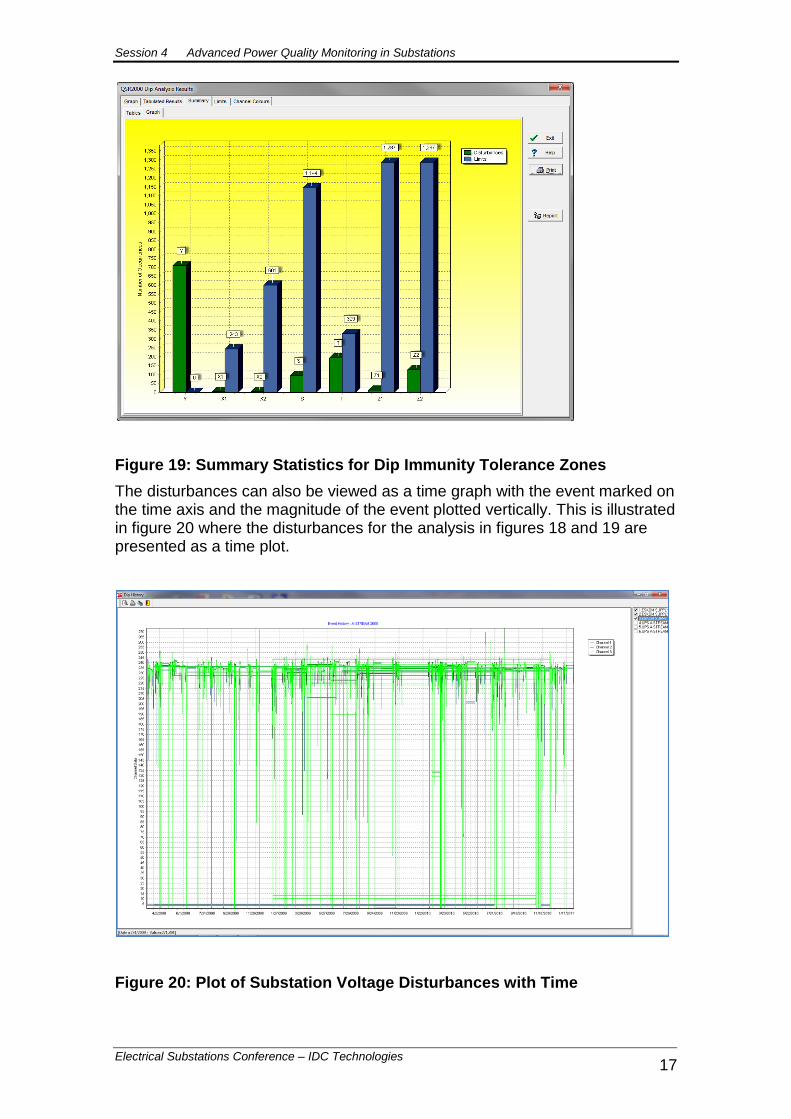
The above graph can also be summarised as a bar graph with the number of counts in each disturbance zone as is shown in figure 19. It can be seen that the counts are all below limits except in the case of Zone Y. This could be ignored if the equipment is tolerant to this type of disturbance or initiate a program to reduce these disturbances.
Session 4 Advanced Power Quality Monitoring in Substations
Electrical Substations Conference – IDC Technologies 17
Figure 19: Summary Statistics for Dip Immunity Tolerance Zones
The disturbances can also be viewed as a time graph with the event marked on the time axis and the magnitude of the event plotted vertically. This is illustrated in figure 20 where the disturbances for the analysis in figures 18 and 19 are presented as a time plot.
Figure 20: Plot of Substation Voltage Disturbances with Time
Session 4 Advanced Power Quality Monitoring in Substations
Electrical Substations Conference – IDC Technologies 18
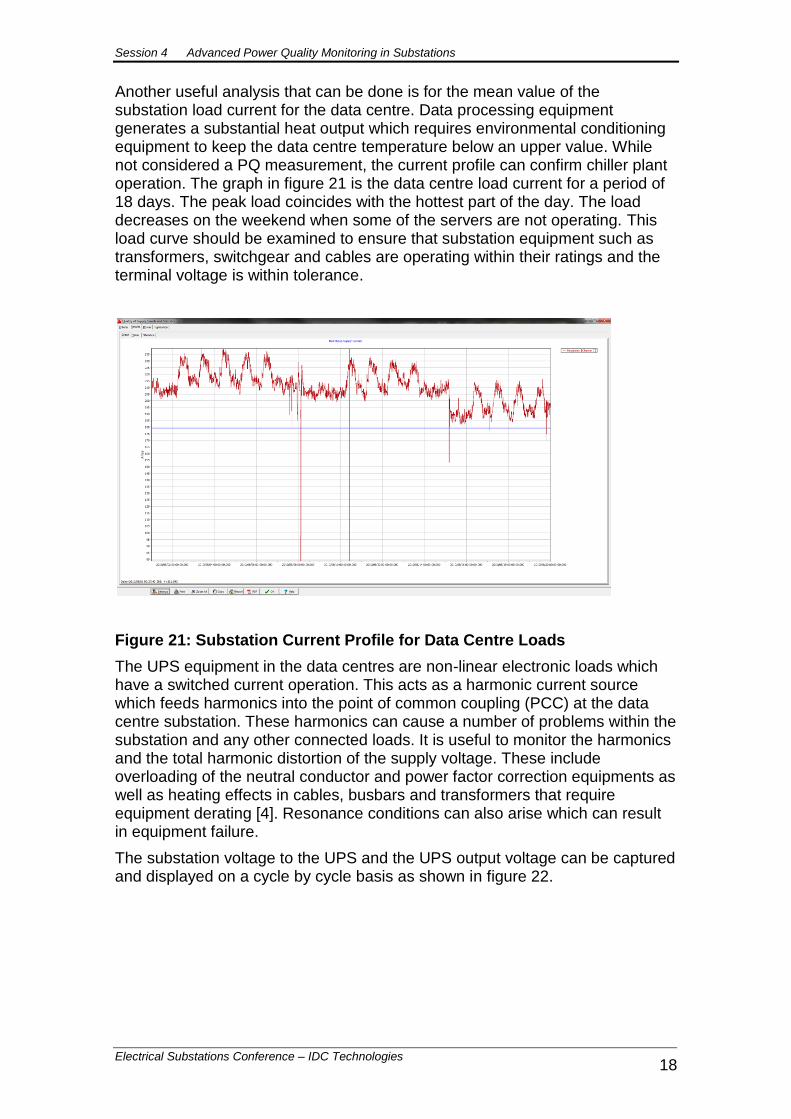
Another useful analysis that can be done is for the mean value of the substation load current for the data centre. Data processing equipment generates a substantial heat output which requires environmental conditioning equipment to keep the data centre temperature below an upper value. While not considered a PQ measurement, the current profile can confirm chiller plant operation. The graph in figure 21 is the data centre load current for a period of 18 days. The peak load coincides with the hottest part of the day. The load decreases on the weekend when some of the servers are not operating. This load curve should be examined to ensure that substation equipment such as transformers, switchgear and cables are operating within their ratings and the terminal voltage is within tolerance.
Figure 21: Substation Current Profile for Data Centre Loads
The UPS equipment in the data centres are non-linear electronic loads which have a switched current operation. This acts as a harmonic current source which feeds harmonics into the point of common coupling (PCC) at the data centre substation. These harmonics can cause a number of problems within the substation and any other connected loads. It is useful to monitor the harmonics and the total harmonic distortion of the supply voltage. These include overloading of the neutral conductor and power factor correction equipments as well as heating effects in cables, busbars and transformers that require equipment derating [4]. Resonance conditions can also arise which can result in equipment failure.
The substation voltage to the UPS and the UPS output voltage can be captured and displayed on a cycle by cycle basis as shown in figure 22.
Session 4 Advanced Power Quality Monitoring in Substations
Electrical Substations Conference – IDC Technologies 19
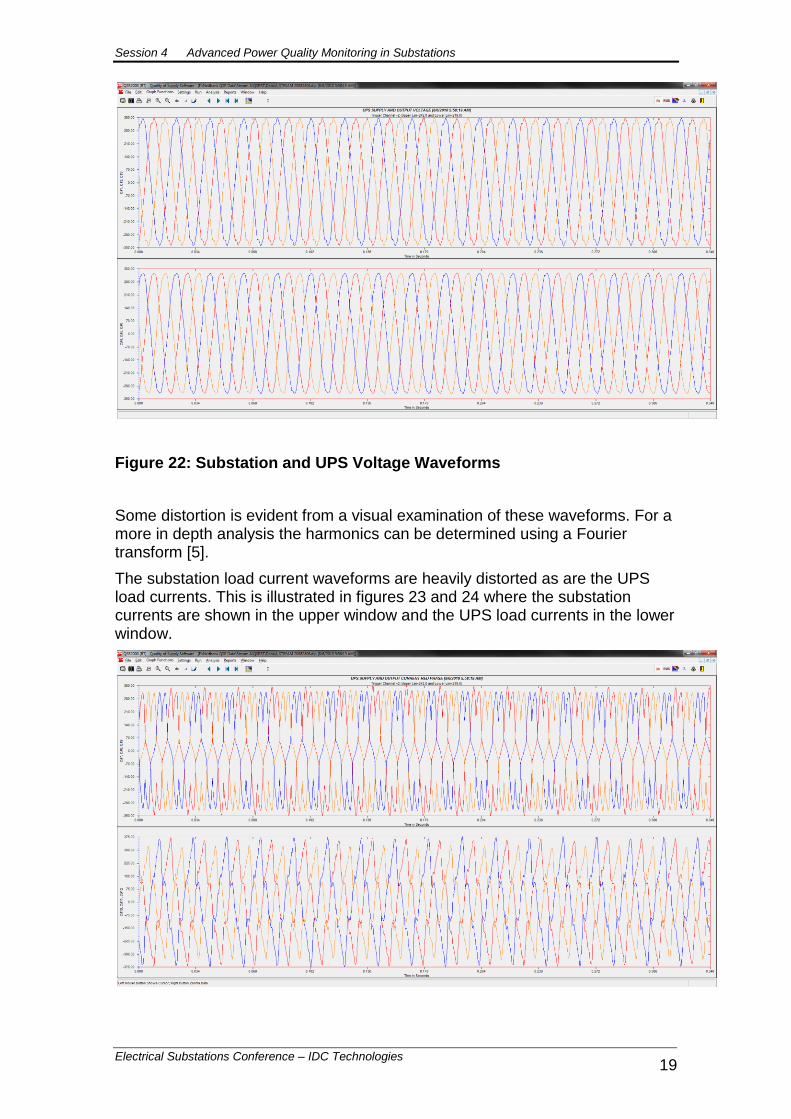
Figure 22: Substation and UPS Voltage Waveforms
Some distortion is evident from a visual examination of these waveforms. For a more in depth analysis the harmonics can be determined using a Fourier transform [5].
The substation load current waveforms are heavily distorted as are the UPS load currents. This is illustrated in figures 23 and 24 where the substation currents are shown in the upper window and the UPS load currents in the lower window.
Session 4 Advanced Power Quality Monitoring in Substations
Electrical Substations Conference – IDC Technologies 20
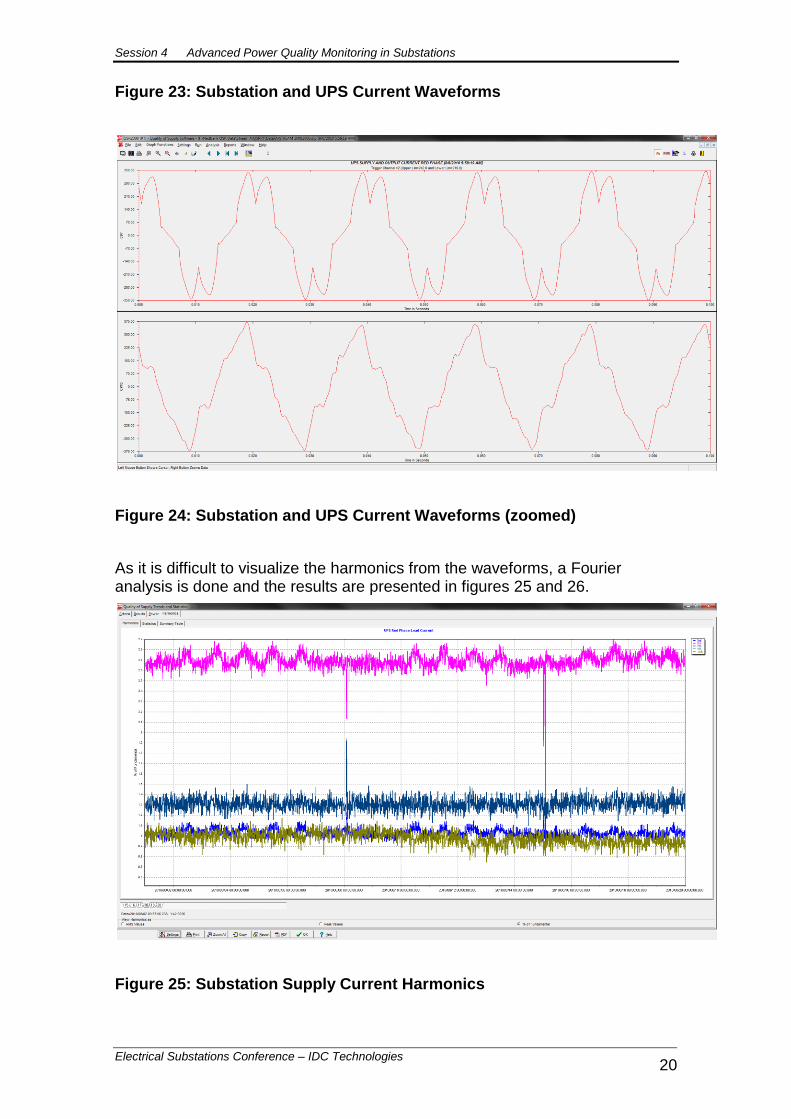
Figure 23: Substation and UPS Current Waveforms
Figure 24: Substation and UPS Current Waveforms (zoomed)
As it is difficult to visualize the harmonics from the waveforms, a Fourier analysis is done and the results are presented in figures 25 and 26.
Figure 25: Substation Supply Current Harmonics
Session 4 Advanced Power Quality Monitoring in Substations
Electrical Substations Conference – IDC Technologies 21
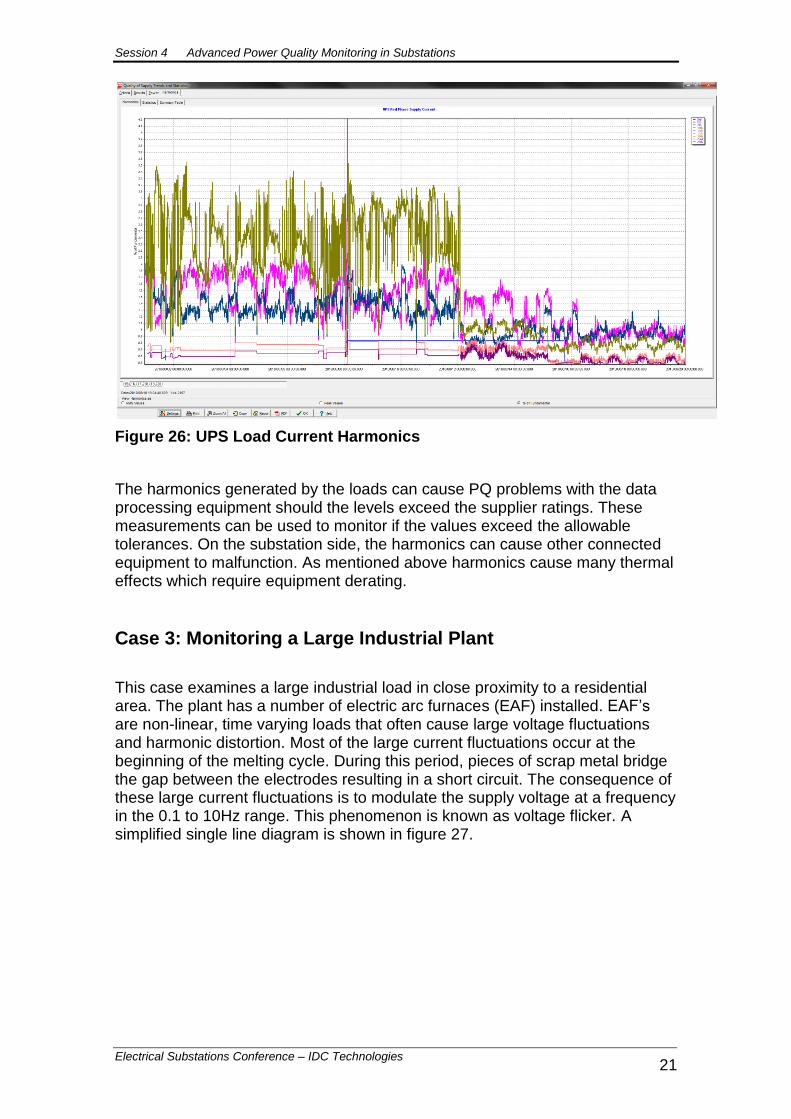
Figure 26: UPS Load Current Harmonics
The harmonics generated by the loads can cause PQ problems with the data processing equipment should the levels exceed the supplier ratings. These measurements can be used to monitor if the values exceed the allowable tolerances. On the substation side, the harmonics can cause other connected equipment to malfunction. As mentioned above harmonics cause many thermal effects which require equipment derating.
Case 3: Monitoring a Large Industrial Plant
This case examines a large industrial load in close proximity to a residential area. The plant has a number of electric arc furnaces (EAF) installed. EAF’s are non-linear, time varying loads that often cause large voltage fluctuations and harmonic distortion. Most of the large current fluctuations occur at the beginning of the melting cycle. During this period, pieces of scrap metal bridge the gap between the electrodes resulting in a short circuit. The consequence of these large current fluctuations is to modulate the supply voltage at a frequency in the 0.1 to 10Hz range. This phenomenon is known as voltage flicker. A simplified single line diagram is shown in figure 27.
Session 4 Advanced Power Quality Monitoring in Substations
Electrical Substations Conference – IDC Technologies 22
INCOMING 132kV UTILITY SUPPLY
33kV PLANT SUPPLY
PLANT LOADS (EAF)
SVC
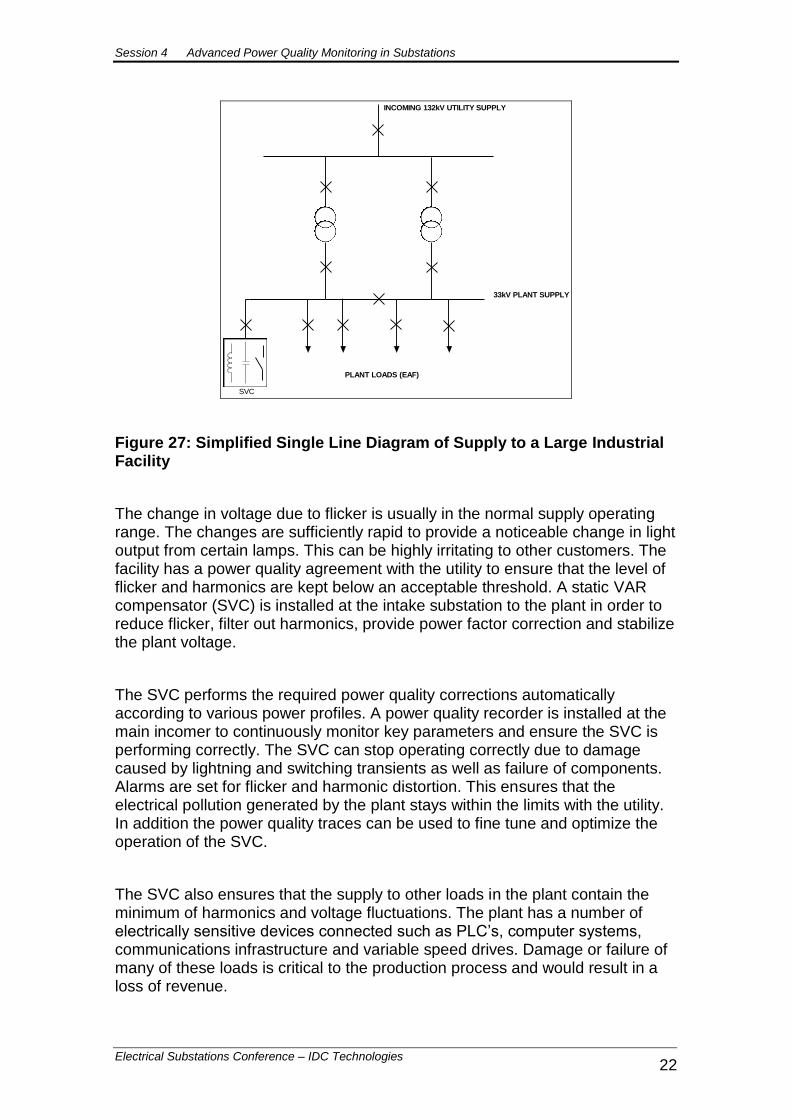
Figure 27: Simplified Single Line Diagram of Supply to a Large Industrial Facility
The change in voltage due to flicker is usually in the normal supply operating range. The changes are sufficiently rapid to provide a noticeable change in light output from certain lamps. This can be highly irritating to other customers. The facility has a power quality agreement with the utility to ensure that the level of flicker and harmonics are kept below an acceptable threshold. A static VAR compensator (SVC) is installed at the intake substation to the plant in order to reduce flicker, filter out harmonics, provide power factor correction and stabilize the plant voltage.
The SVC performs the required power quality corrections automatically according to various power profiles. A power quality recorder is installed at the main incomer to continuously monitor key parameters and ensure the SVC is performing correctly. The SVC can stop operating correctly due to damage caused by lightning and switching transients as well as failure of components. Alarms are set for flicker and harmonic distortion. This ensures that the electrical pollution generated by the plant stays within the limits with the utility. In addition the power quality traces can be used to fine tune and optimize the operation of the SVC.
The SVC also ensures that the supply to other loads in the plant contain the minimum of harmonics and voltage fluctuations. The plant has a number of electrically sensitive devices connected such as PLC’s, computer systems, communications infrastructure and variable speed drives. Damage or failure of many of these loads is critical to the production process and would result in a loss of revenue.
Session 4 Advanced Power Quality Monitoring in Substations
Electrical Substations Conference – IDC Technologies 23
Some examples of the measurements make at the main substation are shown below.
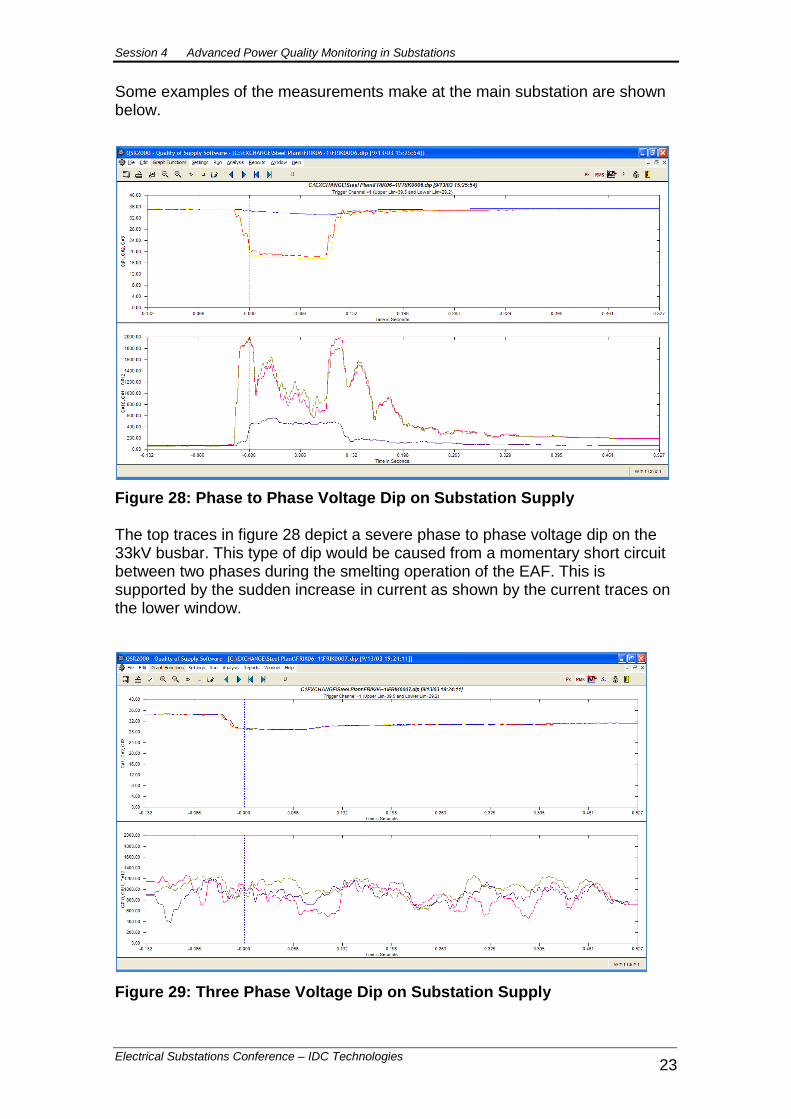
Figure 28: Phase to Phase Voltage Dip on Substation Supply
The top traces in figure 28 depict a severe phase to phase voltage dip on the 33kV busbar. This type of dip would be caused from a momentary short circuit between two phases during the smelting operation of the EAF. This is supported by the sudden increase in current as shown by the current traces on the lower window.
Figure 29: Three Phase Voltage Dip on Substation Supply
Session 4 Advanced Power Quality Monitoring in Substations
Electrical Substations Conference – IDC Technologies 24
The voltage dip in figure 29 is present on all 3 phases. There is no significant increase in phase current. This type of disturbance could be caused by a drop in the incoming supply voltage to the plant.
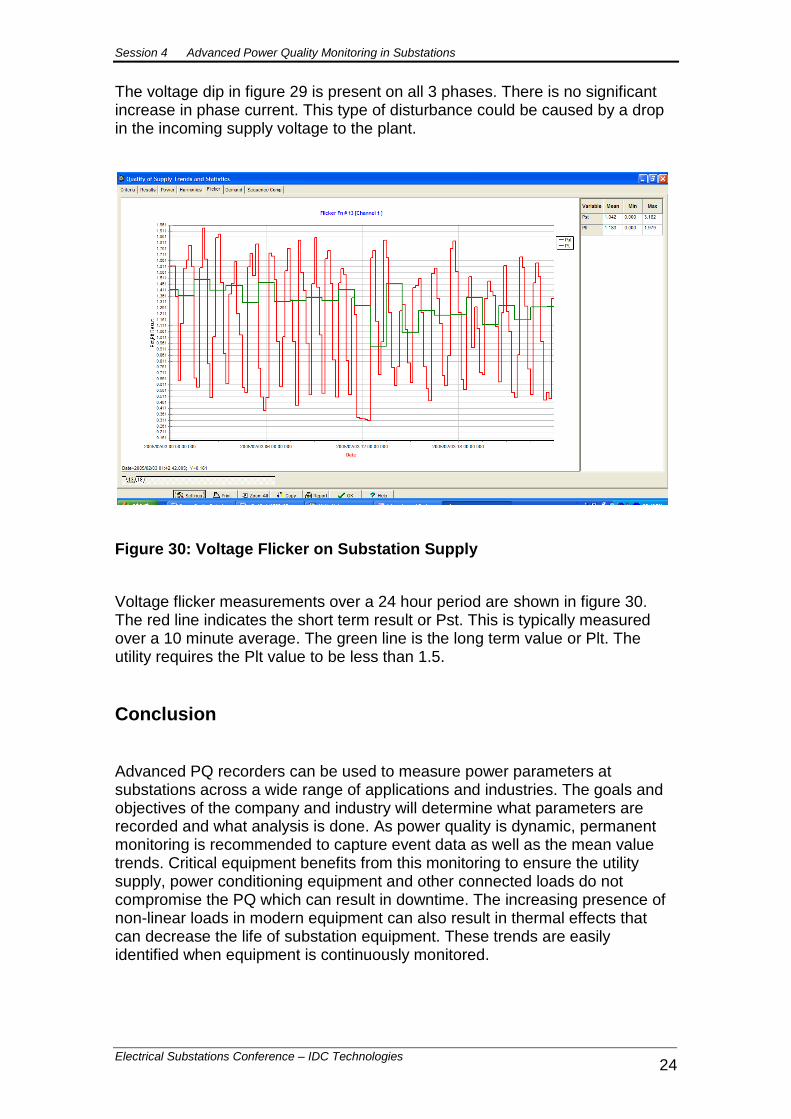
Figure 30: Voltage Flicker on Substation Supply
Voltage flicker measurements over a 24 hour period are shown in figure 30. The red line indicates the short term result or Pst. This is typically measured over a 10 minute average. The green line is the long term value or Plt. The utility requires the Plt value to be less than 1.5.
Conclusion
Advanced PQ recorders can be used to measure power parameters at substations across a wide range of applications and industries. The goals and objectives of the company and industry will determine what parameters are recorded and what analysis is done. As power quality is dynamic, permanent monitoring is recommended to capture event data as well as the mean value trends. Critical equipment benefits from this monitoring to ensure the utility supply, power conditioning equipment and other connected loads do not compromise the PQ which can result in downtime. The increasing presence of non-linear loads in modern equipment can also result in thermal effects that can decrease the life of substation equipment. These trends are easily identified when equipment is continuously monitored.
Session 4 Advanced Power Quality Monitoring in Substations
Electrical Substations Conference – IDC Technologies 25
References
[1] Development of a Plant Health Index for Eskom Distribution Substations, Elton Brand, Ulrich Minnaar and Wilfred Fritz
[2] Understanding the Cost of Power Interruptions to U.S. Electricity Consumers, Kristina Hamachi LaCommare and Joseph H. Eto, LBNL, 2004
[3] SABS NRS Project: NRS 048-2 Edition 2
[4] Electrical Power Systems Quality, Dugan et al, 2nd Ed, McGraw Hill 2002
[5] QSR2000 Power Quality Recorder Users Manual, TLC Engineering Solutions, 2010
Contact details
For further information, contact Terry Cousins, Director, TLC Engineering Solutions on 011 463 3860 or [email protected]