Embed Size (px)
Citation preview

Eastern Association for the Surgery of Trauma 633 N. Saint Clair Street, Ste 2600
Chicago, IL 60611 Ph: 312-202-5508 Fax: 312-202-5064
Email: [email protected] Web: www.east.org
Eastern Association for the Surgery of Trauma
Advanced Practitioners in Trauma Workshop
January 10, 2012
Disney’s Contemporary Resort Lake Buena Vista, Florida
Workshop Faculty: William Hoff, MD – Workshop Director
Corinna Sicoutris, CRNP – Workshop Director Riad Cachecho, MD, MBA
Forrest Fernandez, MD John Gillard, PA-C
Ruth Kleinpell, RN, PhD, ACNP, CCRN John Osborn, MSc
1

©2011 MFMER | slide‐1
EAST AP Workshop
Fundamentals of Health Care Economics
John B. Osborn, M.Sc.AdministratorMayo Clinic Trauma Centers
©2011 MFMER | slide‐2
Objectives
• Describe supply & demand as it relates to health care services
• Define the current health care market
• Understand how health care is currently financed• Define basic concepts: e.g., direct costs, indirect costs, margin, etc.
• Discuss role of the individual provider in optimizing financial outcomes
©2011 MFMER | slide‐3
Basic Concepts in Health Economics
Or, the dismal science gets admitted
2

©2011 MFMER | slide‐4
Microeconomics 101
©2011 MFMER | slide‐5
Health Economics, Brutally Summarized
• I enjoy good health, and I want my health to be as good as possible for as long as possible
• I start life with a finite stock of health. Over time, my stock of good health naturally decreases.
• Medical care can increase my stock.
• My demand for medical care is based upon my desire for good health
Grossly simplified from Grossman (1972), J Pol Econ 80:2** not for the faint of heart
©2011 MFMER | slide‐6
Health Economics, Brutally Summarized
Health Maintaining
Health Improving
Health Saving
Medical Care
DEMAND SUPPLY
3
©2011 MFMER | slide‐7
Microeconomics 201
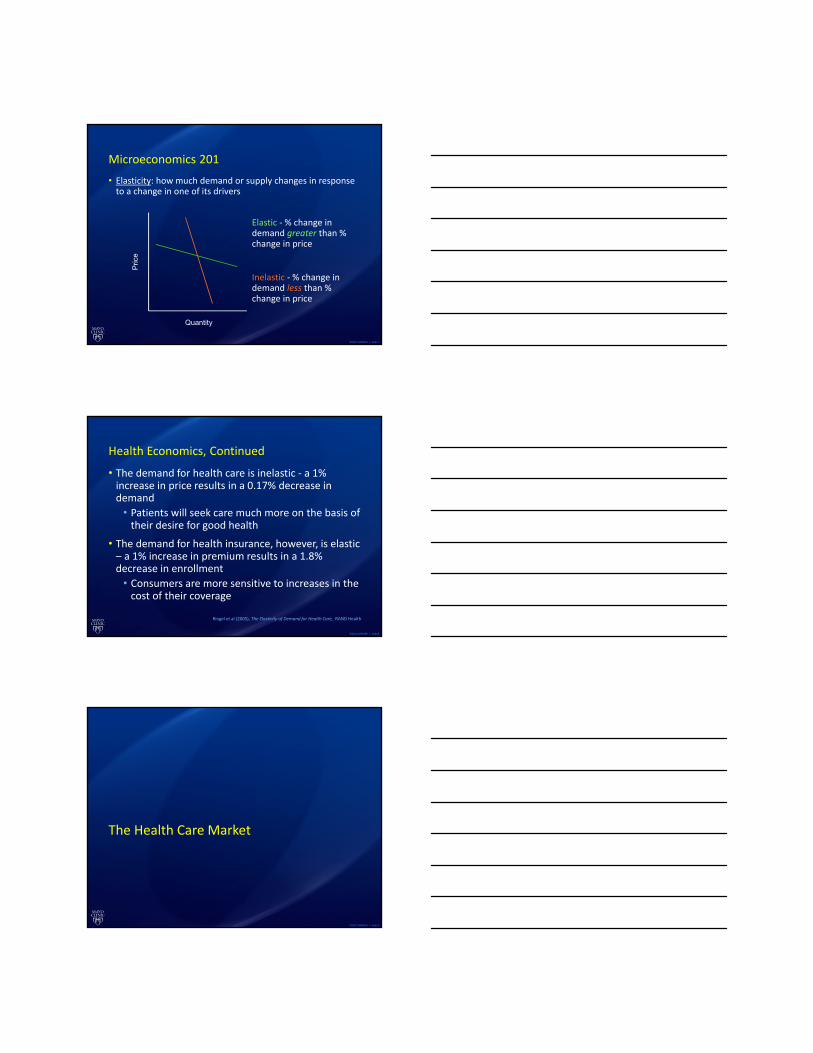
• Elasticity: how much demand or supply changes in response to a change in one of its drivers
Elastic ‐ % change in demand greater than % change in price
Inelastic ‐ % change in demand less than % change in price
Pric
e
Quantity
©2011 MFMER | slide‐8
Health Economics, Continued
• The demand for health care is inelastic ‐ a 1% increase in price results in a 0.17% decrease in demand
• Patients will seek care much more on the basis of their desire for good health
• The demand for health insurance, however, is elastic – a 1% increase in premium results in a 1.8% decrease in enrollment
• Consumers are more sensitive to increases in the cost of their coverage
Ringel et al (2005), The Elasticity of Demand for Health Care, RAND Health
©2011 MFMER | slide‐9
The Health Care Market
4
©2011 MFMER | slide‐10
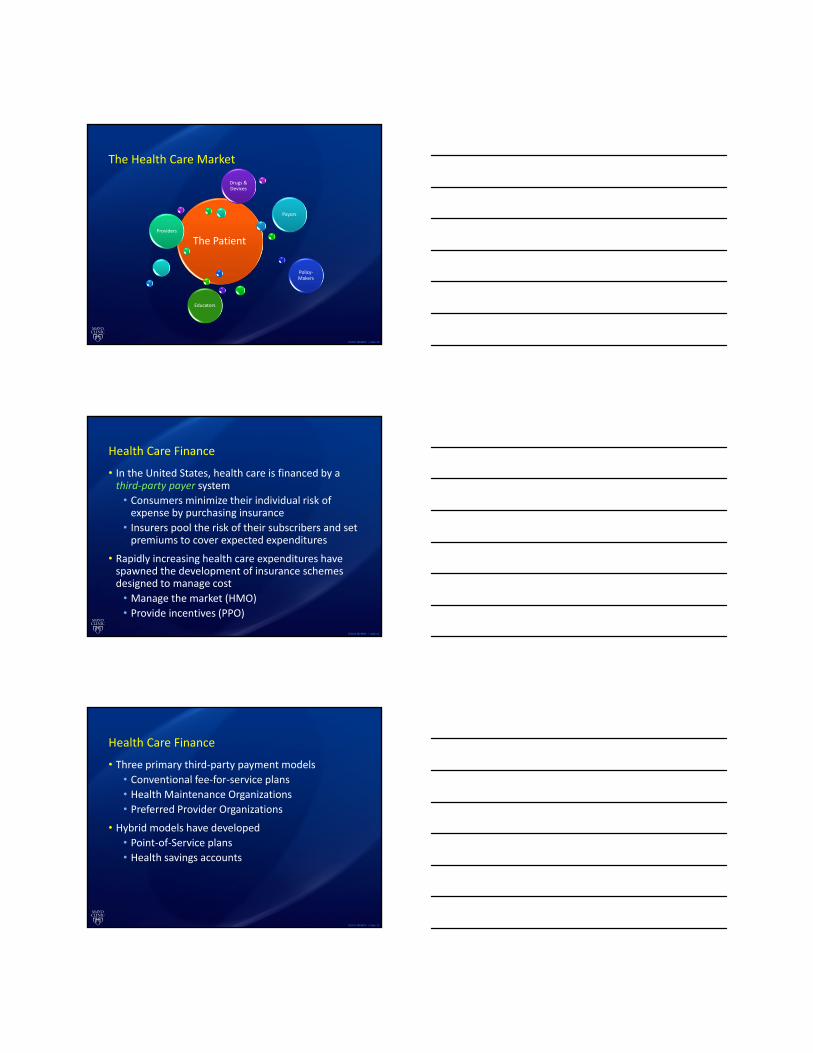
The Health Care Market
The PatientProviders
Payors
Policy‐Makers
Educators
Drugs & Devices
©2011 MFMER | slide‐11
Health Care Finance
• In the United States, health care is financed by a third‐party payer system
• Consumers minimize their individual risk of expense by purchasing insurance
• Insurers pool the risk of their subscribers and set premiums to cover expected expenditures
• Rapidly increasing health care expenditures have spawned the development of insurance schemes designed to manage cost
• Manage the market (HMO)
• Provide incentives (PPO)
©2011 MFMER | slide‐12
Health Care Finance
• Three primary third‐party payment models
• Conventional fee‐for‐service plans• Health Maintenance Organizations
• Preferred Provider Organizations• Hybrid models have developed
• Point‐of‐Service plans• Health savings accounts
5

©2011 MFMER | slide‐13
Health Insurance Options
• Conventional Fee‐for‐Service (FFS) Plan• Providers reimbursed for services provided, at contracted levels
• Beneficiaries choose provider• May or may not include cost‐sharing
• Health Maintenance Organization (HMO)
• Prepaid, fixed‐fee health coverage• Providers are employed or contracted
• Beneficiaries receive all care “in‐network”
©2011 MFMER | slide‐14
Health Insurance Options
• Preferred‐Provider Organization (PPO)• Fee‐for‐service coverage• Providers agree to contractual discounts• “Non‐network” care is subject to greater cost‐sharing by beneficiary
• Point‐of‐Service (POS) Plan• Either pre‐paid or fee‐for‐service• Beneficiaries designate their own “primary provider” from among “participating” providers
• Greater out‐of‐pocket expense for care from “non‐participating” providers
©2011 MFMER | slide‐15
Health Insurance Options
• High‐Deductible Health Plans with Savings Option (HDHP/SO)
• Deductible at least $1,000• Eligible for Health Savings Account (HSA) or Health Reimbursement Arrangement (HRA)
• HSA: beneficiary‐funded, portable• HRA: employer‐funded, tied to employment
• Emerging product in past few years
6

©2011 MFMER | slide‐16
Health Insurance Options
• Insurance Terminology• Premium
• Annual payment for coverage under plan• Deductible
• Annual out‐of‐pocket expense before coverage benefits begin
• Co‐payment• Fixed out‐of‐pocket cost for certain covered services
• Co‐Insurance• Out‐of‐pocket cost for certain covered services, at a fixed percentage of the charge
Health Insurance Coverage in the U.S., 2010
Uninsured16%
Medicaid 17%
Medicare12%Private Non-
Group5%
Employer-Sponsored Insurance
49%
* Medicaid also includes other public programs: CHIP, other state programs, military-related coverage. Numbers may not add to 100 due to rounding.SOURCE: KCMU/Urban Institute analysis of 2011 ASEC Supplement to the CPS.
Total = 305.2 million
Health Insurance Coverage ofthe Nonelderly Population, 2010
266.0 Million
SOURCE: KCMU/Urban Institute analysis of 2011 ASEC Supplement to the CPS.
Private Non-group 5.5%
7

Distribution of Health Plan Enrollment for Covered Workers, by Plan Type, 1988-2011
* Distribution is statistically different from the previous year shown (p<.05). No statistical tests were conducted for years prior to 1999. No statistical tests are conducted between 2005 and 2006 due to the addition of HDHP/SO as a new plan type in 2006.
Note: Information was not obtained for POS plans in 1988. A portion of the change in plan type enrollment for 2005 is likely attributable to incorporating more recent Census Bureau estimates of the number of state and local government workers and removing federal workers from the weights. See the Survey Design and Methods section from the 2005 Kaiser/HRET Survey of Employer-Sponsored Health Benefits for additional information.
Source: Kaiser/HRET Survey of Employer-Sponsored Health Benefits, 1999-2011; KPMG Survey of Employer-Sponsored Health Benefits, 1993, 1996; The Health Insurance Association of America (HIAA), 1988.
1%
1%
1%
1%
Percentage of All Firms Offering Health Benefits, 1999-2011
*Estimate is statistically different from estimate for the previous year shown (p<.05).
Note: Estimates presented in this exhibit are based on the sample of both firms that completed the entire survey and those that answered just one question about whether they offer health benefits. The percentage of firms offering health benefits is largely driven by small firms. The large increase in 2010 was primarily driven by a 12 percentage point increase in offering among firms with 3 to 9 workers. In 2011, 48% of firms with 3 to 9 employees offer health benefits, a level more consistent with levels from recent years other than 2010. The overall 2011 offer rate is consistent with the long term trend, indicating that the high 2010 offer rate may be an aberration.
Source: Kaiser/HRET Survey of Employer-Sponsored Health Benefits, 1999-2011.
Single Coverage Family Coverage
Average Annual Worker Premium Contributions and Total Premiums for Covered Workers, Single and Family Coverage, by
Firm Size, 2011
* Estimates are statistically different between All Small Firms and All Large Firms (p<.05).
Source: Kaiser/HRET Survey of Employer-Sponsored Health Benefits, 2011.
8

Average Annual Premiums for Single and Family Coverage, 1999-2011
* Estimate is statistically different from estimate for the previous year shown (p<.05).
Source: Kaiser/HRET Survey of Employer-Sponsored Health Benefits, 1999-2011.
19.1 20.5 22.825.5 28.2
31.0 33.2 34.3 35.8 36.3 37.0
2.23.0
2.93.3
4.45.4
6.7 7.0 7.3 7.5 7.6 8.0
37.9 38.5 39.0
1966 1970 1975 1980 1985 1990 1995 2000 2005 2006 2007 2008 2009 2010
Nonelderly Disabled (Under Age 65)
Elderly (Age 65 and Older)
Medicare Enrollment, 1966-2010
NOTES: Numbers may not sum to total due to rounding. People with disabilities under age 65 were not eligible for Medicare prior to 1972.SOURCE: Centers for Medicare & Medicaid Services, Medicare Enrollment: Hospital Insurance and/or Supplemental Medical Insurance Programs for Total, Fee-for-Service and Managed Care Enrollees as of July 1, 2008: Selected Calendar Years 1966-2008; 2009-2010, HHS Budget in Brief, FY2011.
25.028.5
31.134.2
37.639.6
43.342.5Number in millions:44.0 45.4
20.519.1
46.1 47.0
Medicare Beneficiaries as a Percent of State Populations, 2010
NOTES: Percent enrollment calculated using U.S. Census Bureau July 2009 population estimates.SOURCE: Centers for Medicare & Medicaid Services (CMS) Management Information Integrated Repository (MIIR), February 16, 2010. Medicare beneficiaries as a share of state population estimates are based on July 1, 2009 state-level population estimates from the U.S. Census Bureau.
9%-14% (14 states and DC)
15% (8 states)
16% (12 states)
17%-21% (16 states)
National Average, 2010 = 15%
DC 13%21%
9%18%
15%
12%
14%
13%
13%
16%
14%
17%
18%
20%
17%
18%
18%
17%
14%14%
17%
17%
15%
12%
12%
14%
14%10%
15%
15%
16%
17%
16%
16%
18%
17%16%
16%
14%
15%
16%
16%
16%
17%16%
16%
15%
15%
17%
16%
15%
9

41%
37%
13%
10%
400% FPL and Above
Characteristics of the Nonelderly Uninsured, 2010
The federal poverty level was $22,050 for a family of four in 2010. Data may not total 100% due to rounding. SOURCE: KCMU/Urban Institute analysis of 2011 ASEC Supplement to the CPS.
61%16%
24%16%
24%59%
Total = 49.1 million uninsured
1 or More Full-Time Workers
No Workers
Part-Time Workers
100-250% FPL
<100% FPL
251-399%FPLChildren
Parents
Adults without
Dependent Children
Family Status Family Income Family Work Status
©2011 MFMER | slide‐26
Practice Management 101
©2011 MFMER | slide‐27
Practice Management
• The magic formula:
Revenue – Expense = Income (Loss)
• Provider revenue is generated by billing for professional fees
• Hospital revenue is generated by billing for facility fees
• Expenses are incurred by doing business
• Salaries & Benefits• Supplies• Services• Rent & Overhead
10

©2011 MFMER | slide‐28
Practice Management
• Costs can be classified as direct or indirect• Direct costs are the result of the provision of a specific service (e.g. office visit)
• Provider Salary• Supplies
• Indirect costs are the result of activities that impact all services (e.g. operating costs)
• Rent• Utilities
©2011 MFMER | slide‐29
Professional Fees
©2011 MFMER | slide‐30
Practice Management
• Professional fees for provider services are billed in discrete units, based on the service provided
• Described by Current Procedural Terminology (CPT) codes, each with
• Defined Medicare reimbursement rate
• Defined Relative Value Units (RVU)
• CPT codes fall into two categories• Evaluation & Management (E&M)
• Procedural
11

©2011 MFMER | slide‐31
Practice Management
• E&M coding is driven by documentation
• H&P• Complexity of medical decision making
OR
• Total time, with >50% spent counseling
• An MD and an NPPA can “combine” elements of documentation to satisfy higher E&M code requirements
• An MD and an NPPA cannot combine time
©2011 MFMER | slide‐32
Practice Management
• Procedural CPT codes describe discrete components of an operation
• CPT 49000 – exploratory laparotomy
• CPT 38100 – splenectomy, total
• A surgical procedure triggers a global period• The payment includes post‐operative professional services (hospital visits, etc.)
• No E&M codes can be paid during a GSP –hospital visits, etc.
©2011 MFMER | slide‐33
Practice Management
• Critical Care billing is independent of the GSP• Applies to trauma resuscitation and post‐operative surgical critical care
• Active evaluation & management of critical illness or injury, requiring frequent assessment, manipulation, and direct personal management by the provider
• Acutely impaired vital organ system(s)
• High probability of sudden, clinically significant or life threatening deterioration
• Billed exclusively on time spent providing care described above
12

©2011 MFMER | slide‐34
Practice Management
• NPPA providers can bill independently of physicians• A physician note within the same Medicare specialty will typically trump an NPPA note
• NPPA providers billing independently are reimbursed at 85% of the physician fee schedule
• NPPA providers employed by a physician may bill “incident to” that physician’s services and be reimbursed at 100% of the physician fee, provided that strict supervision requirements are met
©2011 MFMER | slide‐35
Hospital Billing
©2011 MFMER | slide‐36
Practice Management
• Hospital revenue is generated by facility and technical fees
• Hospital bed• Nursing• Tests
• Medicare reimbursement is based upon diagnosis, and is paid in a lump sum, regardless of actual cost or utilization (“DRG payment”)
• DRG payment is only influenced by markers of acuity or complexity (CC, MCC)
13

©2011 MFMER | slide‐37
Practice Management
• Medicare DRG Payments
Base Payment * Relative Weight
[+ DSH + IME]
• 2011 Base Payment = $5164.11
DRG Title Weight Payment
799 Splenectomy w MCC 4.9434 $25,528.26800 Splenectomy w CC 2.5874 $13,361.62801 Splenectomy wo CC 1.5586 $8,048.78
Source: Centers for Medicare & Medicaid Services, www.cms.gov
©2011 MFMER | slide‐38
Practice Management
• MCC? CC? WTF?
• MCC = major complication/comorbidity
• CC = complication/comorbidity
• Evidence in the record of specific conditions that will increase acuity will increase hospital reimbursement
• Each DRG has a standard mean length of stay, severity index, and mortality rate
• Outcomes data will increasingly be publically available and benchmarked against other providers
©2011 MFMER | slide‐39
Practice Management
• Consider the following:82 yo WF altered mental status, shaking chills, fevers, decr UO, T = 103, P = 124, R = 34, BP = 70/40 persistent despite 1 L NS, on Dopamine, pO2 = 78 on non‐rebreather, pH = 7.18, pCO2 = 105, WBC = 17,500, left shift, BUN = 78, Cr = 5.4, CXR – Right UL infiltrates, start Cefipime, Clinda, Tx to ICU. May have to intubate – full resusc.
• What is the diagnosis?
14

©2011 MFMER | slide‐40
Practice ManagementPrincipal Diagnosis Chills and Fever Sepsis
Secondary Diagnoses Altered mental statusNothing else code-able from available documentation
Septic ShockAcute Respiratory Failure
Aspiration PneumoniaAcute Renal Failure (or AKI)Respiratory AcidosisMetabolic Encephalopathy
Medicare MS-DRG 864 Fever w/o CC/MCC 871 Septicemia or severe Sepsis w/o MV 96+ hrs w/ MCC
APR-DRG 722 Fever 720 Septicemia & Disseminated infection
APR-DRG Severity Illness 1 – Minor 4 – Extreme
APR-DRG Risk of Mortality 1 – Minor 4 – Extreme
Medicare MS-DRG Rel Wt 0.8276 1.9074
National Mortality Rate (APR Adjusted)
0.04% 62.02%
©2011 MFMER | slide‐41
The cry of administrators everywhere…
This is why good documentation matters!
15

The Use of CT Scan in the Trauma Bay
Riad Cachecho, MD, MBACrozer Chester Medical Center
Objectives
• Principles and concepts of computed tomography
• ATLS/EAST guidelines• Review normal CT anatomy• Review traumatic abnormalities in the
head, face, spine, chest, abdomen and pelvis
Computed Tomography Scan
• Converts 2 D images to 3 D images• Cross sectional vs. Spiral (helical)• Single slice vs. 168 slice• Speed• Resolution
16

The Risk of Radiation• One mSv (Sivert) may increase lifetime
cancer risk by about 1/25,000*. • Data extrapolation from Hiroshima• Pediatric population** • Adult population*** • Pan scans****
* US Nuclear Regulatory Commission ** DJ Brenner et al: Estimated risk of radiation induced fatal cancer from pediatric CT:,ARRS, 2000** BA Gaines: Intra-abdominal solid organ injury in children: diagnosis and treatment, JOT, 67 (2) S135, 2009*** TA Laack et al: Comparison of trauma mortality and estimated cancer mortality from CT during initial evaluation of
intermediate risk trauma patients, JOT, 70 (6), 1362, 2011****A Tillou et al: Is the pan-CT for blunt trauma justified? A prospective evaluation, JOT, 67 (4), 779, 2009****O Chan: Primary CT survey for major trauma, BJS, 96 (12), 1377, 2009
The Risk of Radiation
• Chest radiogram 0.1 mSv (milli Sievert)• Head CT 1.5 mSv• Abdomen CT 5.3 mSv• Chest CT 5.8 mSv• Chest/abd/pelvis CT 9.9 mSv
ATLS/EAST Guidelines
Head CT Scan– Mild TBI: GCS 14-15
• 3% will evolve to severe TBI. • EAST recommends CTH
– Moderate TBI: GCS 9-13• 40% abnormal CT, 8% surgery• CTH indicated
– Severe TBI: GCS 3-8• CTH indicated
17

ATLS/EAST GuidelinesCervical Spine CT Scan
NEXUS* Guidelines
• Depressed mental status: Drugs, alcohol, TBI, premorbidity, psych.
• Distracting injury• Midline neck tenderness• Neurological deficit
*National Emergency X-Radiography Utilization Study (JAMA 2000)
ATLS/EAST Guidelines
Abdominal CT Scan• Blunt abdominal trauma in stable patients
• Unreliable examination• Tender abdomen• Abdominal wall contusion
• Blunt trauma in unstable patients• Penetrating abdominal trauma
Indications of Chest CT Scan
• Thoracic aortic injury• Thoracic spinal injury• Ruptured diaphragm• Pulmonary contusion• Rib fracture
18

Indications of Chest CT Scan
• Mechanism• S & S of severe thoracic trauma• Abnormal chest radiograph
ATLS/EAST Guidelines
Thoraco-lumbar Spine CT Scan• Insufficient evidence • Scan obtained as part of chest and
abdomen CT• Nexus criteria + mechanism
Indications for Facial CT Scan
• No indicated as a routine in the trauma bay
• Usually performed at this stage for convenience
• Indicated for facial exsanguination
19

Pediatric Trauma
• Use clinical judgment• Consider risk of traumatic mortality Vs.
radiation exposure• Consider observation• Consider your resources
Orbit
Sphenoid Sinus
Frontal Lobe
Mastoid Cells
Basal Cystern
20
Frontal S.
FalxFrontal L.
Lateral V.
Parietal L.
Occipital L.
Mastoid
Jugular C.
Carotid C.
Zygoma
Maxillary S.
External A. C.
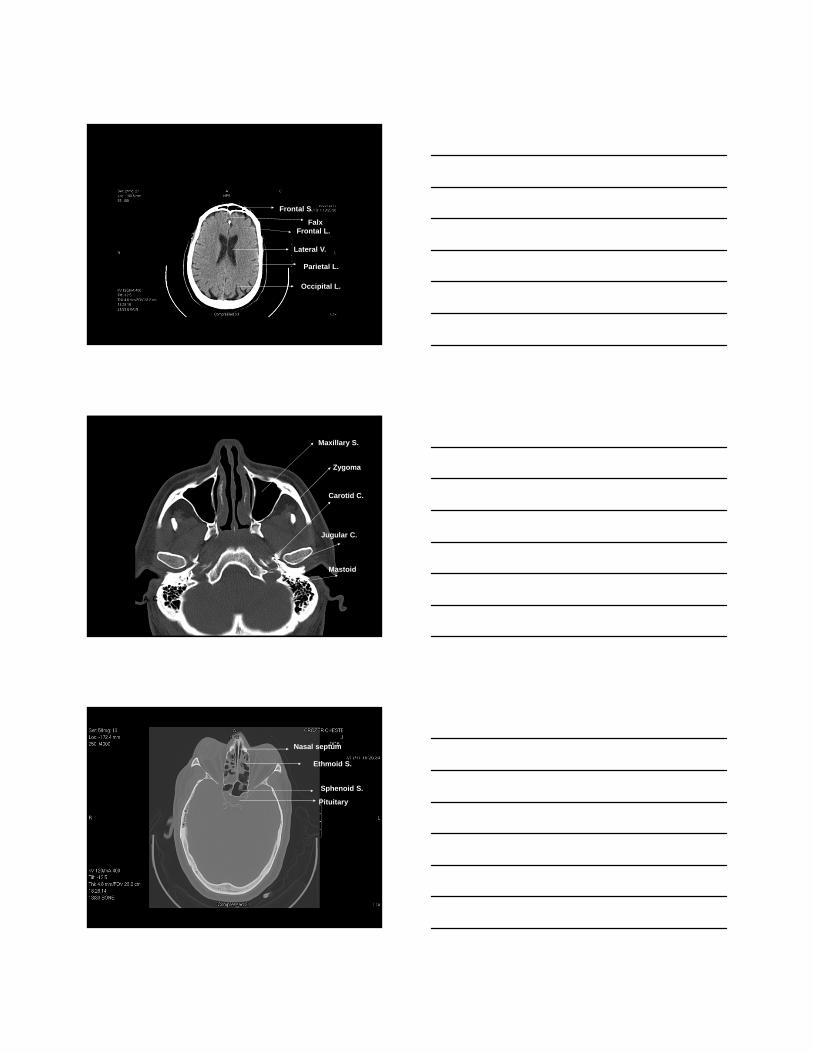
Nasal septum
Ethmoid S.
Sphenoid S.
Pituitary
21
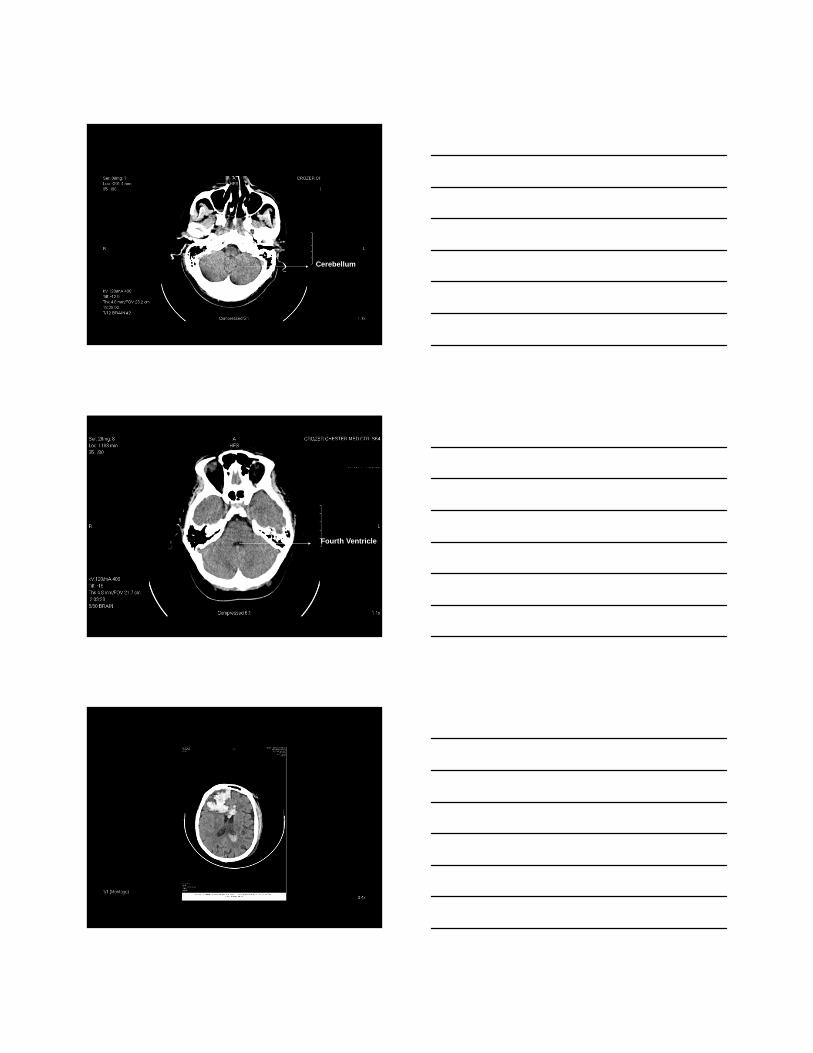
Cerebellum
Fourth Ventricle
22

23

24

25

26


29
30

31

32

33

34

35

36

Review basic hemodynamic principles Discuss invasive and non-invasive modalities
of hemodynamic monitoring Review most appropriate contemporary
approach to hemodynamic monitoring including indications
Understand the role of hemodynamic monitoring in the resuscitation of injured patient
Identify endpoints of resuscitation
Inadequate tissue oxygenation to meet tissue oxygen requirements
Condition of the inadequate delivery of oxygen and nutrients necessary for normal tissue and cellular function
State of inadequate tissue perfusion in which delivery of oxygen to tissues and cells is insufficient to maintain normal aerobic metabolism
37

Early definitive control of the airway
Control active hemorrhage
Early correction of hypoperfusion of tissue Uncontrolled/Excessive fluid resuscitation is
harmful
38

Ensure that tissues receive adequate oxygen Oxygen Delivery (DO2)
Ensure that tissues are able to consume the oxygen they require to function Oxygen Consumption (VO2)
Deficit in tissue oxygenation over time that occurs with shock
Oxygen Consumption > Oxygen Delivery Magnitude correlates with the severity and
duration of hypoperfusion Marker of mortality is inability to repay the oxygen
debt
The magnitude of oxygen debt, its rate of accumulation, and time required to correct may all correlate with survival
Pulmonary gas exchange Ventilation
Oxygen delivery Circulation
Oxygen consumption Metabolism
39

Oxygen delivered to alveoli Ventilation
Diffusion of oxygen across the alveolar-capillary membrane
Oxygen binds with hemoglobin Oxygenated blood delivered to systemic
circulation via the heart Cardiac Output
Oxygen availability (FiO2)
Alveolar ventilation (RR and Vt)
Diffusion across alveolar-capillary membrane
Pulmonary perfusion
Ventilation/Perfusion (V/Q) Ratio of ventilation to perfusion
40

DO2 = CO x CaO2 x 10
Cardiac Output (L/min) CO = Heart Rate (HR) x Stroke Volume (SV) The major component of oxygen delivery
Oxygen Content of blood PO2 (2%) – pressure that is exerted by oxygen when
dissolved in plasma SO2 (98%) – amount of oxygen bound to hemoglobin Greatest contributor to CO2 is the hemoglobin level CaO2 = (1.38 x Hgb x SaO2) + (0.0031 x PaO2)
41

Amount of oxygen required to meet the body’s metabolic requirement
For homeostasis oxygen delivery must equal oxygen demand
Oxygen delivery in a normal patient is approximately four times the oxygen consumed
If oxygen demand is not met, the patient will revert to anaerobic metabolism Develop an oxygen debt
42

VO2 = Arterial Oxygen Delivery – Venous Oxygen Delivery
VO2 = CO x Hgb x 1.38 x (SaO2 – Sv02)
Oxygen consumption is the best index of tissue oxygen requirements available to the clinician
Sample of blood taken from the pulmonary artery (SvO2) Mixed venous oxygen saturation
Sample of blood taken from the superior vena cava (ScvO2)
Venous Oximetry represents the balance of oxygen delivery and consumption Difference between oxygen delivery and consumption
Normal resting individual consumes 25% of the available oxygen content
43

Inadequate Oxygen Delivery Impaired pulmonary exchange Inadequate oxygen carrying capacity Insufficient cardiac output
Increased Metabolic Requirements Fever, pain, anxiety, shivering SIRS
Increase cardiac output
Redistribution of blood flow Shunting of blood from extremities, mesentery,
kidneys, etc.
Increase oxygen extraction by the tissues
Depth and duration of shock leads to cumulative oxygen debt
Resuscitation is complete when oxygen debt repaid Tissue acidosis eliminated Normal aerobic metabolism restored
Restoration from hemorrhagic shock is impossible without hemostasis
Use of endpoints to allow early detection and reversal of compensated shock
44

Blood pressure Heart Rate Urine Output
Standard hemodynamic parameters do not adequately quantify the degree of physiologic derangement in trauma patients
Base deficit Lactate level
Base Deficit
Lactate Level
Stratify need for ongoing fluid resuscitation
Stratify risk of MODS and death
Time to normalization is predictive of survival
Persistent worsening of parameters indicative of ongoing hemorrhage or abdominal compartment syndrome
Amount of base in millimoles that is required to titrate 1L of whole blood to a pH of 7.40 Saturated with O2 at 37° C and PaCO2 of 40 mmHg
Good correlation between the base deficit and survival LD50 11.8 mmol/L
45

Serum lactate is an indirect measure of oxygen debt and therefore approximation of the magnitude of shock
Initial lactate levels and response of lactate level to an intervention is a predictive value Vincent, et all
Time needed to normalize serum lactate levels is an important prognostic factor for survival Abramson, et al
76 patients0 % mortality with normal lactate in 24 hrs25% mortality with normal lactate 24-48 hrs86% mortality with normal lactate > 48 hrs
Lactate level at end 240 correlated with MODS
Abrumson et al. J Trauma, 1993; 35: 584-589
0%
10%
20%
30%
40%
50%
60%
70%
80%
90%
100%
24hr 24-48hr >48
Lactate Clearance
46

Assess the components of oxygen delivery and consumption
Ensure metabolic needs of the patient are being met
Level of assessment based on clinicians’ preferences, technologies available, and the severity of illness of the patient
Physical Assessment
Laboratory Assessment
Non-invasive Monitoring
Basic Invasive Monitoring
Advanced Invasive Monitoring
Physical Exam Blood pressure (NIBP) Heart rate Urine Output Central Venous Pressure (CVP) EKG Hemoglobin Serum Lactate Arterial Base Deficit Pulse oximetry (SpO2) End tidal CO2
47

Echocardiogram
Central Venous Oximetry (ScvO2)
Arterial Pressure-Based Cardiac Output
Pulmonary Artery Catheter
48

Uses patient’s arterial waveform to continuously measure cardiac output Measures the variations of the arterial pressure Proportional to stroke volume
Cardiac output determined by pulse rate and calculated stroke volume
Patient-specific vascular compliance is determined
Arterial pulse pressure falls during inspiration and rises during expiration due to changes in intra-thoracic pressure secondary to negative pressure ventilation Spontaneously breathing Pulsus paradoxus
With controlled mechanical ventilation, arterial pressure rises during inspiration and falls during expiration secondary to positive pressure ventilation Paradoxical Pulsus Pulse Pressure Variation Stroke Volume Variation (SVV)
49

Continuous venous oximetry Determining the adequacy of oxygen delivery to
meet demand Pulmonary artery catheter Fiber optic oximetry catheters
50

PAP RAP PAOP CCO RVEF RVEDV SvO2
51

52

Ruth Kleinpell PhD RN FCCMRush University Medical Center
Chicago Illinois USA
Nurse Practitioners◦ 140,000 in US◦ Close to 9,000 new NPs are prepared each year at
over 325 colleges and universities◦ >2800 working in ICU settings
Physician Assistants◦ 83,466 in US◦ Approximately 6,000 new PAs graduate
each year from the 156 programs◦ >1,800 working in ICU settings
www.aanp.org ; www.aapa.org
Online membership surveyN=3368
American Academy of Nurse Practitioners Membership Survey
53

Acute care
Adult
Family
Gerontology
Neonatal
Pediatric
Psychiatric
Woman's Health
AANP Membership Survey: NP Specialty Areas
N=3368
Goolsby MJ. JAANP 2009;21:618-622
83,466 PAs practicing in the USN=19,830 respondents to survey
www.aapa.org
N=19,830
54
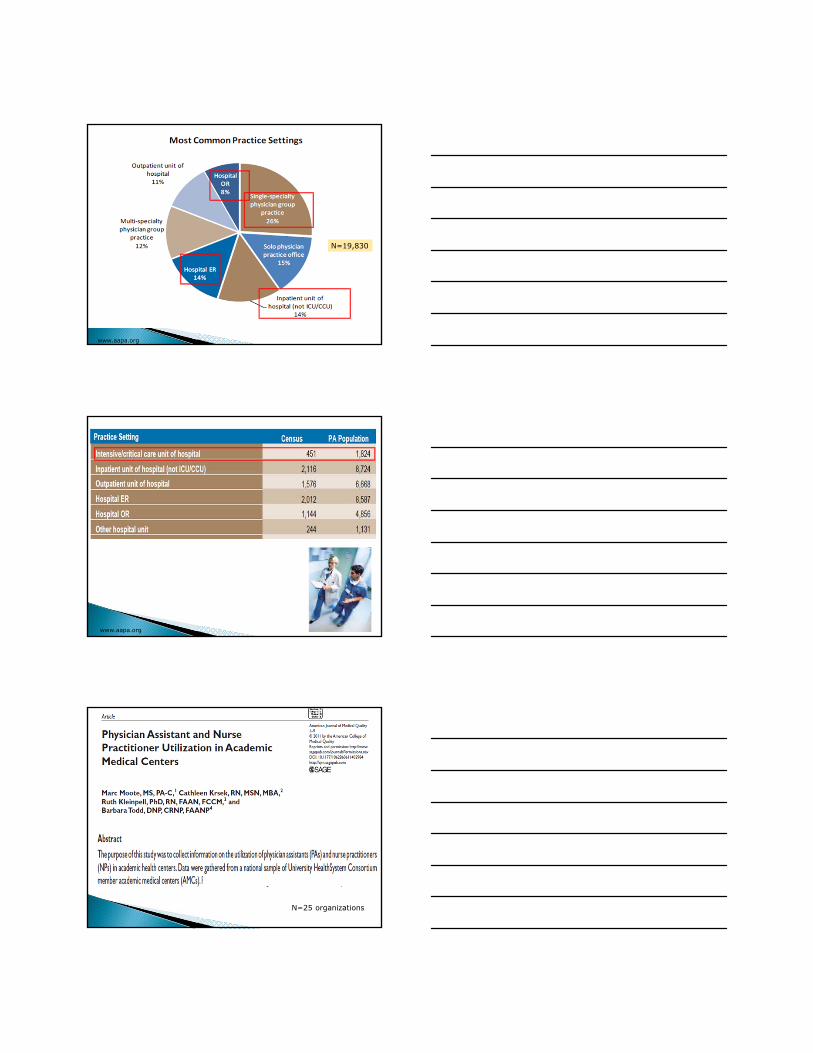
www.aapa.org
N=19,830
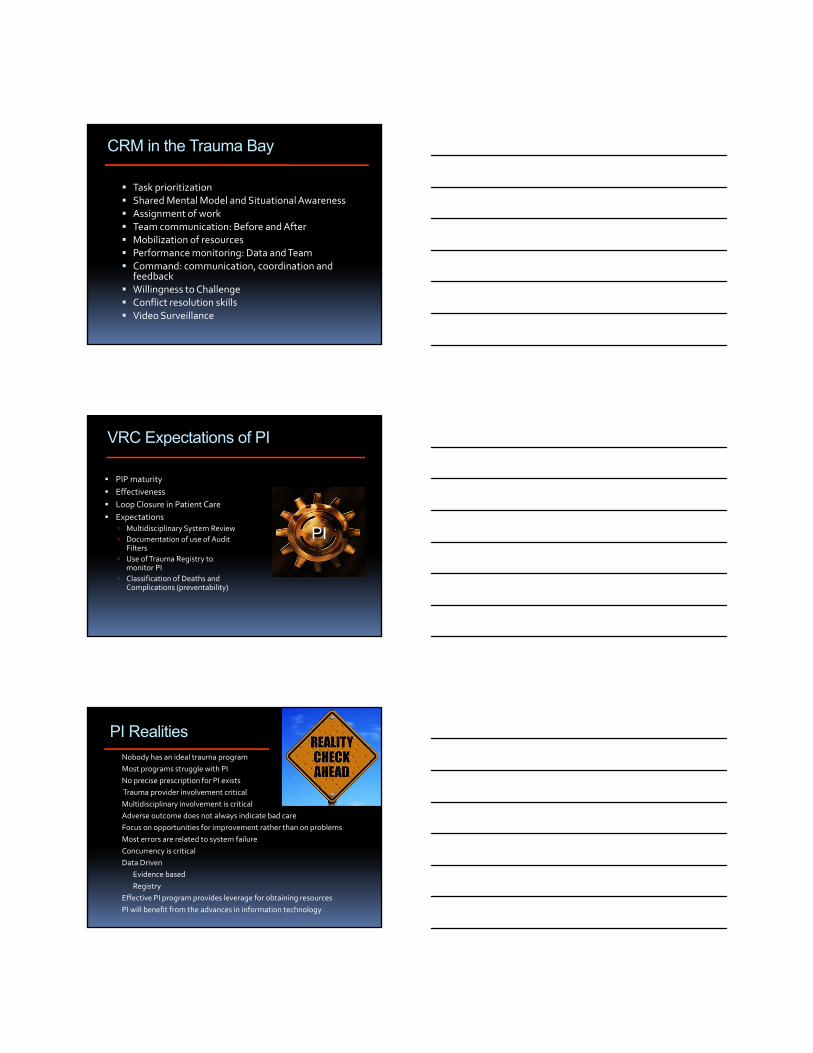
www.aapa.org
N=25 organizations
55

Moote M. et al. Am J Med Quality 2011;1-9
Moote M. et al. Am J Med Quality 2011;1-9
Review unit based performance metrics Identify NPs and PAs with an interest in
developing leadership skills Evaluate opportunities for leadership◦ QI initiatives◦ Research◦ Committee work
56

Leadership has been described as the “process of social influence in which one person can enlist the aid and support of others in the accomplishment of a common task"
Leadership is "organizing a group of people to achieve a common goal"
Bass, B.M. & Bass, R. (2008). The Bass handbook of leadership: Theory, research, and managerial applications (4th ed.). New York: Free Press.
Effective Communication Skills Competent Goal orientation Strong internal motivation Self-esteem Proactive rather than reactive Honest
http://www.legacee.com/Info/Leadership/LeadershipEntrepreneurial.html
http://www.nwlink.com/~donclark/leader/leadstl.html
57

http://www.leadershipvibe.net/wp-content/uploads/2011/02/situational-leadership-theory.gif
http://www.shapecatalyst.com/portal/Portals/0/Transformational%20Leadership.png
Project leadership Committee work Staffing/scheduling Oversight of credentialing/privileging
applications Development of formal
orientation program for NPs and PAs
58

Project Example: UTI Prevention Initiative
Rush University Medical Center
59

Purpose● To implement and evaluate the efficacy of a multidisciplinary initiative to reduce CAUTIs in a Medical ICU by decreasing urinary catheter device use
Method◦ During a 6 month period, pts with indwelling
urinary catheters were evaluated daily using criteria for appropriate catheter continuance
Elpern et al. Am J Crit Care 2009
During 6 month period, reinforcedassessment of appropriate use of urinary catheters and monitoredcatheter device days andrates of CA-UTI’s compared toprior 11 month timeline
60

Enlist NPs and PAs to serve on committees including the Credentialing and Privileging Committee
As NP and PA roles develop, consider designating a “lead” NP or PA
Promote the development of formal orientation programs for NPs and PAs
Identify other career advancement opportunities – formal leadership seminars, training
61

Differentiating Leadership and Management
http://nelsontouchconsulting.files.wordpress.com/2011/02/leadership-versus-management.png
Project Example: VAP Prevention Initiative
Rush University Medical Center
Focusing on Prevention of VAP: Increasing Awaren
62

Audits were conducted on Oral care practices
0
10
20
30
40
50
60
70
80
90
100
2nd Qtr 3rd Qtr
yes
no
Results of the audits revealincreased use of oral care
Audits were conducted on head of bed (HOB)Positioning
63

0
10
20
30
40
50
60
70
80
90
2nd Qtr 3rd Qtr
Yes
No
Results of the auditsreveal increasedHOB positioning to recommendedlevels
# of VAP 2008
01
2345
67
Jan90th
Feb75-
90th
March50-75th
April75th
May25-
50th
June50-75th
July<25th
Aug50-75th
Sept50-75th
Oct Nov
Rates of ventilator associated pneumonia (VAP) decreased
Developing Leadership Skills in NPs and PAs
Recognize accomplishments Provide feedback and mentoring Identify opportunities for additional
leadership roles
64

Vacillating Complaining Micromanaging Becoming overcommitted Being impatient with outcomes Burnout
http://www.wickedstart.com/blog/startupsmart/2011/09/16/3-leadership-pitfalls%E2%80%A6-don%E2%80%99t-fall-prey-to-them/
NPs and PAs are increasingly being used to meet the workforce needs in the ICU
A number of strategies can be used to develop leadership among NP and PA team leaders to impact outcomes of care in the ICU
65

Ongoing Webinar Series: Critical Care Workforce
Forthcoming book “Integrating Nurse Practitioners and Physician Assistants in the ICU”February, 2012
66

"Practical Application of Performance Improvement"
Forrest B. Fernandez, MD, FACSTRHMC Trauma Program Medical DirectorThe Reading Hospital and Medical CenterAssistant Professor of SurgeryHospital of the University of PennsylvaniaLTC, USAR
“The Constitution only gives people the right to pursue happiness. You have to catch it yourself.”
Benjamin Franklin Email: [email protected]
Disclosures
I am from Pennsylvania (PTSF)
Most of what I have learned in Trauma, I learned by making mistakes.
“Being ignorant is not so much a shame, as being unwilling to learn”
Benjamin Franklin
Objectives:
PI: Perspective
What is it?/ Why bother?
Evolution of Trauma Systems and PI
Basics Concepts of PI:
Industry Standard
Chart Review 101
AP Role in PI
The TRHMC Experience
Impact of PI on Maturation of a Trauma Center
“To Follow by faith alone is to follow blindly.”
Benjamin Franklin
67

Evolution of Trauma Systems
Dominique LarreyNapoleon’s surgeon
“Flying ambulance”
Rapid recovery of wounded
Bring hospital as close as possible to front lines
Operate during “wound shock”
Trauma Systems: The American War Experience
War Wounded % Died of Wounds
Civil War 318,200 14
WWI 153,000 8
WWII 599,724 4.5
Korean War 77,788 2.5
Vietnam War 96,000 3.6
Surgical Mortality for Wounds Requiring Operative Intervention: US Army
Conflict Head Thorax Abdomen
WWI 40% 37% 67%
WWII 14% 10% 23%
Korean War 10% 8% 9%
Vietnam War
10% 7% 9%
68

History of Modern Trauma Systems
1912: American Surgical Association, Committee on fractures
1922: ACS founded: Committee on Fractures Committee on Trauma Hospital standardization Program (Trauma Registry)
1926 Board of Industrial Medicine in Traumatic Surgery
1966: First Trauma Centers
SFGH, Cook County Hospital
1969 R.A. Cowley: Statewide trauma system
1976 : ACS COT, Optimal Criteria for Care of Injured Patient
1980’s to Present: Verification Review Committee (VRC) ATLS National Trauma Data Bank
Are Trauma Systems Effective?
Effectiveness of State Trauma Systems in Reducing Injury‐Related Mortality: a National EvaluationNathens et al, JTrauma 2000, Vol 48, Issue1, p.25.
Assessing Effectiveness of a Mature Trauma System: Association of Trauma Center Present with Lower Injury Mortality RatePape, L et al, JTrauma 2006, Vol 61, Issue 2, pp. 261‐267.
Direct Transport to Tertiary Trauma Centers vs. Transfer from Lower Level Facilities: Impact on Mortality and Morbidity Among Patients with Major TraumaSampalis, JS et al, JTrauma 1997, Vol 43, Issue 2, pp. 288‐296.
State System
Pennsylvania Trauma Systems Foundation Began accrediting trauma centers in 1986
“20 Years ‐ 400,000 Lives”
Institute of Medicine, Errors in Medicine
1999 To Err is Human44,000‐98,000 preventable deaths/yr
Associated cost $17‐29 billion
Among the leading cause of death in the US
Institute of Medicine. 1999. To Err is Human: Building a Safer Health
Care System. Washington, DC: National Academy Press
69

IOM Recommendations
1. Fragmentation and decentralization of care
2. Accreditation: insufficient attention to preventing errors
3. System impedes systematic efforts to uncover and learn from errors
4. Little third party incentive to improve safety and quality
Annual Deaths Associated with Medical Errors Compared to Leading Causes of Death in the US: 1997
0 100,000 200,000 300,000 400,000 500,000 600,000 700,000 800,000
Heart Disease
Cancers
Stroke
Lung Disease
IOM High
Accidents
Pneumonia/Flu
Diabetes
IOM Low
Suicide
Kidney Disease
Leatherman, S. et al. 2002. Quality of Health Care in the United States: A Chartbook. New York, NY: The Commonwealth Fund.
**
*
National Trauma Statistics37 million emergency department visits
2.6 million hospital admissions
Life Years Lost* (2006, most recent available)Trauma injury accounts for 31% of all life years lost in the U.S.Cancer accounts for 16%Heart disease accounts for 12%HIV accounts for 2.0%
Economic Burden (Finkelstein, 2006)$406 billion a year, including both health care costs and lost productivity
Deaths due to injury (2006, most recent available)179,065
Ranking as cause of death#1 for age group 1‐44, or 47% of all deaths in this age range#5 as leading cause of death overall, across all age groups
Finkelstein, E.A., Corso, P.S., & Miller, T.R. The Incidence and Economic Burden of Injuries in the United States. Oxford University Press. 2006
70

What is Trauma PI?
“Performance Improvement” (PI)
the continuous evaluation of a trauma system and trauma providers through structured review
process of care
outcome
Review of errors/opportunities for improvement
Increase awareness
Process change
Prevention of future like events
Joint Commission on Accreditation of Healthcare Organizations (JCAHO)
Crew Resource Management in Healthcare
1979: Introduced to aviation during a NASA workshop
improve air safety and reduce fatal accidents attributable to human error
primary cause of aviation accidents human error failures of interpersonal communication
Leadership
decision making in the cockpit.
cognitive and interpersonal skills needed to effectively manage a team‐based, high‐risk activity
Crew Resource Management in Trauma Bay
Standardized Communication in Healthcare
Team Briefings and Debriefings in the OR
Situational Awareness in Healthcare
Decision Making
Leadership in Healthcare Strategies
Conflict Resolution in Healthcare
Effective Teamwork in Healthcare
Critical Language in Healthcare
Threat and Error Management
York HospitalTPMD: Keith Clancy, MD
71
CRM in the Trauma Bay
Task prioritization Shared Mental Model and Situational Awareness Assignment of work Team communication: Before and After Mobilization of resources Performance monitoring: Data and Team Command: communication, coordination and
feedback Willingness to Challenge Conflict resolution skills Video Surveillance
VRC Expectations of PI
PIP maturity
Effectiveness
Loop Closure in Patient Care
Expectations Multidisciplinary System Review
Documentation of use of Audit Filters
Use of Trauma Registry to monitor PI
Classification of Deaths and Complications (preventability)
PI
PI RealitiesNobody has an ideal trauma program
Most programs struggle with PI
No precise prescription for PI exists
Trauma provider involvement critical
Multidisciplinary involvement is critical
Adverse outcome does not always indicate bad care
Focus on opportunities for improvement rather than on problems
Most errors are related to system failure
Concurrency is critical
Data Driven
Evidence based
Registry
Effective PI program provides leverage for obtaining resources
PI will benefit from the advances in information technology
72

Basic Concepts
Issue Identification
Guideposts
ATLS
Green Book
Industry Standards
Evidenced based Care
Registry Data
www.FACS.org
Performance Improvement Process
Recognition
Correction
Monitoring
Individual counselingEducationPolicy reviewPeer review
Loop ClosureComplete
73

PI: Primary Review (Issue Identification)
Concurrent Issue ID AM Report
(multidisciplinary team review)
Daily trauma service census list
Daily ICU and Floor Rounds
Trauma registry abstraction
Communication with Trauma Staff and Trauma Registry
PI Hotline
Concurrent data entry of issues and relevant discussions is entered into POPIMS real time.
Registry
Secondary Trauma PI Review Criteria
• PTOS Population
• Deaths
• Transfers
• ICU Admits
• Age < 14
• LOS > 48 hrs
• PTOS Occurrences
• PTOS Audit Filters
• Institution Specific Filters
74

Lesson 1: “Resist the urge to make sweeping policy changes based one case?”
Triage of Trauma Activations
Physiologic
Vital Signs including GCS
Anatomic
Injuries noted
Mechanism
Specifics of events
Co‐Morbid Factors
Extremes of Age, Pregnancy, Medical Illnesses
Trauma Team Activation
A better solution to ensure a better process intrinsic to ED would have avoided encumbering vital resources needed by sicker patient populations.
THE READING HOSPITAL AND MEDICAL CENTERTrauma Performance Improvement Levels of Review
Issue ID
Prehospital
Acute Care
Resuscitation
Post Discharge
PRIMARY REVIEW:Daily
Concurrent review: Director, Trauma Surgeons, PI Coordinator, CRNP/PA, Program Manager Concurrent data entry in Collector and POPIMS: Trauma Registrar, PI Coordinators POPIMS Case Management Initiated – Trauma PI
Coordinators
SECONDARY REVIEW:
Daily and Weekly
Potentially Preventable/Preventable Issues (and Non-Preventable with educational value)
TERTIARY REVIEW:
Trauma Program Medical Director Trauma Program ManagerTrauma PI Coordinators
Team (TPMD, TPM, Data Coordinator, PI Coordinator, CRNP/PA, Trauma Surgeons, Specialties Staff, Hospital PI)
Morbidity & Mortality
Trauma Peer Review Committee
(Monthly)
Specialty SpecificTrauma PI Committee
(Ortho/Neuro/ED)
Actions
EDUCATION SESSION
COUNSELING P & P,GUIDELINES
PI TEAM PROJECT
Purpose:Concurrent Performance Improvement and Issue Identification/Validation/Initial Review
Purpose:Determining which issues are resolved and which issues are referred to tertiary review and to hospital or medical staff committees
TREND
Phase of Care
Purpose:
Peer Review: Accountability, Preventability Determination, Loop Closure, Plan, Review Trended Data
“GUSS” 24/7 PI HOTLINE X4877
Adapted from Trauma Resuscitation through Rehabilitation, Chapter 4
Revision 2009
Loop
Clo
sure
and
Re-
eval
uatio
n
Trauma ServicePI Review (Monthly)
Med Exec/Quality Improvement Council(Hospital Integration )
Performance Improvement Program Case Review Example
Case Summary:
J.S. a 74yoM bicyclist who crashed into mailbox
Injuries: L flail chest with pneumothorax
Pt discussed at AM Report ‐multiple unsuccessful attempts made at intubation followed by immediate cricothyroidotomy
Issue Identification:
Primary review: An issue surrounding the intubation was identified.
Secondary review: Case discussed at Weekly PI with regard to delay in definitive airway control due to location of difficult airway cart. Cart was a distance away from the trauma bay.
Tertiary Review: Case reviewed during our Trauma Peer Review forum the month following the incident.
75

Performance Improvement Program :Case Review
Action Plan: Movement of Difficult Air way
cart in closer proximity to Trauma Bay
Anesthesia would modify the contents of the cart
Counseling specific provider with regards to need earlier surgical airway
Outcome: Cart was moved and sign placed
above cart
All personnel notified of new location
Education discussion during Peer Review regarding difficult airway management
Evaluation:- No further issues identified
Secondary Review
TPMDPICTPM
LEAD TSLEAD AP
Primary ReviewMorning ReportRoundsExternal EmailInternal emailQuality lineRegistry Data
Secondary Review
Tertiary ReviewTSPIEDPIOrtho PINS PIPeer
AP
MD/DO
Consensus Opinion
Performance ImprovementTertiary Review
Trauma Surgeon PI Meeting (Trauma clinicians)
Subspecialty PI Meetings
Ortho PI (Trauma and Ortho Clinicians)
Neurosurgery PI
Emergency Department PI
Multidisciplinary (all specialties)
Peer Review
Data entry of issues and relevant discussions is entered into POPIMS real time.
76
Performance ImprovementAction Plan & Implementation
• Physician & Staff Counseling
• Policy Development or Revision
• Change in Practice
• Refer for Focused Provider Review
• Educational Session
Performance ImprovementLoop Closure & Reevaluation
• Continuous Monitoring
• Trending of Data
• Focused Audits
Data is being trended to monitor patient outcomes to assure loop closure.
0
1
2
3
4
Oct‐08 Nov‐08 Dec‐08 Jan‐09 Feb‐09
Missed Injuries/ Delays in Diagnosis
Critical Definition: Disease-Related
Any event or complication that is an expected sequellae of a disease, illness, or injury Infectious events:UTI after prolonged but necessary urethral
catheter
Pulmonary: Adult respiratory distress syndrome (ARDS) from injury despite best available treatment
Organ failure: Renal failure despite preventative efforts
GI: Ileus after injury, or stress ulcer bleed despite appropriate prophylaxis
Hematologic: Anemia after unavoidable blood loss in the field
Dermatologic: Skin‐sloughing over area of severe contusion; for example, in the elderly
77

Chart Review 101
Trauma Performance Improvement File
• Contents of Trauma PI File
• POPIMS Case Review Summary
• Trauma Surgeon Evaluation Form
• Trauma Flow Sheet
• Standard Chart Review Form
• Focused Provider Review Form (ATLS/ MD chart review)
• Neurosurgery Review Form
• Correspondence
• Supporting Documents
AP Role in PI: TRHMC Experience
“An investment in knowledge always pays the best interest.”Benjamin Franklin
78

The Reading Hospital and Medical Center: Reading, PA
TRHMC Trauma and Emergency Surgical Service
5 Full Time Trauma Surgeon’s
4 Part‐time Trauma Surgeons
1 ED Critical Care provider
8 Advanced Practitioners
4 Residents
Service Structure
1AP2 Res 1 AP 2AP
1 Res1AP
1 Res
Red Blue SICU Trauma Bay
4 Leaders
9 Providers
TS TS TS TS
79

AP Role in Service Structure
Floor Care
Resuscitation Team Leader
First Assistant in OR
SICU patient management
Consultation ED and Inpatient
AP as Colleague: Key to SatisfactionAttending Trauma Surgeon
Paperwork
Directed Clinical Care
Directing Clinical Care
Resuscitation SICU Floor Clinic Operating Room
AP AP AP APAP
Circle of Awareness
TPMDPIC
Lead APLead TSTPMD
Assistant PIC
Morning Report
EDPI
Ortho PI
Peer Multidisciplinary PI
TSPI
M&M
AP
AP
AP
AP
AP
AP
AP
AP
APPMGCommittee
NSPI
TS
OSOS
OS
TS
TS
TS
NSChief
NSNS
NS
OSChief
EDChief
TS
TSTS
TS
TS
EDChief
AP
AP
Counseling
NSChief
OSChief
Part Time TS
Part Time TS
Part Time TS
Plastic Surgeon
OMFS
Hospitalist
Hospitalist
Nursing
Nursing
Nursing
Lesson 3: “If a tree falls in the wilderness, did it really happen?”
80

PI and Trauma Center Maturation
“Energy and persistence conquer all things.”Benjamin Franklin
“Never confuse motion with action”Benjamin Franklin
2008 PTSF Survey
Trauma volume has grown significantly over the last year creating the need to reprioritize efforts relating to PI.
Our outcomes reflect consistent improvement in identifying and addressing issues in a concurrent manner.
PI documentation is more consistent and evident through better use of the POPIMS database.
We now have the ability to trend data including provider specific issues
Loop closure has been realized on some issues while many are in progress due to action plan implementation occurring only a short while ago.
Integration w/ Hospital PI
• Transforming ICU (TICU)
• VAP
• Nursing Core Group
• Brain Death
• Pain / skin integrity
• Nursing CQI Committee
• Transition from ICU
• DVT Initiative (hospital)
• UTI Initiative (hospital)
81

Tier 3 Activation Team: Initial Assessment
RN, MedicCardiac Monitor
O2, IVHourly VS
Neuro ChecksED Physician:ATLS Primary
Survey
Ancillary Support:Portable CXR
Modified Trauma Panel
PICTUREOF T3Unit Clerk:RegistrationOrder Entry
CT ScanRN,Medic
Transport patienton Monitor for continued
Hourly VS &Neuro Checks
Lesson 4: “The Power is in We!”
Triage Level and Admission Rate: All Contacts (3/1/10-8/31/10)
Alerts
Trauma*
Responses
Trauma*
Tier 3
Trauma*
Tier 3
ED†
Total Contacts
351 686 316 1753
Percent Admit
62% 45% 76% 24%
*Trauma Registry Data†ED Source: Pulsecheck®
Mortality: All ContactsPreT3: 3/1/2008-8/31/2008PostT3: 3/1/2010-8/31/2010
Era n (patients) Mortality %In Consults
Pre T3(Consults All)
266 3.4%
Post T3Consults All(Routine Consult +T3)
502 1.4%
Mortality for T3 patients same period=1.5%
TRHMC Trauma Registry Data
p-value=0.038
82

T3 Trauma Activation:Impact on ED
N % all ED presenting patients
% Acute ED
patients
% of Total Activations
Tier 3 3467*
(9.5/day)
3% 10% 70%
*Annualized estimate (3/1/10-8/31/10)
Tier 3ED Activations
1753
Resources for the High/Moderate Risk Populations: All Contacts (3/1/10‐8/31/10)
TraditionalTrauma Activations
1037
Trauma Service
T3 Consults316
Emergency Department
1437
Expedited Activations
Trauma ActivationsED T3 Activations
6212 per year!
Summary PI is critical to maturation of a
Trauma Center
AP’s can and should play a critical role in PI process from issue identification, analysis and institution of change
Current trends of increasing practice armament of AP’s and maturation of Acute Care Surgery with application of the PI process will only serve to increase the critical importance of AP’s in the PI process
“When you're finished changing, you're finished.”
Benjamin Franklin
Email: [email protected]
83


![EXAMINATION FOR MEMBERSHIP OF THE ROYAL …mitshs.org/Download/Syllabus.pdf · examination for membership of the royal college of general practitioners mrcgp [int] syllabus for the](https://img.pdfslide.net/doc/110x75/5b2b398d7f8b9a45198b51a1/examination-for-membership-of-the-royal-examination-for-membership-of-the-royal.jpg)