Embed Size (px)
DESCRIPTION
Advanced Seismic Imaging GG 6770. Variance Analysis of Seismic Refraction Tomography Data. By Travis Crosby. Outline. Description of field experiment Description of refraction tomography processing and inversion Description of variance analysis Results of tomography experiment - PowerPoint PPT Presentation
Citation preview
Advanced Seismic ImagingAdvanced Seismic ImagingGG 6770GG 6770
Variance Analysis of Seismic Variance Analysis of Seismic Refraction Tomography DataRefraction Tomography Data
ByByTravis CrosbyTravis Crosby
Outline
• Description of field experimentDescription of field experiment
• Description of refraction tomography processing Description of refraction tomography processing and inversionand inversion
• Description of variance analysisDescription of variance analysis
• Results of tomography experimentResults of tomography experiment
• Results of variance analysisResults of variance analysis
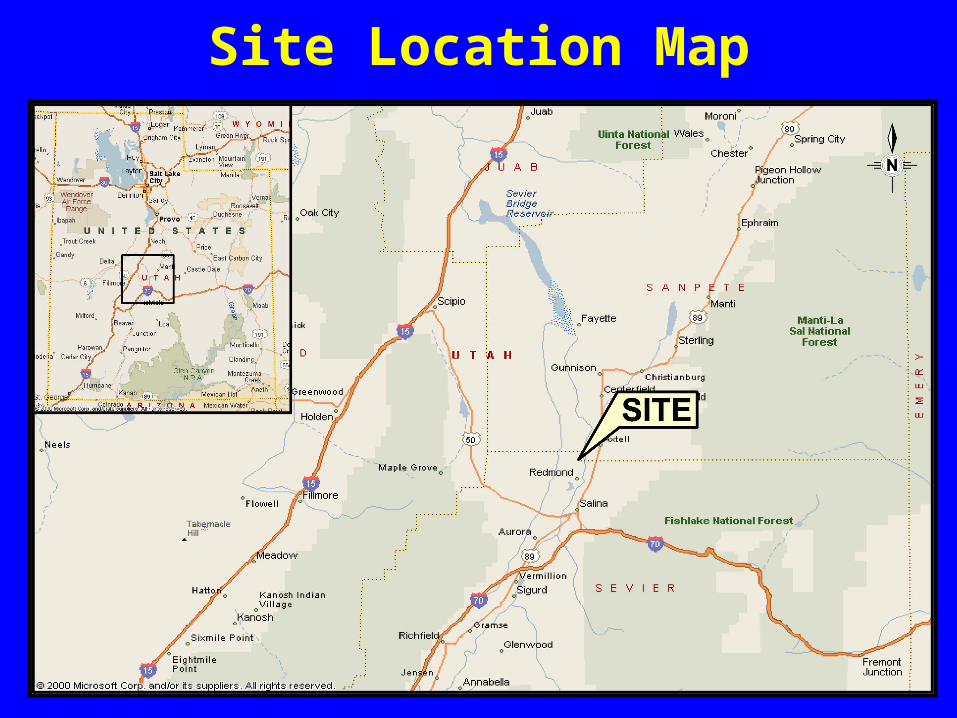
Site Location Map
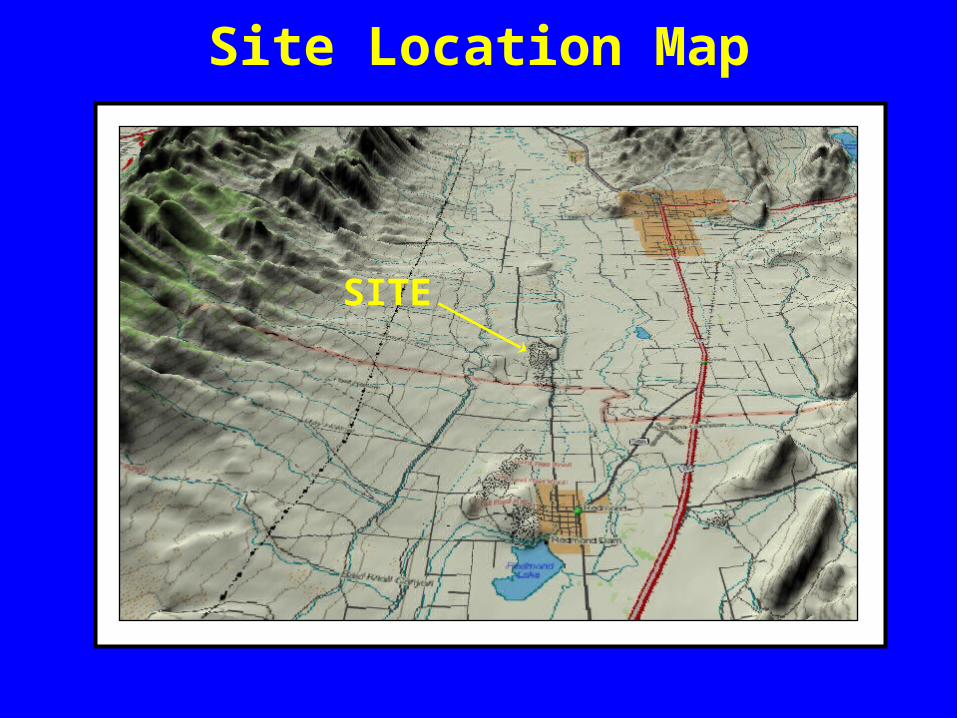
Site Location Map
SITE
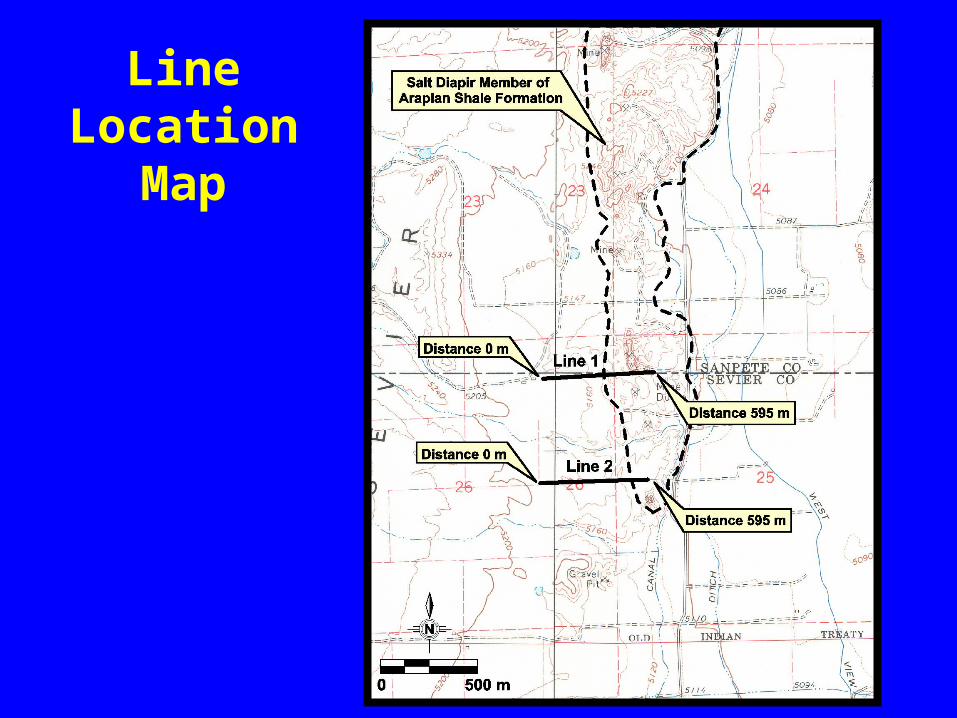
Line Location Map
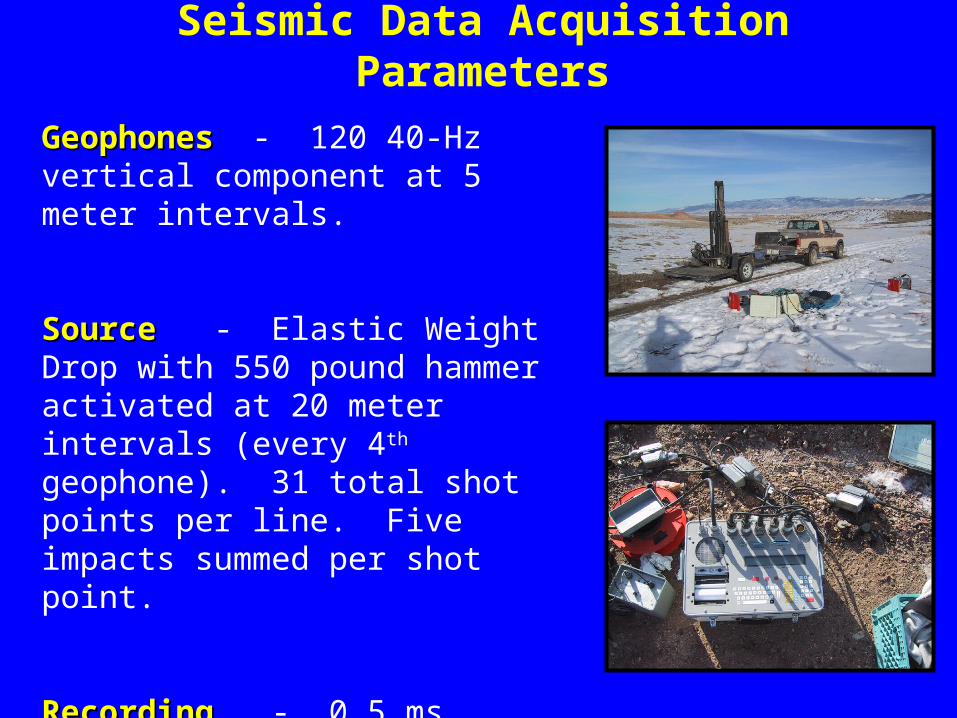
Seismic Data Acquisition Parameters
GeophonesGeophones - 120 40-Hz vertical component at 5 meter intervals.
SourceSource - Elastic Weight Drop with 550 pound hammer activated at 20 meter intervals (every 4th geophone). 31 total shot points per line. Five impacts summed per shot point.
RecordingRecording - 0.5 ms sample rate, 2000 samples per trace, 1 second listening time.

Seismic Refraction DataCommon Shot Gather
West East
Created with Vista
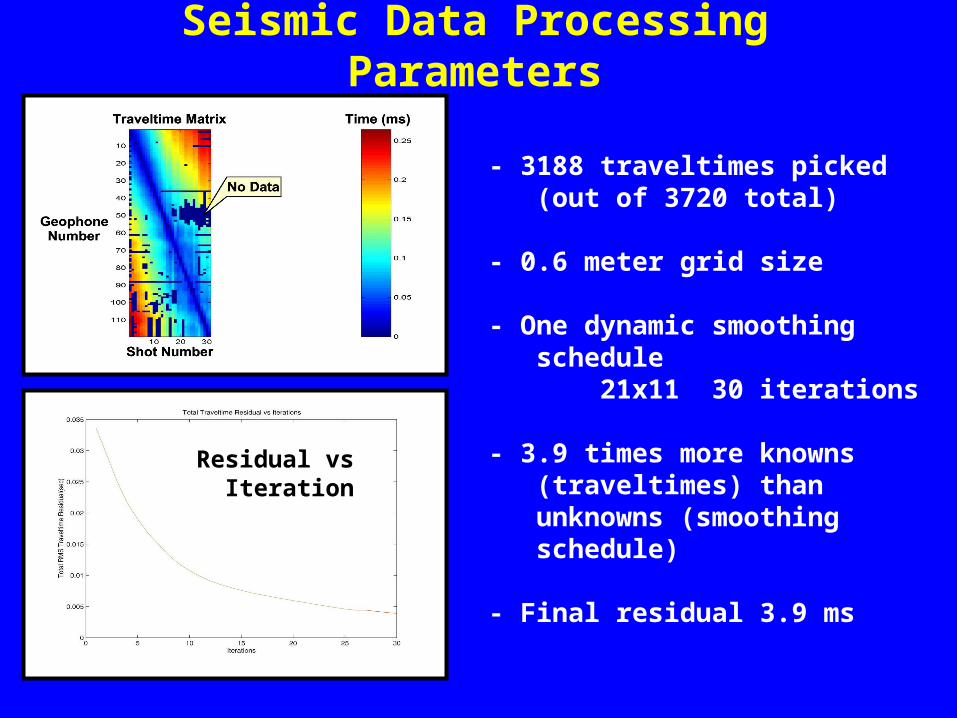
Seismic Data Processing Parameters
- 3188 traveltimes picked (out of 3720 total)
- 0.6 meter grid size
- One dynamic smoothing schedule 21x11 30 iterations
- 3.9 times more knowns (traveltimes) than unknowns (smoothing schedule)
- Final residual 3.9 ms
Residual vs Iteration
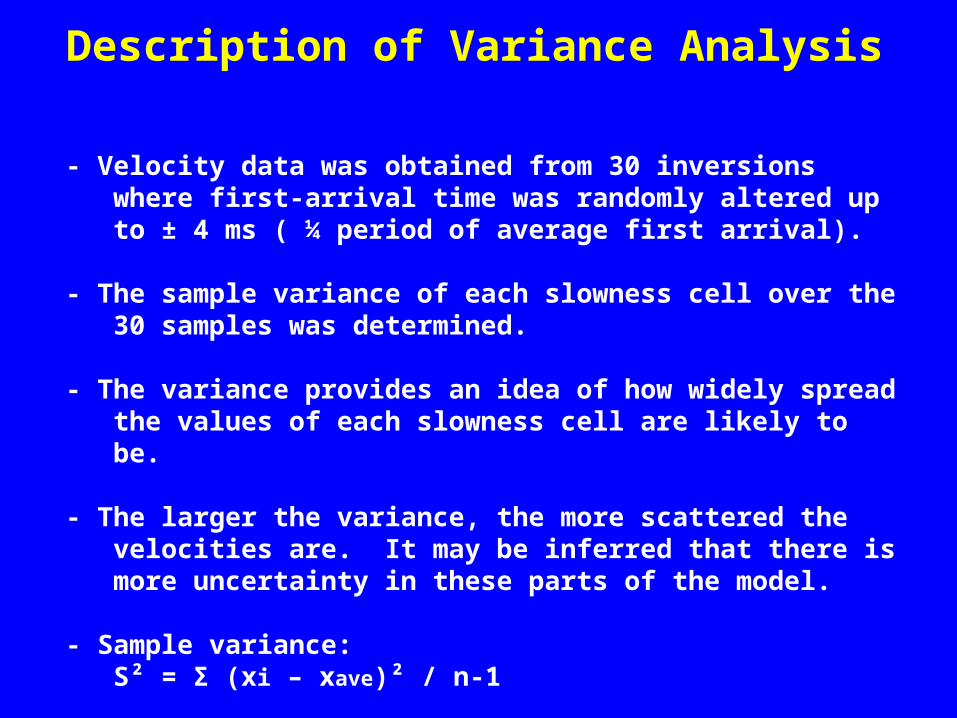
Description of Variance Analysis
- Velocity data was obtained from 30 inversions where first-arrival time was randomly altered up to ± 4 ms ( ¼ period of average first arrival).
- The sample variance of each slowness cell over the 30 samples was determined.
- The variance provides an idea of how widely spread the values of each slowness cell are likely to be.
- The larger the variance, the more scattered the velocities are. It may be inferred that there is more uncertainty in these parts of the model.
- Sample variance:S² = Σ (xi – xave)² / n-1
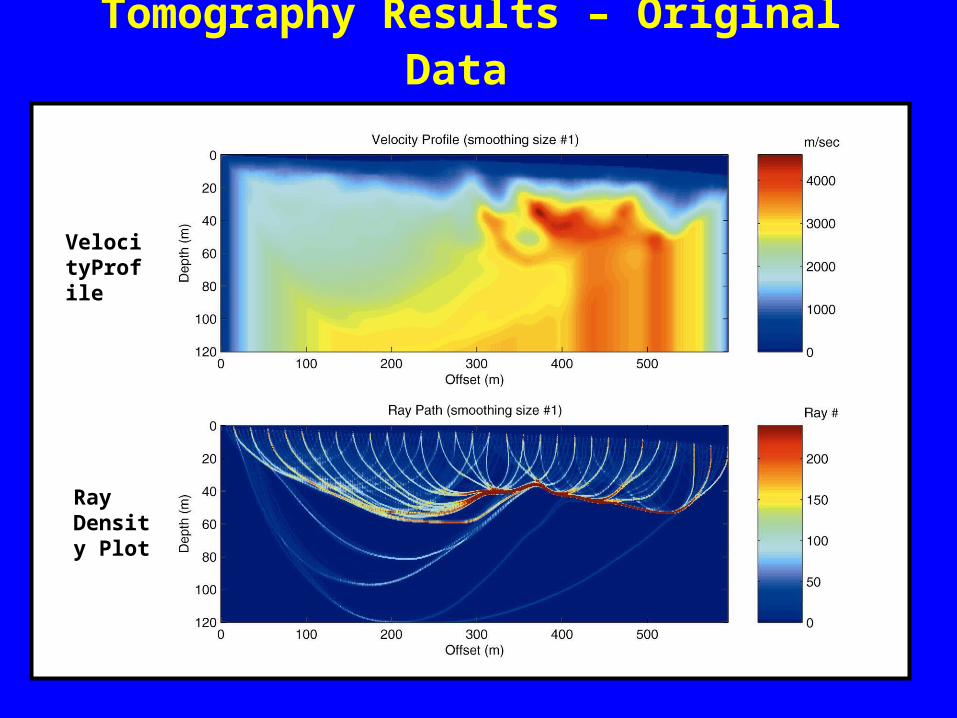
Tomography Results – Original Data
VelocityProfile
Ray Density Plot
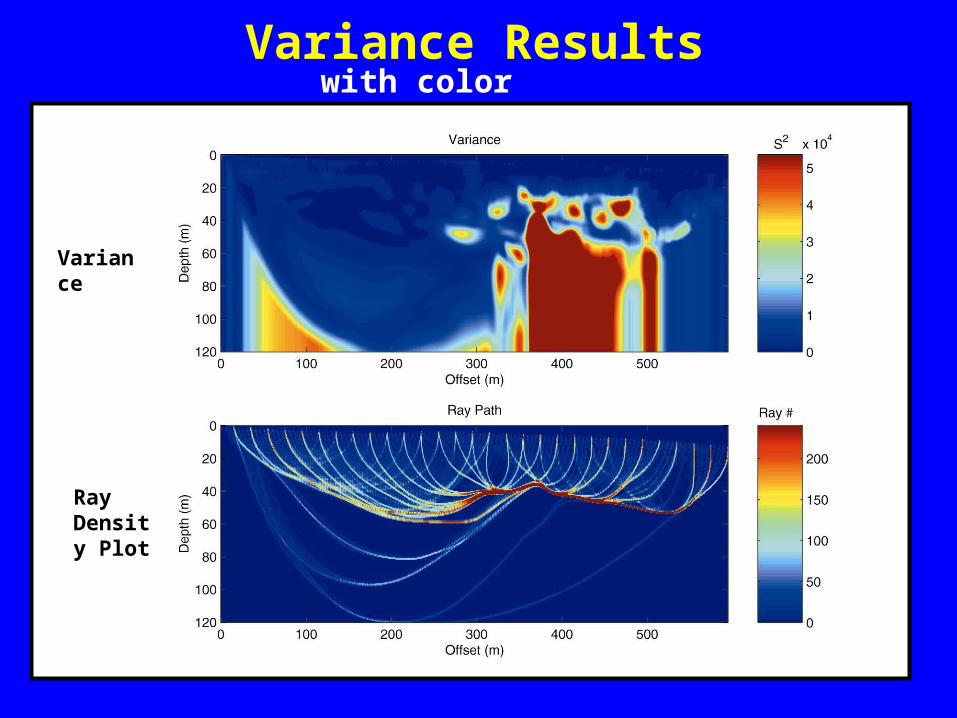
Variance Results
Variance
Ray Density Plot
with color thresholding
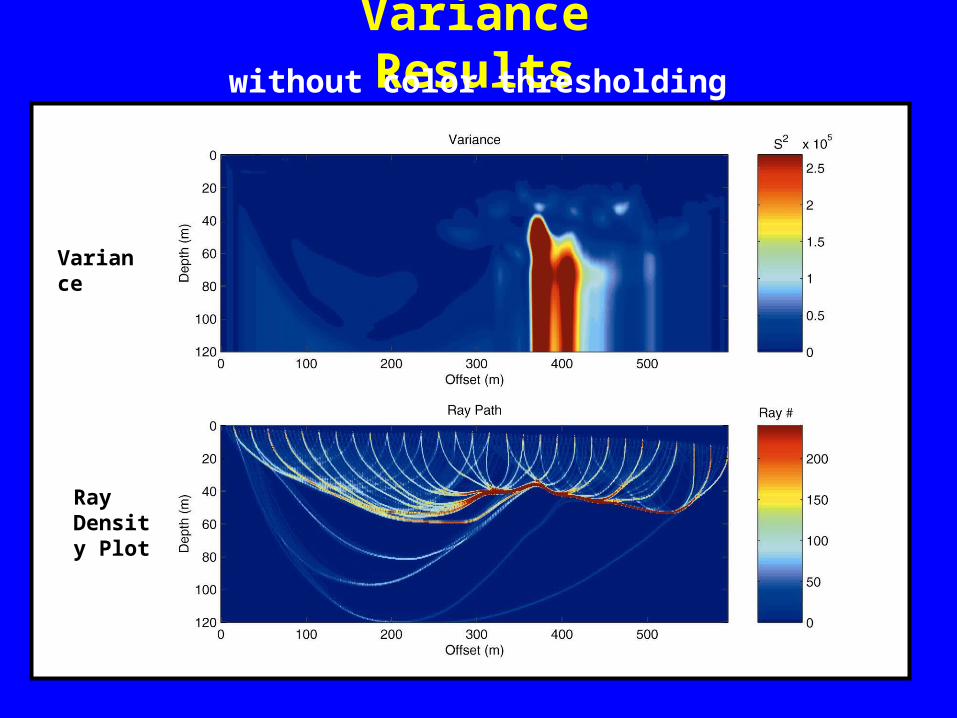
Variance Results
Variance
Ray Density Plot
without color thresholding