Embed Size (px)
Citation preview

Advanced Sensitivity Analyses: Advanced Sensitivity Analyses: Probabilistic, Correlated and Probabilistic, Correlated and
ScenarioScenario
July 26, 2006July 26, 2006Mendel E. Singer, Ph.D.Mendel E. Singer, Ph.D.Case School of MedicineCase School of Medicine
[email protected]@case.edu
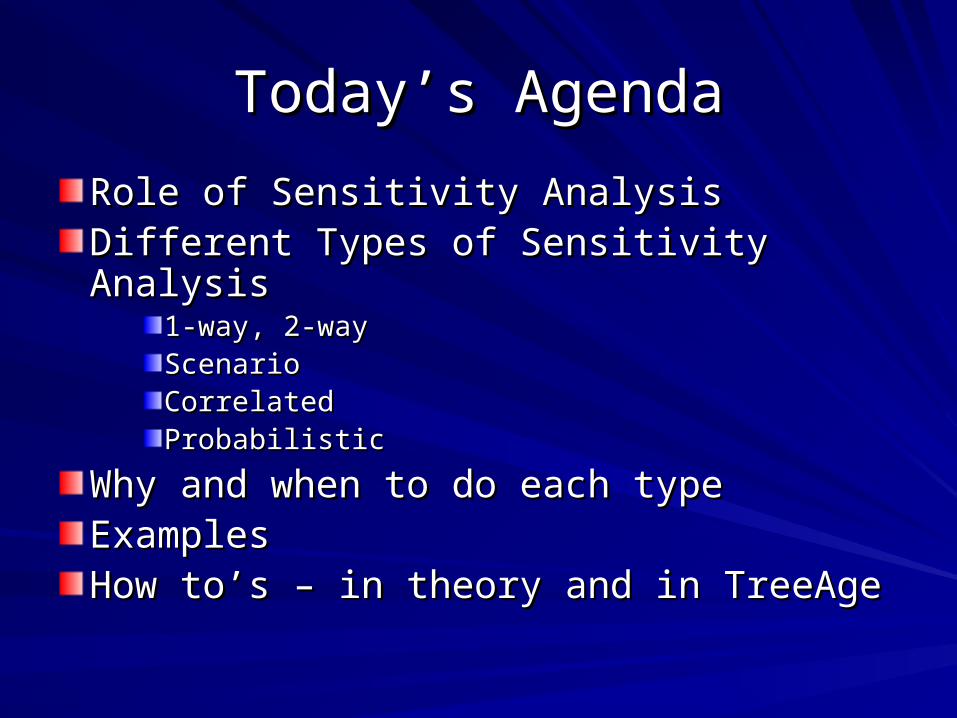
Today’s AgendaToday’s Agenda
Role of Sensitivity AnalysisRole of Sensitivity AnalysisDifferent Types of Sensitivity AnalysisDifferent Types of Sensitivity Analysis
1-way, 2-way1-way, 2-wayScenarioScenarioCorrelatedCorrelatedProbabilisticProbabilistic
Why and when to do each typeWhy and when to do each typeExamplesExamplesHow to’s – in theory and in TreeAgeHow to’s – in theory and in TreeAge
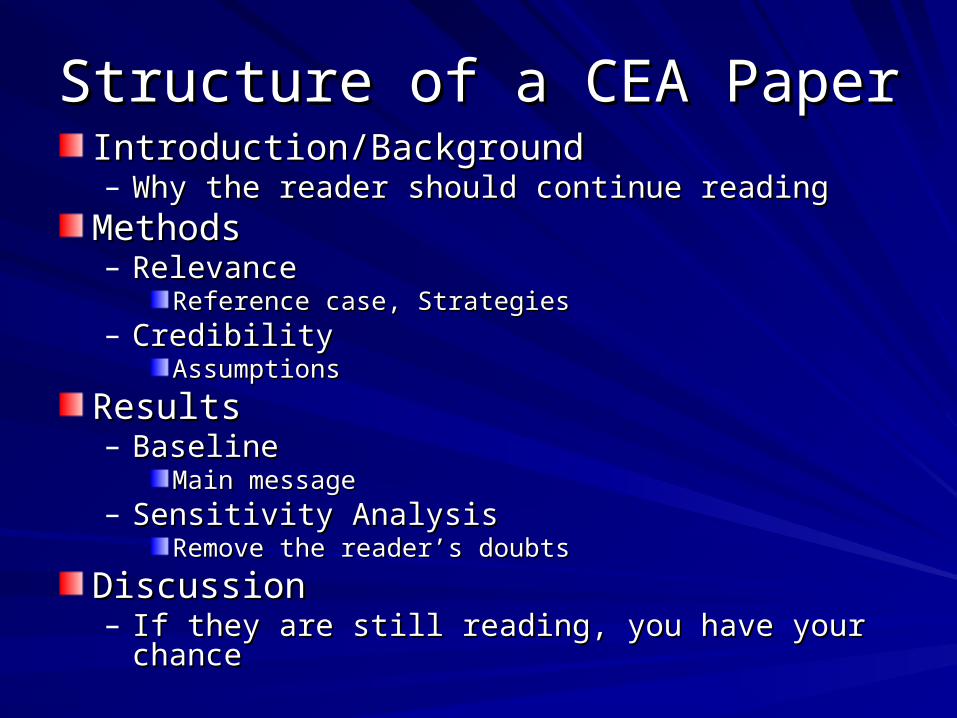
Structure of a CEA PaperStructure of a CEA PaperIntroduction/BackgroundIntroduction/Background– Why the reader should continue readingWhy the reader should continue reading
MethodsMethods– RelevanceRelevance
Reference case, StrategiesReference case, Strategies– CredibilityCredibility
AssumptionsAssumptions
ResultsResults– BaselineBaseline
Main messageMain message– Sensitivity AnalysisSensitivity Analysis
Remove the reader’s doubtsRemove the reader’s doubts
DiscussionDiscussion– If they are still reading, you have your chanceIf they are still reading, you have your chance

11stst Order Uncertainty Order Uncertainty
Variability across patientsVariability across patients– Not all patients alikeNot all patients alike
Different characteristics lead to different resultsDifferent characteristics lead to different results
Different mean values for a parameterDifferent mean values for a parameter
– All Patients AlikeAll Patients AlikeE.g. simulated cohort of identical patients or E.g. simulated cohort of identical patients or patient subgroupspatient subgroups
Probabilistic vs. DeterministicProbabilistic vs. Deterministic
Variability in outcomes – results not always the Variability in outcomes – results not always the samesame

22ndnd Order Uncertainty Order Uncertainty
Parameter value/distribution not known Parameter value/distribution not known with certainty with certainty – Origin of the estimateOrigin of the estimate
Clinical trialsClinical trials
Retrospective studyRetrospective study
Variation in results across published studiesVariation in results across published studies
Expert opinionExpert opinion
Variability around the parameter meanVariability around the parameter mean
Structural UncertaintyStructural Uncertainty
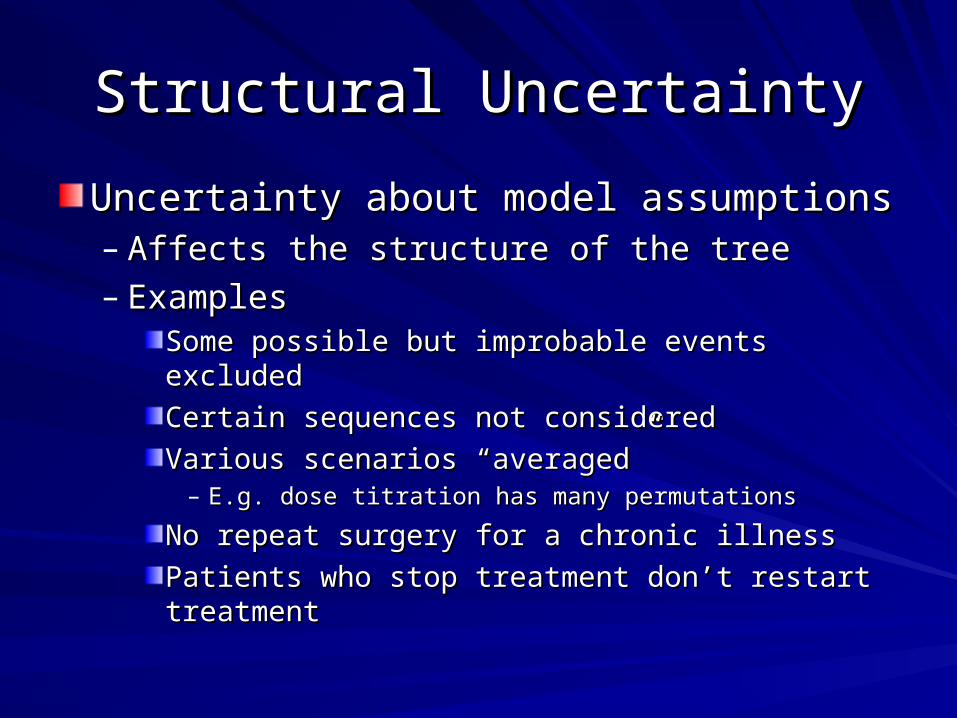
Uncertainty about model assumptionsUncertainty about model assumptions– Affects the structure of the treeAffects the structure of the tree– ExamplesExamples
Some possible but improbable events excludedSome possible but improbable events excluded
Certain sequences not consideredCertain sequences not considered
Various scenarios “averaged”Various scenarios “averaged”– E.g. dose titration has many permutationsE.g. dose titration has many permutations
No repeat surgery for a chronic illnessNo repeat surgery for a chronic illness
Patients who stop treatment don’t restart treatmentPatients who stop treatment don’t restart treatment

Types of Sensitivity AnalysisTypes of Sensitivity Analysis
1-Way1-Way
2-Way2-Way
ScenarioScenario
CorrelatedCorrelated
ProbabilisticProbabilistic
1-Way Sensitivity Analysis1-Way Sensitivity Analysis
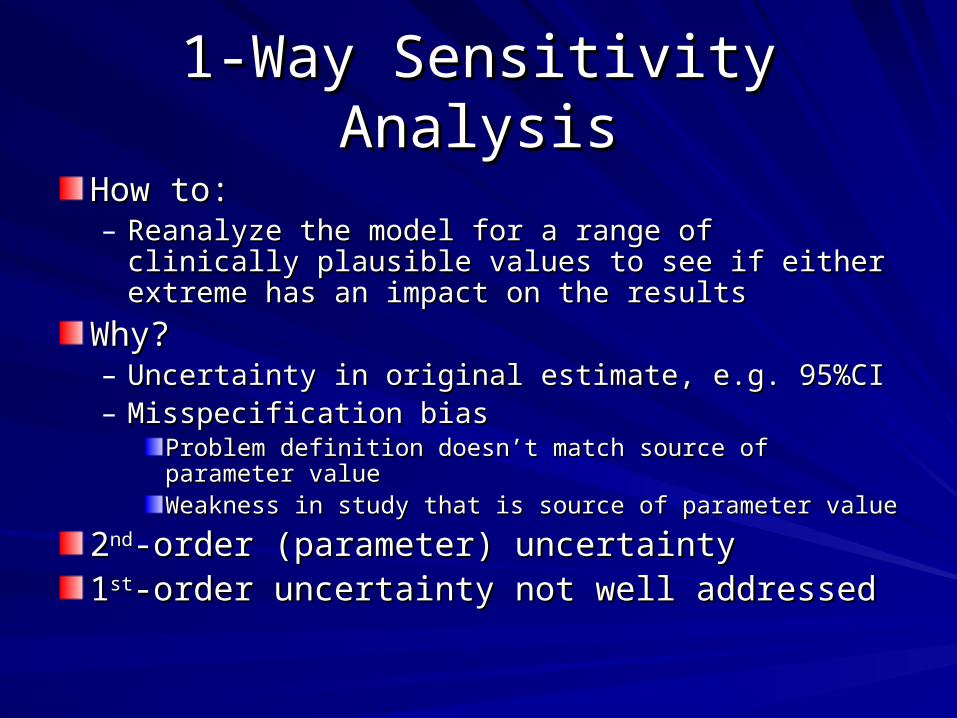
How to:How to:– Reanalyze the model for a range of clinically plausible Reanalyze the model for a range of clinically plausible
values to see if either extreme has an impact on the values to see if either extreme has an impact on the resultsresults
Why?Why?– Uncertainty in original estimate, e.g. 95%CIUncertainty in original estimate, e.g. 95%CI– Misspecification biasMisspecification bias
Problem definition doesn’t match source of parameter valueProblem definition doesn’t match source of parameter valueWeakness in study that is source of parameter valueWeakness in study that is source of parameter value
22ndnd-order (parameter) uncertainty-order (parameter) uncertainty11stst-order uncertainty not well addressed-order uncertainty not well addressed

1-Way Sensitivity Analysis (2)1-Way Sensitivity Analysis (2)
Good for removing doubts about a Good for removing doubts about a “problem” parameter“problem” parameter
Good for identifying research prioritiesGood for identifying research priorities
Easy to understandEasy to understand
When?When?– Expected in every decision analysis/cost-Expected in every decision analysis/cost-
effectiveness analysiseffectiveness analysis

2-Way Sensitivity Analysis2-Way Sensitivity Analysis
How to:How to:– Select 2 parametersSelect 2 parameters– Consider combinations of values for the 2 Consider combinations of values for the 2
parameters, keeping the values for each within a parameters, keeping the values for each within a clinically plausible rangeclinically plausible range
– For each combination determine the point of For each combination determine the point of indifference between the strategies, i.e. threshold indifference between the strategies, i.e. threshold value value
– Graph the point of indifference for each combinationGraph the point of indifference for each combination– Are there regions where the conclusion changes?Are there regions where the conclusion changes?
2-Way Sensitivity Analysis (2)2-Way Sensitivity Analysis (2)
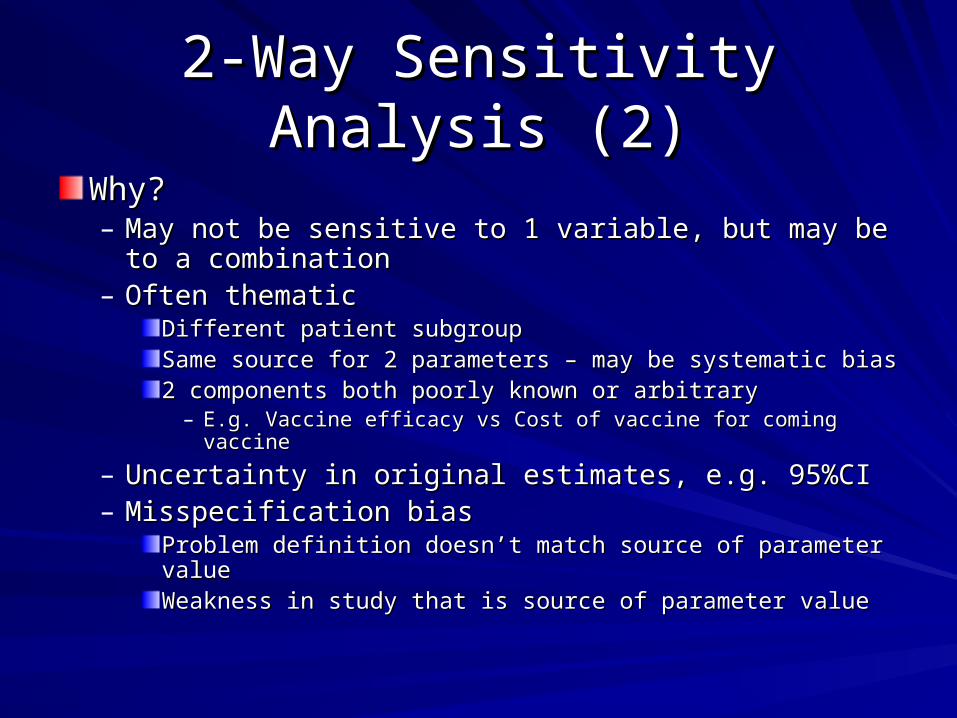
Why?Why?– May not be sensitive to 1 variable, but may be to a May not be sensitive to 1 variable, but may be to a
combinationcombination– Often thematicOften thematic
Different patient subgroupDifferent patient subgroupSame source for 2 parameters – may be systematic biasSame source for 2 parameters – may be systematic bias2 components both poorly known or arbitrary2 components both poorly known or arbitrary
– E.g. Vaccine efficacy vs Cost of vaccine for coming vaccineE.g. Vaccine efficacy vs Cost of vaccine for coming vaccine
– Uncertainty in original estimates, e.g. 95%CIUncertainty in original estimates, e.g. 95%CI– Misspecification biasMisspecification bias
Problem definition doesn’t match source of parameter valueProblem definition doesn’t match source of parameter valueWeakness in study that is source of parameter valueWeakness in study that is source of parameter value

2-Way Sensitivity Analysis (3)2-Way Sensitivity Analysis (3)
22ndnd-order (parameter) uncertainty-order (parameter) uncertainty
11stst-order uncertainty somewhat addressed-order uncertainty somewhat addressed
Difficult to understand for oral Difficult to understand for oral presentations or for audience in presentations or for audience in experienced in methodsexperienced in methods
When to do?When to do?– Usually only done when there is a strong Usually only done when there is a strong
reason (thematically linked parameters)reason (thematically linked parameters)
3-way sensitivity analysis3-way sensitivity analysis
Can be done with 3-D graphs, ORCan be done with 3-D graphs, ORDone with animation on a computer to Done with animation on a computer to simulate the 3simulate the 3rdrd dimension dimensionTreeAge can do itTreeAge can do itMany people can grasp it, though the Many people can grasp it, though the simulation won’t work in printsimulation won’t work in printI cannot grasp it, so learn it from someone I cannot grasp it, so learn it from someone else! Sorry, my brain only works in 2 else! Sorry, my brain only works in 2 dimensionsdimensions

Scenario Sensitivity AnalysisScenario Sensitivity Analysis
How to:How to:– Create a descriptive scenario of interest that Create a descriptive scenario of interest that
leads to changes in parameter values and/or leads to changes in parameter values and/or changes in the structure of the modelchanges in the structure of the model
– Change the tree and parameter values as Change the tree and parameter values as neededneeded
– Rerun the baseline analysisRerun the baseline analysis
Scenario Sensitivity Analysis (2)Scenario Sensitivity Analysis (2)
Why?Why?– Alternative problem definitionAlternative problem definition
E.g. different setting or patient populationE.g. different setting or patient population
– Need to change more than 2 parametersNeed to change more than 2 parameters– Don’t need combinations of values of 2 Don’t need combinations of values of 2
parameters, just 1 specific combinationparameters, just 1 specific combination– Important clinical scenario which either:Important clinical scenario which either:
1- and 2-way sensitivity analyses won’t address1- and 2-way sensitivity analyses won’t address
Forms a valid, alternative baseline analysisForms a valid, alternative baseline analysis
Scenario Sensitivity Analysis (3)Scenario Sensitivity Analysis (3)
22ndnd-order (parameter) uncertainty-order (parameter) uncertainty11stst-order uncertainty to a degree-order uncertainty to a degreeStructural uncertaintyStructural uncertaintyGood for removing doubts about a small Good for removing doubts about a small variation on the problem definitionvariation on the problem definitionUseful when there are really Useful when there are really severalseveral related related problems to addressproblems to addressEasy to understandEasy to understandWhen to do?When to do?– Only done when there is a clear reasonOnly done when there is a clear reason

Scenario Sensitivity Analysis: ExamplesScenario Sensitivity Analysis: Examples
Patient with a common comorbid condition that Patient with a common comorbid condition that was excluded in baselinewas excluded in baseline– Can affect response rates, complication rates, Can affect response rates, complication rates,
surgical mortality rates, etc…surgical mortality rates, etc…
Different setting Different setting multiple parameter changes multiple parameter changes– VA outpatient vs. managed care outpatientVA outpatient vs. managed care outpatient– Presentation to physician vs. emergency dept.Presentation to physician vs. emergency dept.– Different countryDifferent country
Different practice patterns, costs, geneticsDifferent practice patterns, costs, genetics

Scenario Sensitivity AnalysisScenario Sensitivity Analysisin TreeAgein TreeAge
No special techniques since we all have to No special techniques since we all have to do is change some default values and do is change some default values and rerun the main cost-effectiveness analysis.rerun the main cost-effectiveness analysis.Here’s what I suggest:Here’s what I suggest:– Save the tree under a new file nameSave the tree under a new file name– Edit the values to reflect those of the scenario Edit the values to reflect those of the scenario
sensitivity analysis.sensitivity analysis.– Run the cost-effectiveness analysisRun the cost-effectiveness analysis– Save your work.Save your work.
Correlated Sensitivity AnalysisCorrelated Sensitivity AnalysisHow to:How to:– Select >=2 parameters that are thematically linked Select >=2 parameters that are thematically linked
such that as one parameter changes in one direction, such that as one parameter changes in one direction, the others are known to change in the same or the others are known to change in the same or opposite direction, but not stay the sameopposite direction, but not stay the same
– As the main variable changes within its plausible As the main variable changes within its plausible range, each correlated variable changes in the range, each correlated variable changes in the specified direction by the same proportionate amount specified direction by the same proportionate amount in the specified rangein the specified range
– Reanalyze like 1-way sensitivity analysis on the main Reanalyze like 1-way sensitivity analysis on the main variable, with all correlated variables changing variable, with all correlated variables changing “behind the scenes”“behind the scenes”
– E.g. main variable changes to halfway between E.g. main variable changes to halfway between baseline and upper limit, correlated variables also baseline and upper limit, correlated variables also move halfway between its baseline value and the limit move halfway between its baseline value and the limit of the range.of the range.

Correlated Sensitivity Analysis (2)Correlated Sensitivity Analysis (2)
Why?Why?– Possible systematic biasPossible systematic bias
From same underlying studyFrom same underlying study– May have had a healthier or sicker population May have had a healthier or sicker population – May have possible bias in methods leading to results May have possible bias in methods leading to results
that are biased in one directionthat are biased in one direction
Same method for each parameter, possible biasSame method for each parameter, possible bias– E.g. utilities all done in providers as proxies for patientsE.g. utilities all done in providers as proxies for patients

Correlated Sensitivity Analysis (3)Correlated Sensitivity Analysis (3)
22ndnd-order (parameter) uncertainty-order (parameter) uncertainty11stst-order uncertainty not very well-order uncertainty not very wellStructural uncertainty – not reallyStructural uncertainty – not reallyGood for dealing with cases where there is clear reason Good for dealing with cases where there is clear reason for concern that a systematic bias is present, or when for concern that a systematic bias is present, or when there is clear reason to believe that some readers will there is clear reason to believe that some readers will think there is a systematic bias and this approach can think there is a systematic bias and this approach can alleviate those fears and restore reader confidencealleviate those fears and restore reader confidenceEasy to understandEasy to understandWhen to do?When to do?– Any time there is a valid or perceived fear of systematic biasAny time there is a valid or perceived fear of systematic bias

Correlated Sensitivity Analysis: ExamplesCorrelated Sensitivity Analysis: Examples
Utility values for stages of a diseaseUtility values for stages of a disease– Answer what if the impact of the illness has Answer what if the impact of the illness has
systematically been under-or over-estimatedsystematically been under-or over-estimated
Surgical mortality inherent in the Surgical mortality inherent in the procedure, not due to patient differencesprocedure, not due to patient differences– Affects surgical mortality rates for different Affects surgical mortality rates for different
paths in tree, e.g. before or after some other paths in tree, e.g. before or after some other intervention or complicationintervention or complication

Probabilistic Sensitivity AnalysisProbabilistic Sensitivity Analysis
How to:How to:– For each parameter’s point estimate, create a For each parameter’s point estimate, create a
probability distribution for the mean valueprobability distribution for the mean value– Create any needed correlationsCreate any needed correlations– Create a random sample of parameter values using Create a random sample of parameter values using
the distributionsthe distributions– Run an incremental cost-effectiveness analysis using Run an incremental cost-effectiveness analysis using
this sample’s parameter valuesthis sample’s parameter values– Repeat for 1000 samples and analyze resultsRepeat for 1000 samples and analyze results
Plot the individual samples showing the CE quadrantsPlot the individual samples showing the CE quadrantsProportion of time a strategy is cost-effective calculated at Proportion of time a strategy is cost-effective calculated at different values of willingness-to-paydifferent values of willingness-to-pay

Probabilistic Sensitivity Analysis (2)Probabilistic Sensitivity Analysis (2)
Why?Why?– Many parameters, all with uncertaintyMany parameters, all with uncertainty– Impact of variation simultaneously in all Impact of variation simultaneously in all
variables is unanswered by traditional variables is unanswered by traditional methods of sensitivity analysismethods of sensitivity analysis
– Traditional incremental CEA based on mean Traditional incremental CEA based on mean values creates a single value, which can be values creates a single value, which can be misleading since it ignores the inherent misleading since it ignores the inherent variation due to uncertainty in all parameter variation due to uncertainty in all parameter estimatesestimates

Probabilistic Sensitivity Analysis (3)Probabilistic Sensitivity Analysis (3)
22ndnd-order uncertainty – does this well-order uncertainty – does this wellDoes not address 1Does not address 1stst-order uncertainty and -order uncertainty and structural uncertaintystructural uncertaintyDoes not address misspecificationDoes not address misspecificationComplements rather than replaces traditional 1- Complements rather than replaces traditional 1- and 2-way sensitivity analysesand 2-way sensitivity analysesWhen to do?When to do?– Almost always. Can be exceptions, and sometimes it Almost always. Can be exceptions, and sometimes it
is obvious it won’t change anything.is obvious it won’t change anything.– Becoming expected, and some journals and many Becoming expected, and some journals and many
referees require itreferees require it

Probability DistributionsProbability Distributions
UniformUniform– Good for numbers based on arbitrary choice or expert opinionGood for numbers based on arbitrary choice or expert opinion
NormalNormal– Good when based on solid estimatesGood when based on solid estimates– Negative numbers allowedNegative numbers allowed
BetaBeta– Restricts values to 0,1Restricts values to 0,1– Allows all kinds of shapesAllows all kinds of shapes
Log-NormalLog-Normal– Good for skewed dataGood for skewed data– NonnegativeNonnegative
GammaGamma– NonnegativeNonnegative– Different shapesDifferent shapes

WARNING!!WARNING!!PROCEED AT RISK!PROCEED AT RISK!
What follows is my own personal approach What follows is my own personal approach to conducting probabilistic sensitivity to conducting probabilistic sensitivity analysis.analysis.Others use different distributions.Others use different distributions.I am only showing you what I do, and will I am only showing you what I do, and will demonstrate the steps to actually doing it.demonstrate the steps to actually doing it.Any dangers to your personal or Any dangers to your personal or professional health are not the professional health are not the responsibility of the presenter or the VA.responsibility of the presenter or the VA.

Key IdeaKey Idea
For each parameter, take the baseline For each parameter, take the baseline value as the mean for your distributionvalue as the mean for your distribution
Use the upper and lower limits from your Use the upper and lower limits from your 1-way sensitivity analysis to form the limits 1-way sensitivity analysis to form the limits of an estimated 95% confidence intervalof an estimated 95% confidence interval
Approximate the width of the confidence Approximate the width of the confidence interval as mean +/- 2 standard deviations interval as mean +/- 2 standard deviations (thank you Andy Briggs).(thank you Andy Briggs).

CostsCosts
If based on solid estimates (e.g. Medicare If based on solid estimates (e.g. Medicare reimbursement rates) for known specific reimbursement rates) for known specific health care utilizations, I used a Normal health care utilizations, I used a Normal distribution with confidence interval +/- distribution with confidence interval +/- 25% of the mean value.25% of the mean value.
25% of mean = 2 standard deviations25% of mean = 2 standard deviations
Standard deviation = .125 * meanStandard deviation = .125 * mean
Costs (2)Costs (2)
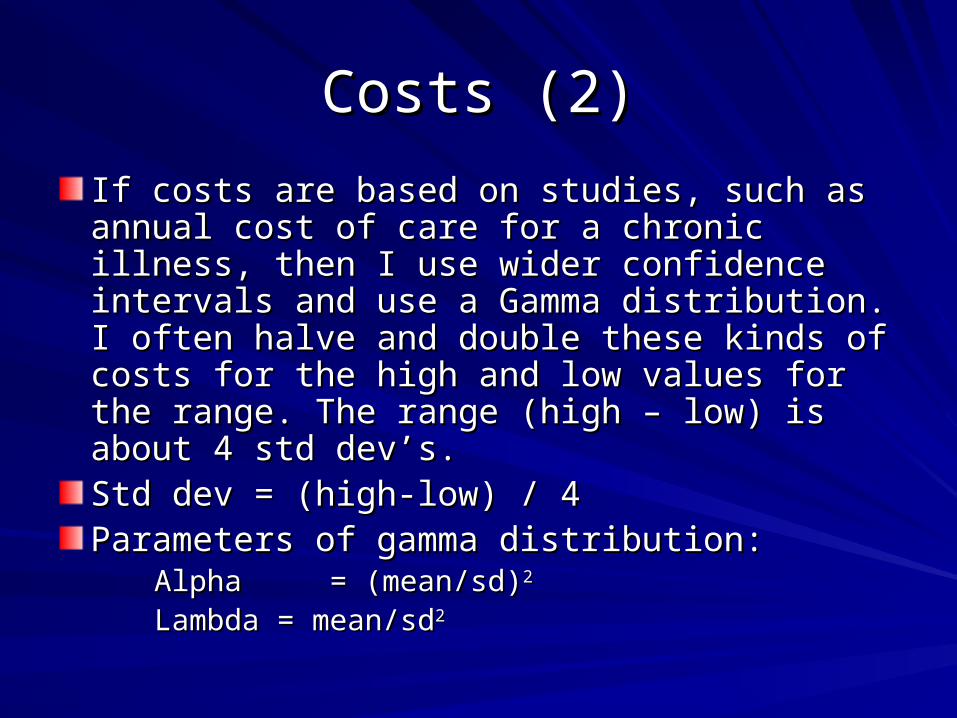
If costs are based on studies, such as annual If costs are based on studies, such as annual cost of care for a chronic illness, then I use wider cost of care for a chronic illness, then I use wider confidence intervals and use a Gamma confidence intervals and use a Gamma distribution. I often halve and double these kinds distribution. I often halve and double these kinds of costs for the high and low values for the of costs for the high and low values for the range. The range (high – low) is about 4 std range. The range (high – low) is about 4 std dev’s.dev’s.Std dev = (high-low) / 4Std dev = (high-low) / 4Parameters of gamma distribution:Parameters of gamma distribution: Alpha = (mean/sd)Alpha = (mean/sd)22
Lambda = mean/sdLambda = mean/sd22

Probabilities and UtilitiesProbabilities and Utilities
I use a beta distribution to keep it between I use a beta distribution to keep it between 0 and 1. It is also flexible in shape.0 and 1. It is also flexible in shape.
sd = (high – low) / 4sd = (high – low) / 4
n = (mean * (1-mean) / sdn = (mean * (1-mean) / sd22) – 1) – 1
r = mean * nr = mean * n
Parameters of Beta distribution:Parameters of Beta distribution: alpha = ralpha = r
beta = n - rbeta = n - r

Problem DefinitionProblem Definition
Reference CaseReference Case– 60-year old male60-year old male– 4 cm abdominal aortic aneurysm4 cm abdominal aortic aneurysm– Otherwise, patient is in good healthOtherwise, patient is in good health
Surgery vs Watchful WaitingSurgery vs Watchful WaitingTime horizon: 5 yearsTime horizon: 5 yearsEffectiveness Measure: SurvivalEffectiveness Measure: Survival– Alive = 1Alive = 1– Dead = 0Dead = 0

State Transition DiagramState Transition Diagram
AneurysmAcute
Expansion
WellDead
1. If Death from other causes was considered, one might show all states with an arrow to death, or merely note this in text below the diagram.
2. Not shown are arrows from a state to itself, which is valid for all states except Acute Expansion.

Live#
cElectiveSurgery / 4.65
DiepDieElectiveSurgery
cElectiveSurgery / 0
Elective Surgery
Well
0Dead
0Die Before Surgery
pDieBeforeSurgeryDead
Well#
Well
Dead
pDieDuringSurgeryAfterRuptureDead
Surgery#
RupturepRupture
Well#
Well
DeadpDieSurgeryNoRupture
Dead
SurgeryNo Rupture#
Acute Expansion
0
Acute ExpansionpExpansion
Acute Expansion
No Change#
Aneurysm
Aneurysm1
Watchful Waiting
4 cm AAA

CostsCosts
Cost of Annual Screening, $579Cost of Annual Screening, $579Normal distributionNormal distribution
Mean = 579Mean = 579
sd = .125 * mean = .125*579 = 72sd = .125 * mean = .125*579 = 72
Cost of elective surgery, $49,381Cost of elective surgery, $49,381Normal distributionNormal distribution
Mean = 49,381Mean = 49,381
sd = .125 * 49,381 = 6,173sd = .125 * 49,381 = 6,173

Annual Discount RateAnnual Discount Rate
Baseline = 3%Baseline = 3%
Range 1% - 5%Range 1% - 5%
Uniform distributionUniform distributionLow value = 0.01Low value = 0.01
High Value = 0.05High Value = 0.05

ProbabilitiesProbabilities
Annual probability of expansionAnnual probability of expansionBaseline = .033 Range = .016 - .049Baseline = .033 Range = .016 - .049
sd = (high-low)/4 = (.049 - .016)/4 = .00825sd = (high-low)/4 = (.049 - .016)/4 = .00825
n = (mean*(1-mean)/sdn = (mean*(1-mean)/sd22)–1)–1((.033)(.967)/.00825((.033)(.967)/.0082522)-1= 467.85)-1= 467.85
r = mean * n = .033 * 468 = 15.44r = mean * n = .033 * 468 = 15.44
Parameters of Beta distribution:Parameters of Beta distribution: alpha = r = 15.44alpha = r = 15.44
beta = n – r = 467.85 – 15.44 = 452.41beta = n – r = 467.85 – 15.44 = 452.41

We first need to enter the distributions to be used in the PSA.
Select Distributions from the Values menu.
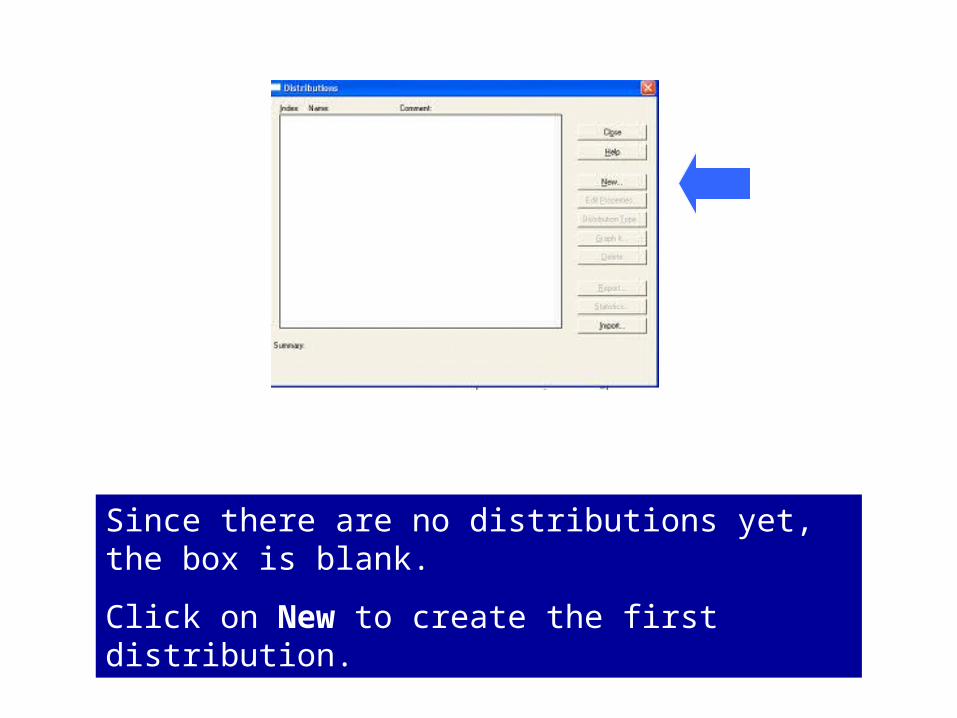
Since there are no distributions yet, the box is blank.
Click on New to create the first distribution.

You are shown the different distributions, each depicted with a typical shape. It defaults to the Normal dbn. This can be seen by the green shading in the diagram for Normal.

For the selected distribution, the pertinent parameters defining the distribution are shown on the right, where you can set these values.

For the cost of annual screening, the parameters of the Normal distribution were determined to be: mean = 579 and std deviation of 72, so this was entered. Then click OK.
We will need to create a different distribution for each parameter.
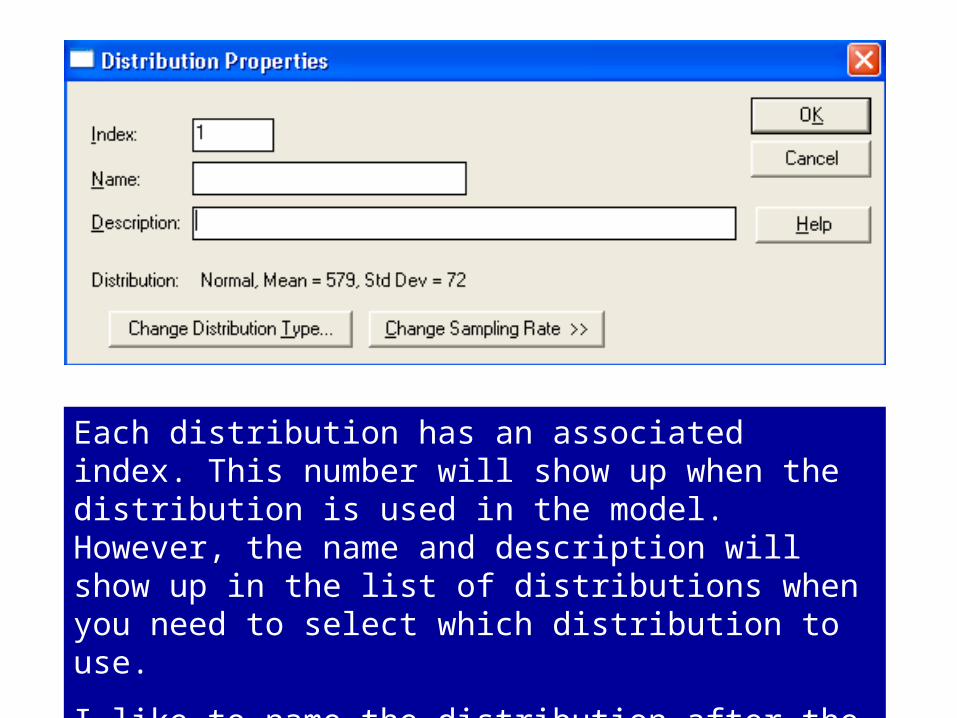
Each distribution has an associated index. This number will show up when the distribution is used in the model. However, the name and description will show up in the list of distributions when you need to select which distribution to use.
I like to name the distribution after the parameter it is associated with.

The name must be distinct from any name already used for a variable. But you don’t have to enter a name. I tend to not create a name at all, but instead, for the description I enter exactly the name of the variable I created in TreeAge.
Now click OK to finish creating this distribution, and go on to the other variables.

The distribution we just created now shows up in the list of distributions. We will need to enter distributions for each of the parameters. Let’s create one more together, but this time let’s do the probability of acute expansion. It requires a beta distribution.
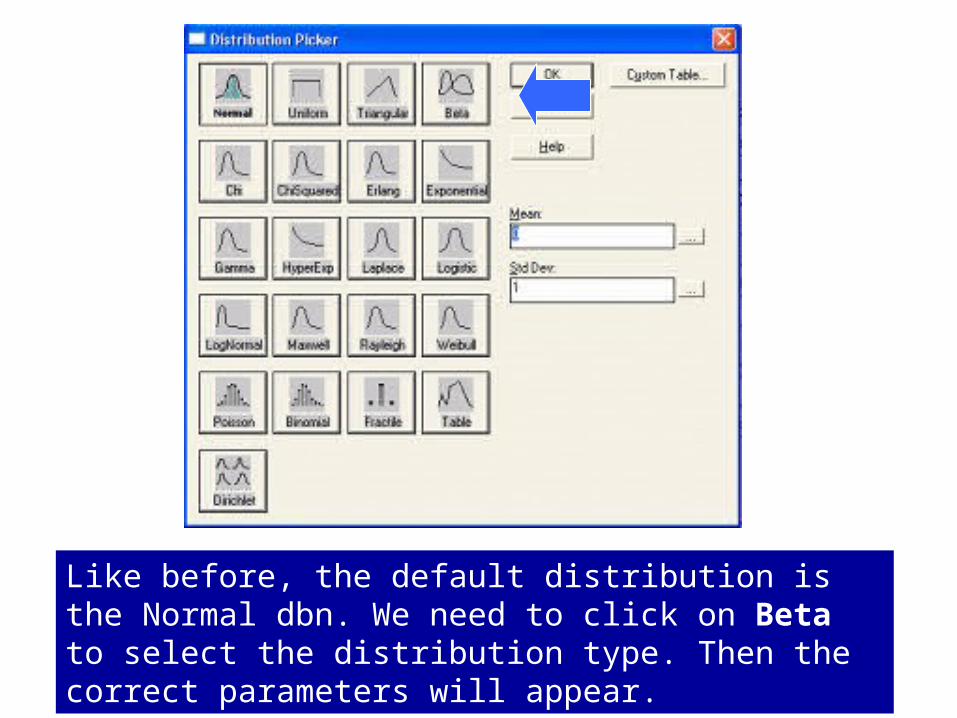
Like before, the default distribution is the Normal dbn. We need to click on Beta to select the distribution type. Then the correct parameters will appear.
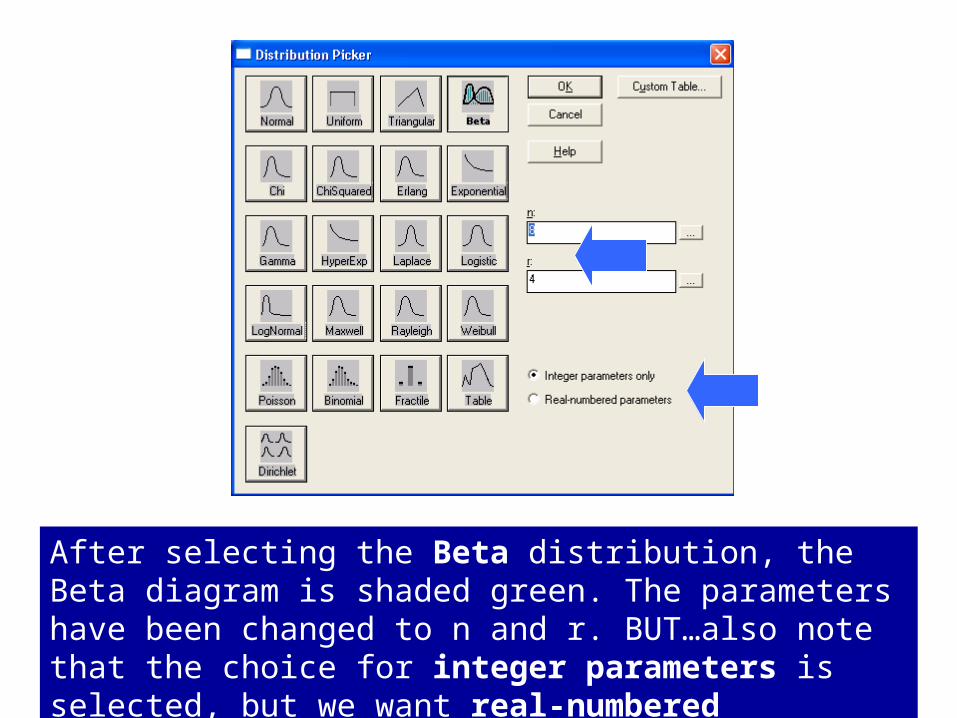
After selecting the Beta distribution, the Beta diagram is shaded green. The parameters have been changed to n and r. BUT…also note that the choice for integer parameters is selected, but we want real-numbered parameters.

After selecting real-numbered parameters, the parameters for the Beta distribution are changed to alpha and beta. We need to change the default values to 15.44 and 452.41.

Now we can click OK and then finish up creation of this distribution.

At this screen, the index was defaulted for me. I then typed in the description as the name of the corresponding variable.
The order you enter the variables is the order for the index, which is used to list the distributions when selecting a distribution to use in the model.
You might want the order to be alphabetical. In this case, that means this should be index 8. So, I’ll change it before clicking OK to be done.

Live#
cElectiveSurgery / 4.65
DiepDieElectiveSurgery
cElectiveSurgery / 0
Elective Surgery
Well
0Dead
0Die Before Surgery
pDieBeforeSurgeryDead
Well#
Well
Dead
pDieDuringSurgeryAfterRuptureDead
Surgery#
RupturepRupture
Well#
Well
DeadpDieSurgeryNoRupture
Dead
SurgeryNo Rupture#
Acute Expansion
0
Acute ExpansionpExpansion
Acute Expansion
No Change#
Aneurysm
Aneurysm1
Watchful Waiting
4 cm AAA
Back to the tree. We need to change the values of the variables so that instead of a default value, we supply the distribution. The default values all show up in the variables window of the root node. First, we have to see the variables window. Select the root node and then…..

Select Show variables window from the Values menu.

Now we can select each variable one at a time, and change the value assignment from a value to its corresponding distribution. Let’s select cAnnualScreening.

The default baseline value of 579 is showing. We want to select the option on the right to Insert Distribution,

Select the distribution cAnnualScreening, and click Use.

The distribution is now being used for the value of cAnnualScreening. Note that the distribution is identified by the index number, and not the name or description for the distribution. Then click OK.
We can then use the same technique to enter the rest of the distributions.

When all done, the variables window looks like this. Not very informative. After doing this, we may want to see the variables, so select Preferences from the Edit menu.

Select the option to Show definitions. This has the advantage of letting you see the variables, but it also means the tree takes up a lot more space. This means you don’t see as much of the tree at once.


Before running the analysis, we should check to see if the numeric formatting is OK. Select Numeric Formatting from the Edit menu.
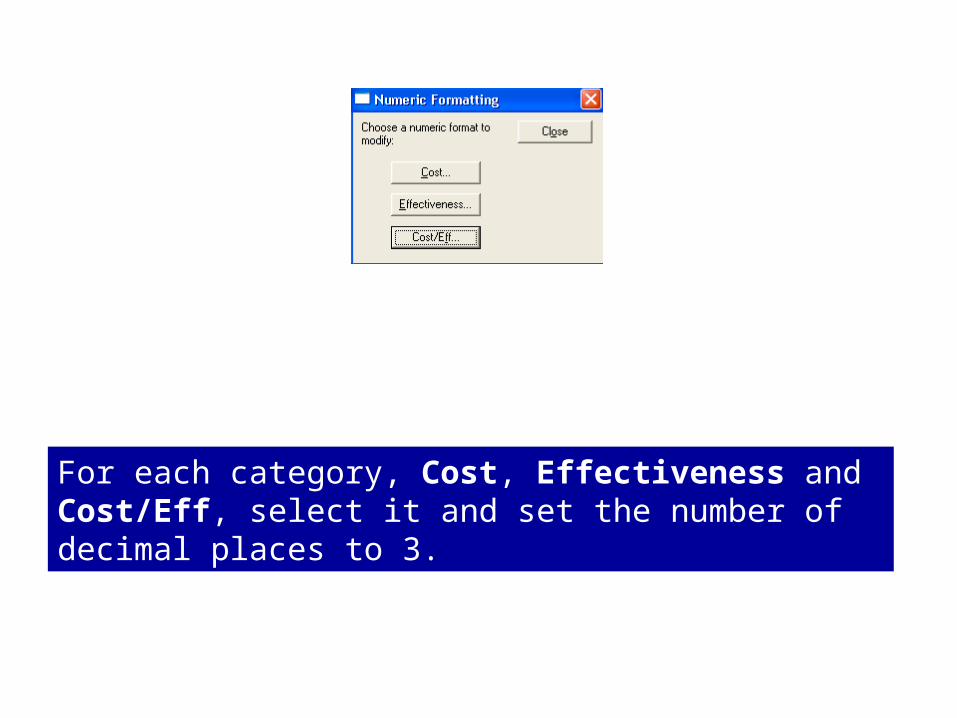
For each category, Cost, Effectiveness and Cost/Eff, select it and set the number of decimal places to 3.

Before running the PSA, it is a good idea to first run the cost-effectiveness analysis again to see if you get the same answers as before. TreeAge will use the mean values of the distributions for the parameter values if you do an ordinary cost-effectiveness analysis.
Whew! Same answer!

To run the PSA, be sure the root node is selected and choose from the menus:
Analysis/Monte Carlo Simulation/Sampling (PSA).

The option Sample all distributions was selected by default, and that IS what we want!
The number of samples also defaulted to what we want – namely, 1000. This arbitrary, but commonly used.
I then select More Options. This will allow me to set the seed for the random number generator.

I had to select the option at the top, Seed random number generator. This is the number used to start the algorithm TreeAge uses to create random numbers. It is chosen randomly, sort of, each time. This causes a problem – we will get different answers each time. That can make it hard to detect if we have changed something inadvertently.
Therefore, I always choose to fix the seed. I chose 1.

I had to select the option at the top, Seed random number generator. This is the number used to start the algorithm TreeAge uses to create random numbers. It is chosen randomly, sort of, each time. This causes a problem – we will get different answers each time. That can make it hard to detect if we have changed something inadvertently.
Therefore, I always choose to fix the seed. I chose 1. Easy to remember.

Now we are ready. Click on Begin.

At the bottom we are told that the statistics shown are for Elective Surgery. We can use the drop down list to see the same statistics for Watchful Waiting. Instead, lets try to see the Acceptability curve. Click on Graph.
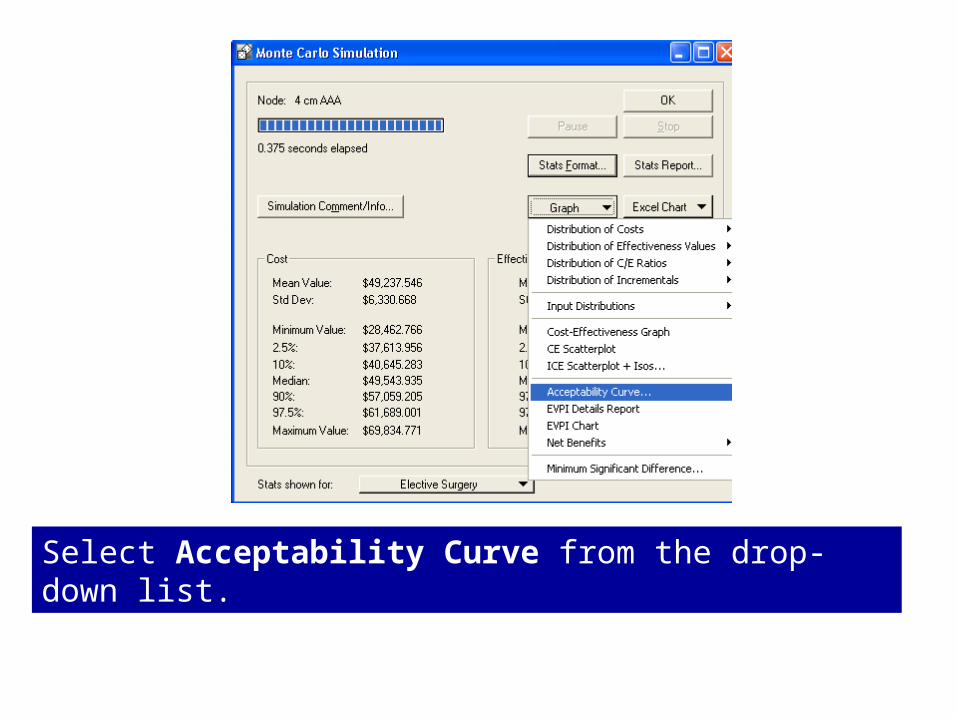
Select Acceptability Curve from the drop-down list.

Here, click on No. We want to see the pairwise comparison.

Here I selected a range from 20,000 to 100,000 for willingness to pay. By using 8 intervals, we will get results in increments of 10,000.
For the baseline, I selected Watchful Waiting.
For comparator(s) I selected Elective Surgery.

Whoops!Whoops!
Problem here. Problem here. The The Elective SurgeryElective Surgery arm is dominated. arm is dominated.PSA isn’t going to help. It will still lose even at PSA isn’t going to help. It will still lose even at the extreme end of the willingness to pay range.the extreme end of the willingness to pay range.So, for a better example of what it should look So, for a better example of what it should look like, here is a graph from an upcoming paper of like, here is a graph from an upcoming paper of mine.mine.The problem is looking at whether to use growth The problem is looking at whether to use growth factors as a first step before dose reduction of factors as a first step before dose reduction of ribavirin in Hepatitis C patients experiencing ribavirin in Hepatitis C patients experiencing anemia during combination therapy.anemia during combination therapy.

Acceptability Curve - Genotypes 2 and 3
0
0.2
0.4
0.6
0.8
1
1.2
0 20000 40000 60000 80000 100000 120000
Willingness to Pay
Pro
po
rtio
n C
ost
-Eff
ecti
ve
Darbepoetin alpha
Dose Reduction RBV
For each willingness to pay threshold, the graph plots 2 points: the proportion of the time each strategy is cost-effective among the 1000 samples. These 3 values always add up to 1, so the 2 curves always intersect at p=.5.
At $50,000/QALY or greater the darbopoetin alpha strategy is cost-effective in over 60% of the samples, and appears to be cost-effective compared to Dose Reduction.

To do correlated sensitivity analysis, we go to the properties window of one of the variables. I chose the probability of death from elective surgery. Click on Correlations.

We need to select all the variables to be correlated. I will choose just the pDieSurgeryNoRupture, which is already shown above as selected. I then click on the >> button to add it to the list of correlated variables.

TreeAge then prompts us to set whether the correlation is positive or negative. That is, when one variable changes, does the other change similarly or in the opposite direction. When done, click OK, and do so again when you return to the list (unless you want to add another correlated variable.
That’s it! Now, when you do sensitivity analysis on one of these variables, the other one will automatically change, too. I’d like to do more, but tick, tick, tick…..


![Safe Sharing on Social Networks - Case Western Reserve University · 2019-06-05 · security@case.edu [U]Tech Service Desk UNIVERSITY TECHNOLOGY . help@case.edu . CASE WESTERN R,!::SERVE](https://img.pdfslide.net/doc/110x75/5f11888d6f6a5f127d65603a/safe-sharing-on-social-networks-case-western-reserve-university-2019-06-05-securitycaseedu.jpg)