Embed Size (px)
Citation preview
Advanced Vehicle Technologies;
Outlook for Electrics, Internal
Combustion, and Alternate Fuels
Don Hillebrand
Energy Usage
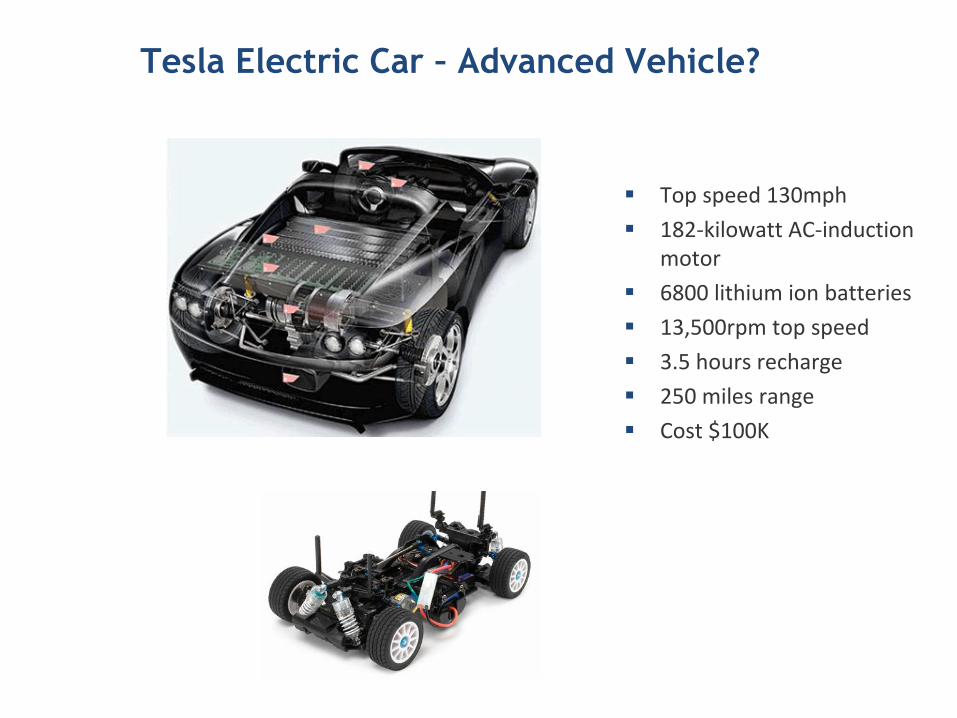
Tesla Electric Car – Advanced Vehicle?
Top speed 130mph
182-kilowatt AC-induction motor
6800 lithium ion batteries
13,500rpm top speed
3.5 hours recharge
250 miles range
Cost $100K
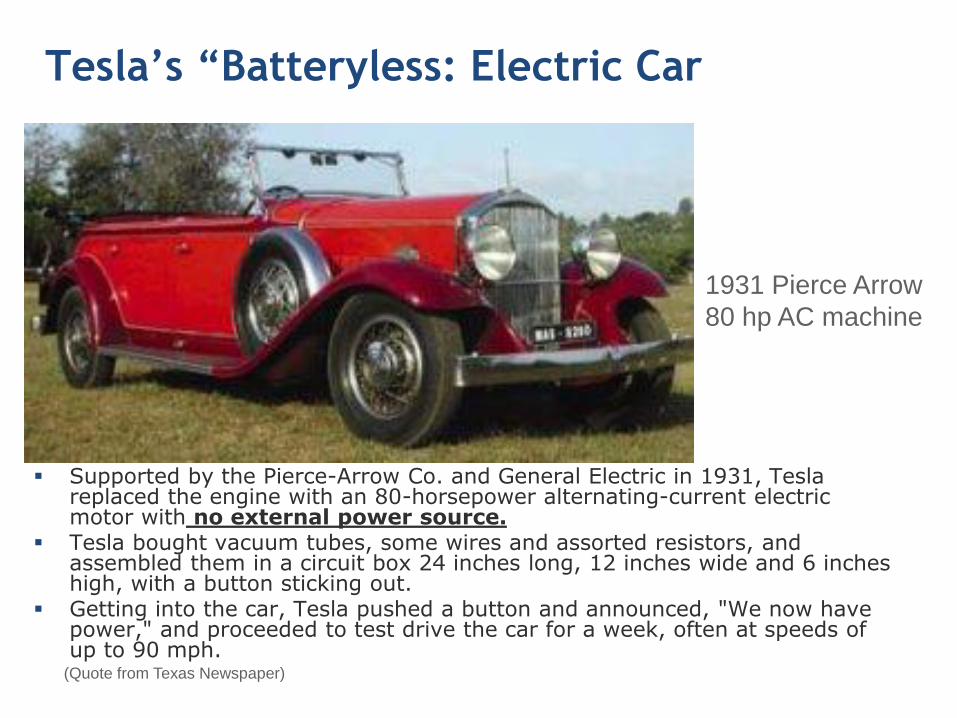
Tesla’s “Batteryless: Electric Car
Supported by the Pierce-Arrow Co. and General Electric in 1931, Tesla replaced the engine with an 80-horsepower alternating-current electric motor with no external power source.
Tesla bought vacuum tubes, some wires and assorted resistors, and assembled them in a circuit box 24 inches long, 12 inches wide and 6 inches high, with a button sticking out.
Getting into the car, Tesla pushed a button and announced, "We now have power," and proceeded to test drive the car for a week, often at speeds of up to 90 mph.
1931 Pierce Arrow
80 hp AC machine
(Quote from Texas Newspaper)
0
2 000
4 000
6 000
8 000
10 000
12 000
14 000
16 000
18 000
1980 1990 2000 2010 2020 2030
Mto
e
Other renewables
Hydro
Nuclear
Biomass
Gas
Coal
Oil
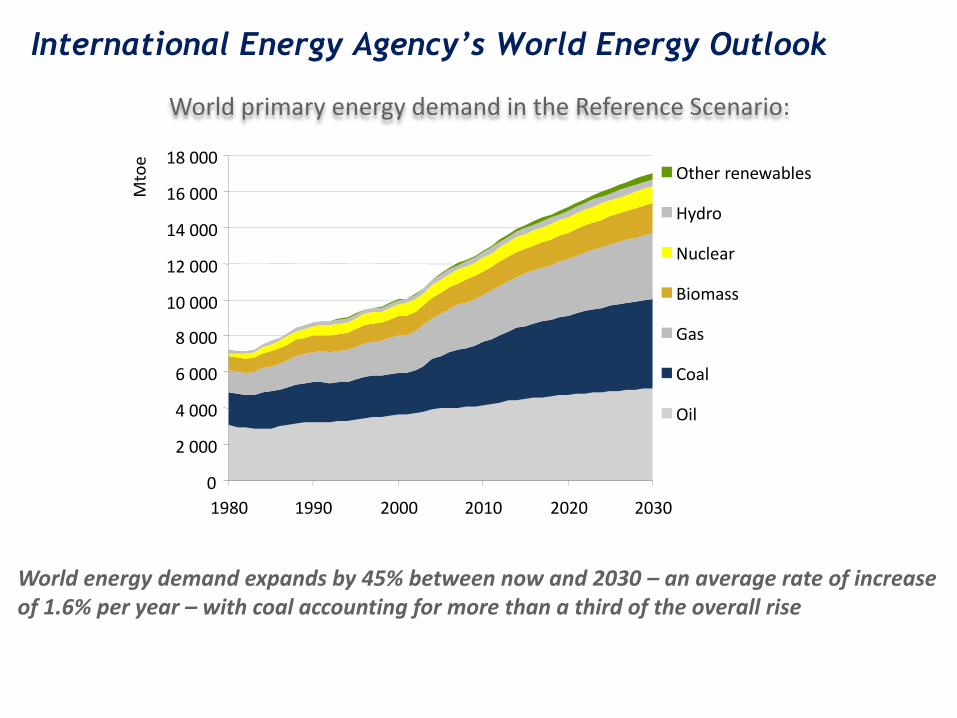
World energy demand expands by 45% between now and 2030 – an average rate of increase of 1.6% per year – with coal accounting for more than a third of the overall rise
International Energy Agency’s World Energy Outlook
World primary energy demand in the Reference Scenario:
5
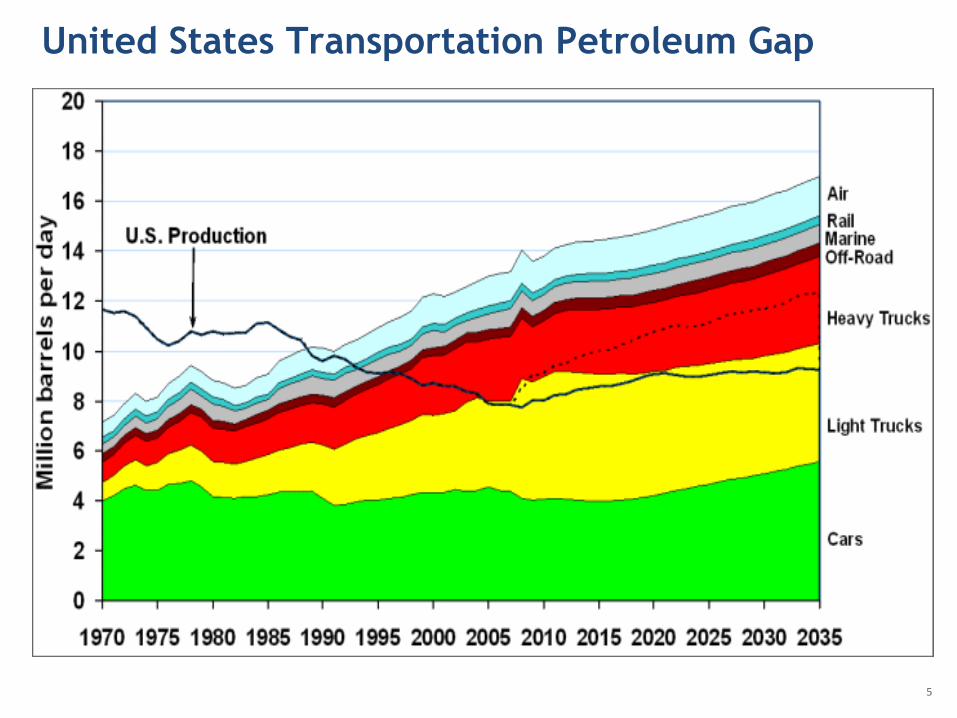
United States Transportation Petroleum Gap
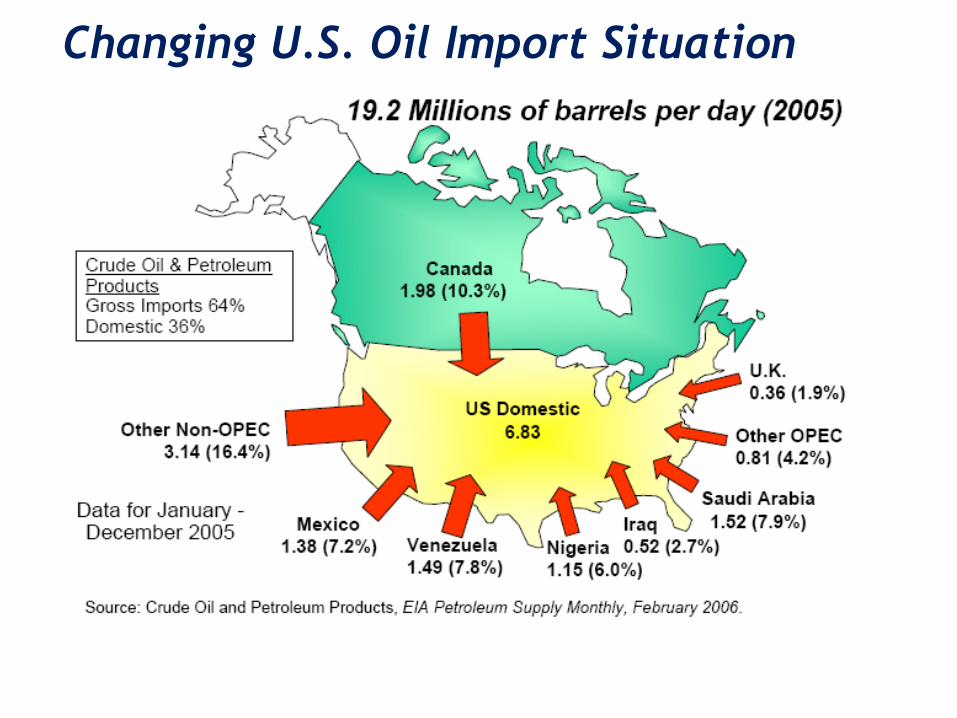
Changing U.S. Oil Import Situation
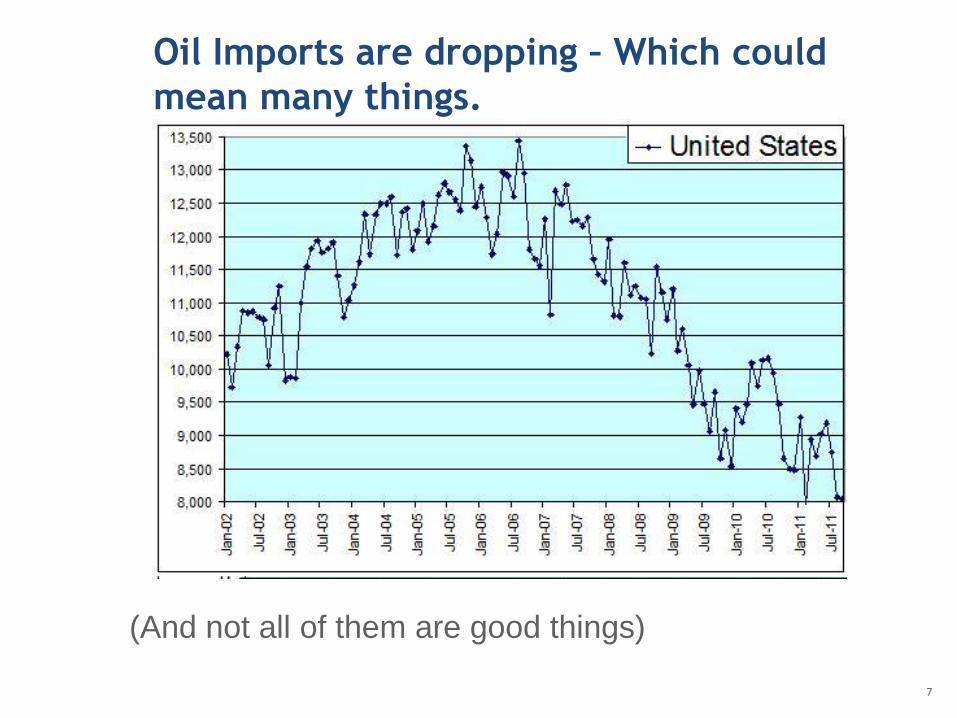
Oil Imports are dropping – Which could
mean many things.
7
(And not all of them are good things)
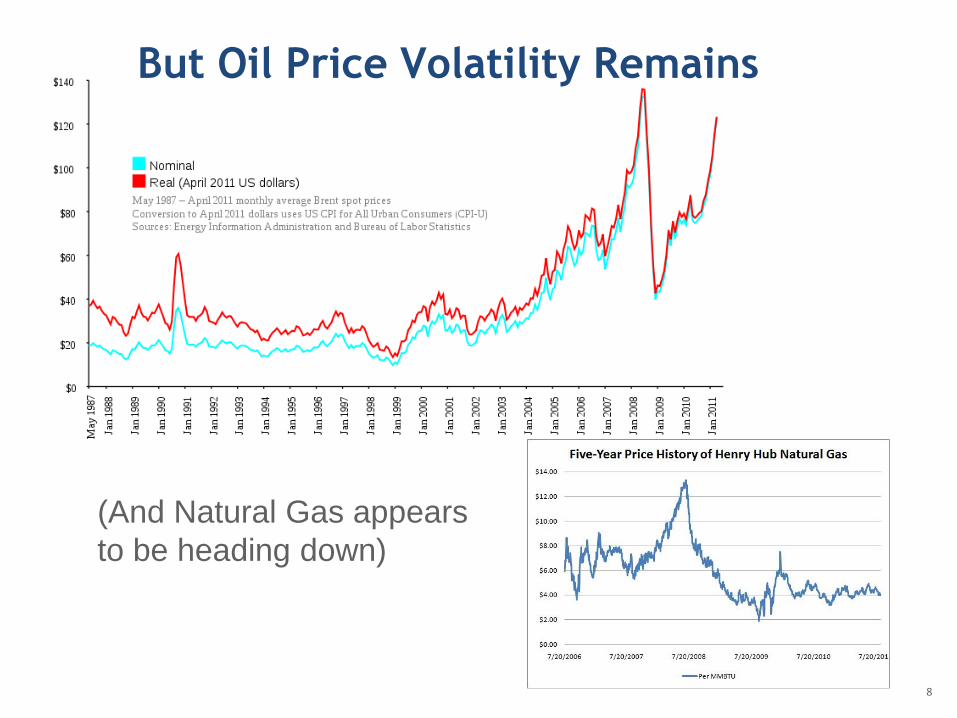
But Oil Price Volatility Remains
8
(And Natural Gas appears
to be heading down)
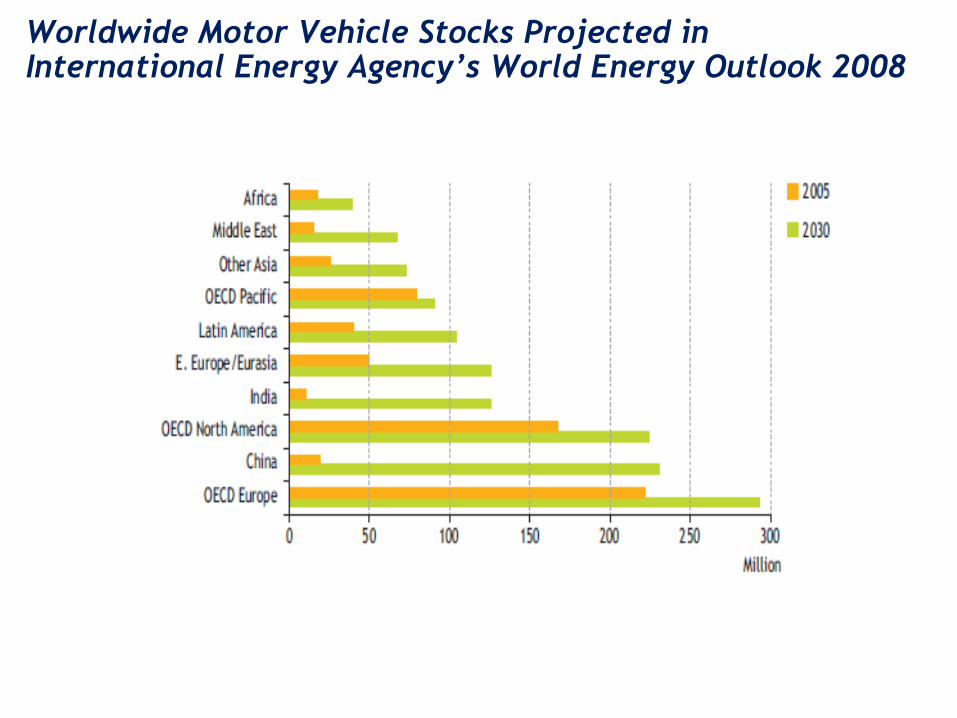
Worldwide Motor Vehicle Stocks Projected in International Energy Agency’s World Energy Outlook 2008
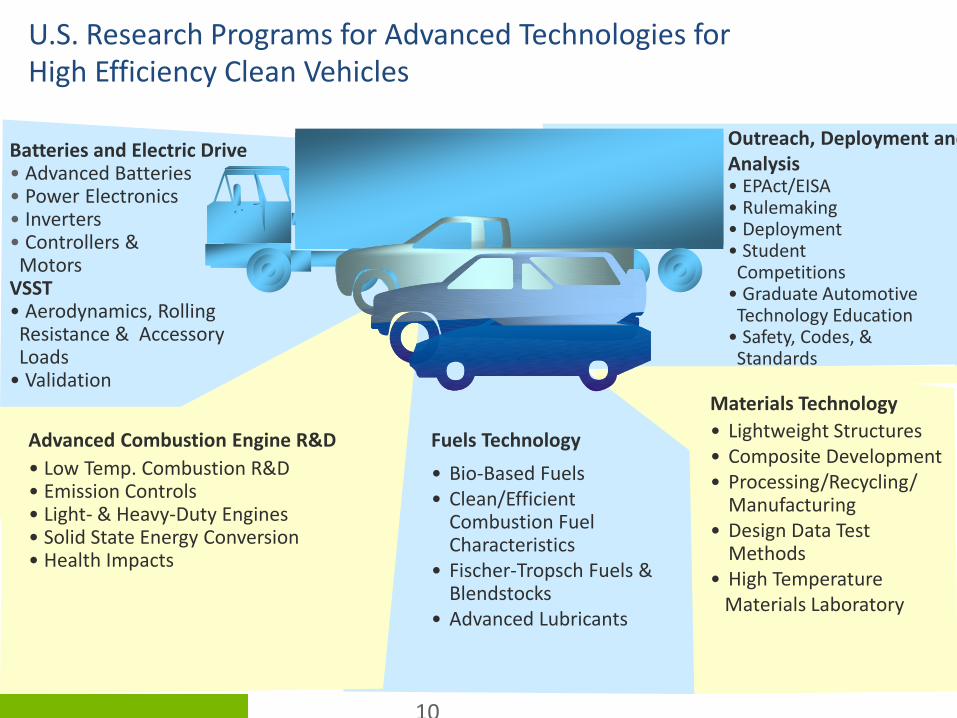
Fuels Technology
• Bio-Based Fuels • Clean/Efficient
Combustion Fuel Characteristics
• Fischer-Tropsch Fuels & Blendstocks
• Advanced Lubricants
Materials Technology
• Lightweight Structures • Composite Development • Processing/Recycling/
Manufacturing • Design Data Test
Methods • High Temperature Materials Laboratory
Batteries and Electric Drive • Advanced Batteries • Power Electronics • Inverters • Controllers & Motors VSST • Aerodynamics, Rolling Resistance & Accessory Loads • Validation
Advanced Combustion Engine R&D
• Low Temp. Combustion R&D • Emission Controls • Light- & Heavy-Duty Engines • Solid State Energy Conversion • Health Impacts
Outreach, Deployment and Analysis • EPAct/EISA • Rulemaking • Deployment • Student Competitions • Graduate Automotive Technology Education • Safety, Codes, & Standards
U.S. Research Programs for Advanced Technologies for High Efficiency Clean Vehicles
10
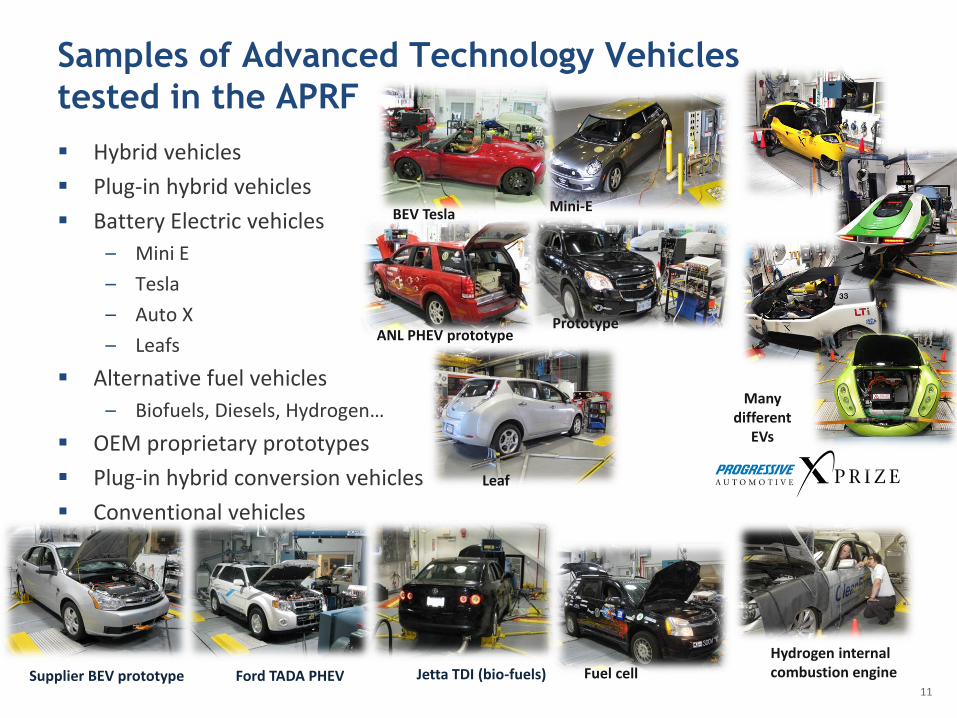
Samples of Advanced Technology Vehicles
tested in the APRF
Hybrid vehicles
Plug-in hybrid vehicles
Battery Electric vehicles
– Mini E
– Tesla
– Auto X
– Leafs
Alternative fuel vehicles
– Biofuels, Diesels, Hydrogen…
OEM proprietary prototypes
Plug-in hybrid conversion vehicles
Conventional vehicles
Jetta TDI (bio-fuels) Ford TADA PHEV Supplier BEV prototype
BEV Tesla
Fuel cell
Hydrogen internal combustion engine
ANL PHEV prototype
Mini-E
Prototype
Leaf
Many different
EVs
11
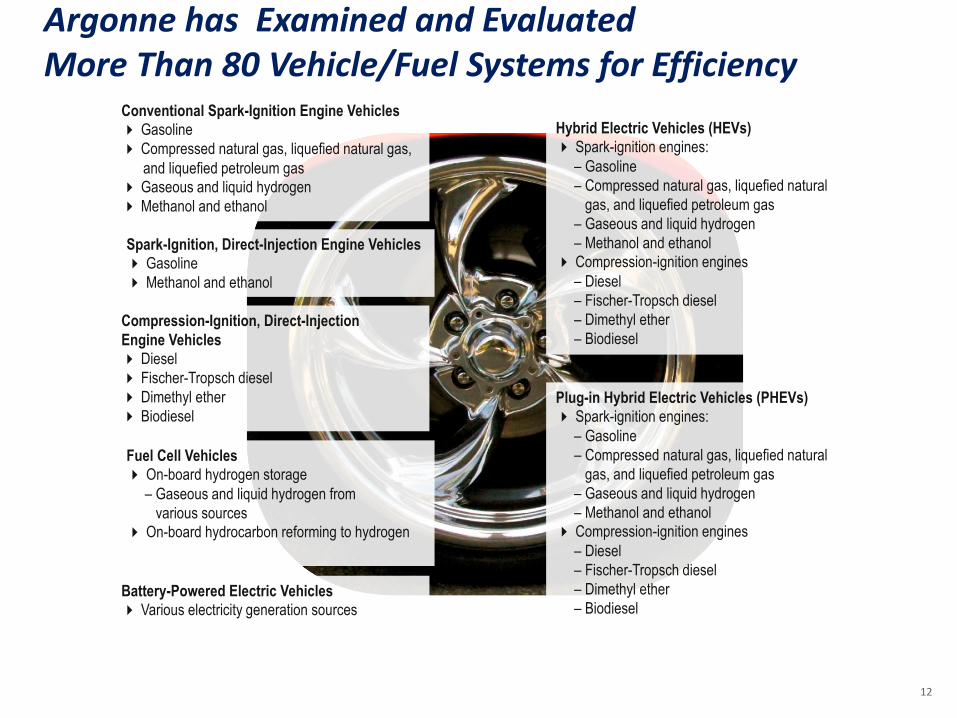
Argonne has Examined and Evaluated More Than 80 Vehicle/Fuel Systems for Efficiency
Conventional Spark-Ignition Engine Vehicles
4 Gasoline
4 Compressed natural gas, liquefied natural gas,
and liquefied petroleum gas
4 Gaseous and liquid hydrogen
4 Methanol and ethanol
Spark-Ignition, Direct-Injection Engine Vehicles
4 Gasoline
4 Methanol and ethanol
Compression-Ignition, Direct-Injection
Engine Vehicles
4 Diesel
4 Fischer-Tropsch diesel
4 Dimethyl ether
4 Biodiesel
Fuel Cell Vehicles
4 On-board hydrogen storage
– Gaseous and liquid hydrogen from
various sources
4 On-board hydrocarbon reforming to hydrogen
Battery-Powered Electric Vehicles
4 Various electricity generation sources
Hybrid Electric Vehicles (HEVs)
4 Spark-ignition engines:
– Gasoline
– Compressed natural gas, liquefied natural
gas, and liquefied petroleum gas
– Gaseous and liquid hydrogen
– Methanol and ethanol
4 Compression-ignition engines
– Diesel
– Fischer-Tropsch diesel
– Dimethyl ether
– Biodiesel
Plug-in Hybrid Electric Vehicles (PHEVs)
4 Spark-ignition engines:
– Gasoline
– Compressed natural gas, liquefied natural
gas, and liquefied petroleum gas
– Gaseous and liquid hydrogen
– Methanol and ethanol
4 Compression-ignition engines
– Diesel
– Fischer-Tropsch diesel
– Dimethyl ether
– Biodiesel
12
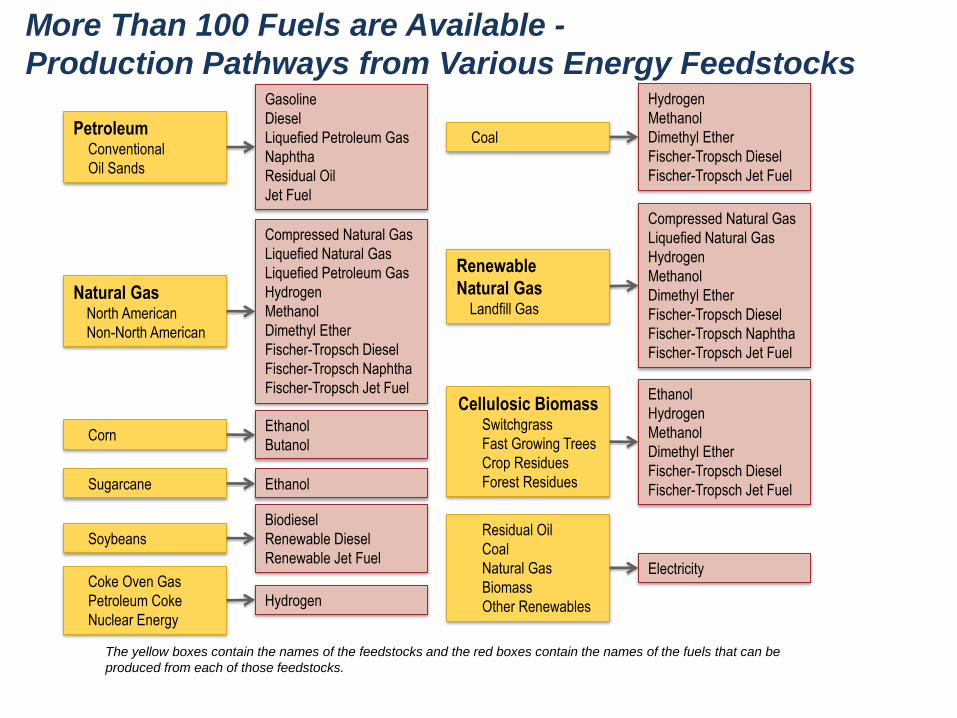
More Than 100 Fuels are Available -
Production Pathways from Various Energy Feedstocks
The yellow boxes contain the names of the feedstocks and the red boxes contain the names of the fuels that can be
produced from each of those feedstocks.
Petroleum Conventional
Oil Sands
Compressed Natural Gas
Liquefied Natural Gas
Liquefied Petroleum Gas
Hydrogen
Methanol
Dimethyl Ether
Fischer-Tropsch Diesel
Fischer-Tropsch Naphtha
Fischer-Tropsch Jet Fuel
Natural Gas North American
Non-North American
Coal
Soybeans
Gasoline
Diesel
Liquefied Petroleum Gas
Naphtha
Residual Oil
Jet Fuel
Hydrogen
Methanol
Dimethyl Ether
Fischer-Tropsch Diesel
Fischer-Tropsch Jet Fuel
Biodiesel
Renewable Diesel
Renewable Jet Fuel
Sugarcane
Corn
Cellulosic Biomass Switchgrass
Fast Growing Trees
Crop Residues
Forest Residues
Coke Oven Gas
Petroleum Coke
Nuclear Energy
Residual Oil
Coal
Natural Gas
Biomass
Other Renewables
Ethanol
Butanol
Ethanol
Ethanol
Hydrogen
Methanol
Dimethyl Ether
Fischer-Tropsch Diesel
Fischer-Tropsch Jet Fuel
Electricity
Hydrogen
Compressed Natural Gas
Liquefied Natural Gas
Hydrogen
Methanol
Dimethyl Ether
Fischer-Tropsch Diesel
Fischer-Tropsch Naphtha
Fischer-Tropsch Jet Fuel
Renewable
Natural Gas Landfill Gas
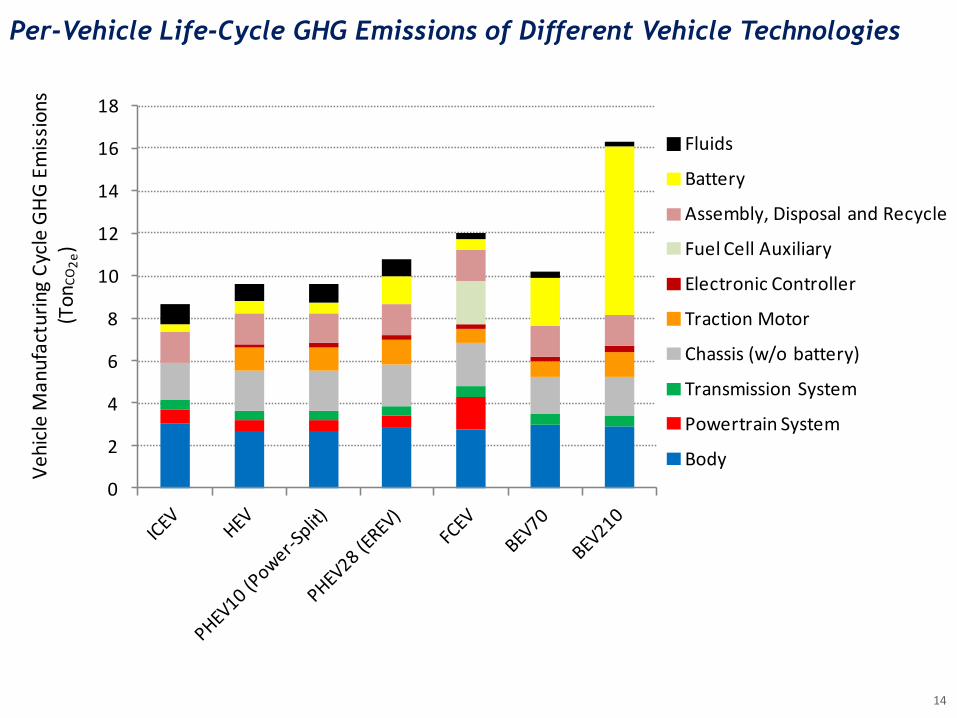
Per-Vehicle Life-Cycle GHG Emissions of Different Vehicle Technologies
14
0
2
4
6
8
10
12
14
16
18
Ve
hic
le M
an
ufa
ctu
rin
g C
ycle
GH
G E
mis
sio
ns
(To
nC
O2
e)
Fluids
Battery
Assembly, Disposal and Recycle
Fuel Cell Auxiliary
Electronic Controller
Traction Motor
Chassis (w/o battery)
Transmission System
Powertrain System
Body
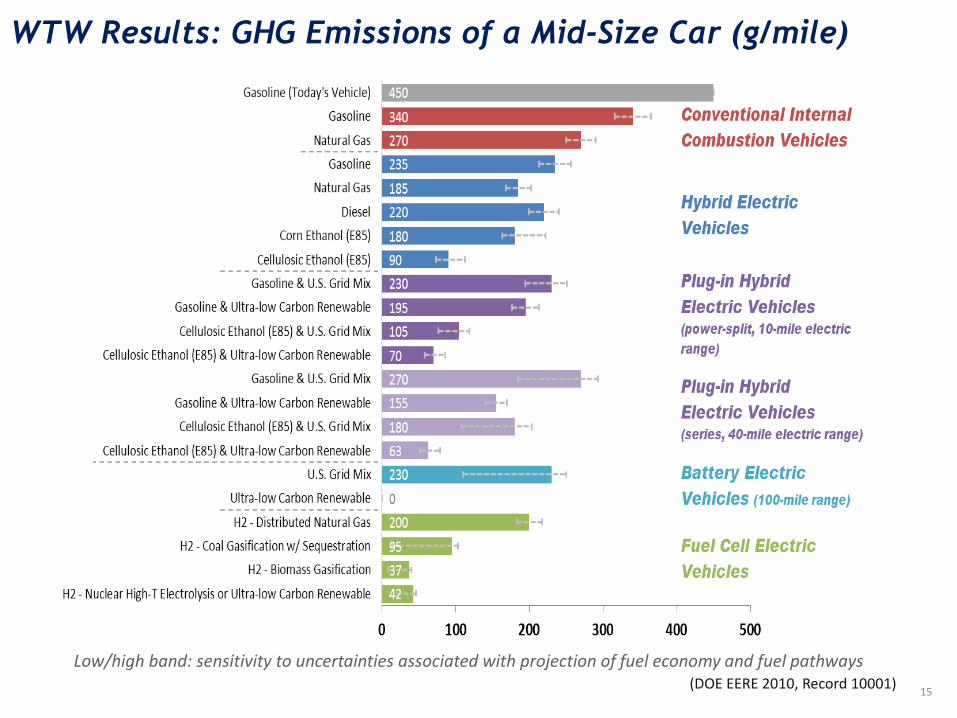
Low/high band: sensitivity to uncertainties associated with projection of fuel economy and fuel pathways
15
WTW Results: GHG Emissions of a Mid-Size Car (g/mile)
(DOE EERE 2010, Record 10001)
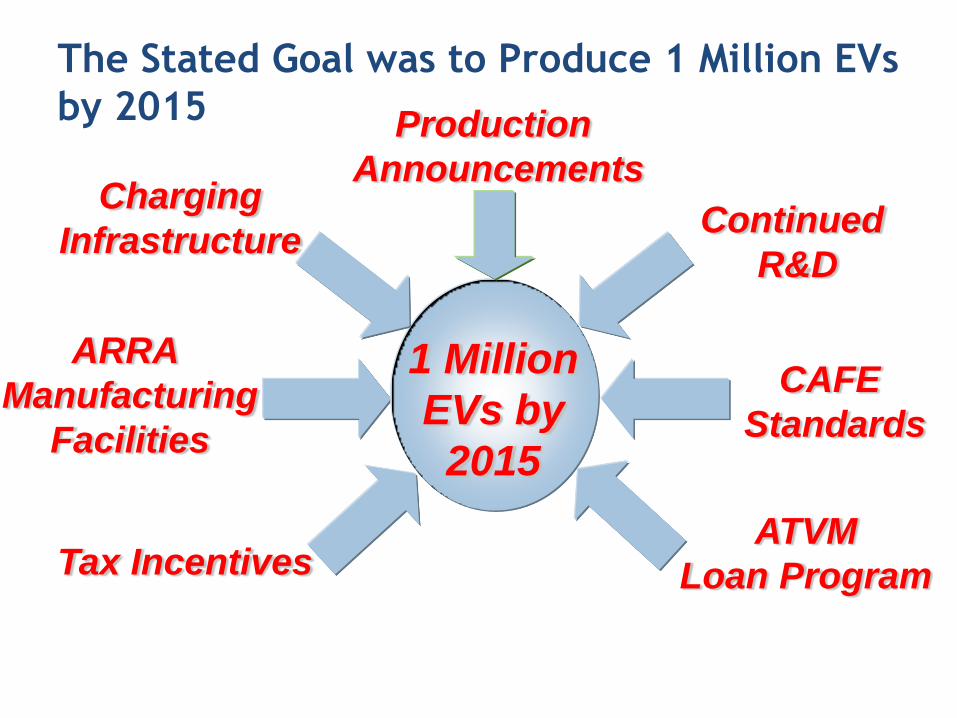
The Stated Goal was to Produce 1 Million EVs
by 2015
Tax Incentives
Continued
R&D
CAFE
Standards
ATVM
Loan Program
ARRA
Manufacturing
Facilities
Charging
Infrastructure
1 Million
EVs by
2015
Production
Announcements
17
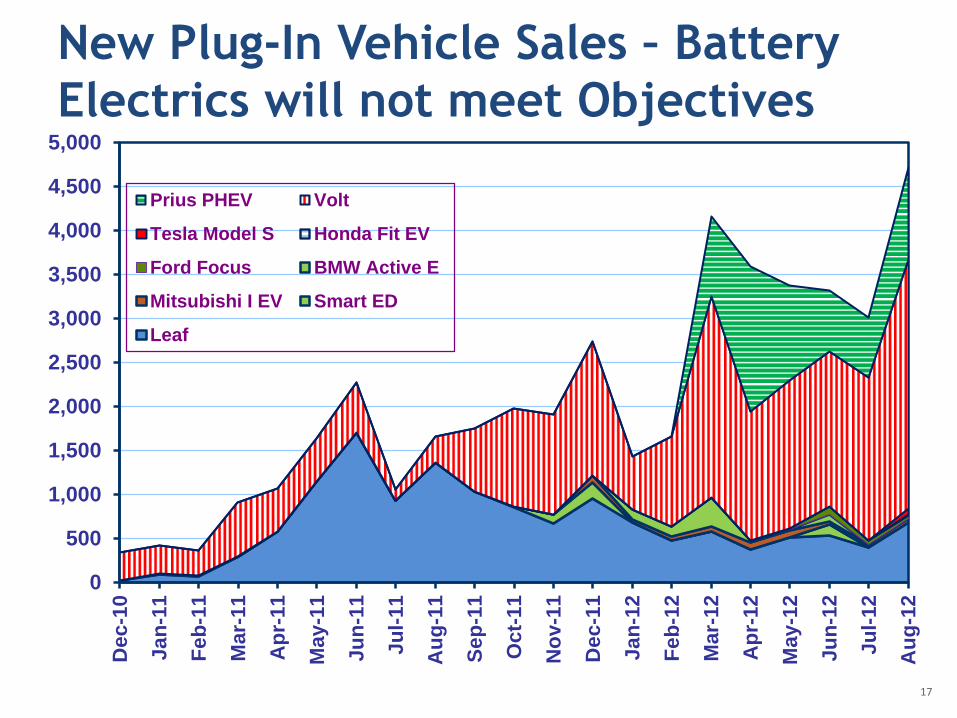
0
500
1,000
1,500
2,000
2,500
3,000
3,500
4,000
4,500
5,000D
ec
-10
Ja
n-1
1
Fe
b-1
1
Mar-
11
Ap
r-11
May-1
1
Ju
n-1
1
Ju
l-11
Au
g-1
1
Sep
-11
Oct-
11
No
v-1
1
Dec
-11
Ja
n-1
2
Fe
b-1
2
Mar-
12
Ap
r-12
May-1
2
Ju
n-1
2
Ju
l-12
Au
g-1
2
New
Plu
g-I
n V
eh
icle
Sale
s
Prius PHEV Volt
Tesla Model S Honda Fit EV
Ford Focus BMW Active E
Mitsubishi I EV Smart ED
Leaf
New Plug-In Vehicle Sales – Battery
Electrics will not meet Objectives
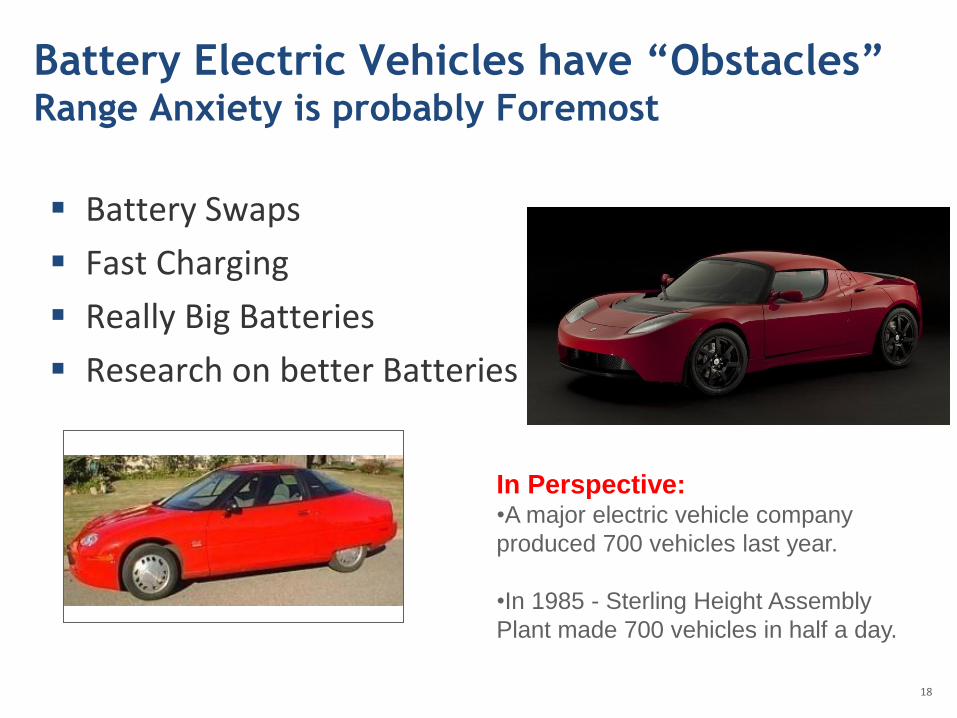
Battery Electric Vehicles have “Obstacles” Range Anxiety is probably Foremost
Battery Swaps
Fast Charging
Really Big Batteries
Research on better Batteries
18
In Perspective: •A major electric vehicle company
produced 700 vehicles last year.
•In 1985 - Sterling Height Assembly
Plant made 700 vehicles in half a day.
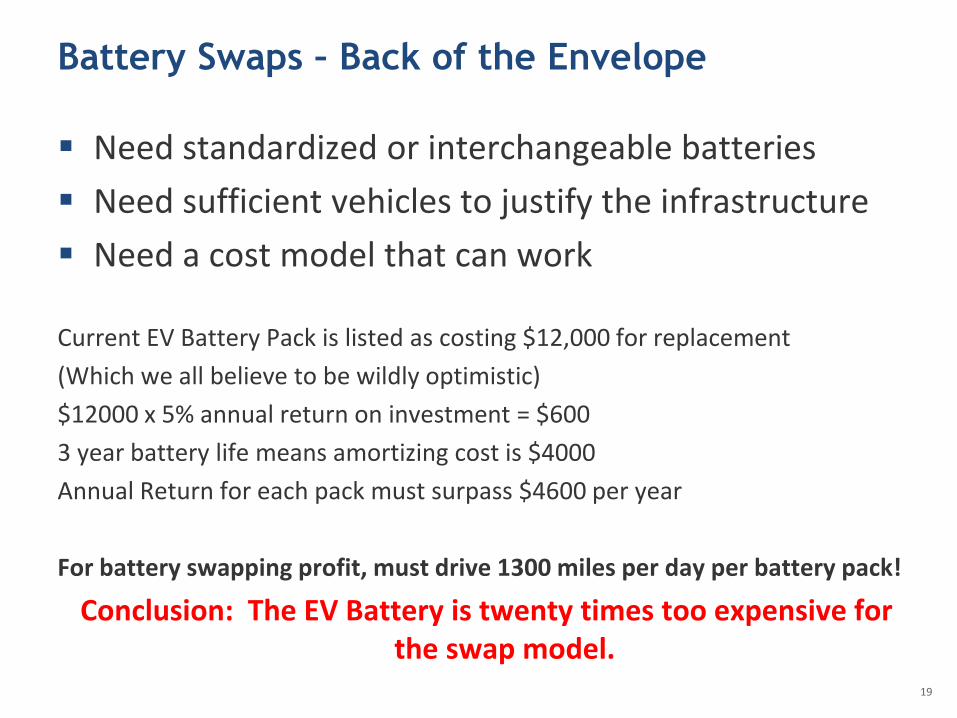
Battery Swaps – Back of the Envelope
Need standardized or interchangeable batteries
Need sufficient vehicles to justify the infrastructure
Need a cost model that can work
Current EV Battery Pack is listed as costing $12,000 for replacement
(Which we all believe to be wildly optimistic)
$12000 x 5% annual return on investment = $600
3 year battery life means amortizing cost is $4000
Annual Return for each pack must surpass $4600 per year
For battery swapping profit, must drive 1300 miles per day per battery pack!
Conclusion: The EV Battery is twenty times too expensive for the swap model.
19
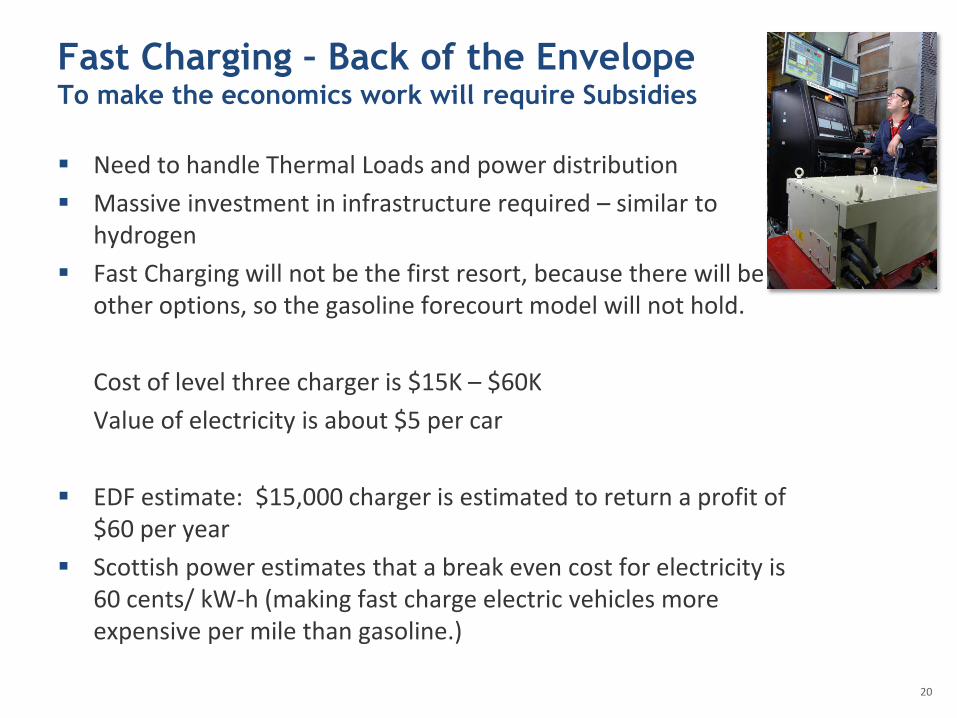
Fast Charging – Back of the Envelope To make the economics work will require Subsidies
Need to handle Thermal Loads and power distribution
Massive investment in infrastructure required – similar to hydrogen
Fast Charging will not be the first resort, because there will be other options, so the gasoline forecourt model will not hold.
Cost of level three charger is $15K – $60K
Value of electricity is about $5 per car
EDF estimate: $15,000 charger is estimated to return a profit of $60 per year
Scottish power estimates that a break even cost for electricity is 60 cents/ kW-h (making fast charge electric vehicles more expensive per mile than gasoline.)
20
Figure 10. Li-ion battery HIL testing at ANL
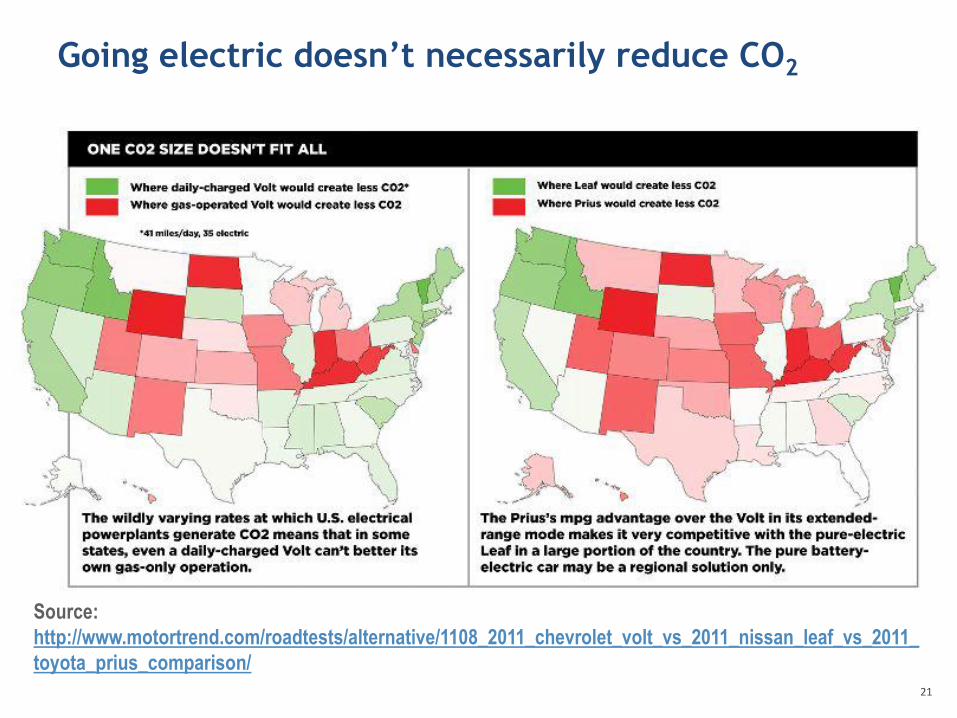
Going electric doesn’t necessarily reduce CO2
21
Source:
http://www.motortrend.com/roadtests/alternative/1108_2011_chevrolet_volt_vs_2011_nissan_leaf_vs_2011_
toyota_prius_comparison/
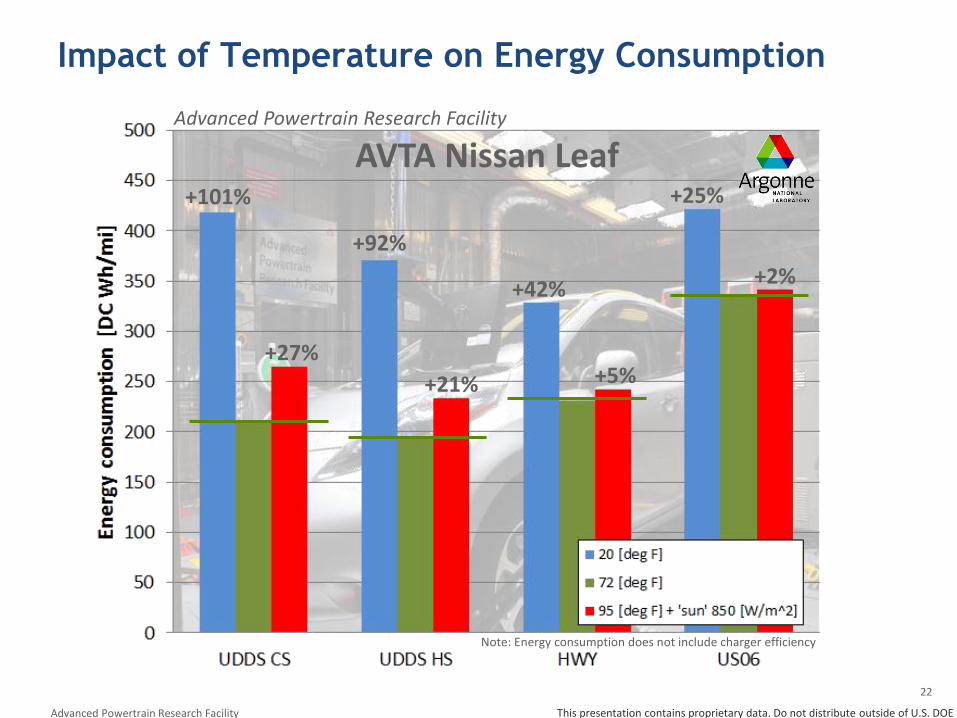
Impact of Temperature on Energy Consumption
22
Note: Energy consumption does not include charger efficiency
Advanced Powertrain Research Facility
AVTA Nissan Leaf
Advanced Powertrain Research Facility This presentation contains proprietary data. Do not distribute outside of U.S. DOE
+101%
+42%
+92%
+25%
+27% +5% +21%
+2%
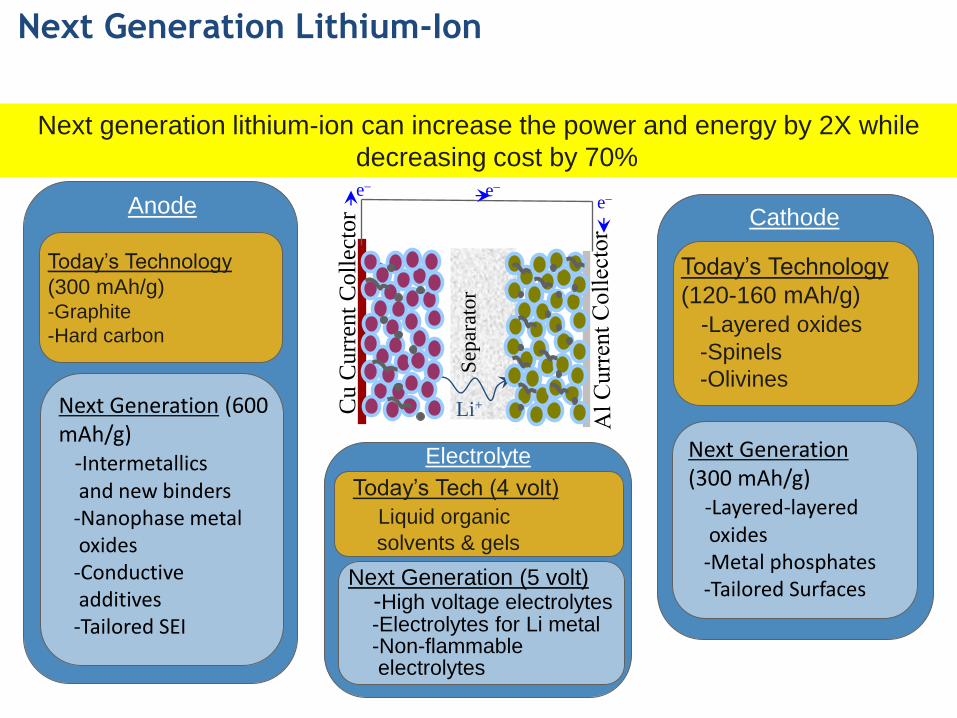
Next Generation Lithium-Ion
Sep
arat
or
Cu C
urr
ent
Coll
ecto
r
e e
Li+
e
Next generation lithium-ion can increase the power and energy by 2X while
decreasing cost by 70%
Anode
Today’s Technology
(300 mAh/g) -Graphite
-Hard carbon
Next Generation (600 mAh/g) -Intermetallics and new binders -Nanophase metal oxides -Conductive additives -Tailored SEI
Cathode
Today’s Technology
(120-160 mAh/g)
-Layered oxides
-Spinels
-Olivines
Next Generation (300 mAh/g) -Layered-layered oxides -Metal phosphates -Tailored Surfaces
Electrolyte
Today’s Tech (4 volt)
Liquid organic
solvents & gels
Next Generation (5 volt) -High voltage electrolytes -Electrolytes for Li metal -Non-flammable electrolytes
Source: Prof. J. Newman, LBNL
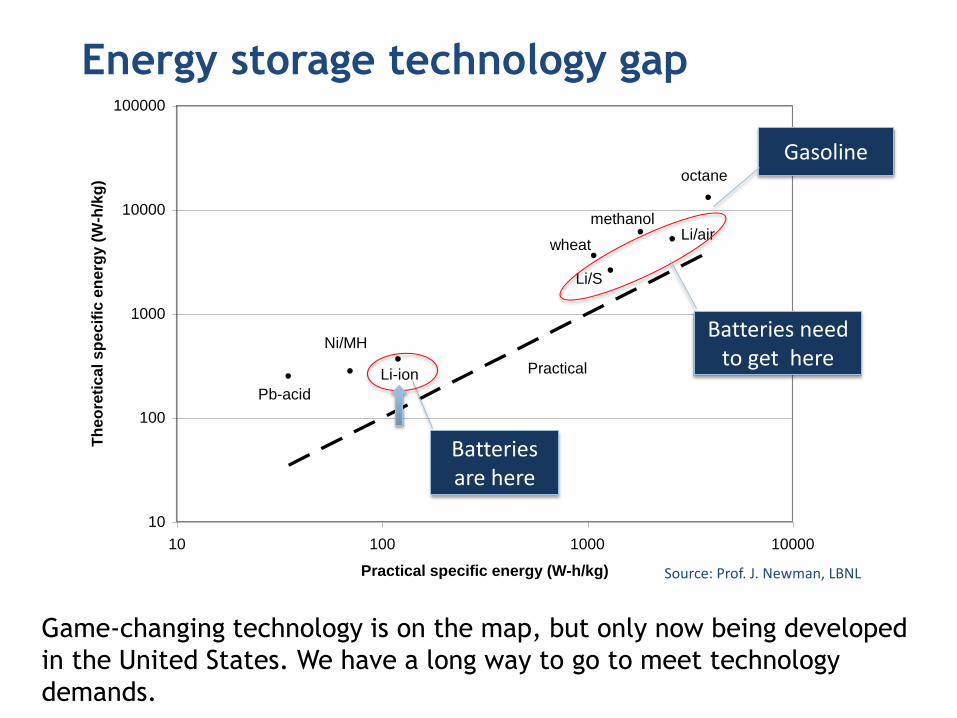
10
100
1000
10000
100000
10 100 1000 10000
Practical specific energy (W-h/kg)
Th
eo
reti
ca
l s
pe
cif
ic e
ne
rgy
(W
-h/k
g)
Pb-acid
Li/S
wheat
methanolLi/air
octane
Li-ion
Ni/MH
Practical
Batteries are here
Batteries need to get here
Energy storage technology gap
Gasoline
Game-changing technology is on the map, but only now being developed
in the United States. We have a long way to go to meet technology
demands.
25
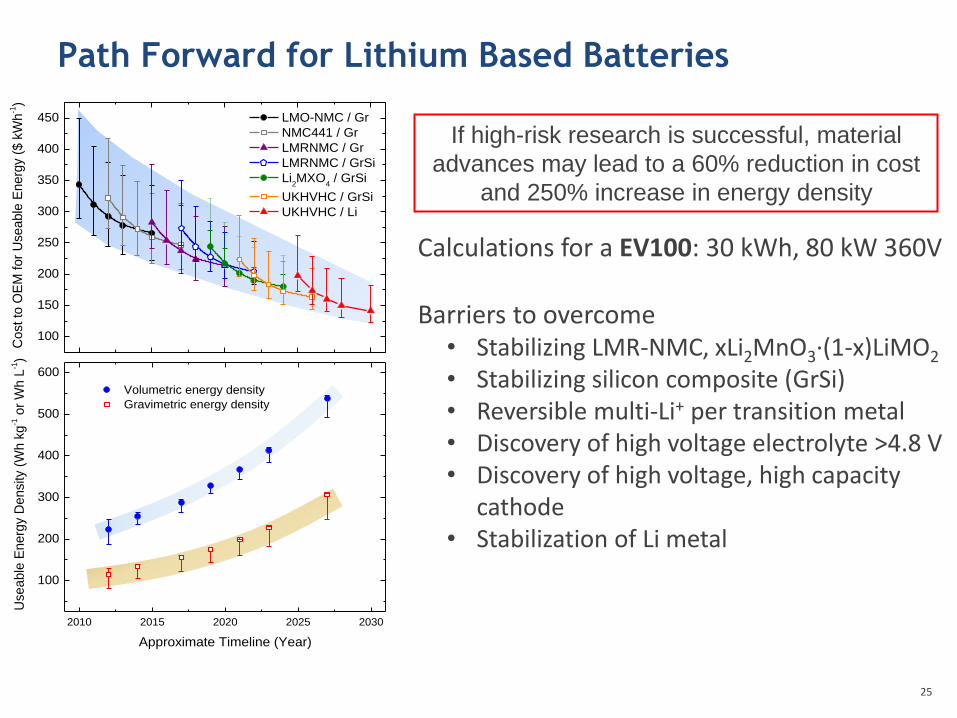
Path Forward for Lithium Based Batteries
If high-risk research is successful, material
advances may lead to a 60% reduction in cost
and 250% increase in energy density
Calculations for a EV100: 30 kWh, 80 kW 360V Barriers to overcome
• Stabilizing LMR-NMC, xLi2MnO3·(1-x)LiMO2 • Stabilizing silicon composite (GrSi) • Reversible multi-Li+ per transition metal • Discovery of high voltage electrolyte >4.8 V • Discovery of high voltage, high capacity
cathode • Stabilization of Li metal
2010 2015 2020 2025 2030
100
150
200
250
300
350
400
450
Co
st
to O
EM
for
Usea
ble
En
erg
y (
$ k
Wh
-1)
Approximate Timeline (Year)
LMO-NMC / Gr
NMC441 / Gr
LMRNMC / Gr
LMRNMC / GrSi
Li2MXO
4 / GrSi
UKHVHC / GrSi
UKHVHC / Li
2010 2015 2020 2025 2030
100
200
300
400
500
600
Volumetric energy density
Gravimetric energy density
Use
able
En
erg
y D
ensity (
Wh
kg
-1 o
r W
h L
-1)
Approximate Timeline (Year)
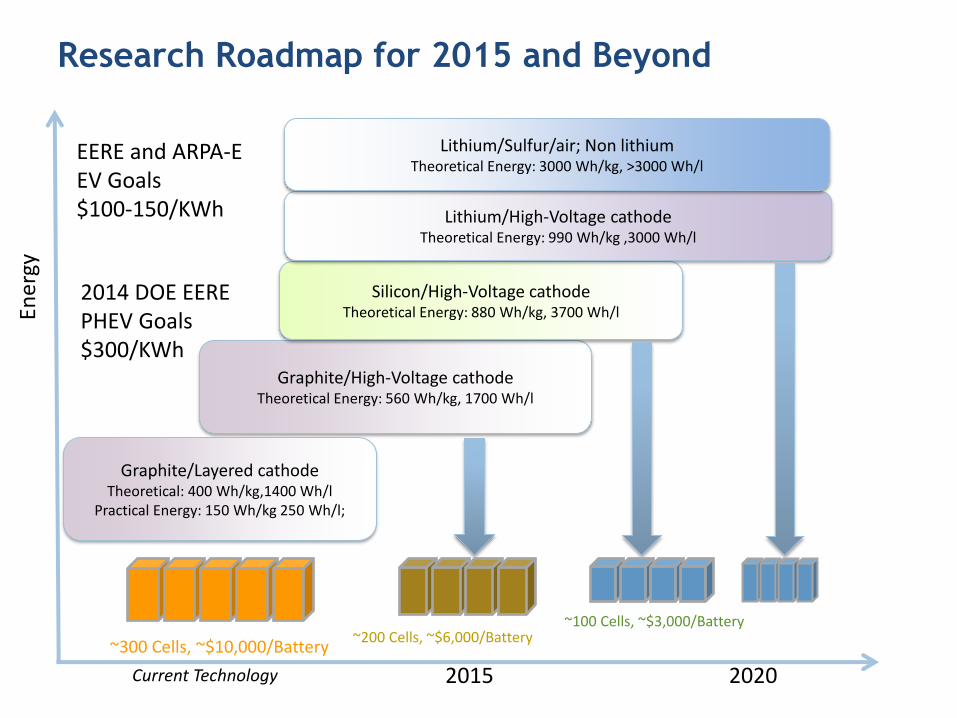
Research Roadmap for 2015 and Beyond
Graphite/High-Voltage cathode Theoretical Energy: 560 Wh/kg, 1700 Wh/l
Silicon/High-Voltage cathode Theoretical Energy: 880 Wh/kg, 3700 Wh/l
Lithium/High-Voltage cathode Theoretical Energy: 990 Wh/kg ,3000 Wh/l
Lithium/Sulfur/air; Non lithium Theoretical Energy: 3000 Wh/kg, >3000 Wh/l
Ener
gy
Current Technology
2014 DOE EERE PHEV Goals $300/KWh
Graphite/Layered cathode Theoretical: 400 Wh/kg,1400 Wh/l
Practical Energy: 150 Wh/kg 250 Wh/l;
2015 2020
EERE and ARPA-E EV Goals $100-150/KWh
~200 Cells, ~$6,000/Battery ~100 Cells, ~$3,000/Battery
~300 Cells, ~$10,000/Battery
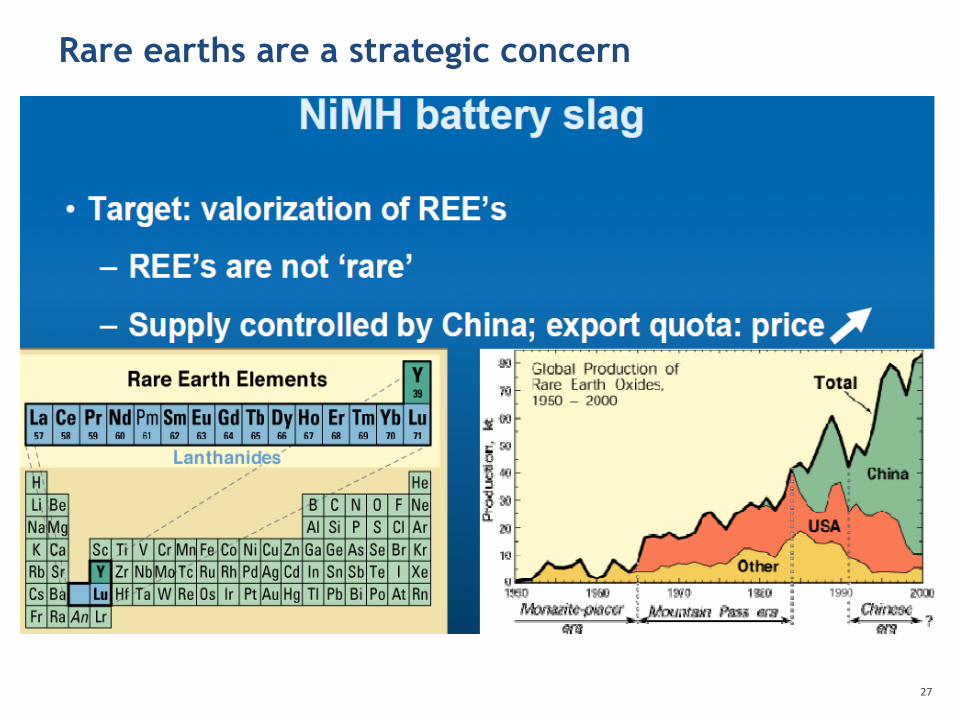
Rare earths are a strategic concern
27
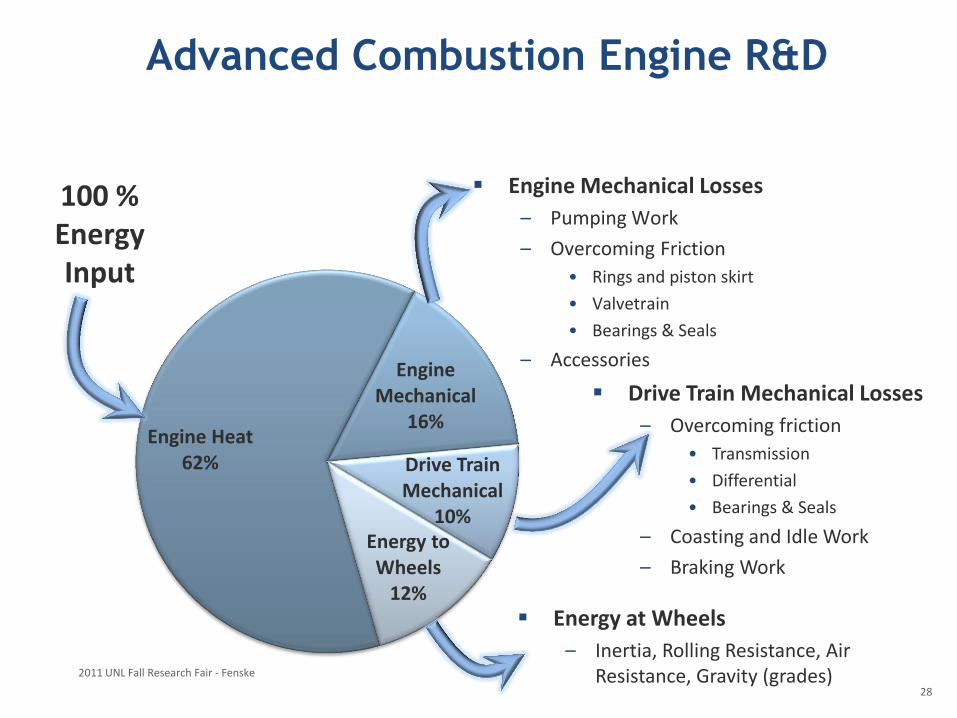
Advanced Combustion Engine R&D
Engine Mechanical Losses
– Pumping Work
– Overcoming Friction
• Rings and piston skirt
• Valvetrain
• Bearings & Seals
– Accessories
2011 UNL Fall Research Fair - Fenske
Engine Heat 62%
Engine Mechanical
16%
Drive Train Mechanical
10% Energy to Wheels
12%
100 % Energy Input
Drive Train Mechanical Losses
– Overcoming friction
• Transmission
• Differential
• Bearings & Seals
– Coasting and Idle Work
– Braking Work
Energy at Wheels
– Inertia, Rolling Resistance, Air Resistance, Gravity (grades)
28
Argonne National Laboratory
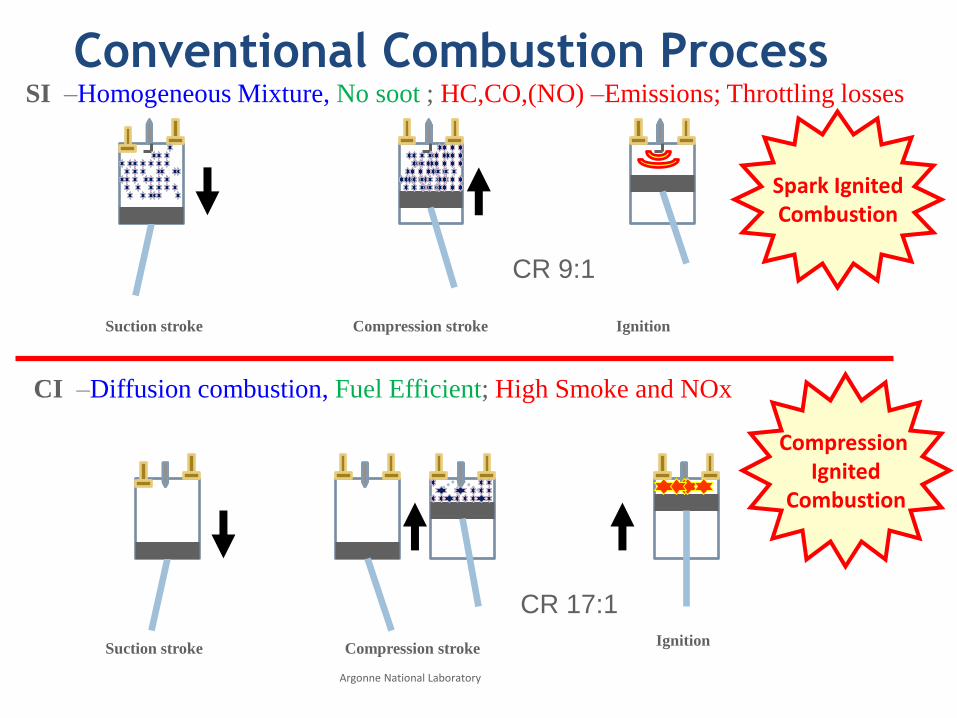
SI –Homogeneous Mixture, No soot ; HC,CO,(NO) –Emissions; Throttling losses
Conventional Combustion Process
CI –Diffusion combustion, Fuel Efficient; High Smoke and NOx
Spark Ignited Combustion
Suction stroke Compression stroke Ignition
Compression
Ignited Combustion
Compression stroke Suction stroke Ignition
CR 9:1
CR 17:1
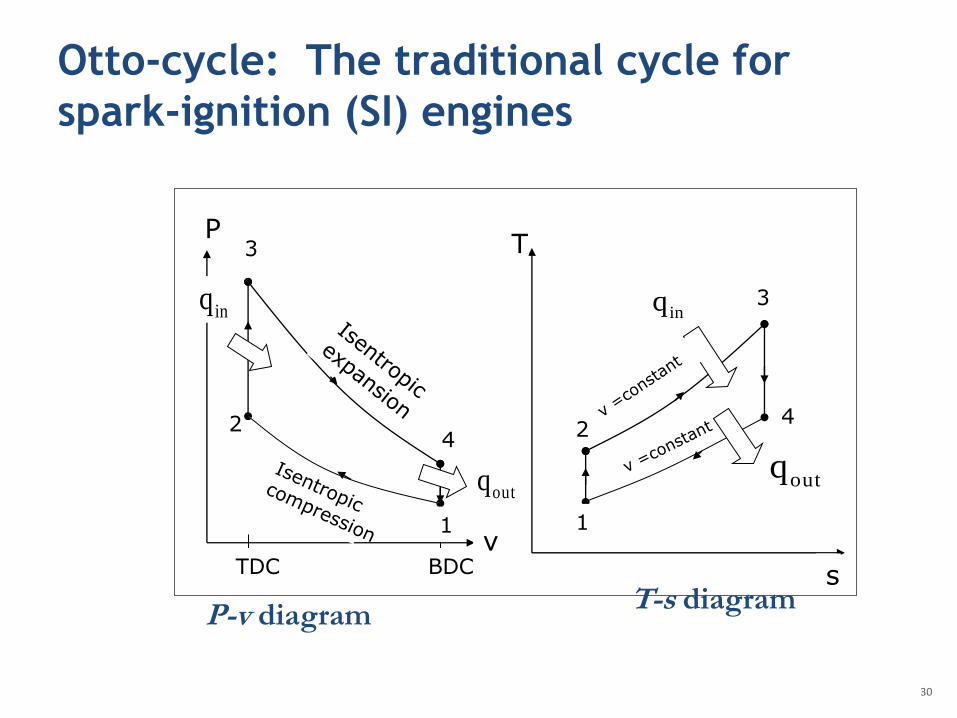
Otto-cycle: The traditional cycle for
spark-ignition (SI) engines
30
1
2
3
4
T
s
inq
outq
TDC BDC
P
v
2
3
4
1
inq
outq
P-v diagram T-s diagram
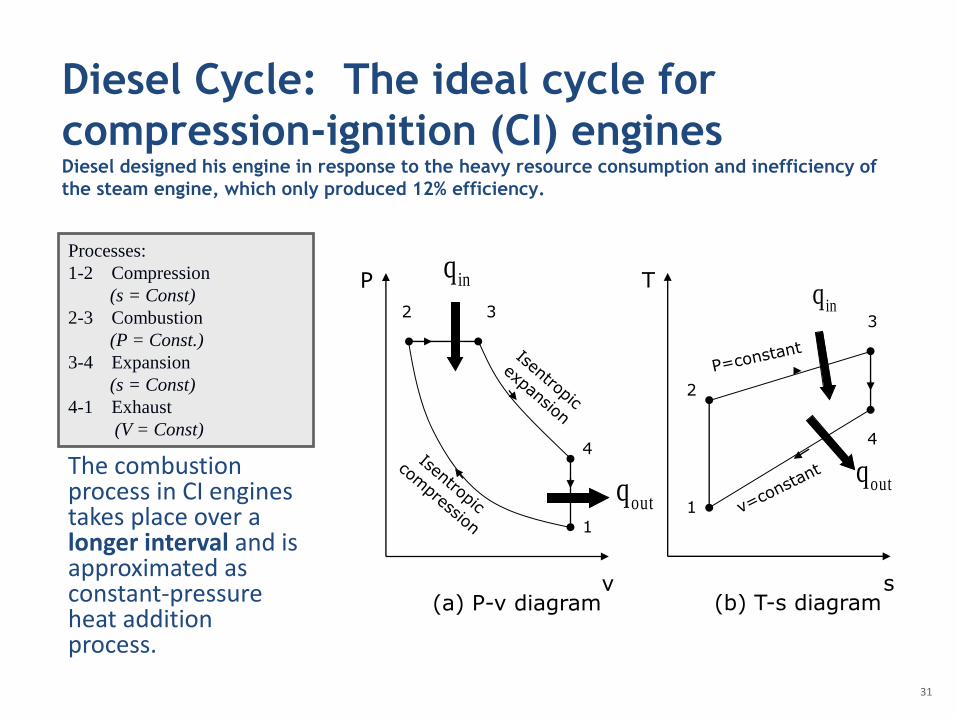
Diesel Cycle: The ideal cycle for
compression-ignition (CI) engines Diesel designed his engine in response to the heavy resource consumption and inefficiency of
the steam engine, which only produced 12% efficiency.
31
P
v (a) P-v diagram
T
s (b) T-s diagram
inq
outq1
4
2 3
1
2
3
4
inq
outq
Processes:
1-2 Compression
(s = Const)
2-3 Combustion
(P = Const.)
3-4 Expansion
(s = Const)
4-1 Exhaust
(V = Const)
The combustion process in CI engines takes place over a longer interval and is approximated as constant-pressure heat addition process.
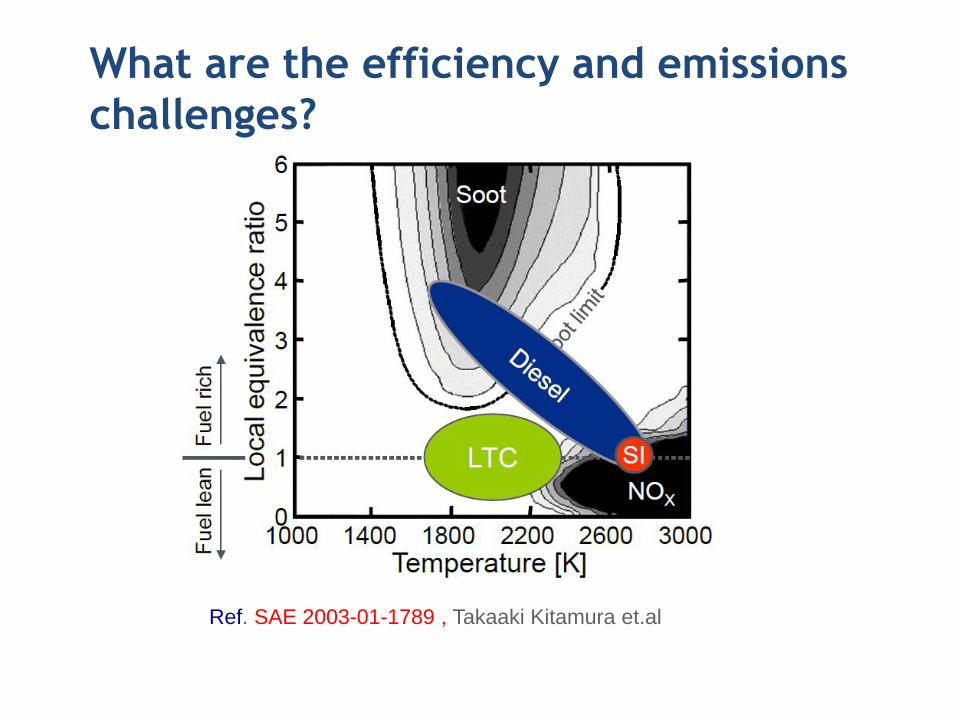
What are the efficiency and emissions
challenges?
Ref. SAE 2003-01-1789 , Takaaki Kitamura et.al
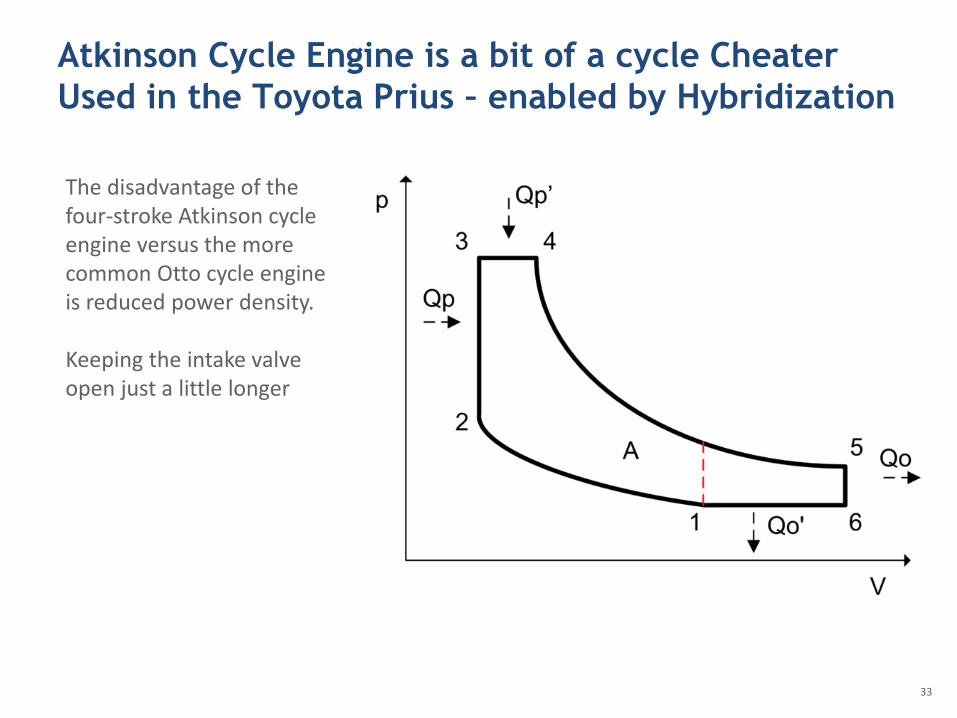
Atkinson Cycle Engine is a bit of a cycle Cheater
Used in the Toyota Prius – enabled by Hybridization
33
The disadvantage of the four-stroke Atkinson cycle engine versus the more common Otto cycle engine is reduced power density. Keeping the intake valve open just a little longer
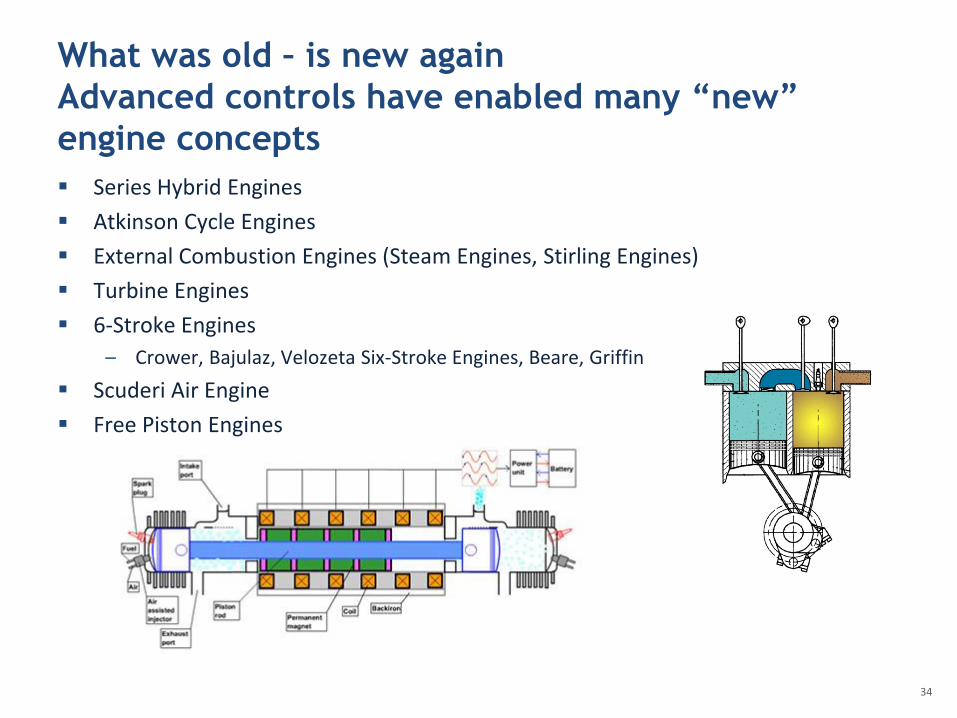
What was old – is new again
Advanced controls have enabled many “new”
engine concepts
Series Hybrid Engines
Atkinson Cycle Engines
External Combustion Engines (Steam Engines, Stirling Engines)
Turbine Engines
6-Stroke Engines
– Crower, Bajulaz, Velozeta Six-Stroke Engines, Beare, Griffin
Scuderi Air Engine
Free Piston Engines
34
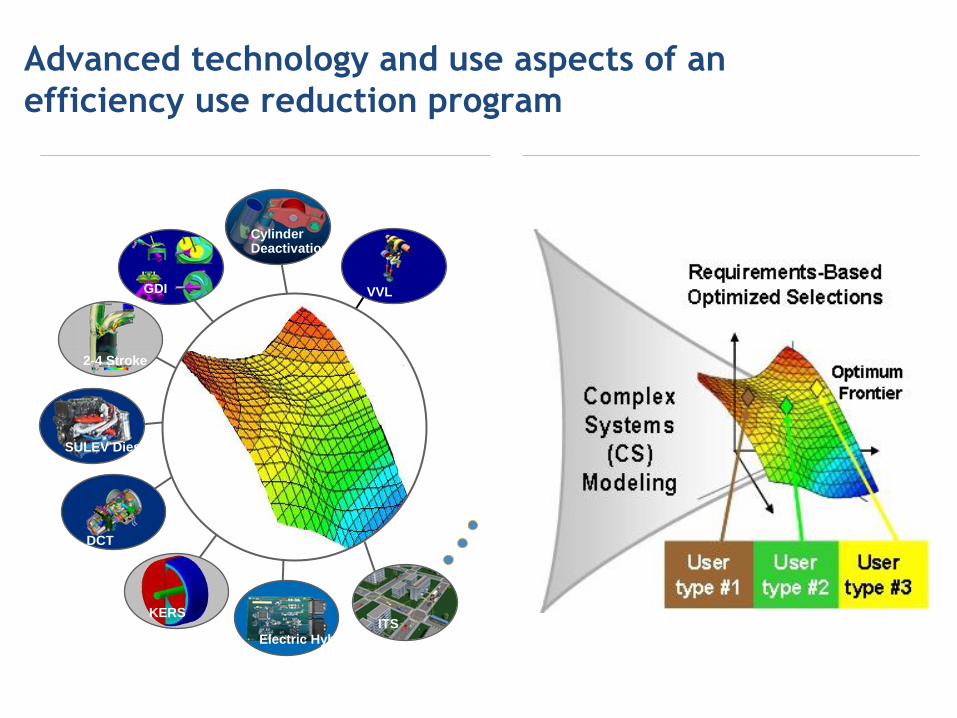
Advanced technology and use aspects of an
efficiency use reduction program
VVL
Cylinder Deactivation
DCT
GDI
SULEV Diesel
KERS
Electric Hybrid
2-4 Stroke
ITS
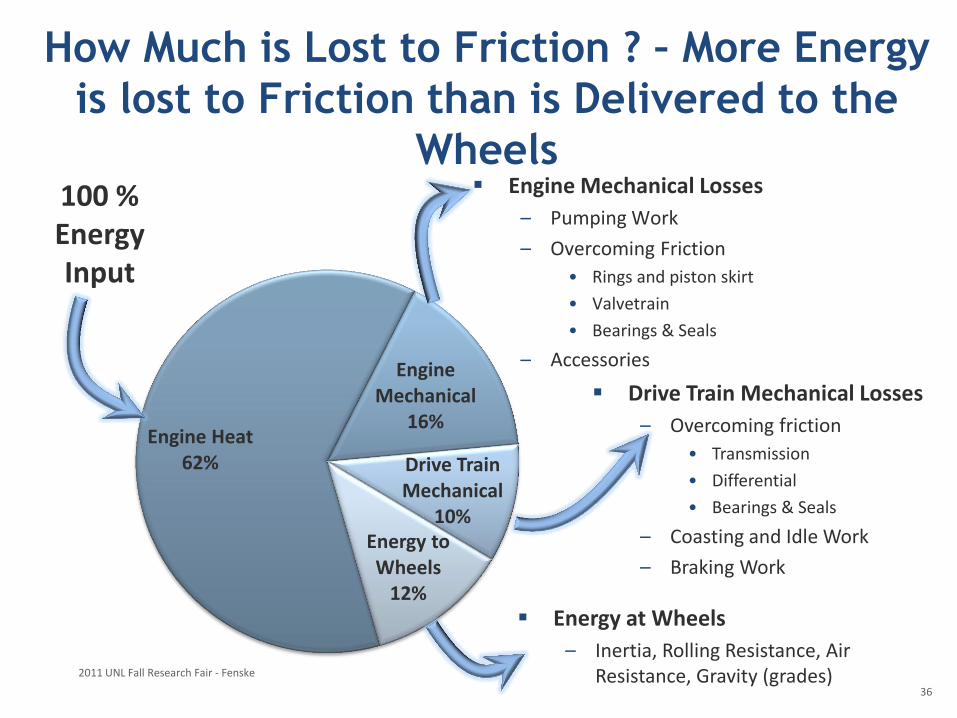
How Much is Lost to Friction ? – More Energy
is lost to Friction than is Delivered to the
Wheels Engine Mechanical Losses
– Pumping Work
– Overcoming Friction
• Rings and piston skirt
• Valvetrain
• Bearings & Seals
– Accessories
2011 UNL Fall Research Fair - Fenske
Engine Heat 62%
Engine Mechanical
16%
Drive Train Mechanical
10% Energy to Wheels
12%
100 % Energy Input
Drive Train Mechanical Losses
– Overcoming friction
• Transmission
• Differential
• Bearings & Seals
– Coasting and Idle Work
– Braking Work
Energy at Wheels
– Inertia, Rolling Resistance, Air Resistance, Gravity (grades)
36
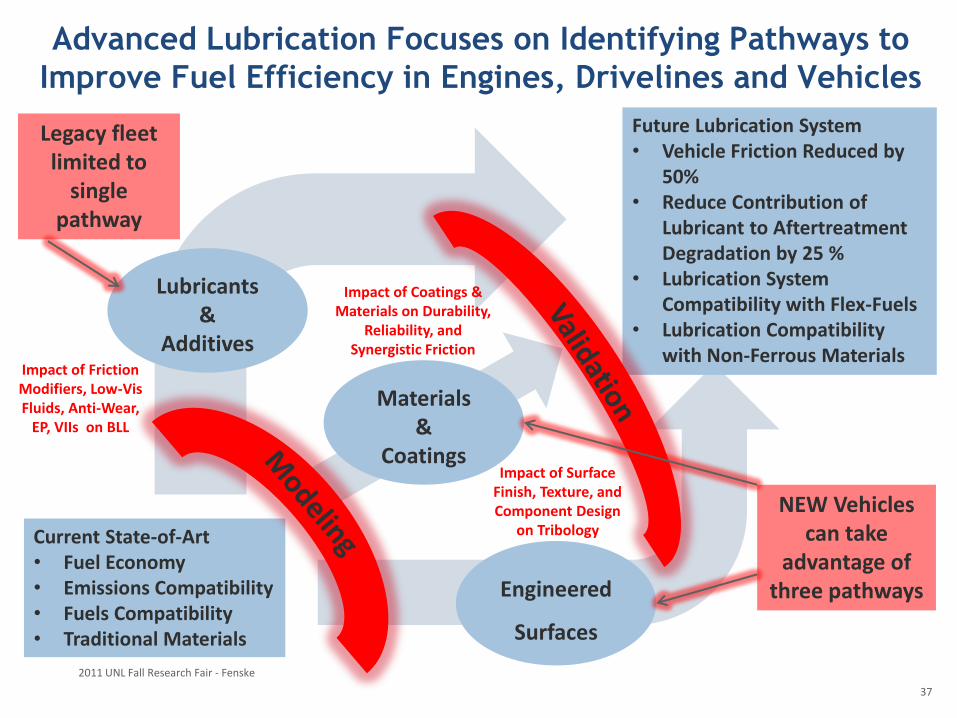
Advanced Lubrication Focuses on Identifying Pathways to
Improve Fuel Efficiency in Engines, Drivelines and Vehicles
Current State-of-Art • Fuel Economy • Emissions Compatibility • Fuels Compatibility • Traditional Materials
Future Lubrication System • Vehicle Friction Reduced by
50% • Reduce Contribution of
Lubricant to Aftertreatment Degradation by 25 %
• Lubrication System Compatibility with Flex-Fuels
• Lubrication Compatibility with Non-Ferrous Materials
Materials &
Coatings
Engineered
Surfaces
Lubricants &
Additives
Legacy fleet limited to
single pathway
NEW Vehicles can take
advantage of three pathways
Impact of Friction Modifiers, Low-Vis Fluids, Anti-Wear,
EP, VIIs on BLL
Impact of Coatings & Materials on Durability,
Reliability, and Synergistic Friction
Impact of Surface Finish, Texture, and Component Design
on Tribology
2011 UNL Fall Research Fair - Fenske
37
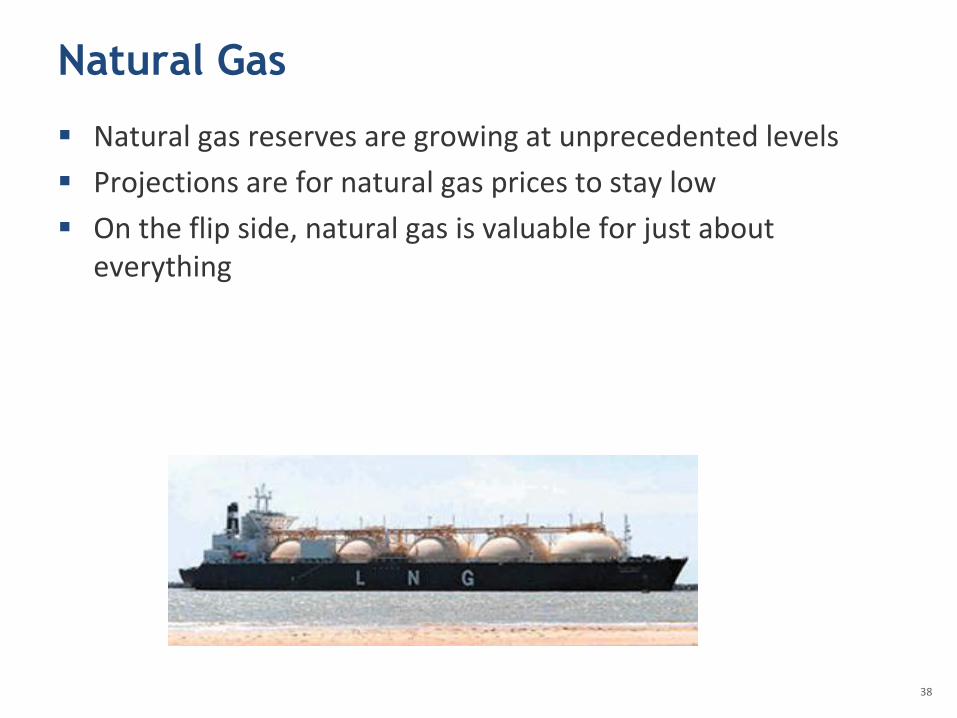
Natural Gas
Natural gas reserves are growing at unprecedented levels
Projections are for natural gas prices to stay low
On the flip side, natural gas is valuable for just about everything
38
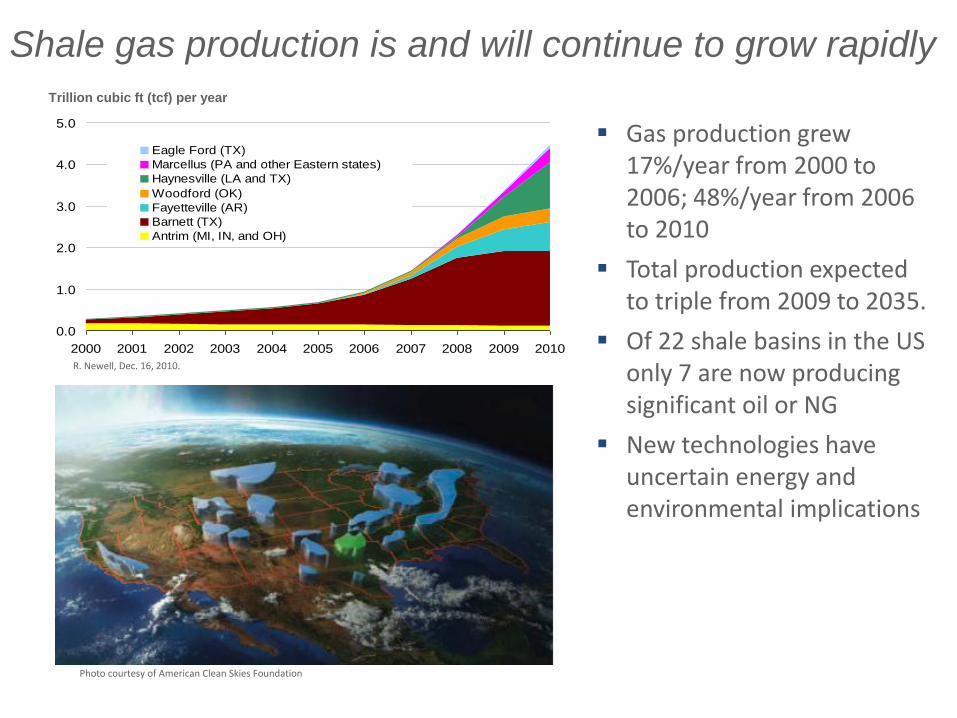
Shale gas production is and will continue to grow rapidly
expansion into new markets Gas production grew
17%/year from 2000 to 2006; 48%/year from 2006 to 2010
Total production expected to triple from 2009 to 2035.
Of 22 shale basins in the US only 7 are now producing significant oil or NG
New technologies have uncertain energy and environmental implications
0.0
1.0
2.0
3.0
4.0
5.0
2000 2001 2002 2003 2004 2005 2006 2007 2008 2009 2010
Eagle Ford (TX)
Marcellus (PA and other Eastern states)
Haynesville (LA and TX)
Woodford (OK)
Fayetteville (AR)
Barnett (TX)
Antrim (MI, IN, and OH)
Trillion cubic ft (tcf) per year
R. Newell, Dec. 16, 2010.
Photo courtesy of American Clean Skies Foundation
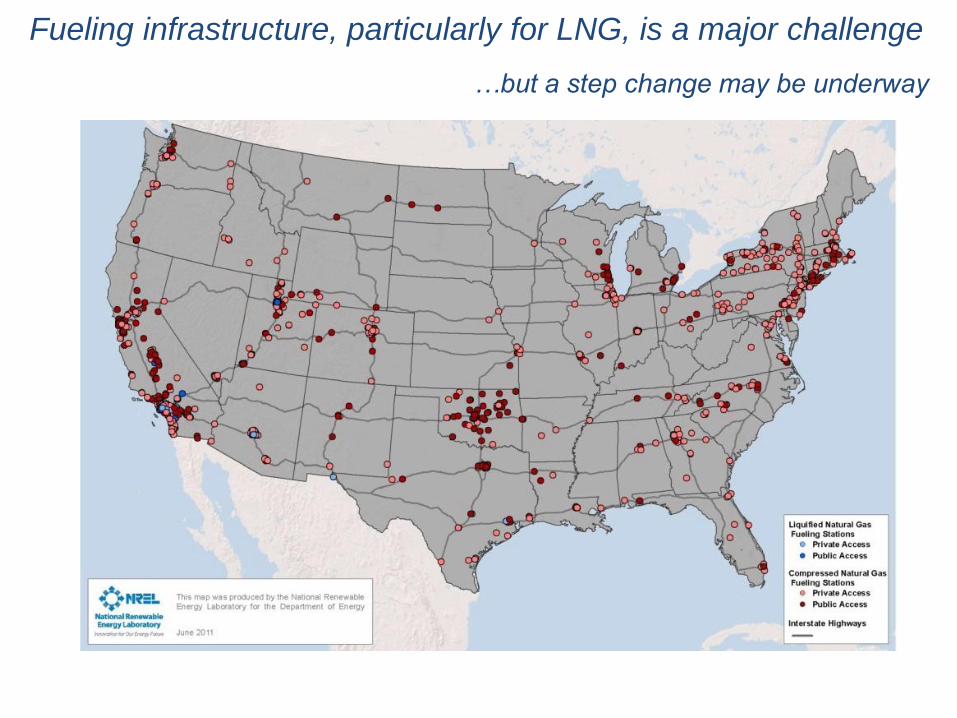
Fueling infrastructure, particularly for LNG, is a major challenge
…but a step change may be underway
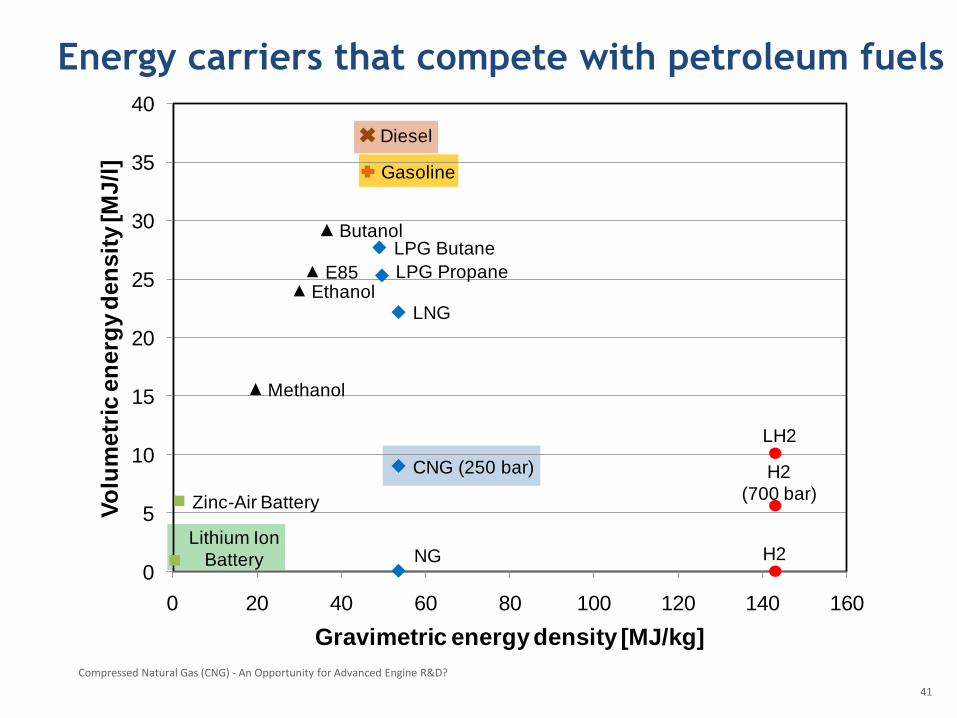
Energy carriers that compete with petroleum fuels
Compressed Natural Gas (CNG) - An Opportunity for Advanced Engine R&D?
41
Butanol
Diesel
Ethanol
Gasoline
E85
H2
H2
(700 bar)
LH2
LNG
LPG Propane
LPG Butane
Methanol
NG
CNG (250 bar)
Zinc-Air Battery
Lithium Ion
Battery0
5
10
15
20
25
30
35
40
0 20 40 60 80 100 120 140 160
Vo
lum
etr
ic e
nerg
y d
en
sit
y [M
J/l
]
Gravimetric energy density [MJ/kg]
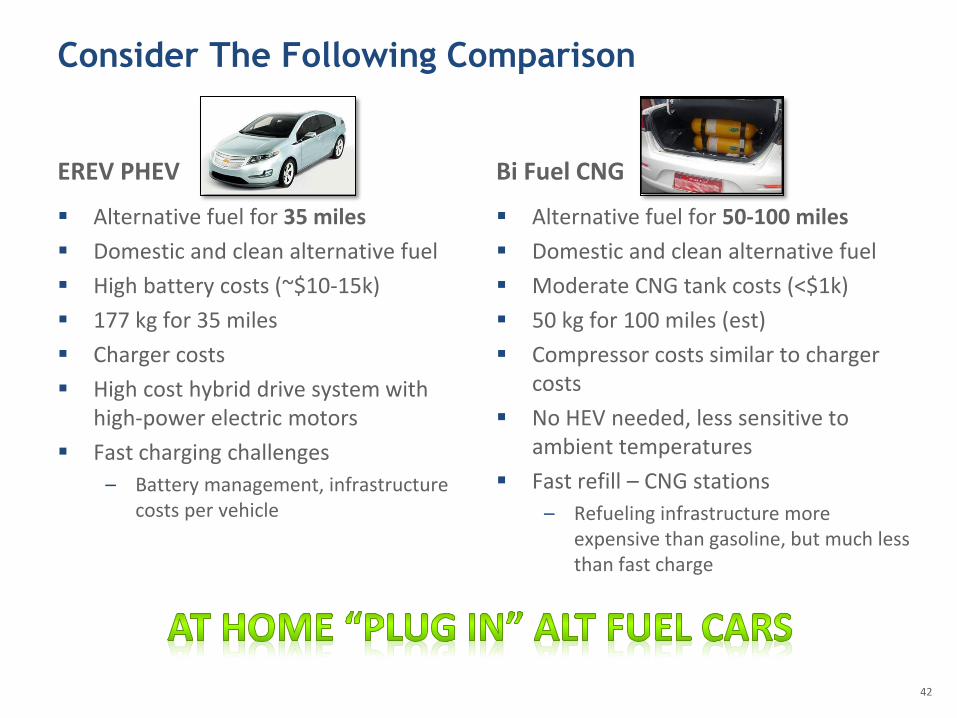
Consider The Following Comparison
EREV PHEV
Alternative fuel for 35 miles
Domestic and clean alternative fuel
High battery costs (~$10-15k)
177 kg for 35 miles
Charger costs
High cost hybrid drive system with high-power electric motors
Fast charging challenges
– Battery management, infrastructure costs per vehicle
Bi Fuel CNG
Alternative fuel for 50-100 miles
Domestic and clean alternative fuel
Moderate CNG tank costs (<$1k)
50 kg for 100 miles (est)
Compressor costs similar to charger costs
No HEV needed, less sensitive to ambient temperatures
Fast refill – CNG stations
– Refueling infrastructure more expensive than gasoline, but much less than fast charge
42
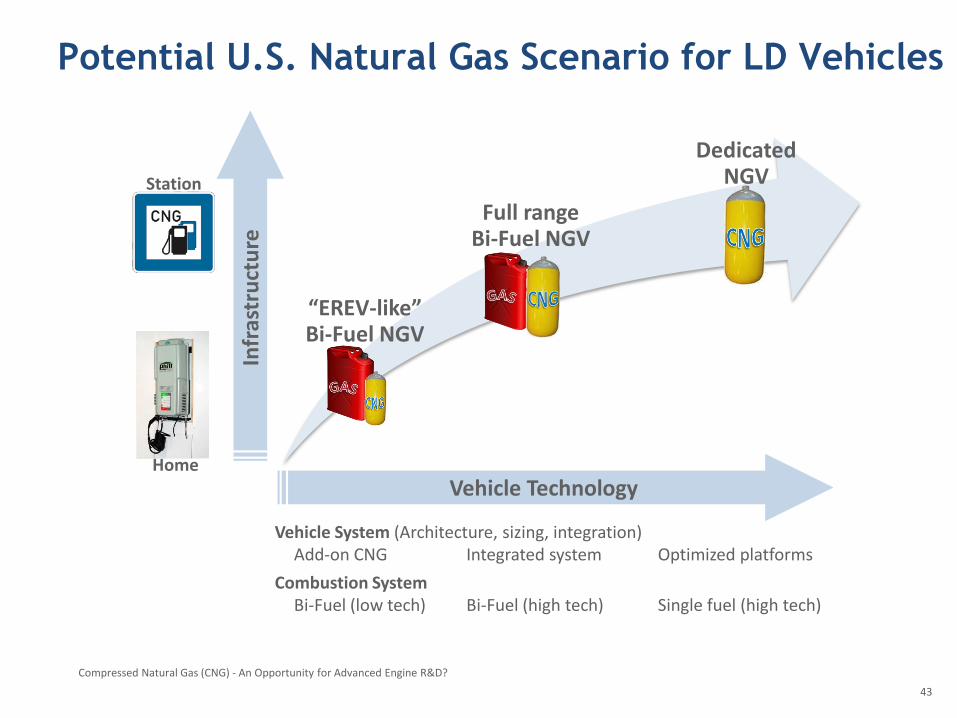
Potential U.S. Natural Gas Scenario for LD Vehicles
Compressed Natural Gas (CNG) - An Opportunity for Advanced Engine R&D?
43
Vehicle Technology
Vehicle System (Architecture, sizing, integration) Add-on CNG Integrated system Optimized platforms
Combustion System Bi-Fuel (low tech) Bi-Fuel (high tech) Single fuel (high tech)
“EREV-like” Bi-Fuel NGV
Full range Bi-Fuel NGV
Dedicated NGV
Infr
astr
uct
ure
Home
Station
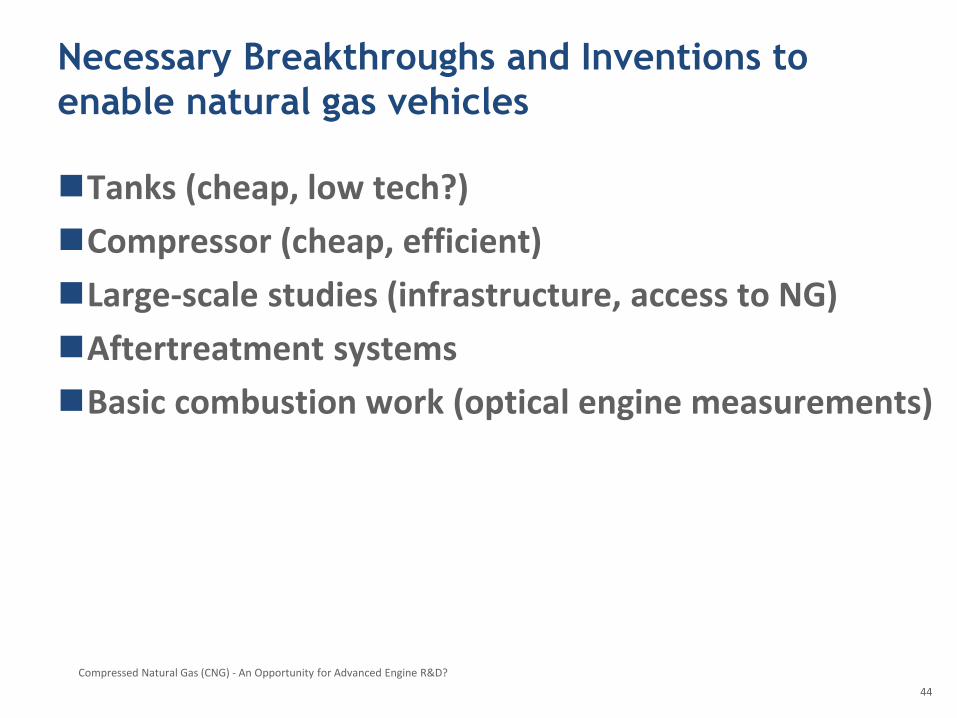
Necessary Breakthroughs and Inventions to
enable natural gas vehicles
Compressed Natural Gas (CNG) - An Opportunity for Advanced Engine R&D?
44
Tanks (cheap, low tech?)
Compressor (cheap, efficient)
Large-scale studies (infrastructure, access to NG)
Aftertreatment systems
Basic combustion work (optical engine measurements)
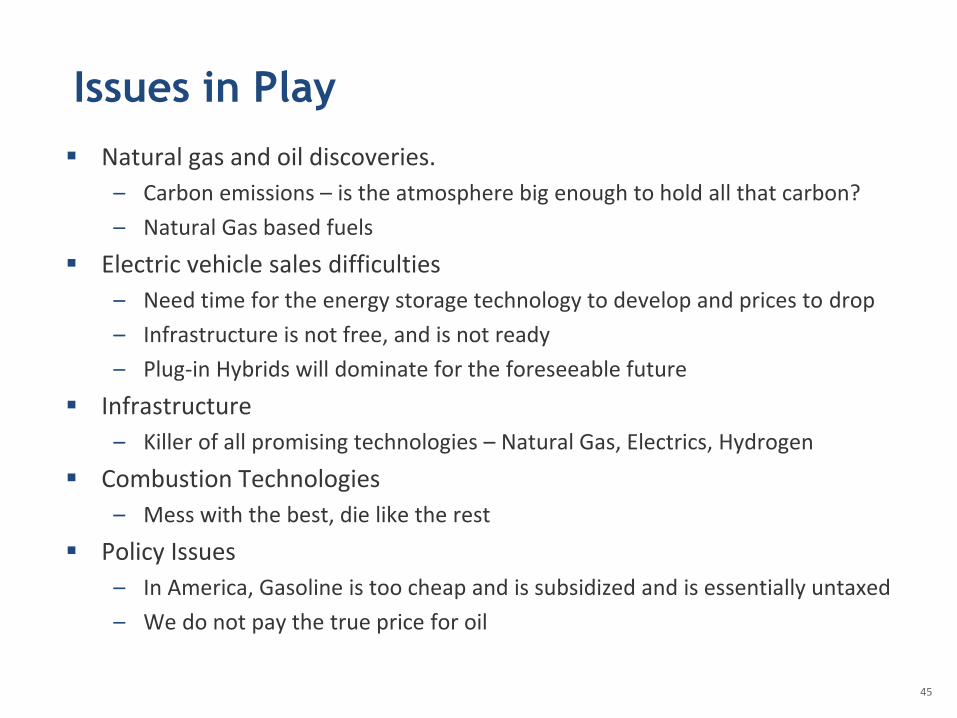
Issues in Play Natural gas and oil discoveries.
– Carbon emissions – is the atmosphere big enough to hold all that carbon?
– Natural Gas based fuels
Electric vehicle sales difficulties
– Need time for the energy storage technology to develop and prices to drop
– Infrastructure is not free, and is not ready
– Plug-in Hybrids will dominate for the foreseeable future
Infrastructure
– Killer of all promising technologies – Natural Gas, Electrics, Hydrogen
Combustion Technologies
– Mess with the best, die like the rest
Policy Issues
– In America, Gasoline is too cheap and is subsidized and is essentially untaxed
– We do not pay the true price for oil
45