Embed Size (px)
Citation preview
Advanced Workshop on Monitoring Reef Fish Spawning Aggregations
Pere, Manus Province, Papua New Guinea 2-11 June 2005
September 2005 TNC Pacific Island Countries
Report No. 6/05
Prepared by: Richard Hamilton1, Peter Mous2 and Andrew Smith1
Pacific Island Countries Coastal Marine Program
The Nature Conservancy

i
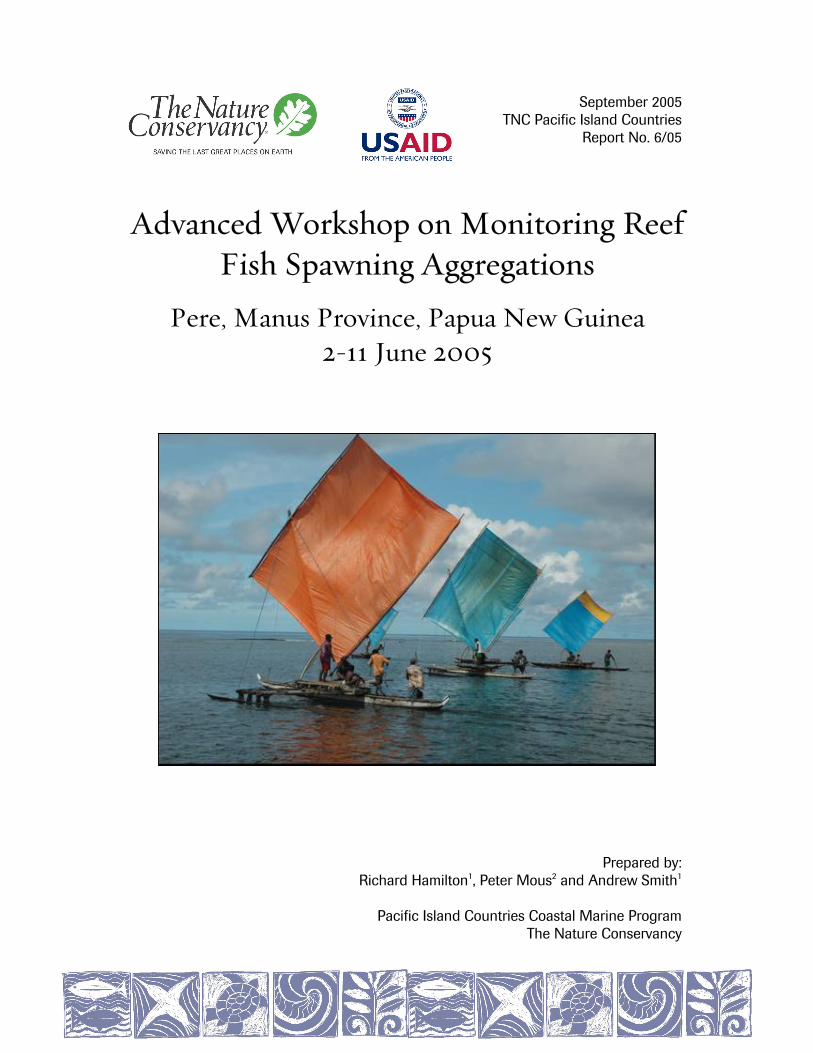
Author Contact Details: 1 51 Edmondstone Street, South Brisbane, Qld, 4101, Australia. Email: [email protected] 2 Southeast Asia Centre for Marine Protected Areas (SEACMPA) Jl. Pengembak No. 2, Sanur 80228, Bali, Indonesia Citation: Hamilton, R., P. Mous and A. Smith. 2005. Advanced Workshop on Monitoring Reef Fish Spawning Aggregations Report, Pere, Manus Province, Papua New Guinea, 2-11 June 2005. Report prepared for the Pacific Island Countries Coastal Marine Program, The Nature Conservancy. TNC Pacific Island Countries Report No. 6/05. © 2005 The Nature Conservancy All Rights Reserved. Reproduction of this publication for educational or other non-commercial purposes is authorized without prior permission from the copyright holder(s). Reproduction for resale or other commercial purposes is prohibited without prior written permission of the copyright holder(s). Acknowledgements First and foremost we thank the Pere community for hosting and entertaining us and making the workshop such a rewarding and memorable experience. We would also like to thank Manuai Matawai and Shannon Seeto for the considerable amount of effort they both put in to making sure the workshop ran smoothly. Donors This workshop was made possible through support provided by the Office of Strategic Planning, Operations and Technical Support, Bureau for Asia and the Near East, U. S. Agency for International Development, under the terms of Award No. LAG-A-00-99-00045-00. The opinions expressed herein are those of the author(s) and do not necessarily reflect the view of the U. S. Agency for International Development. Report Available From: Indo-Pacific Resource Centre The Nature Conservancy 51 Edmondstone Street South Brisbane, QLD 4101 Australia Or via the worldwide web at: www.conserveonline.org Cover photo: Racing outrigger canoes off Pere at the end of the workshop community celebration (S. Seeto).

ii
TABLE OF CONTENTS
Table of Contents .................................................................................................................................... ii List of Figures ................................................................................................................................... iii List of Tables..................................................................................................................................... iii
Introduction ............................................................................................................................................. 1 Objectives of the Workshop............................................................................................................... 1 Spawning Aggregations in Manus Province ...................................................................................... 2 Workshop opening at Pere ................................................................................................................. 3 Workshop Participants ....................................................................................................................... 4 Target Species .................................................................................................................................... 5 Sites Where Workshop Training Activates Focused.......................................................................... 6
Training Sessions and Skills.................................................................................................................... 8 Dive and Boat Safety ......................................................................................................................... 8 Transects Placement........................................................................................................................... 8 Length-Frequency Estimation ............................................................................................................ 8 Abundance Counts ............................................................................................................................. 9
Effect of divers on E. fuscoguttatus abundance .......................................................................... 10 Abundances at Site 29................................................................................................................. 11 Abundances at Site 35................................................................................................................. 12
Mapping and Calculation of Surface Area ....................................................................................... 13 Raising factors and estimates of total numbers within an aggregation ....................................... 18
Management Options for Spawning Aggregations .......................................................................... 19 Local Knowledge of Spawning Aggregations ................................................................................. 20 Monitoring Protocols for Manus ...................................................................................................... 20 Regional Spawning Aggregation Monitoring Team. ....................................................................... 20 Workshop Closing and Community Feedback................................................................................. 20
Update on Recent Live Reef Food Fish Trade Operations in Manus.................................................... 21 Lessons Learned .................................................................................................................................... 23 Recommendations ................................................................................................................................. 23
Manus specific recommendations .................................................................................................... 23 General recommendations................................................................................................................ 24
References ............................................................................................................................................. 25 Appendices ............................................................................................................................................ 27
Appendix 1. Advanced Workshop on Spawning Aggregations Monitoring Program..................... 27 Appendix 2. Participants in the Advanced Workshop on Monitoring Reef Fish Spawning Aggregations, June 2-11, 2005, Pere, Manus Province, Papua New Guinea................................... 29 Appendix 3. Dive and Boat Safety Considerations.......................................................................... 31
Dive Safety.................................................................................................................................. 31 Planning: ................................................................................................................................ 31 Equipment:............................................................................................................................. 31 Diving: ................................................................................................................................... 31 Small Boat Safety .................................................................................................................. 32
Appendix 4. Collecting Fisheries-Dependent Data from a Spawning Aggregation of the White-Streaked Grouper, Epinephelus ongus. ............................................................................................ 33
Introduction................................................................................................................................. 33 Methods....................................................................................................................................... 33 Results......................................................................................................................................... 35
Maturity stage of sampled fish............................................................................................... 35 Sex specific size structure and sex ratio................................................................................. 36
Discussion ................................................................................................................................... 37

iii
LIST OF FIGURES
Figure 1: Northeast Australia, Eastern Indonesia and Papua New Guinea. The red rectangle depicts Manus Island..................................................................................................................................... 2
Figure 2: Manus Island, Papua New Guinea. The three spawning aggregation sites are located within the red rectangle................................................................................................................................ 2
Figure 3: Arrival at Pere.......................................................................................................................... 3 Figure 4: The target species of the Manus advanced monitoring training workshop.............................. 5 Figure 5: (Taken from Mous, 2005). Maps of Site 29 and Site 35.......................................................... 7 Figure 6: Workshop participants extending a transect (left) and preparing and estimating the lengths of
plastic fish cut-outs (right). ............................................................................................................... 9 Figure 7: Number of E. fuscoguttatus sighted on transects at successive 20 minute intervals on June 6,
2005 ................................................................................................................................................ 10 Figure 8: Abundance data trends for E. fuscoguttatus. ......................................................................... 11 Figure 9: Abundance data trends for P. areolatus and E. polyphekadion.. ........................................... 11 Figure 10: Mean number of E. fuscoguttatus, P. areolatus and E. polyphekadion sighted on transects E
and F at Site 35 on June 6-8, 2005.................................................................................................. 12 Figure 11: Mapping the surface area of Site 29. ................................................................................... 13 Figure 12: Cross-section of reef slopes, indicating how the width of the slope was estimated. ........... 15 Figure 13: Expert fishers Pere from sharing their knowledge of spawning aggregations with workshop
participants...................................................................................................................................... 20 Figure 14: Dancing, speeches and feedback to the community at the workshop closing. .................... 21 Figure 15: A catch made up predominantly E. ongus. .......................................................................... 34 Figure 16: A mature, active male E. ongus.. ......................................................................................... 35 Figure 17: Mature, active female E. ongus............................................................................................ 35 Figure 18: Relative percentages of each gonad stage in female E. ongus sampled between the 4th and
8th of June 2005 (n=65).................................................................................................................. 36 Figure 19: Relative percentages of each gonad stage in male E. ongus sampled between the 4th and 8th
of June 2005 (n=24). ....................................................................................................................... 36 Figure 20: Size frequency distribution of E. ongus in 20 mm size classes (n=89)................................ 37
LIST OF TABLES
Table 1: Results of measurements and calculations of the surface area for the shallow and deep stratum at Site 29. ........................................................................................................................................ 16
Table 2: Results of measurements and calculations of the surface area for the shallow and deep stratum at Site 35. ........................................................................................................................................ 17
Table 3: Raising factors for calculating the total number of fish present in each depth stratum from the number of fish counted in each transect. ........................................................................................ 18
Table 4: Estimates of the total number of E. fuscoguttatus present in deep and shallow water stratums at Site 29 and 35 on June 7, 2005. .................................................................................................. 18
Table 5: Number of male and female E. ongus sampled on each day................................................... 33 Table 6: Criteria used in visual determination of maturity stage in grouper gonads (Pet et al. 2005). . 34
1
INTRODUCTION
Since 2003 The Nature Conservancy (TNC) has been working with local communities, fisheries departments and local NGOs in order to conserve transient spawning aggregation sites1 in the Indo-Pacific. Particular attention has been placed on raising the capacity of local communities and fisheries departments to manage and conserve spawning aggregation sites that are used by large commercially important groupers, specifically: the squaretail coralgrouper (Plectropomus areolatus), brown-marbled grouper (Epinephelus fuscoguttatus) and camouflage grouper (Epinephelus polyphekadion). These three species often form transient spawning aggregations at overlapping sites and times (Johannes et al. 1999) and these aggregations are frequently targeted by subsistence, artisanal and commercial fisheries, such as the live reef food fish trade (LRFFT) (Hamilton 2003; Sadovy et al. 2003). The predicable aggregating behavior and life history characteristics of these large groupers makes them unable to sustain high levels of fishing pressure (Sadovy and Vincent 2002), and it can take as few as two to three years of intensive fishing on transient spawning aggregations to virtually eliminate breeding populations of fishes (Johannes 1997). To design meaningful management and conservation protocols for grouper spawning aggregation sites some form of monitoring is required (Rhodes 2003). Towards this end TNC Pacific Islands Program has conducted spawning aggregation monitoring training workshops throughout the western Pacific (e.g. Rhodes, 2003, 2004), and produced a manual—together with the TNC Indonesia Program—to assist field practitioners in monitoring spawning aggregations of these three species (Pet et al. 2005). In Papua New Guinea and the Solomon Islands TNC is also actively supporting local communities, local NGOs and provincial and national fisheries departments in their efforts to monitor and conserve spawning aggregation sites. The following report highlights the findings from June 2-11, 2005 Advanced Workshop on Spawning Aggregations Monitoring that was held in Pere community, Manus Province, Papua New Guinea. The goal of the workshop was to bring together experienced monitoring practitioners from Melanesia in order to collectively review the effectiveness of the monitoring methods utilized to date, evaluate the usefulness of the Pet et al. (2005) monitoring manual in a Melanesian setting, and discuss lessons learned. The workshop also served as an opportunity to provide monitors with further training in advanced monitoring methodologies, data processing skills and interpretation of data for management. The workshop also provided the Pere Community an opportunity to discuss their management and monitoring activities and related issues with the group. The objectives of the workshop are outlined below. See Appendix 1 for the workshop program.
OBJECTIVES OF THE WORKSHOP
1. Review the effectiveness of the monitoring methods that have been implemented in the Solomon
Islands and PNG to date. 2. Develop advanced monitoring skills among the participants, focusing on mapping of aggregation
sites and length – frequency estimation. 3. Review community based and provincial wide management options for spawning aggregations in
Melanesia based on monitoring data results, local knowledge and practical experiences to date.
1 Resident aggregations form frequently and within the normal home rages of the spawning fishes, whereas Transient aggregations form tens or hundreds of kilometers from resident reefs, for short periods each year. This type of aggregation is less common and occurs in relatively fewer places (Domeier and Colin 1997).
2
4. Review the value of drawing on local knowledge for spawning aggregation research and management.
5. Compile a protocol for data handling 6. Establish the basis of a regional spawning aggregation monitoring team.
SPAWNING AGGREGATIONS IN MANUS PROVINCE
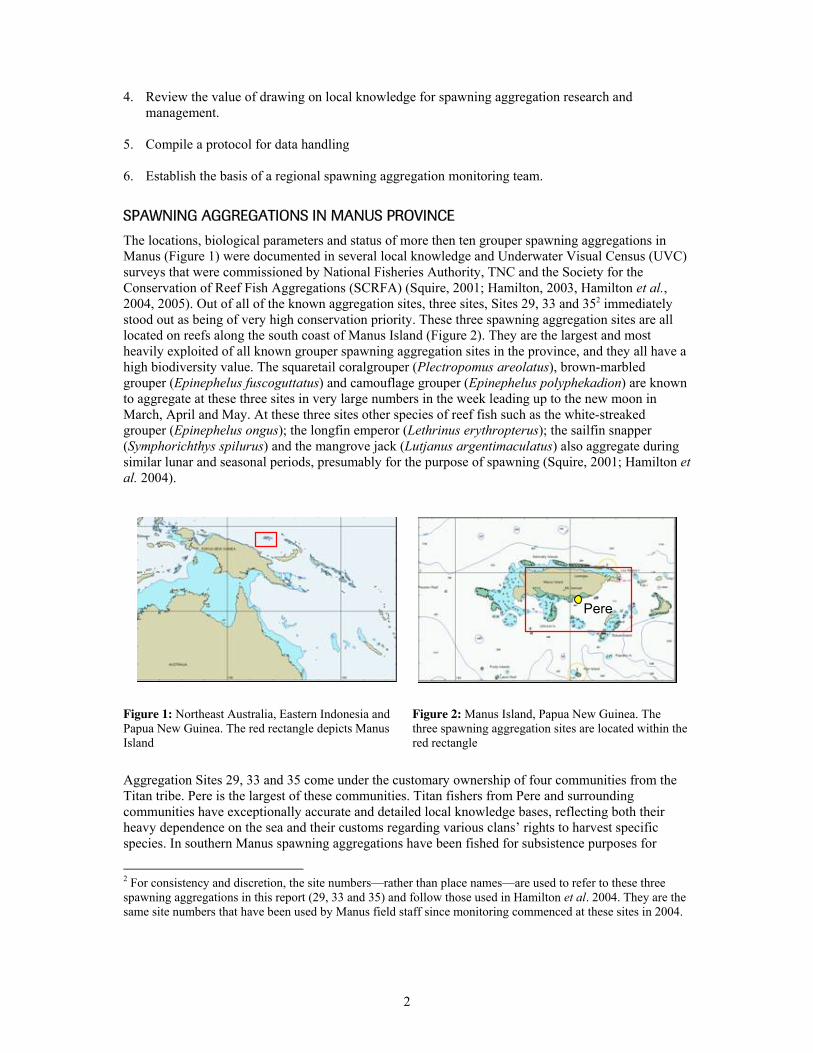
The locations, biological parameters and status of more then ten grouper spawning aggregations in Manus (Figure 1) were documented in several local knowledge and Underwater Visual Census (UVC) surveys that were commissioned by National Fisheries Authority, TNC and the Society for the Conservation of Reef Fish Aggregations (SCRFA) (Squire, 2001; Hamilton, 2003, Hamilton et al., 2004, 2005). Out of all of the known aggregation sites, three sites, Sites 29, 33 and 352 immediately stood out as being of very high conservation priority. These three spawning aggregation sites are all located on reefs along the south coast of Manus Island (Figure 2). They are the largest and most heavily exploited of all known grouper spawning aggregation sites in the province, and they all have a high biodiversity value. The squaretail coralgrouper (Plectropomus areolatus), brown-marbled grouper (Epinephelus fuscoguttatus) and camouflage grouper (Epinephelus polyphekadion) are known to aggregate at these three sites in very large numbers in the week leading up to the new moon in March, April and May. At these three sites other species of reef fish such as the white-streaked grouper (Epinephelus ongus); the longfin emperor (Lethrinus erythropterus); the sailfin snapper (Symphorichthys spilurus) and the mangrove jack (Lutjanus argentimaculatus) also aggregate during similar lunar and seasonal periods, presumably for the purpose of spawning (Squire, 2001; Hamilton et al. 2004).
Figure 1: Northeast Australia, Eastern Indonesia and Papua New Guinea. The red rectangle depicts Manus Island
Figure 2: Manus Island, Papua New Guinea. The three spawning aggregation sites are located within the red rectangle
Aggregation Sites 29, 33 and 35 come under the customary ownership of four communities from the Titan tribe. Pere is the largest of these communities. Titan fishers from Pere and surrounding communities have exceptionally accurate and detailed local knowledge bases, reflecting both their heavy dependence on the sea and their customs regarding various clans’ rights to harvest specific species. In southern Manus spawning aggregations have been fished for subsistence purposes for
2 For consistency and discretion, the site numbers—rather than place names—are used to refer to these three spawning aggregations in this report (29, 33 and 35) and follow those used in Hamilton et al. 2004. They are the same site numbers that have been used by Manus field staff since monitoring commenced at these sites in 2004.
Pere
3
generations; with Titan fishers considering the eggs of aggregating groupers to be a delicacy. In recent decades market driven fishing at these aggregation sites has also increased. The predominant fishing method used by artisanal fishers is nighttime spearfishing, with fishers typically limiting their activities to lunar days when aggregation numbers are known to peak. Catches are typically smoked and then sold in open markets at Lorengau, the capital of Manus Province. The combined subsistence and artisanal fishing appears to have had a substantial negative impact on these aggregations, with local fishers reporting that catch rates of P. areolatus and E. fuscoguttatus have declined dramatically in recent decades (Hamilton, 2003; Hamilton et al., 2004; 2005). Many fishers are well aware that their activities have caused these declines, listing nighttime spearfishing, an increase in market driven fishing, and human population growth as the main reasons why they believed catches have declined. In early 2004 the communities that own the reefs on which aggregation sites 29, 33 and 35 are located expressed an interest in conserving their aggregations, and they requested that TNC provide them with technical assistance in their efforts. TNC staff subsequently held community awareness meetings in the relevant costal communities, and then over a period of several months consulted with community leaders on the likely effectiveness of management options that they were considering for their spawning sites. By May 2004 all four Titan communities had banned spearfishing at these three aggregation sites in the ten days leading up to and including the new moon in every month of the year. Capturing fish for sale was also banned. Subsistence hook and line fishing was allowed at these sites, but fishers could only catch enough fish to meet daily food requirements. It is noteworthy that the Titan communities all made a point of not stating how long harvesting restrictions will be in place. Rather, the communities stated that the suitability and effectiveness of these initial restrictions would be reassessed in several years time. Immediately after imposing harvesting restrictions at their aggregation sites, the Titan communities asked TNC to assist them in monitoring their aggregations so that the effectiveness of their new management strategies could be evaluated. To this end, in May 2004 TNC field staff and trained community members began carrying out UVC monitoring at each of these aggregation sites. Monitoring at these sites is being conducted on SCUBA and involves conducting monthly UVC surveys along permanent belt transects just prior to the new moon. Specific details on the monitoring methodology being employed are outlined in Pet et al. (2005).
WORKSHOP OPENING AT PERE
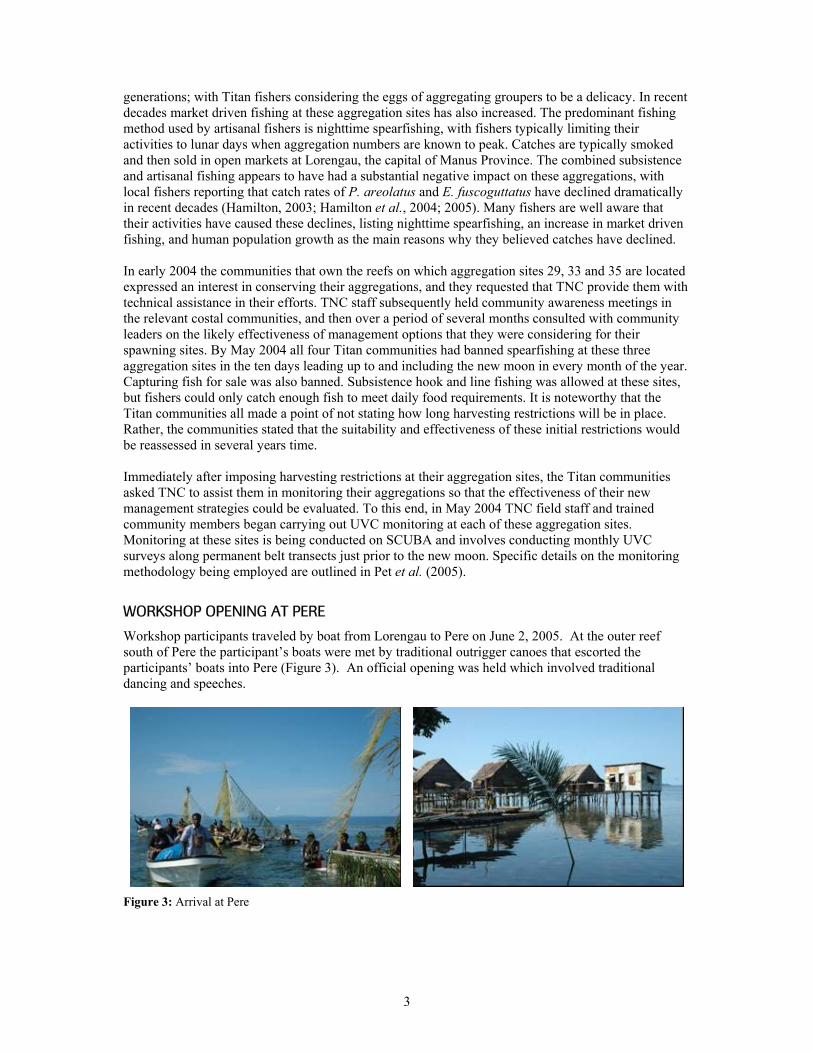
Workshop participants traveled by boat from Lorengau to Pere on June 2, 2005. At the outer reef south of Pere the participant’s boats were met by traditional outrigger canoes that escorted the participants’ boats into Pere (Figure 3). An official opening was held which involved traditional dancing and speeches.
Figure 3: Arrival at Pere

4
WORKSHOP PARTICIPANTS
Participants from universities, national fisheries departments and non-government organizations (NGOs) participated in this workshop. The majority of participants were from Papuan New Guinea and the Solomon Islands. Participants and their affiliations are as follows (contact details given in Appendix 2): • Conservation International – Noel Wangunu • PNG National Fisheries Authority – Leban Gisawa • Roviana Spawning Aggregation Monitoring Team – Warren Kama & Michael Giningele • The Nature Conservancy – Joseph Aitsi, Lawrence Litau, Tapas Potuku, Manuai Matawai, Jerry
Pakop, Annisah Sapul • Wildlife Conservation Society – Daniel Afzal • University of Papua New Guinea – Geua Ganiga Workshop trainers: • Dr Richard Hamilton (TNC Melanesia) • Dr Peter Mous (TNC Indonesia) • Dr Andrew Smith (TNC Pacific) • Shannon Seeto (TNC PNG – Dive Safety Officer)
5
TARGET SPECIES
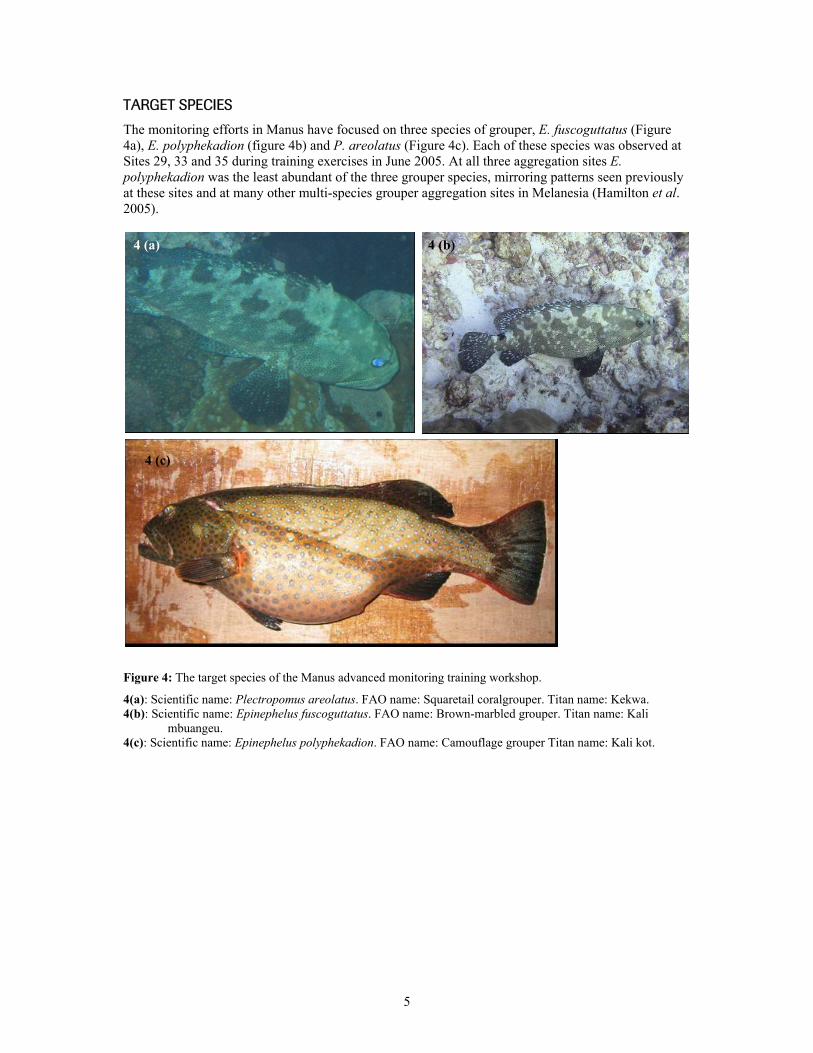
The monitoring efforts in Manus have focused on three species of grouper, E. fuscoguttatus (Figure 4a), E. polyphekadion (figure 4b) and P. areolatus (Figure 4c). Each of these species was observed at Sites 29, 33 and 35 during training exercises in June 2005. At all three aggregation sites E. polyphekadion was the least abundant of the three grouper species, mirroring patterns seen previously at these sites and at many other multi-species grouper aggregation sites in Melanesia (Hamilton et al. 2005).
Figure 4: The target species of the Manus advanced monitoring training workshop.
4(a): Scientific name: Plectropomus areolatus. FAO name: Squaretail coralgrouper. Titan name: Kekwa. 4(b): Scientific name: Epinephelus fuscoguttatus. FAO name: Brown-marbled grouper. Titan name: Kali
mbuangeu. 4(c): Scientific name: Epinephelus polyphekadion. FAO name: Camouflage grouper Titan name: Kali kot.
4 (a) 4 (b)
4 (c)
6
SITES WHERE WORKSHOP TRAINING ACTIVATES FOCUSED
Given the relatively close proximity of all three spawning aggregation sites to our workshop base at Pere, we decided to carry out training activities at two aggregation sites. Training activities were carried out at Sites 29 and 35 over the duration of this workshop. Site 33 was excluded as orientation SCUBA dives that were conducted at the start of the workshop revealed that the aggregation at Site 33 was much smaller than aggregations at Sites 29 and 35, and visibility was lower. Sites 29 Site 29 comprises a 320 m long section at the southwestern corner of a large reef (10s of km). The reef is a steep slope or a wall, leveling out in a sandy bottom at about 45 m depth (Figure 5). P. areolatus primarily aggregates in the shallower part of this site (3-15 m depth), whereas E. fuscoguttatus is primarily found in the deeper part (15 – 45 m depth). The reef of Site 29 is separated from Manus by a broad shallow back reef. UVC surveys conducted at Sites 29, 33 and 35 in May and June 2004 revealed that the number of aggregating groupers were too large to count at these sites during a peak aggregation period, so a decision was made to sub-sample each aggregation. In July 2004 two 500 m. sq. permanent transects (50 m x 10 m wide) were placed at Site 29. Transect A was placed at a mean depth of 30 m and transect B was placed at a mean depth of 15 m. Transect A samples the main E. fuscoguttatus aggregation, whereas transect B samples the main P. areolatus aggregation. Site 35 Site 35 comprises a 410 m long section at the southeastern corner of a large reef (10s of km). The shallower part of the site (2-15 m) is mostly a slope, whereas the deeper part of the reef is mostly a steep wall that drops to a sandy bottom at about 60 m depth (Figure 5). P. areolatus primarily aggregates in the shallower part of this site (2-15 m depth), whereas E. fuscoguttatus is primarily found in the deeper part (15 – 60 m depth). E. fuscoguttatus is known to be most densely aggregated around the reef promontory at this site. In July 2004 a 500 m. sq. permanent transect (50 m x 10 m wide) and a 1000 m. sq. permanent transect (100 m x 10 m) were placed at Site 35. Transect E (500 m. sq.) was placed at a mean depth of 20 m around the reef promontory and transect F (1000 m. sq.) was placed at a mean depth of 15 m in the middle of the aggregation site.
7
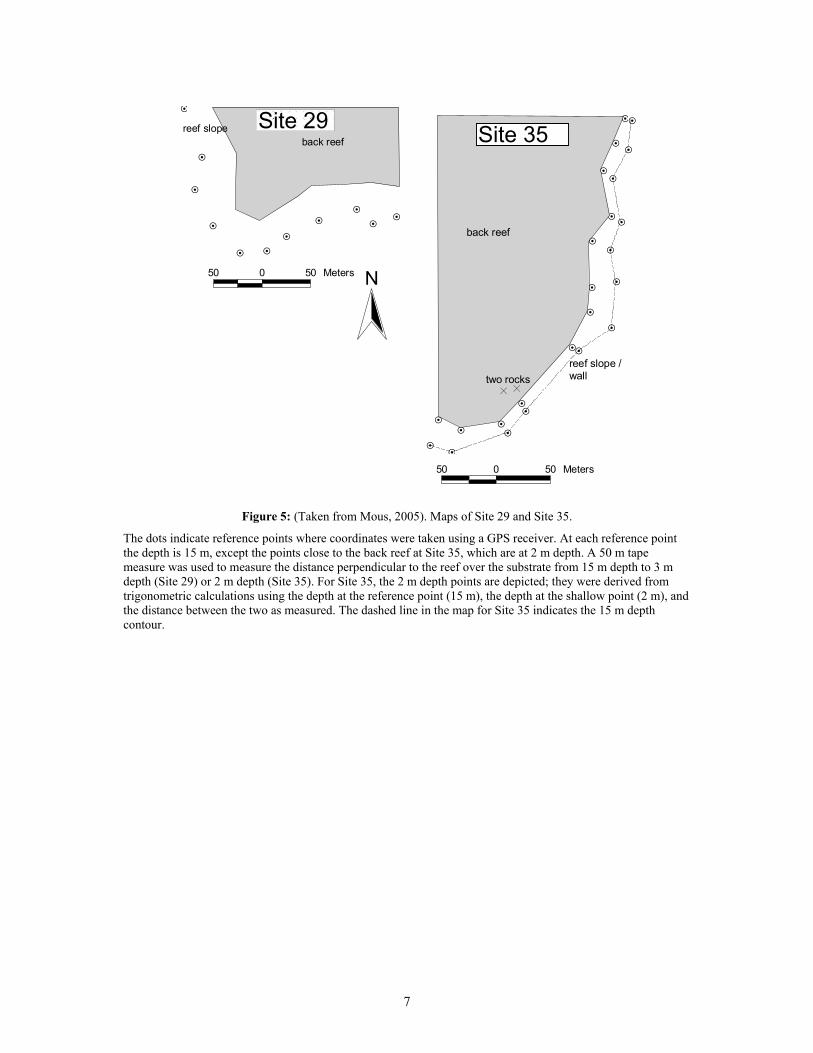
Figure 5: (Taken from Mous, 2005). Maps of Site 29 and Site 35.
The dots indicate reference points where coordinates were taken using a GPS receiver. At each reference point the depth is 15 m, except the points close to the back reef at Site 35, which are at 2 m depth. A 50 m tape measure was used to measure the distance perpendicular to the reef over the substrate from 15 m depth to 3 m depth (Site 29) or 2 m depth (Site 35). For Site 35, the 2 m depth points are depicted; they were derived from trigonometric calculations using the depth at the reference point (15 m), the depth at the shallow point (2 m), and the distance between the two as measured. The dashed line in the map for Site 35 indicates the 15 m depth contour.
#Y
#Y
#Y
#Y
#Y
#Y
#Y
#Y
#Y
#Y
#Y#Y
#Y#Y
#Y
#Y
#Y
#Y
#Y
#Y
#Y
#Y
#Y
#Y
NNtwo rocks
back reef
reef slope /wall
50 0 50 Meters
#Y#Y
#Y#Y
#Y
#Y#Y
#Y
#Y
#Y
#Y
back reefreef slope
50 0 50 Meters N
ToloasPrempat Site 35 Site 29
8
TRAINING SESSIONS AND SKILLS
DIVE AND BOAT SAFETY
The first session of the workshop involved a group discussion on SCUBA diving and boat safety issues. As a result of this session we drafted safety guidelines that participants should consider whenever monitoring reef fish spawning aggregations on SCUBA (Appendix 3).
TRANSECTS PLACEMENT
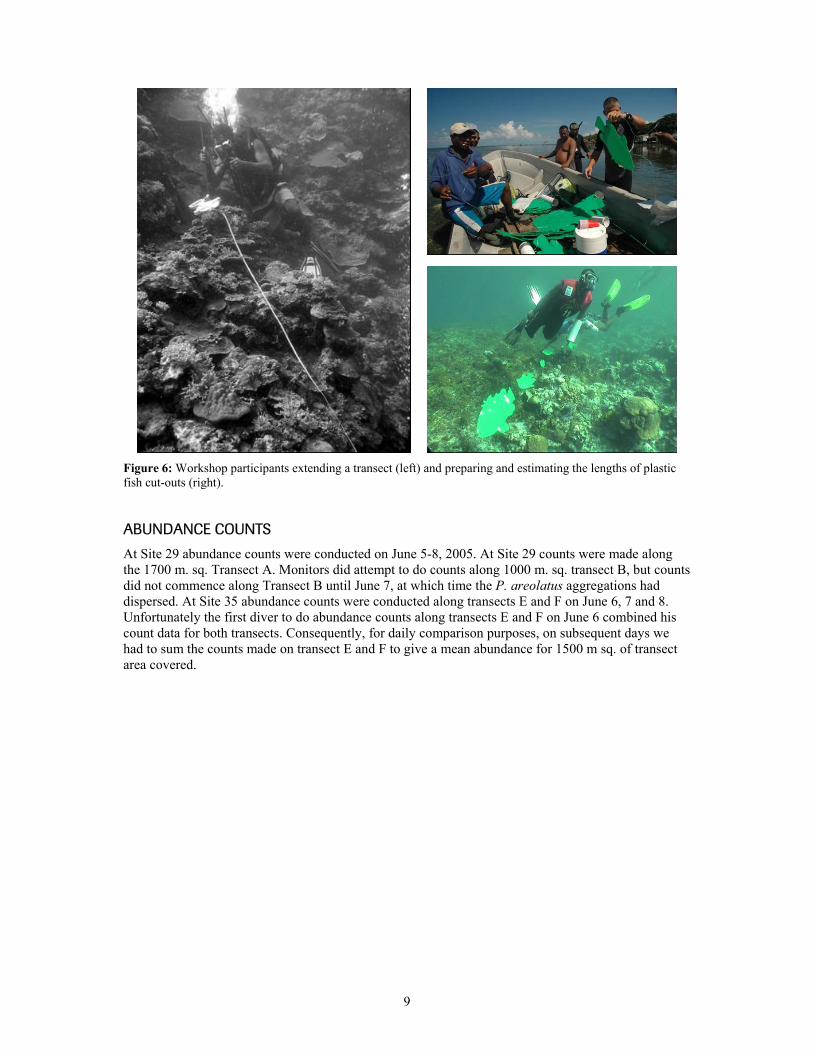
Early on in the workshop a group discussion was held on the effectiveness of using transects to sub-sample multi-species aggregations that form over large areas and different depth profiles. One of the points that was raised by the participants was that short transects (500 m. sq.) were potentially problematic in that there was a high probability of getting a zero count from a transect when abundances are low, or, when fish moved within the aggregation boundaries in response to changing environmental factors such as the tides. Practitioners had noted that this was a particular problem when the aggregation area was large, but fish numbers where low as a result of overfishing. In one such scenario, Kavieng monitors had noted groupers that aggregate at an overfished site were patchily distributed over the entire site, and these small groups of groupers often shift within the wider aggregation boundaries from month to month. It was also agreed that the current transects that were established at Site 29 and 35 only covered a small proportion of the total aggregation areas. On the basis of these discussions it was decided that when transects were being used to monitor aggregations the best option is to place transects through as much of the aggregation as logistically possible, so that any small scale horizontal shifts within the aggregation boundaries between sampling periods are accounted for. It was widely agreed that for P. areolatus and E. fuscoguttatus vertical shifts within the aggregation boundaries were unlikely to be extreme, since these species typically stay within well-defined depth ranges. Pet et al. (2005) recommend using 20 m wide transects, but the visibility at the monitored aggregation sites in Manus is often well below 20 m, so it was decided to continue to use 10 m wide transects. Participants agreed that all of the transects at monitored sites in Manus should also be extended and on June 3-4 practitioners began this process by extending the deep transect A at Site 29 by 120m so that it ran through most of the E. fuscoguttatus aggregation, hereby bringing the transect A area to 1700 m. sq. Transect B, the shallow water transect that samples the main P. areolatus aggregation was also extended by 50 m by practitioners (Figure 6).
LENGTH-FREQUENCY ESTIMATION
Workshop participants spent a day being trained in estimating the lengths of groupers. This initially involved training in estimating the lengths of plastic fish cutouts in the field (Figure 6), followed by training in estimating the lengths of groupers that had aggregated at Sites 29 and 35.
9
Figure 6: Workshop participants extending a transect (left) and preparing and estimating the lengths of plastic fish cut-outs (right).
ABUNDANCE COUNTS
At Site 29 abundance counts were conducted on June 5-8, 2005. At Site 29 counts were made along the 1700 m. sq. Transect A. Monitors did attempt to do counts along 1000 m. sq. transect B, but counts did not commence along Transect B until June 7, at which time the P. areolatus aggregations had dispersed. At Site 35 abundance counts were conducted along transects E and F on June 6, 7 and 8. Unfortunately the first diver to do abundance counts along transects E and F on June 6 combined his count data for both transects. Consequently, for daily comparison purposes, on subsequent days we had to sum the counts made on transect E and F to give a mean abundance for 1500 m sq. of transect area covered.
10
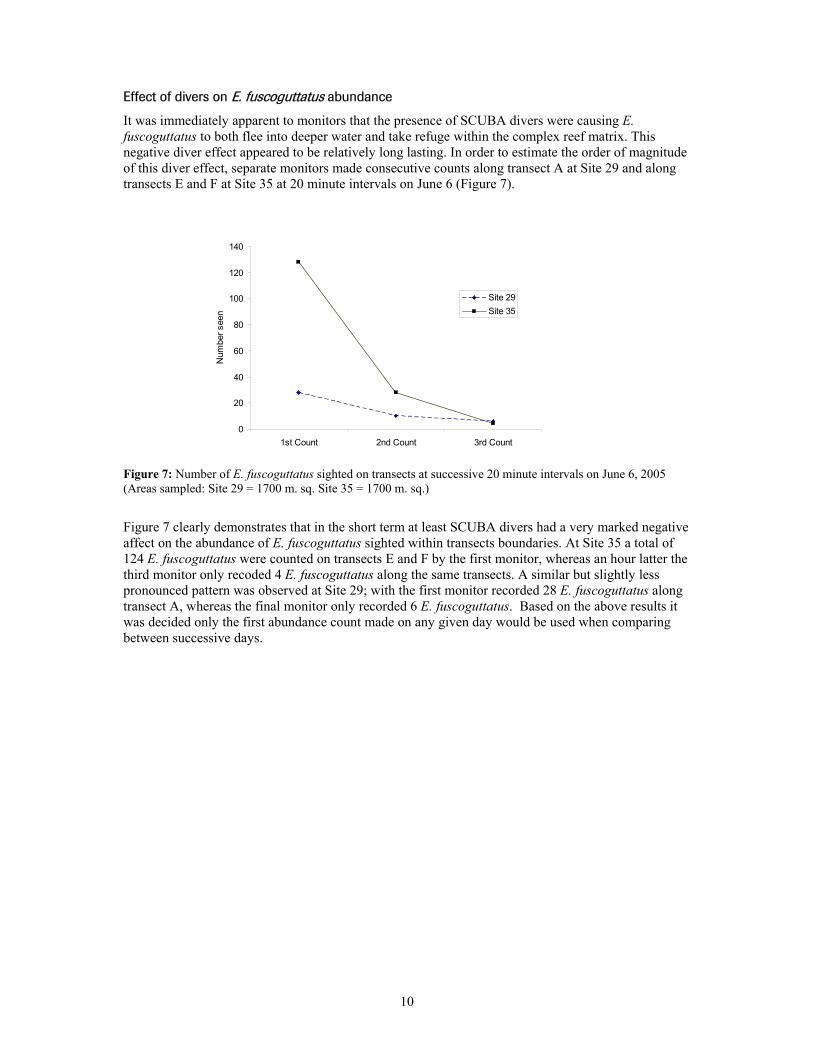
Effect of divers on E. fuscoguttatus abundance
It was immediately apparent to monitors that the presence of SCUBA divers were causing E. fuscoguttatus to both flee into deeper water and take refuge within the complex reef matrix. This negative diver effect appeared to be relatively long lasting. In order to estimate the order of magnitude of this diver effect, separate monitors made consecutive counts along transect A at Site 29 and along transects E and F at Site 35 at 20 minute intervals on June 6 (Figure 7).
0
20
40
60
80
100
120
140
1st Count 2nd Count 3rd Count
Num
ber s
een
Site 29Site 35
Figure 7: Number of E. fuscoguttatus sighted on transects at successive 20 minute intervals on June 6, 2005 (Areas sampled: Site 29 = 1700 m. sq. Site 35 = 1700 m. sq.)
Figure 7 clearly demonstrates that in the short term at least SCUBA divers had a very marked negative affect on the abundance of E. fuscoguttatus sighted within transects boundaries. At Site 35 a total of 124 E. fuscoguttatus were counted on transects E and F by the first monitor, whereas an hour latter the third monitor only recoded 4 E. fuscoguttatus along the same transects. A similar but slightly less pronounced pattern was observed at Site 29; with the first monitor recorded 28 E. fuscoguttatus along transect A, whereas the final monitor only recorded 6 E. fuscoguttatus. Based on the above results it was decided only the first abundance count made on any given day would be used when comparing between successive days.
11
Abundances at Site 29
Abundance trends for E. fuscoguttatus at Site 29 are shown in Figure 8. The count data represents the first abundance count made along transect A for a given day. This first count was either made by a single monitor or pairs of monitors swimming along side by side. Where pairs of monitors made a count, the mean number of fish sighted (+/- one standard deviation) is shown on the graph.
0
10
20
30
40
50
60
70
80
5th June 6th June 7th June (new moon) 8th June
Date
Num
ber o
f fis
h pe
r 170
0 m
.sq
Figure 8: Abundance data trends for E. fuscoguttatus. Counts were made transect on A (1700 m. sq.) at Site 29.
Abundances of P. areolatus and E. polyphekadion were so low on transect A that no meaningful patterns could be established from this data (Figure 9).
0
2
4
6
8
10
12
14
16
18
20
5th June 6th June 7th June (new moon) 8th June
Date
Num
ber o
f fis
h pe
r 170
0 m
.sq P. areolatus
E. polyphekadion
Figure 9: Abundance data trends for P. areolatus and E. polyphekadion. Counts were made on Transect A (1700 m. sq.) at Site 29.
12
Abundances at Site 35
Abundance trends for E. fuscoguttatus, P. areolatus and E. polyphekadion at Site 35 are shown in Figures 10. The count data represents the sum of the first counts made along transect E and F for each day that monitoring was conduced. This first count was either made by a single monitor or pairs of monitors swimming along side by side. Where pairs of monitors made a count, the mean number of fish sighted (+/- one standard deviation) is shown on the graph.
Epinephelus fuscoguttatus
020406080
100120140160
6th June 7th June (new moon) 8th June
Date
Num
ber o
f fis
h se
en p
er 1
500
m.s
q
Plectropomus areolatus
01020304050607080
6th June 7th June (new moon) 8th June
Date
Num
ber o
f fis
h si
ghte
d pe
r 150
0 m
.sq
Epinephelus polyphekadion
0
5
10
15
20
25
6th June 7th June (new moon) 8th June
Date
Num
ber o
f fis
h si
ghte
d pe
r 150
0 m
.sq
Figure 10: Mean number of E. fuscoguttatus, P. areolatus and E. polyphekadion sighted on transects E and F at Site 35 on June 6-8, 2005.
Abundance trends for E. fuscoguttatus at Site 29 suggest that peak abundances for this species may have occurred on or prior to June 5, 20053, with abundances declining rapidly to nearly zero between June 7 and 8. At Site 35 a similar general pattern was seen for E. fuscoguttatus, with the highest mean
3 Several experienced workshop participants who dived regularly at Site 29 in June 2005 were of the opinion that E. fuscoguttatus abundances at this site were highest several days prior to abundance counts commencing.
13
abundances recorded on June 6, with abundances having dropped dramatically by June 8. At Site 35 E. polyphekadion showed a similar trend to that seen for E. fuscoguttatus. At Site 35 P. areolatus aggregations had largely dispersed a day earlier than E. fuscoguttatus, with only low numbers sighted on June 7. Although not quantitatively documented, an identical pattern was seen for this species at Site 29. Abundances of P. areolatus were high at Site 29 on June 6 when the shallow water transect B was being extended, but had largely dispersed the following day. The results indicate that if a single day’s monitoring had been conducted at Site 29 and 35 on June 6 or 7, these ‘snapshots’ of the aggregations would have confirmed that large aggregations of E. fuscoguttatus had formed at both sites, but the P. areolatus abundances at both sites would be greatly underestimated. The fact that P. areolatus was largely dispersed at both sites by the new moon in June 2005 was somewhat unexpected, as intensive daily monitoring in at Site 35 in October 2004 revealed that P. areolatus aggregations did not disperse until three days after the new moon (Manuai Matawai, unpublished data October 2004). Clearly even at the Site level in Manus the lunar days on which aggregations peak and subsequently begin to disperse can be quite variable between months.
MAPPING AND CALCULATION OF SURFACE AREA
Workshop mapping exercises at Site 29 and 35 were planned for June 7-8, which in hindsight was unfortunate, as by the time we commenced with this exercise the P. areolatus aggregations had largely dispersed at both sites, and all aggregations had dispersed by June 8. Despite the absence of the groupers, we conducted and aggregation surface area mapping exercise as planned. We did this by simply estimating where the aggregation boundaries had been at Site 29 and 35. Although far from ideal, this exercise was relatively accurate, as one of the authors (PM) had made notes on aggregation boundaries at both sites prior to June 7, and we utilized the Manus monitors’ extensive knowledge of the topography and spatial boundaries of the aggregations at Site 29 and 35. The participants of the Pere training workshop used a simple procedure to estimate the surface area of the aggregation site. The surface area was calculated by assessing the width of the site at regularly spaced points along the site (Figure 11), and by multiplying the average of these widths with the total length of the site.
Figure 11: Mapping the surface area of Site 29.
14
A more detailed description of the procedure is as follows (see also Figure 12).
• Two dives, one at 15 m depth and one between 25 and 40 m depth were made at each site in the five-day period before new moon to get a rough idea on the horizontal and vertical distribution of aggregating fish. The shallow part at Site 35 was assessed by free diving, the rest was done on SCUBA. The results were discussed with the Manus monitoring team, and agreement was reached on the rough outer boundaries of the spawning aggregation site. Both species were found in the same section of the reef (i.e., the horizontal distribution patterns overlapped). Numbers for E. polyphekadion were too low to get an accurate assessment of their distribution pattern, but it was clear that this species was only found within the boundaries of the site as described from the distribution patterns of the other two species.
• Beginning and end of the aggregation site were marked with re-bars installed at 15 m depth.
• For the purpose of estimating the total surface area, workshop participants decided to sub-
divide the site in two depth strata, separated by the 15 m depth contour; P. areolatus dominates the shallower part and E. fuscoguttatus the deeper part of the aggregation site. These two depth strata were mapped separately.
• The shallow depth stratum (2-15 m depth for Site 35, 3-15 m depth for Site 29) was mapped
by three SCUBA divers assisted by a snorkeler who worked with an open 23 ft speedboat that had a field worker with a GPS to take records. The SCUBA divers followed the 15 m depth contour along the entire aggregation site, stopping at regular intervals of about 30 m (or about 2 min swimming). At each stop the width of the shallow part of the aggregation site was measured by the SCUBA divers, who put a 50 m tape measure over the substrate from 15 m depth to 3 m depth (Site 29) or 2 m depth (Site 35) perpendicular to the reef. The last part (from about 8 m upwards) was done by the snorkeler who took over the tape measure from the SCUBA diver. The snorkeler took the measurement, which he reported to the data recorder onboard the speedboat. The data recorder also took a GPS reading at the point where a width measurement was done.
• The deeper stratum was mapped by three SCUBA divers following the 15 m depth contour
who assessed the topography of the reef from 15 m downward to the sandy bottom. For Site 29, this was done by measuring or estimating depth at points at regular intervals along the site (1.5 – 2 min swimming apart), and by estimating the angle of the reef slope at these points. The width of the deep stratum of the site between 15 m depth was calculated with the formula (D1 – D2)/sin(S), where D1 is the depth at the end of the slope where aggregating fish (mostly E. fuscoguttatus) were still found to occur, D2 is the depth of the shallower boundary of the deep stratum (15 m) and S is the estimated slope over the deep stratum (in radians). Obviously, this approach only gives accurate results if the slope is more or less constant throughout the depth range at each point. This was not always the case in Site 35, where the slope transitioned into a steep wall at a depth of about 20 m. In such situations, the width of the deep stratum was estimated by estimating the depth range of the wall (D3-D4 in Figure 12 B), and by measuring the length over the substrate from the 15 m depth contour to the point where the slope transitioned into the wall. This method assumes that E. fuscoguttatus is distributed on the wall in the same way as on the less steep parts of the deep stratum. This assumption was not confirmed during the training workshop, and it needs verification during in the 2006 aggregating period.
• The surface area of the shallow and deep strata was calculated by averaging estimated widths
and multiplying the average with the length of the aggregation site. Results of this procedure are summarized in Table 1 for Site 29 and in Table 2 for Site 35.
15
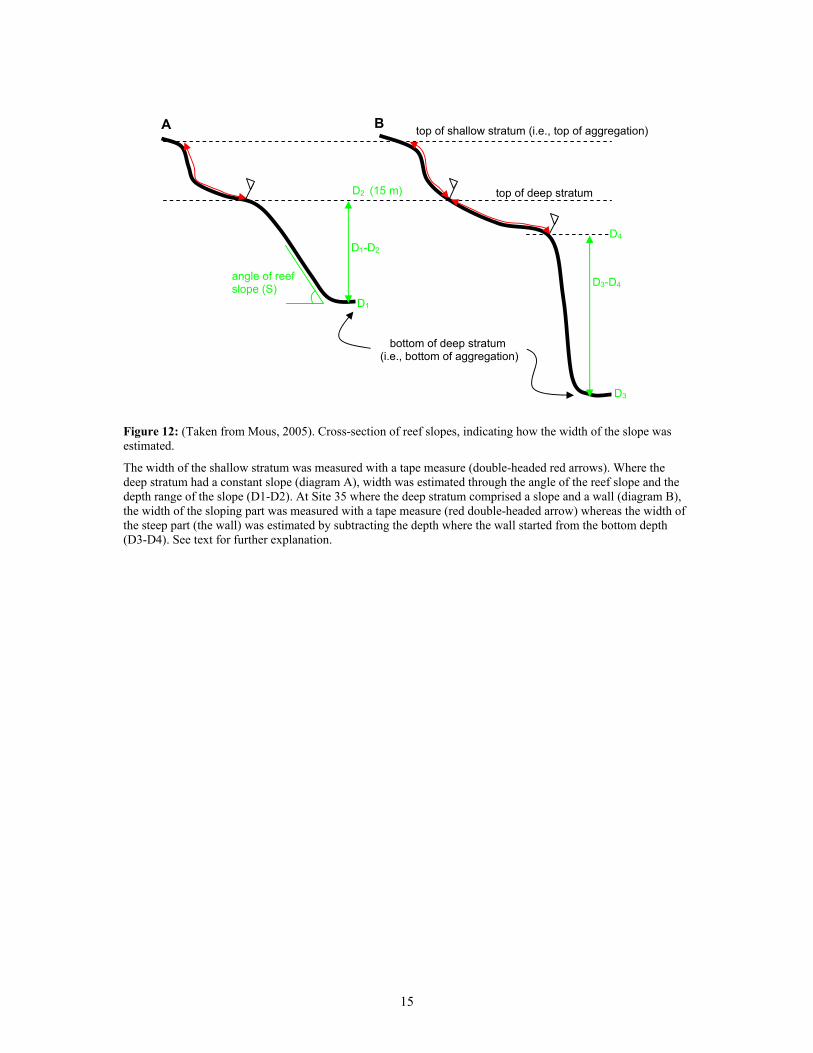
Figure 12: (Taken from Mous, 2005). Cross-section of reef slopes, indicating how the width of the slope was estimated.
The width of the shallow stratum was measured with a tape measure (double-headed red arrows). Where the deep stratum had a constant slope (diagram A), width was estimated through the angle of the reef slope and the depth range of the slope (D1-D2). At Site 35 where the deep stratum comprised a slope and a wall (diagram B), the width of the sloping part was measured with a tape measure (red double-headed arrow) whereas the width of the steep part (the wall) was estimated by subtracting the depth where the wall started from the bottom depth (D3-D4). See text for further explanation.
angle of reef slope (S)
D1-D2
D3-D4
D2 (15 m)
D1
D4
D3
top of shallow stratum (i.e., top of aggregation)
top of deep stratum
bottom of deep stratum (i.e., bottom of aggregation)
A B
16
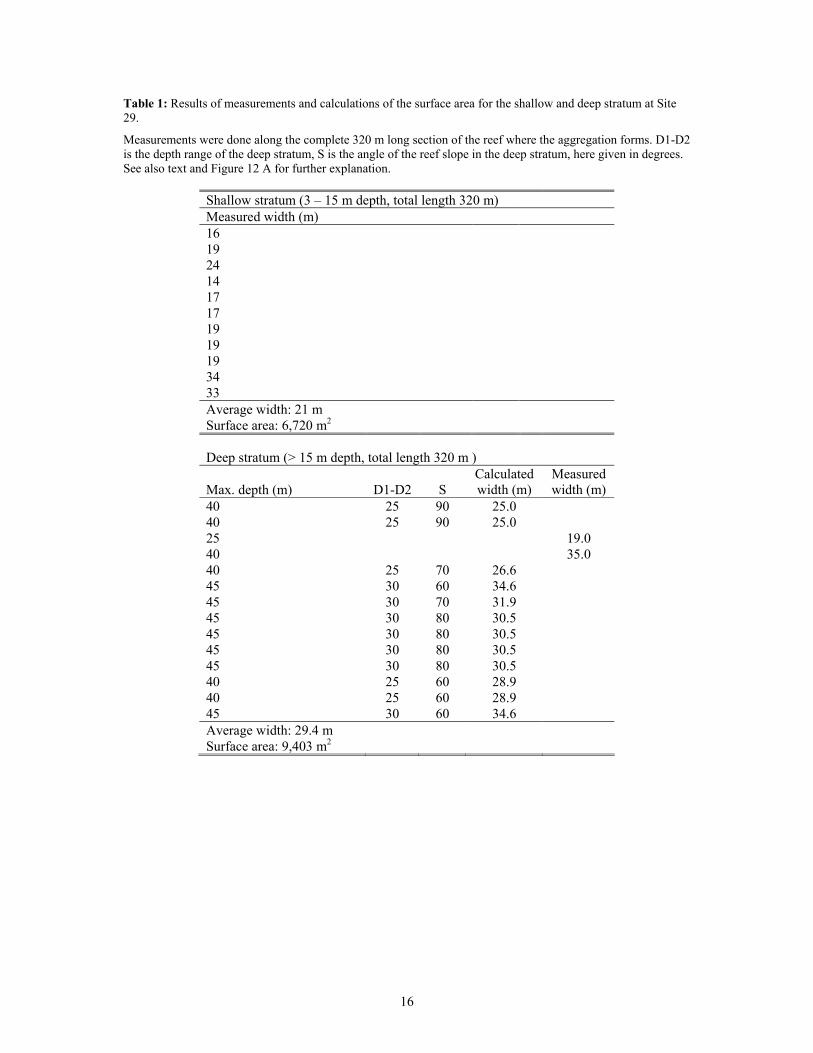
Table 1: Results of measurements and calculations of the surface area for the shallow and deep stratum at Site 29.
Measurements were done along the complete 320 m long section of the reef where the aggregation forms. D1-D2 is the depth range of the deep stratum, S is the angle of the reef slope in the deep stratum, here given in degrees. See also text and Figure 12 A for further explanation.
Shallow stratum (3 – 15 m depth, total length 320 m) Measured width (m) 16 19 24 14 17 17 19 19 19 34 33 Average width: 21 m Surface area: 6,720 m2
Deep stratum (> 15 m depth, total length 320 m )
Max. depth (m) D1-D2 S Calculated width (m)
Measured width (m)
40 25 90 25.0 40 25 90 25.0 25 19.0 40 35.0 40 25 70 26.6 45 30 60 34.6 45 30 70 31.9 45 30 80 30.5 45 30 80 30.5 45 30 80 30.5 45 30 80 30.5 40 25 60 28.9 40 25 60 28.9 45 30 60 34.6 Average width: 29.4 m Surface area: 9,403 m2
17
Table 2: Results of measurements and calculations of the surface area for the shallow and deep stratum at Site 35.
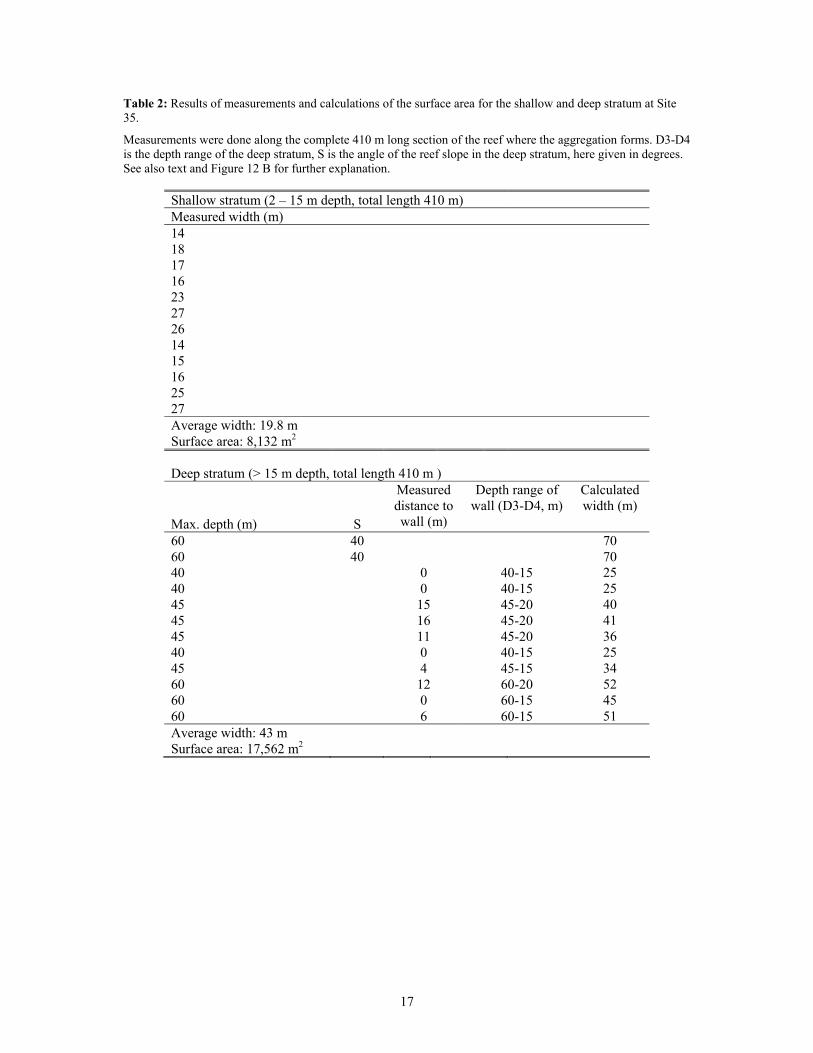
Measurements were done along the complete 410 m long section of the reef where the aggregation forms. D3-D4 is the depth range of the deep stratum, S is the angle of the reef slope in the deep stratum, here given in degrees. See also text and Figure 12 B for further explanation.
Shallow stratum (2 – 15 m depth, total length 410 m) Measured width (m) 14 18 17 16 23 27 26 14 15 16 25 27 Average width: 19.8 m Surface area: 8,132 m2
Deep stratum (> 15 m depth, total length 410 m )
Max. depth (m) S
Measured distance to wall (m)
Depth range of wall (D3-D4, m)
Calculated width (m)
60 40 70 60 40 70 40 0 40-15 25 40 0 40-15 25 45 15 45-20 40 45 16 45-20 41 45 11 45-20 36 40 0 40-15 25 45 4 45-15 34 60 12 60-20 52 60 0 60-15 45 60 6 60-15 51 Average width: 43 m Surface area: 17,562 m2
18
Raising factors and estimates of total numbers within an aggregation
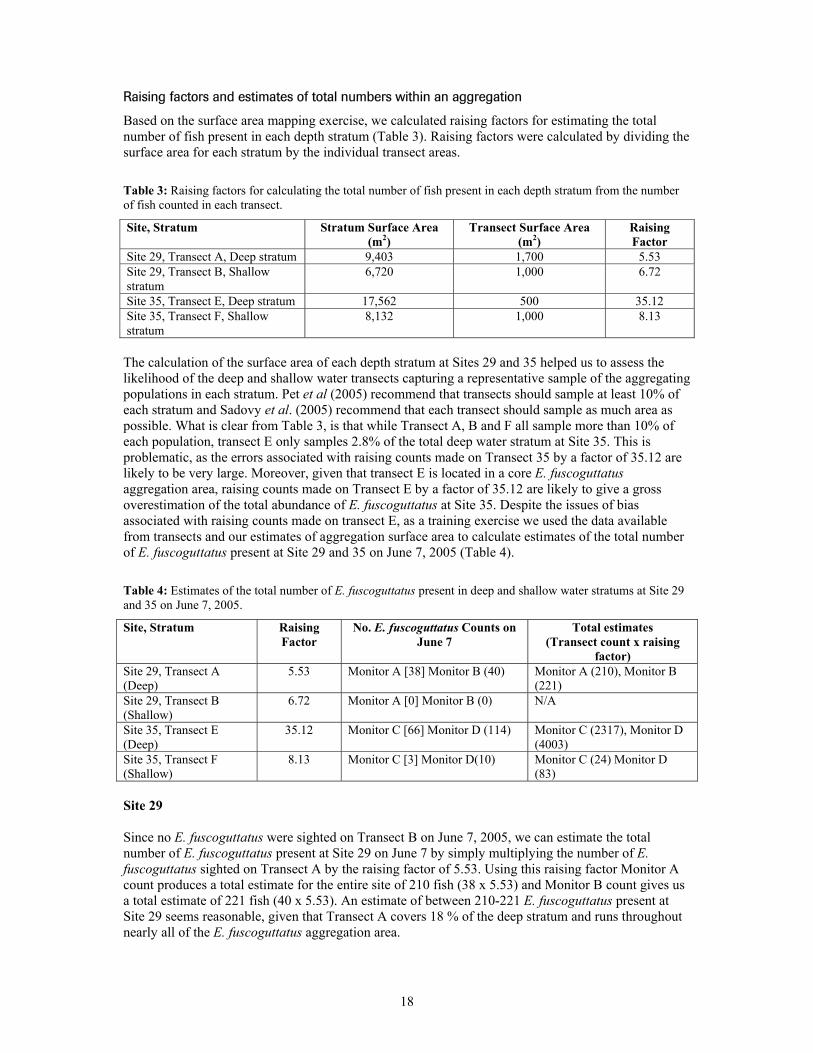
Based on the surface area mapping exercise, we calculated raising factors for estimating the total number of fish present in each depth stratum (Table 3). Raising factors were calculated by dividing the surface area for each stratum by the individual transect areas. Table 3: Raising factors for calculating the total number of fish present in each depth stratum from the number of fish counted in each transect.
Site, Stratum Stratum Surface Area (m2)
Transect Surface Area (m2)
Raising Factor
Site 29, Transect A, Deep stratum 9,403 1,700 5.53 Site 29, Transect B, Shallow stratum
6,720 1,000 6.72
Site 35, Transect E, Deep stratum 17,562 500 35.12 Site 35, Transect F, Shallow stratum
8,132 1,000 8.13
The calculation of the surface area of each depth stratum at Sites 29 and 35 helped us to assess the likelihood of the deep and shallow water transects capturing a representative sample of the aggregating populations in each stratum. Pet et al (2005) recommend that transects should sample at least 10% of each stratum and Sadovy et al. (2005) recommend that each transect should sample as much area as possible. What is clear from Table 3, is that while Transect A, B and F all sample more than 10% of each population, transect E only samples 2.8% of the total deep water stratum at Site 35. This is problematic, as the errors associated with raising counts made on Transect 35 by a factor of 35.12 are likely to be very large. Moreover, given that transect E is located in a core E. fuscoguttatus aggregation area, raising counts made on Transect E by a factor of 35.12 are likely to give a gross overestimation of the total abundance of E. fuscoguttatus at Site 35. Despite the issues of bias associated with raising counts made on transect E, as a training exercise we used the data available from transects and our estimates of aggregation surface area to calculate estimates of the total number of E. fuscoguttatus present at Site 29 and 35 on June 7, 2005 (Table 4). Table 4: Estimates of the total number of E. fuscoguttatus present in deep and shallow water stratums at Site 29 and 35 on June 7, 2005.
Site, Stratum Raising Factor
No. E. fuscoguttatus Counts on June 7
Total estimates (Transect count x raising
factor) Site 29, Transect A (Deep)
5.53 Monitor A [38] Monitor B (40) Monitor A (210), Monitor B (221)
Site 29, Transect B (Shallow)
6.72 Monitor A [0] Monitor B (0) N/A
Site 35, Transect E (Deep)
35.12 Monitor C [66] Monitor D (114) Monitor C (2317), Monitor D (4003)
Site 35, Transect F (Shallow)
8.13 Monitor C [3] Monitor D(10) Monitor C (24) Monitor D (83)
Site 29 Since no E. fuscoguttatus were sighted on Transect B on June 7, 2005, we can estimate the total number of E. fuscoguttatus present at Site 29 on June 7 by simply multiplying the number of E. fuscoguttatus sighted on Transect A by the raising factor of 5.53. Using this raising factor Monitor A count produces a total estimate for the entire site of 210 fish (38 x 5.53) and Monitor B count gives us a total estimate of 221 fish (40 x 5.53). An estimate of between 210-221 E. fuscoguttatus present at Site 29 seems reasonable, given that Transect A covers 18 % of the deep stratum and runs throughout nearly all of the E. fuscoguttatus aggregation area.
19
Site 35 An estimate the total number of E. fuscoguttatus present at Site 35 on June 7 can be made by adding (No. sighted on Transect E x raising factor of 35.12) + (No. sighted on transect F x raising factor of 8.13). Using these raising factors Monitor C transect counts gives us a total estimate of 2341 E. fuscoguttatus (66 x 35.12) + (3 x 8.13) and Monitor D transect counts produces a total estimate for the entire site of 4086 E. fuscoguttatus (114 x 35.12) + (10 x 8.13)4. However extreme caution must be taken when interpreting these results. As stated previously, Transect E is located within the core E. fuscoguttatus aggregation area around the promontory, and Transect E covers less than 3 % of the E. fuscoguttatus aggregation area. Although it was apparent that there were more E. fuscoguttatus at Site 35 than at Site 29, it may well be that even the lower population estimate of 2341 E. fuscoguttatus for Site 35 is an overestimation5. Clearly, before we can calculate total E. fuscoguttatus numbers at this site based upon transect counts, the aggregation surface area needs to be recalculated during a peak aggregation period and Transect E needs to be extended so that covers a larger and representative cross section of the entire area where E. fuscoguttatus aggregates.
MANAGEMENT OPTIONS FOR SPAWNING AGGREGATIONS
A session was held discussing the various options for managing spawning aggregations in Melanesia. The advantages and disadvantages with community-based management approaches and ways to strengthen communities’ powers to enforce their management decisions were discussed. There was also detailed discussion on the ways in which monitoring data should be utilized to inform both site specific and regional and national managed decisions. The need to modify the existing LRFFT management plan to better protect spawning aggregations in PNG was also discussed. It was recognized that while seasonal bans of 4-5 months would protect E. fuscoguttatus and E. polyphekadion spawning populations from commercial LRFFT operations, such bans required a significant amount of information on seasonality that is currently absent from most regions. Furthermore, seasonal bans would not protect the P. areolatus populations that form aggregations throughout the entire year at some sites (Hamilton et al. 2005). Compounding the issue of the lack of data on spawning seasons is the fact that in Melanesia spawning seasons can vary markedly between sites that are only separates by 10s of kilometers, so extrapolating a closed season to a provincial scale based on the results of only monitoring a few sites may not be appropriate. These limitations aside, it was agreed that in areas such as Southern Manus where both local knowledge and monitoring surveys have shown a consistent and fairly well defined peak season for E. fuscoguttatus and E. polyphekadion, a closed season for LRFFT actives should be implemented without further delay. Although annual seasonality can vary markedly between sites and regions in Melanesia, the lunar periodicity with which aggregations form and subsequently disperse appears to fairly consistent. On the basis of these participants suggested the concept of a year round 10 day lunar ban on all LRFFT activities, that being 7 days up to and including the new moon and three days after the new moon. Following this workshop Leban Gisawa put in a submission to the NFA Board recommending a year round 10-day lunar ban on LRFFT activities to NFA Board (Leban Gisawa, personal communication
4 The behavior of the two monitors at Site 35 on June 7, 2005 partly explains the large differences in their counts. Monitor D was consistently in front of Monitor C on both transects, and it seems likely that by the time Monitor C made counts, many of the fish had already left the transect boundaries or taken refuge in the reef matrix. 5 Although the estimates of total numbers of E. fuscoguttatus present at Site 35 are likely to be overestimated, there is no doubt that Site 35 is a very major aggregation site for E. fuscoguttatus. In June 2005 abundance counts that were made by various monitors were often in excess of 100 E. fuscoguttatus per 500 m. sq. That being by far the highest densities known for any monitored E. fuscoguttatus aggregation site in the Indo-Pacific.
20
August 2005). At the time of writing this report the NFA Board had not yet reviewed the LRFFT Management Plan.
LOCAL KNOWLEDGE OF SPAWNING AGGREGATIONS
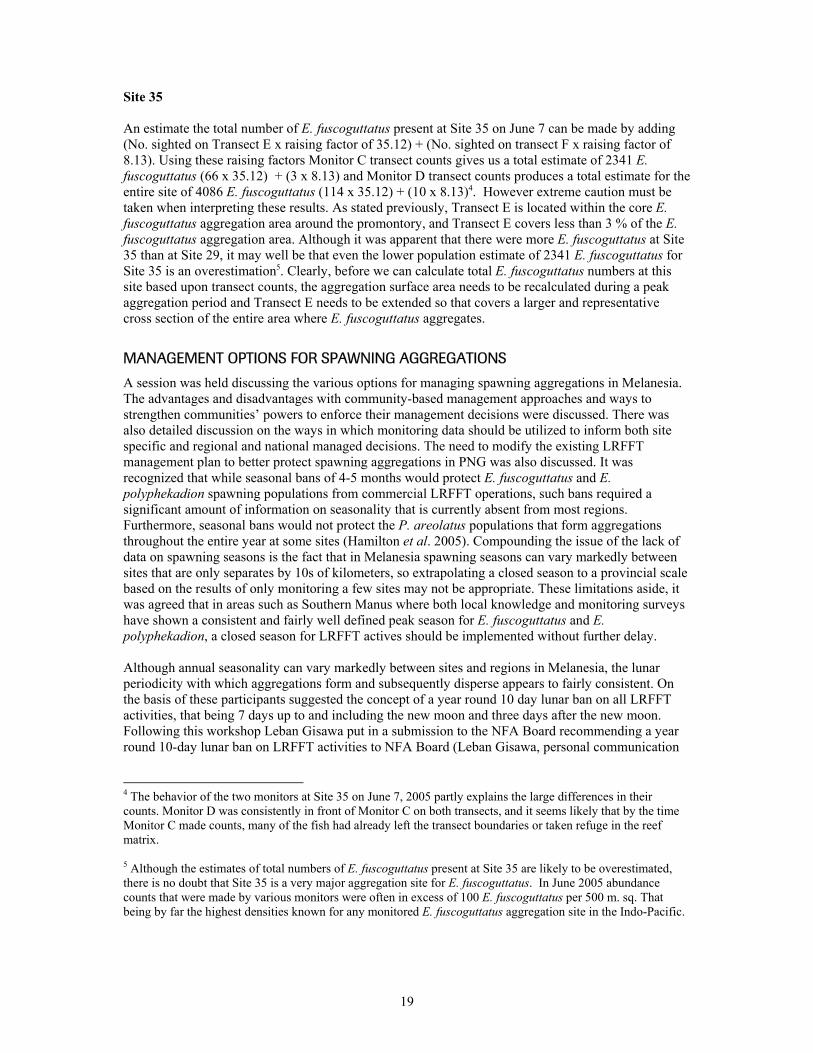
Expert fishers from Pere spent a morning sharing with workshop participants their local knowledge on the behavior and ecology of various species of fish that are known to aggregate to spawn in the Pere region of Manus (Figure 13). This was a fascinating session that promoted much open discussion and highlighted to participants just how detailed and precise local knowledge of spawning aggregations can be. Expert fishers from Pere also described changes that had occurred in their aggregation fisheries (social, technological and ecological) and when these changes had come about.
Figure 13: Expert fishers Pere from sharing their knowledge of spawning aggregations with workshop participants.
MONITORING PROTOCOLS FOR MANUS
Towards the end of the workshop participants spent a session developing protocols for ongoing monitoring efforts at Sites 29, 33 and 35. Following the workshop a draft outlining the recommended protocols for these sites was prepared by Peter Mous (Mous 2005). This draft is not included in this report as it is in the process of being reviewed and updated by TNC Pacific staff.
REGIONAL SPAWNING AGGREGATION MONITORING TEAM.
On the last day of the workshop participants discussed the concept of forming a regional monitoring team. The concept being that organizations or government departments who wished to commence spawning aggregation monitoring programs in Melanesia could recruit individuals from a list of experienced monitors for a period of one or two weeks. It was agreed by all participants that a lack of experienced and available monitors was a key limiting factor in initiating spawning aggregation monitoring programs in Melanesia. Participants were supportive of the concept, and felt that such a team would be particular useful for both designing monitoring programs and assisting with training monitors.
WORKSHOP CLOSING AND COMMUNITY FEEDBACK
The Pere community organized a day of festivities on June 11, 2005 to mark the end of the Pere Spawning Aggregation Monitoring workshop. This involved canoe racing, tug of war, dancing,

21
feasting and speeches (Figure 14). During the closing Manuai Matawai and Richard Hamilton were both interviewed about the workshop by a journalist from the Manus Provincial radio station. The workshop was officially closed by the Manus Provincial Administrator, Wep Kanawi. On the night of June 11, Richard Hamilton gave a PowerPoint presentation on spawning aggregations and provided feedback to the Pere community on the findings made during the workshop (Figure 14).
Figure 14: Dancing, speeches and feedback to the community at the workshop closing.
UPDATE ON RECENT LIVE REEF FOOD FISH TRADE OPERATIONS IN MANUS
Since holding this workshop two LRFF companies, Golden Bowl PNG Ltd and New Guinea Island Sea Product (NGISP) commenced operations in Manus Province. Golden Bowl PNG Ltd began operating around the Nigoherm LLG, Ninigo and Hermit group of islands at the western end of Manus Island in June 2005. Communities from the islands of Luf, Pihoi, Liot and Lau were involved in these operations. This is the same geographical area that was fished by LRFFT operations from 1990 - 1992. The LRFFT operations that operated here in the early 1990s were stopped by the Provincial Government in 1992 because of various social and environmental concerns about the operation (Gisawa & Lokani, 2001). The 2005 Golden Bowl Ltd operation purchased approximately four tonnes of groupers and humphead wrasse (Cheilinus undulatus) from the Hermit Islands region over a period of approximately one month. After the first month of operation a physical confrontation occurred between resource owners and company representatives, apparently because the company fished within two no-take tambu areas that they community had set aside as conservation areas. The company representatives subsequently left the region, and by September 2005 Golden Bowl Ltd had left Manus Province.
22
NGISP is an arm of New Ireland Sea Product (NISP) that is currently operating out of Kavieng in New Ireland Province, and Milne Bay Province. NGISP set up a holding pen at Ponam Island in July 2005, and fishermen from various parts of southern Manus were trained in capture techniques of live fish at Ponam Island. At the time of writing this report communities from the islands of Rambutso, Baluan, Pam and Johnson on the south coast of Manus had become involved in fishing to supply the LRFFT. Fishing for the LRFFT also commenced on the north coast areas of Ponam, Andra and Sori Islands. The Tawi community that TNC has been working with to conserve aggregation Site 35 also became involved with LRFFT operations. Three spawning aggregations along the south coast of Manus have been targeted for the LRFFT since July 2005, including Site 35 (which was one of the focus sites for this workshop). In July and August 2005 fishers from the Tawi and Timoenai communities removed 5000 kg of groupers and humphead wrasse, with over 90 % of this catch estimated to have come from Site 34, Site 35 and the Timoenai spawning aggregation site. Approximately 50 % of the catch by weight was made up of P. areolatus, followed by Epinephelus species (E. fuscoguttatus and E. polyphekadion) and humphead wrasse (Manuai Matawai, personal communication September 2005). It is noteworthy that large aggregations of P. areolatus and moderately large aggregations of E. fuscoguttatus and E. polyphekadion formed at Sites 29, 33 and 35 prior to the new moons in both July and August 2005, contrasting with a year ago. In 2004 aggregations of E. fuscoguttatus and E. polyphekadion ceased to form at all three monitored sites after June 2004, and only small aggregations of P. areolatus formed at these sites in July and August 2004 (Manuai Matawai, unpublished monitoring data 2004, 2005). In July and August 2005 customary owners from Pere and nearby Locha community were also approached by the LRFFT, but they declined to allow LRFFT operations within their waters due to social and environmental concerns and internal disputes within the communities. To date, aggregation Sites 29 and 33 have not been targeted by the LRFFT. As has been the case in many areas of the Pacific (Sadovy et al., 2003), the advent of LRFFT fishing in southern Manus resulted in disputes over ownership of aggregation sites and subsequent royalty payments, as well as numerous complaints about the prices being paid to fishers for live fish. Disputes and complaints over fish prices resulted in NGISP being forced to remove their holding pen from Ponam Islands, and they have since placed a holding pen at Tawi. Despite the social problems caused by the LRFFT, the lack of income generating opportunities in the rural Manus region and the perceived financial benefits of the LRFFT means that interest in the LRFFT remains high. As the Manus case study also demonstrates, simply raising awareness of the potential environmental consequences of targeting spawning aggregations and engaging in the LRFFT will not necessarily prevent communities from entering into this trade. In southern Manus the same community that readily imposed and enforced some harvesting restrictions on Site 35 in early 2004 following TNC awareness campaigns, also engaged in the LRFFT operations at the very first opportunity. The about-turn of the Tawi community that owns Site 35 highlights the challenges of biodiversity-focused conservation and sustainable fisheries management in remote underdeveloped areas of Papua New Guinea. Within Melanesia fundamental aspirational differences often exist between various sectors of a community with regards to resource exploitation levels and the management and conservation of FSA. The effective management and conservation of FSA will require approaches that acknowledge and deal positively with these aspirational differences. It is not surprising that the community that owns the largest and healthiest aggregation in the region decided that engaging in the LRFFT for a period of time to benefit to the community. It appears that the Tawi community is still concerned about ensuring that their aggregations persist for the future, as evidenced by this communities’ continued support for monitoring activities at Site 35. Leaders from Tawi community also recently approached TNC field staff and asked them if TNC would help them set annual or monthly Total Allowable Catches (TACs) for each species that aggregates at Site 34 and 35, with a view that the community itself would enforce the TACs. From a biological standpoint,
23
attempting to set even extremely conservative TACs for a small-scale multi-species spawning aggregation fishery is fraught with problems. To calculate TACs with any degree of accuracy one would require a vast amount of species-specific biological information (i.e. data on fecundity, growth rates, age at maturity, mortality, rates the frequency with which individual fish retuned to an aggregation site within a year, stock size, etc.) that we simply do not, and will never have. At best we would hope that continuous monitoring at exploited spawning aggregation sites would detect serious declines early enough to inform effective management decisions (e.g. closure). LESSONS LEARNED
Holding workshops in a rural community setting is a logistically challenging but rewarding exercise. As the Pere workshop demonstrated both the participants and community members had the chance to interact and learn from each other in formal and informal settings. Holding monitoring workshop in a rural setting also raises the regional and national profile of what specific communities (such as Pere) are doing to manage their spawning aggregations sites. It also allows some financial benefits to go directly to the community. The results of surface area mapping exercises carried out in this workshop highlighted the fact that the size of the transects being used to sub-sample aggregations in Melanesia are often too small to capture a representative sample of each main fish population. Once aggregations disperse participants’ interest in conducting monitoring activities also drops of very quickly. Future spawning aggregation workshops in Melanesia may benefit by being of a shorter duration and commencing a week prior to the new moon. If spawning aggregation monitoring programs in Melanesia are to be successfully conducted over meaningful temporal scales then there needs to be a minimum of three certified and trained divers per monitoring team. A team of three monitors could be expected to survey 2-3 Sites over a period of 2-3 days. At all monitored sites in Melanesia there is currently too few trained individuals to carry out all of the standard monitoring activates proposed in the Pet et al. (2005) monitoring manual. For this reason at monitored Sites in Melanesia, activities such as length-frequency estimation have not formed a part of the standard monthly monitoring programs to date. RECOMMENDATIONS
MANUS SPECIFIC RECOMMENDATIONS
1. There is an urgent need to have other individuals from Pere and surrounding communities SCUBA certified and trained in aggregation monitoring methods. This will ensure future monthly monitoring is conducted even if a current member of the Manus monitoring team is unavailable. Currently the only SCUBA certified and trained monitors in Manus are Manuai Matawai and Jerrey Pokap.
2. The relationship between the Titan communities and TNC is evolving, and the communities are
continuing to look to TNC for advice on how to best manage their aggregations. TNC should continue to work with the Titan communities and the provincial and national government to help them find ways of minimizing the impacts of destructive and overfishing practices on their spawning aggregations.

24
3. With the arrival of the LRFFT in this area the need for ongoing monitoring at spawning aggregation Sites 29, 33 and 35 is even more vital then ever. The Manus monitoring team is in a unique position to quantitatively document the impacts of the LRFFT on a large multi-species spawning aggregation site. To the authors’ knowledge Site 35 is one of the only known spawning aggregation sites in the Pacific were there are baseline monitoring data both before and after the advent of commercial aggregation fishing. Currently the monitored Sites 29 and 33 are not fished for the LRFFT and are thus acting as control sites. Continuing the Manus monitoring program will also allow us to evaluate if the current monitoring protocols being used and advocated in the pacific are sufficient to pick up real declines in the aggregations abundances as a result of over fishing.
4. Like most LRFFT fisheries in PNG, the southern Manus LRFFT operation is almost totally
dependent on targeting spawning sites and it is likely that the fishery would not be economically viable if aggregations were not targeted. If there is any hope of fishing spawning aggregations at a sustainable level in PNG, then there is an urgent need to learn more about adult draw areas, recruitment, and age-based demographics of target species. This will require considerable scientific research into aggregation dynamics in this part of the world. Manus Province would form an ideal location for such research.
GENERAL RECOMMENDATIONS
1. When the numbers of aggregating fish are low (<100) there is no need to establish permanent transects. Monitors should simply survey the entire aggregation site and record ever target species they see.
2. Large multi-species aggregations require sub sampling and the permanent transect method
outlined in the Pet et al (2005) manual is one way to achieve this. To capture an accurate picture of seasonality and variations in fish abundances transects need to sample as large a percentage of each stratum at an aggregation site as possible. In Melanesia, the two dominant species at aggregation sites are E. fuscoguttatus and P. areolatus. Typically E. fuscoguttatus is in highest densities in water of 15-40 m depth, while P. areolatus is typically most abundant between 2-15 m. In such cases the simplest way to sub sample an aggregation is to run continuous transects through the entire deep and shallow stratums of the aggregation site. Note however that if aggregations area is very large, it will not be possible to extend transects through the entire site, particular for deep water transects where bottom times and safety factors come into account.
3. If permanent transects are to be used then the first step is to draw a sketch map of the aggregation
site and determine where the fish are located within the aggregation boundaries. A basic map of the aggregation site will allow monitors to determine where to place transects and how long they need to be. In many locations in Melanesian local fishers (particularly spear fishers) have excellent knowledge of aggregation boundaries, and they should be consulted during the mapping process.
4. Any organization that is currently monitoring spawning aggregations or planning to monitor
aggregations should take SCUBA diving and boat safety guidelines into account (Appendix 3). 5. Monitoring protocols that explain how data are to be collected, managed, analyzed and reported
should be written up for each site. Site-specific monitoring protocols help ensure that data is collected in a consistent and predicable fashion, and are useful reference guide for new monitors entering into an existing spawning aggregation monitoring program.

25
REFERENCES
Colin, P.L., Y.J. Sadovy and M.L. Domeier (2003). Manual for the study and conservation of reef fish spawning aggregations. Society for the Conservation of Reef Fish Aggregations special publications No. 1 (Version 1.0), pp. 1-98 + iii.
Gisawa. L. and P. Lokani (2001). Trial community fishing and management of live reef food fisheries
in Papua New Guinea. Secretariat of the Pacific Community. SPC Live Reef Fish Information Bulletin, Number 8, March 2001, pages 3-5
Hamilton, R.J. (2005). Indigenous Ecological Knowledge (IEK) on the aggregating and nocturnal
spawning behaviour of the Longfin emperor Lethrinus erythropterus. SPC Traditional Marine Resource Management and Knowledge Bulletin 18: 9-17.
Hamilton, R. (2003). A report on the current status of exploited reef fish aggregations in the Solomon
Islands and Papua New Guinea – Choiseul, Ysabel, Bougainville and Manus Provinces. Western Pacific Fisher Survey Series: Society for the Conservation of Reef Fish Aggregations. Volume 1. (Confidential appendix). 52pp. www.scrfa.org/scrfa/doc/Hamilton_final_report.pdf
Hamilton, R.J., M. Matawai, T. Potuku, W. Kama, P. Lahui, J. Warku and A. Smith (2005). Applying
local knowledge and science to the management of grouper aggregation sites in Melanesia. SPC Live Reef Fish Information Bulletin 14: 7-19.
Hamilton, R. J., M. Matawai and T. Potuku (July 2004). Spawning Aggregations of Coral Reef Fish in
New Ireland and Manus Provinces, Papua New Guinea: Local Knowledge Field Survey Report. (UNRESTRICTED ACCESS VERSION) Report prepared for the Pacific Island Countries Coastal Marine Program, The Nature Conservancy. [iv + 99 pp.] TNC Pacific Island Countries Report No. 4/04 (Unrestricted).
Johannes, R.E. (1997). Grouper spawning aggregations need protection. SPC Live Reef Fish
Information Bulletin 3: 13-14. Johannes R.E, L. Squire, T. Graham, Y. Sadovy and H. Renguul (1999). Spawning aggregations of
groupers (Serranidae) in Palau. Marine Conservation Research Series Publication No.1, The Nature Conservancy, Honolulu, Hawaii.
Mous, P.J. (2005). Monitoring of three grouper spawning aggregations near Pere Village, Manus
Province, Papua New Guinea. Proposed monitoring protocol. Publication from The Nature Conservancy Southeast Asia Center for Marine Protected Areas, Sanur, Bali, Indonesia. 31 p.
Pet, J.S., P.J. Mous, K. Rhodes and A. Green (2005). Introduction to monitoring of spawning
aggregations of three grouper species from the Indo-Pacific. A manual for field practitioners. Version 1.2 (April 2005). Publications from The Nature Conservancy Southeast Asia Centre for Marine Protected Areas, Sanur, Bali, Indonesia.
Rhodes, K.L. (2003). Kavieng spawning aggregation monitoring training workshop report, Kavieng,
New Ireland, Papua New Guinea, 22-30 April 2003. Report prepared for The Nature Conservancy, Pacific Island Countries Coastal Marine Program. TNC Pacific Island Report No. 3/03
Rhodes, K.L. (2004). Solomon Islands spawning aggregation monitoring training workshop report.
Gizo, Western Province, Solomon Islands, 13-21 March 2004. A report prepared for The

26
Nature Conservancy, Pacific Island Countries Costal Marine Program. TNC Pacific Islands Report No. 2/04
Sadovy, Y.J. (1996). Reproduction of reef fishery species. In: Polunin NVC & Roberts CM (eds).
Reef Fisheries. Chapman & Hall, London, p 15-59. Sadovy, Y., P. Colin and M. Domeier (2005). Monitoring and managing spawning aggregations:
methods and challenges. SPC Live Reef Fish Information Bulletin 14: 25-29. Sadovy Y.J. and A.C.J. Vincent (2002). The trades in live reef fishes for food and aquaria: issues and
impacts. In: Sale PF, editor. Coral Reef Fishes. Dynamics and Diversity in a Complex Ecosystem. Academic Press, San Diego, p 391-420.
Sadovy, Y. & D.Y. Shapiro (1987). Criteria for the diagnosis of hermaphroditism in fishes. Copeia,
N0. 1, 136-156. Sadovy, Y.J., T.J. Donaldson, T.R. Graham, F. McGilvray, G.J. Muldoon, M.J. Phillips, M.A.
Rimmer, A. Smith and B.Yeeting (2003). While stocks last: The Live Reef Food Fish Trade. Asian Development Bank Pacific Studies Series.
Squire, L (2001). Live reef fish trade at M'Burke Island, Manus Province. A survey of spawning
aggregation sites, monitoring & management guidelines. The Nature Conservancy, June 2001.
27
APPENDICES
APPENDIX 1. Advanced Workshop on Spawning Aggregations Monitoring Program
Date Morning Afternoon Evening Wed (1 June) Workshop participants arrive; spend the night at Harbourside Hotel. Lorengau Thu (2 June) Travel to Pere
Welcoming ceremony at Pere
Session 1 (Andrew Smith). Purpose and objectives of workshop explained. Dive 1. At aggregation Sites 29 and 33 to familiarize participants.
Fri (3 June) Session 2. (Peter Mous). TNC Monitoring Manuel given out and overviewed. Participants discussed their spawning aggregation work and issues faced in the regions they were working. Session 3. (Andrew Smith and Shannon Seeto). Dive and boat safety.
Dive 2. Participants dived at aggregation Sites 29 and 33.
Sat (4 June) Session 4. (Richard Hamilton): Introduction on spawning aggregation sites Session 5. (Richard Hamilton). Aggregation fisheries in Melanesia
Session 6 (Richard Hamilton and Peter Mous). Discussion on mapping and transect location and length at Manus sites. Dive 3. Site 29. Extension of Transect B.
Examination of E. ongus gonads.
Sun (5 June) Session 7. (Peter Mous). Length –frequency estimation
Examination of E. ongus gonads. Dive 4. Site 29. Counts along Transect B. Extension of Transect A.
Mon (6 June) Session 8. (Richard Hamilton). Objectives of Monitoring Session 9. (Peter Mous) Discussion on size estimation results
Dive 5. Site 29 and 35. Abundance and size estimation
Examination of E. ongus .gonads.
Tue (7 June) Session 10. Group discussion on field procedures, and adaptations from procedures outlined in the manual. Session 11. (Peter Mous) Planning for mapping Site 35.
Dive 6. Sites 29 and 35. Mapping Site 35 and abundance counts at both sites.
Examination of E. ongus gonads.
28
Date Morning Afternoon Evening Wed (8 June) Session 12. (Pere fishermen)
Local knowledge of spawning aggregations in Manus Session 13. (Richard Hamilton and Manuai Matawai). Local knowledge surveys in Melanesia.
Session 14 (Andrew Smith). Management of spawning sites. Session 15. (Peter Mous) Discussion on protocols for Manus monitors Dive 7. Sites 29 and 35. Mapping Site 35 and abundance counts at both sites.
Examination of E. ongus .gonads.
Thu (9 June) Session 16 (Richard Hamilton and Andrew Smith) Discussion on monitoring and management
Dive 8. Mapping of Site 29.
Fri (10 June) Session 17. (Peter Mous). Presentation of mapping procedures and proposed database for aggregation monitoring in Manus Session 18. (Andrew Smith). Discussion on forming a regional team of monitors
Dive 9. Mapping of Site 29.
Sat (11 June) Farewell festivities with Pere community (Tug of war, canoe racing)
Workshop closing ceremony Presentation on spawning aggregations and feedback to the Pere community on workshop findings (Richard Hamilton).

29
APPENDIX 2. Participants in the Advanced Workshop on Monitoring Reef Fish Spawning Aggregations, June 2-11, 2005, Pere, Manus Province, Papua New Guinea
Name Position / Agency Contact Address Daniel Afzal Marine Program Coordinator
Wildlife Conservation Society P.O. Box 95 Kavieng, New Ireland Province Papua New Guinea Tel: +675 984 1549 Fax: +675 984 1549 Email: [email protected]
Joseph Aitsi Marine Conservation Officer/Scientist The Nature Conservancy
P.O. Box 267 Kimbe, West New Britain Province Papua New Guinea Tel: +675 983 5808 Fax: +675 983 4783 Email: [email protected]
Geua Ganiga WCS Graduate Student University of Papua New Guinea
C/- Wildlife Conservation Society P.O. Box 95 Kavieng, New Ireland Province Papua New Guinea Tel: +675 682 8614 Fax: +675 984 1549 Email: [email protected]
Michael Giningele Roviana Spawning Aggregation & Monitoring Team Roviana and Vonavona Marine Resource Management and Development Program
C/- Agnes Lodge Munda, New Georgia Province Solomon Islands Tel: +677 62133
Leban Gisawa Manager, Inshore Fisheries National Fisheries Authority
P.O. Box 2016 Pt Moresby Papua New Guinea Tel: +675 309 0444 Fax: +675 320 2061 Email: [email protected]
Warren Kama Roviana Spawning Aggregation & Monitoring Team Roviana and Vonavona Marine Resource Management and Development Program
C/- Agnes Lodge Munda, New Georgia Province Solomon Islands Tel: +677 62133
Lawrence Litau Spawning Aggregation Diver The Nature Conservancy
C/- P.O. Box 522 Kavieng, New Ireland Province Papua New Guinea Tel: +675 984 1550 Email: [email protected]
Manuai Matawai Community Conservation Coordinator The Nature Conservancy
P.O. Box 408 Lorengau, Manus Province Papua New Guinea Tel: +675 470 3043 Fax: +675 470 9392 (Lorengau Hotel) Email: [email protected]

30
Name Position / Agency Contact Address Jerry Pakop Spawning Aggregation Diver
The Nature Conservancy C/- P.O. Box 408 Lorengau, Manus Province Papua New Guinea Tel: +675 470 3043 Fax: +675 470 9392 (Lorengau Hotel) Email: [email protected]
Tapas Potuku Community Conservation Coordinator The Nature Conservancy
P.O. Box 522 Kavieng, New Ireland Province Papua New Guinea Tel: +675 984 1550 Email: [email protected]
Annisah Sapul Research Assistant The Nature Conservancy
P.O. Box 267 Kimbe, West New Britain Province Papua New Guinea Tel: +675 983 5808 Fax: +675 983 4783 Email: [email protected]
Noel Wangunu Marine Protected Areas & Conservation Coordinator Conservation International
P.O. Box 804 Alotau, Milne Bay Papua New Guinea Tel: +675 641 0349 Fax: +675 641 0359 Email: [email protected]
Richard Hamilton Workshop Facilitator & Trainer / Melanesia Marine Scientist The Nature Conservancy
51 Edmonstone Street, South Brisbane, Qld 4101 Australia Tel: +61 7 3214 6913 Fax: +61 7 3214 6999 Email: [email protected]
Peter Mous Workshop Trainer / Science Manager The Nature Conservancy
Southeast Asia Center for Marine Protected Areas (SEACMPA) Jl. Pengembak No. 2 Sanur 80228, Bali Indonesia Tel: +62 361 287272 Fax: +62 361 286 445 Email: [email protected]
Shannon Seeto Workshop Dive Safety Officer / Melanesia GIS Specialist The Nature Conservancy
P.O. Box 267 Kimbe, West New Britain Province Papua New Guinea Tel: +675 983 4249 Fax: +675 983 4783 Email: [email protected]
Andrew Smith Workshop Trainer / Director, Pacific Island Countries Coastal Marine Programs The Nature Conservancy
51 Edmonstone Street, South Brisbane, Qld 4101 Australia Tel: +61 7 3214 6912 Fax: +61 7 3391 4805 Email: [email protected]

31
APPENDIX 3. Reef Fish Spawning Aggregation Monitoring: Dive and Boat Safety Considerations
The identification, assessment and monitoring of reef fish spawning aggregations usually requires the use of small boats and the need to SCUBA dive, often in remote areas. These activities can be both challenging and risky, especially at spawning aggregation sites where heavy seas and strong currents can occur. To maximize safety and minimize the risks for both diving and small boat operations, we provide the following guidelines for consideration. These guidelines are not comprehensive, nor a substitute for a detailed diving and small boat safety plan or program. They are provided here to help with incorporating safe practices in the planning and conducting of spawning aggregation monitoring. Dive Safety
Planning:
• All divers must have recognized diving certification. • All divers should preferably be experienced divers. For any diver with limited experience, they
should be accompanied by an experienced diver. • All divers should preferably have Dive Alert Network (DAN) membership and insurance. Many
spawning aggregation sites are in remote areas, and recompression chambers are not common and usually a long way from these sites. DAN can arrange emergency evacuation. Check their web sites, for US/Micronesia: http://www.diversalertnetwork.org/ for Melanesia: http://www.danseap.org/
• An emergency evacuation plan should be prepared for each dive site. • A copy of the emergency evacuation, dive and trip plans, including everyone’s personal details,
next of kin, DAN membership details, and DAN contact numbers, should be left with someone reliable that can trigger emergency procedures should there be an incident.
• Plan all dives, and dive the plans. The boat operators and support crew should be familiar with the dive and survey plan.
• For on-going monitoring, establish standard operating procedures for diving as a part of the monitoring protocols.
• Maintain a record of all diving activity (where possible use a dive log book), especially note anything out of the ordinary. This information is critical should there be an emergency incident.
Equipment:
• Each diver must have equipment that has been properly maintained and serviced. Keep a record of maintenance.
• Divers should have their own dive computer. Two divers should not dive together using the same computer, as their dive profiles will differ. If no computer is available, dive tables should be used to plan the dive, and for repetitive dives. Even when using dive computers, dive tables should be carried by each diver.
Diving:
• Do not dive if injured, sick or apprehensive for any reason. Each individual diver must take responsibility for deciding if they are fit to dive.
• All divers must have dive buddies. • Do not go into decompression time. • Avoid bounce diving (descending-ascending-descending-ascending repetitively in the same dive). • Always complete a 3 m (15 ft) safety stop for 5 minutes. • Allow adequate surface intervals between dives. Complete the deepest dive first, followed by
shallower dives. • When undertaking strenuous diving—such as installing re-bars for transect markers, or diving
against strong currents—always be conservative with bottom time and allow extra time for the safety stops.

32
Small Boat Safety
• Where and whenever possible, check the weather forecast prior to departure. • Ensure the boat to be used (even if borrowed or hired) is sea-worthy. • Carry enough lifejackets or approved flotation devices. • Ensure the engine is operational, and make sure there is an alternative source of propulsion
(auxiliary engine, paddles/oars, sail, etc.). • Carry extra fuel, that is, more than is required for the planned trip. • Ensure the boat operator is familiar with the area, understands the responsibilities of operating a
surface boat for divers, understands the dive plan, and maintains a close watch for divers surfacing early (which usually indicates a problem).
• If possible, ensure there are two people in the boat while divers are down. • If at all possible, all members of the team (divers and boat operators) should be trained in CPR and
basic first aid. • Take adequate drinking water, both for the divers (dehydrated divers are more prone to the
decompression sickness), and should the boat breakdown or become lost. • Take enough anchor rope and a suitable anchor for anchoring at spawning aggregation sites.
Sometimes there is a need to anchor in deep water away from the break on the reef. The anchor rope should be strong enough to hold the loaded boat in strong currents, swells and waves. Try not to damage coral or disturb the fish at the aggregation when anchoring.
• Do not overload small boats with people and equipment. • Carry an emergency kit that includes, at a minimum:
o Basic tools (for engine and dive gear maintenance) and spares (O-rings; spark plugs; pins or spare props; etc.)
o First aid kit o GPS (if available) o Compass o Flash light (with fresh batteries and spare batteries) o Radio (VHF), satellite phone (or mobile phone where appropriate) o If possible carry an EPIRB (Emergency position indicating radio beacon). These are
devices that alert rescue authorities and indicating your location. 406 MHz EPIRB are best.
Most importantly, use common sense. If in doubt, do not dive.
33
APPENDIX 4. Collecting Fisheries-Dependent Data from a Spawning Aggregation of the White-Streaked Grouper, Epinephelus ongus.
Introduction
The white-streaked grouper, Epinephelus ongus, is known as Kalindrken in the Titan language. This small to medium sized grouper aggregates to spawn at several multi-species spawning aggregation sites around Pere in the week leading up to and including the new moon, with peak aggregations reported to occur in the months of March, April and May each year. The largest known aggregations of E. ongus in this region of Manus form at Site 29, with the aggregation occurring in shallow water (1-12 m) over an area of greater than 20,000 m. sq. of reef slope. A large aggregation of E. ongus at Site 29 consists of many thousands of E. ongus. Part of the E. ongus aggregation overlaps with aggregations of P. areolatus, E. fuscoguttatus, E. polyphekadion and Lethrinus erythropterus that also form at Site 29 during the same lunar and annual periods6. Local fishers report that the E. ongus aggregations at Site 29 will persist for one day longer than aggregations of P. areolatus, and that they will normally have spawned and subsequently dispersed one or two days after the new moon. While a proportion of the E. ongus aggregation occurs within the Site 29 MPA, the majority of the E. ongus aggregation forms outside of the current MPA boundaries. E. ongus that aggregate outside of the MPA boundaries continue to be targeted by daytime spear-fisher(s) who report that this species is very approachable and consequently extremely easy to capture. An aggregation of E. ongus formed at Site 29 in June 2005 and this aggregation was being targeted by local fishers. It was decided that this aggregation fishery provided an ideal means of providing workshop participants with hands on experience on how to collect fisheries-dependent data on aggregating species. Methods
We obtained samples of E. ongus from the aggregation at Site 29 from several local spear fishers on a daily basis between June 4-8, 2005 (Table 5). A representative sample of size ranges were speared by the fishers, and the catches were examined by the workshop participants on each day of capture (Figure 15). Captured fish were measured to the nearest centimeter and sexed by visually examining the gonads of each fish. The maturity stage of grouper gonads was determined macroscopically using the criteria outlined in Table 6. Potential differences in the operational sex ratios of males and females were examined by conducting Chi Tests in Microsoft Excel. The mean Total Length (TL) of males and females were compared by conducting a one-way ANOVA in Microsoft Excel. Table 5: Number of male and female E. ongus sampled on each day.
4-Jun-05 5-Jun-05 6-Jun-05 7-Jun-05 8-Jun-05 Total Female 8 21 23 11 2 65 Male 1 14 2 3 4 24
6 E. ongus, E. fuscoguttatus, E. polyphekadion, P. areolatus, and L. erythropterus also aggregate to spawn at overlapping sites and times in the Solomon Islands (Hamilton, 2005).
34
Figure 15: A catch made up predominantly E. ongus. These fish were speared at Site 29 (Photo S. Seeto).
Table 6: Criteria used in visual determination of maturity stage in grouper gonads (Pet et al. 2005).
Maturity Stage Appearance Ovaries (females) Immature Ovary small, strand-like, compact, pink or cream; oocytes (eggs) not clearly distinct; not
obviously different from immature or inactive males Maturing Ovary relatively small but rounded, less strand-like in appearance, grayish with thickened
gonad wall; eggs not clearly distinct and small; not clearly different from mature males prior to the development of yolk with the eggs
Mature, active Ovary large and yellow, orange or pinkish with transparent gonad wall; large yolky eggs becoming clearly visible and tightly packed
Mature, ripe Ovary relatively large, clear, watery (hydrated) eggs visible through wall; typical of individuals just prior to spawning; egg release possible with application of light abdominal pressure
Post-spawn Ovary flaccid with obvious capillaries (small blood vessels); few eggs visible Testes (males) Immature/inactive Testes not obviously different from immature females (see the description for immature
females) Maturing Testes expanding and becoming rounded and large; grayish in appearance; early maturing
individuals not clearly different from maturing females until sperm becomes evident in sperm sinus along the gonad wall
Mature, active Testes large and white sperm visible in sinuses along the gonad wall; sperm release with light abdominal pressure
Post-spawn Testes flaccid and bloody; sperm release still possible on application of abdominal pressure
35
Results
Maturity stage of sampled fish
All of the E. ongus sampled were mature, active (Figures 16 and 17), mature, ripe or post-spawn individuals. Graphs displaying the relative percentage of each gonad stage in female and male E. ongus sampled between June 4-8, 2005 are shown in Figures 18 and 19.
Figure 16: A mature, active male E. ongus. Sperm is expelled by applying pressure on the abdomen (photo by S. Seeto).
Figure 17: Mature, active female E. ongus. The ovaries of this female are large and light pink in color (photo by S. Seeto).
36
n=11n=8 n=21 n=23 n=2
0
10
20
30
40
50
60
70
80
90
100
4/06/2005 5/06/2005 6/06/2005 7/06/2005 8/06/2005
Date
Per
cent
age Post spawning
Mature ripeMature active
Figure 18: Relative percentages of each gonad stage in female E. ongus sampled between the 4th and 8th of June 2005 (n=65).
n=3n=2n=14n=1 n=4
0
10
20
30
40
50
60
70
80
90
100
4/06/2005 5/06/2005 6/06/2005 7/06/2005 8/06/2005
Date
Per
cent
age
Post spawning
Mature, active
Figure 19: Relative percentages of each gonad stage in male E. ongus sampled between the 4th and 8th of June 2005 (n=24).
Sex specific size structure and sex ratio
The sex specific length frequency distributions of 89 E. ongus sampled between June 4-8, 2005 are shown in Figure 20.
37
0
5
10
15
20
25
15-17 18-20 21-23 24-26 27-29 30-32
Size class (TL cm)
Num
ber
Female (n=65)Male (n=24)
Figure 20: Size frequency distribution of E. ongus in 20 mm size classes (n=89).
The separate sexes showed unimodal distributions, with females dominant in the smaller size classes and males dominant in the larger size classes. Males were absent from the smallest size ranges sampled. The mean lengths of female and male E. ongus [23.4 (s.d. 3.1cm) and 28.5cm (s.d. 1.9cm) respectively] were significantly different (P <0.0001). The sex ratio of the population was significantly female biased (P < 0.0001) with females outnumbering males 2.7:1. Discussion
The hydrated (mature, ripe) female sampled on June 5 provides direct evidence that the E. ongus aggregation had formed for the purpose of spawning, as females typically only become hydrated several hours prior to actual spawning events (Colin et al., 2003). On the day of the new moon (June 7) some spent females and males were present in the sample, and by June 8 (one day after the new moon) the numbers of E. ongus had dropped dramatically at the aggregation site and all six E. ongus captured were post-spawn fish. The hydrated female observed on June 5 and the occurrence of some post-spawn individuals on June 7 show that the aggregated E. ongus spawned over several days leading up to and including the new moon period, with spawning having ceased by one day after the new moon. These observations agree with local knowledge of the lunar days on which E. ongus disperse at this aggregation site. Furthermore, as predicted by local fishers, the E. ongus aggregation persisted a day latter than P. areolatus aggregations that formed at this site in June 2005. The bimodality and female biased sex ratio observed in this sample of E. ongus suggests the possibility of monandric protogynous hermaphrodism (adult female to male sex change), a sexual mode of development that typifies the serranids (Sadovy, 1996). However, bimodal size-frequency distributions with males larger than females and female-biased sex ratios are non-specific features that that may have many causes; a conclusive diagnosis of the sexual pattern of E. ongus will require histological examination of gonads from representatives of all size classes of this species (Sadovy & Shapiro, 1987).