Embed Size (px)
Citation preview

ADVANCEMENTS IN THE MANAGEMENT MEASUREMENTS & VISUALISATION OF NEC BEAM PROFILE MONITORS
D. Button#, D. Garton, M. Mann, ANSTO, Lucas Heights, Australia S. Yan, National Instruments, Macquarie Park, Australia
Abstract In DC ion beam tandem accelerator facilities
commonly Helix Rotating wire Beam Profile Monitors/scanners (BPM) are used to monitor the shape and location of the ion beam. These BPMs are used in combination with a BPM Selection station which activates and conditions signals visualisation on an Oscilloscope. At ANSTO we have been developing an alternative system to allow firstly the management and operation of concurrent National Electrostatics Corp (NEC) BPMs, secondly to construct a 2D approximation of the particle beam parameters based on programmable hardware and software, and thirdly to give advanced functionality to control systems. This paper will review the current status of the development, and the potential features which can be gained with this technological approach.
BACKGROUND Beam Profile Monitors BPMs are an important
diagnostic device used during the tuning of electrostatic ion beam accelerator particle beams. These provide effectively real-time information back to the operator to indicate the location of the beam and the X and Y intensity profile of the beam. There are generally two types of these monitors/scanners used in DC electrostatic ion beam facilities, the oscillating Y-Shaped wire scanner manufactured by HVEE, and the helix rotating wire scanner manufactured by NEC (see Fig.1). The NEC rotating helix wire scanner is the subject of this paper and development.
Figure 1: Original general assembly drawing of the NEC BPM taken from the 1971 patent application [1].
Principle of NEC BPM Operation The NEC BPM uses a helix shaped wire attached to a
rotating disc as shown in Fig. 2, this disc rotates which due to the geometry of the system has a pseudo effect of sweeping the wire through the cross-section of beam firstly in the Y direction, and then the wire sweeps through the X direction, see Fig. 2(a,c). The shaft on the axis of rotation has magnets attached at known positions that a stationary sensor/coil pick-off produces an analogue stream of pulses. These pulses are used to indicate firstly the start of a rotation cycle (Fig. 3(1)), the wire passing the centre of the Y axis (Fig. 3(2)), and the wire passing through the centre of the X axis (Fig. 3(3)), these are referred to as the “Fiducial” markers, see Fig. 3.
(a) (b) (c)
Figure 2: The rotating axis of the helix wire as indicated in (a-c) is setup at an angle of 45° to the horizontal plane. (a) shows the wire “sweeping” through the pseudo Y plane of the beam as the wire is effectively horizontal through this part of the rotation, (b) the wire is free of intersection/interacting with the beam, (c) the “sweeping” motion through the pseudo X plane of the beam as the wires direction is effectively vertical in this part of the rotation [2].
Figure 3: Shows the fiducial markers produced during the rotation of the helix wire shaft (see Fig. 1(26)) [3]. The larger trigger pulse indicates the start of the rotation followed by the Y centre marker, and finally the X centre marker, as the shaft continues to rotate the same pattern continues during operation. _______________________
TUPB005 Proceedings of IBIC2015, Melbourne, Australia
ISBN 978-3-95450-176-2
298Cop
yrig
ht©
2015
CC
-BY-
3.0
and
byth
ere
spec
tive
auth
ors
BPMs and Beam Stability
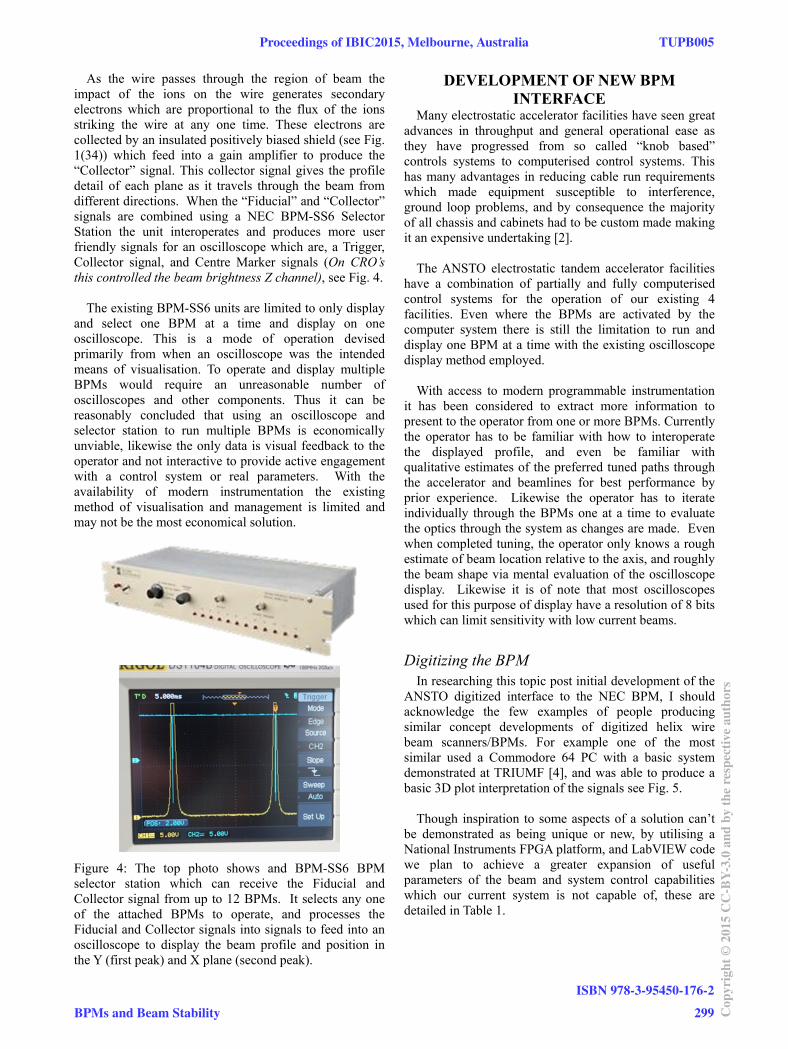
As the wire passes through the region of beam the impact of the ions on the wire generates secondary electrons which are proportional to the flux of the ions striking the wire at any one time. These electrons are collected by an insulated positively biased shield (see Fig. 1(34)) which feed into a gain amplifier to produce the “Collector” signal. This collector signal gives the profile detail of each plane as it travels through the beam from different directions. When the “Fiducial” and “Collector” signals are combined using a NEC BPM-SS6 Selector Station the unit interoperates and produces more user friendly signals for an oscilloscope which are, a Trigger, Collector signal, and Centre Marker signals (On CRO’s this controlled the beam brightness Z channel), see Fig. 4.
The existing BPM-SS6 units are limited to only display
and select one BPM at a time and display on one oscilloscope. This is a mode of operation devised primarily from when an oscilloscope was the intended means of visualisation. To operate and display multiple BPMs would require an unreasonable number of oscilloscopes and other components. Thus it can be reasonably concluded that using an oscilloscope and selector station to run multiple BPMs is economically unviable, likewise the only data is visual feedback to the operator and not interactive to provide active engagement with a control system or real parameters. With the availability of modern instrumentation the existing method of visualisation and management is limited and may not be the most economical solution.
Figure 4: The top photo shows and BPM-SS6 BPM selector station which can receive the Fiducial and Collector signal from up to 12 BPMs. It selects any one of the attached BPMs to operate, and processes the Fiducial and Collector signals into signals to feed into an oscilloscope to display the beam profile and position in the Y (first peak) and X plane (second peak).
DEVELOPMENT OF NEW BPM INTERFACE
Many electrostatic accelerator facilities have seen great advances in throughput and general operational ease as they have progressed from so called “knob based” controls systems to computerised control systems. This has many advantages in reducing cable run requirements which made equipment susceptible to interference, ground loop problems, and by consequence the majority of all chassis and cabinets had to be custom made making it an expensive undertaking [2].
The ANSTO electrostatic tandem accelerator facilities
have a combination of partially and fully computerised control systems for the operation of our existing 4 facilities. Even where the BPMs are activated by the computer system there is still the limitation to run and display one BPM at a time with the existing oscilloscope display method employed.
With access to modern programmable instrumentation
it has been considered to extract more information to present to the operator from one or more BPMs. Currently the operator has to be familiar with how to interoperate the displayed profile, and even be familiar with qualitative estimates of the preferred tuned paths through the accelerator and beamlines for best performance by prior experience. Likewise the operator has to iterate individually through the BPMs one at a time to evaluate the optics through the system as changes are made. Even when completed tuning, the operator only knows a rough estimate of beam location relative to the axis, and roughly the beam shape via mental evaluation of the oscilloscope display. Likewise it is of note that most oscilloscopes used for this purpose of display have a resolution of 8 bits which can limit sensitivity with low current beams.
Digitizing the BPM In researching this topic post initial development of the
ANSTO digitized interface to the NEC BPM, I should acknowledge the few examples of people producing similar concept developments of digitized helix wire beam scanners/BPMs. For example one of the most similar used a Commodore 64 PC with a basic system demonstrated at TRIUMF [4], and was able to produce a basic 3D plot interpretation of the signals see Fig. 5.
Though inspiration to some aspects of a solution can’t
be demonstrated as being unique or new, by utilising a National Instruments FPGA platform, and LabVIEW code we plan to achieve a greater expansion of useful parameters of the beam and system control capabilities which our current system is not capable of, these are detailed in Table 1.
Proceedings of IBIC2015, Melbourne, Australia TUPB005
BPMs and Beam Stability
ISBN 978-3-95450-176-2
299 Cop
yrig
ht©
2015
CC
-BY-
3.0
and
byth
ere
spec
tive
auth
ors

Figure 5: Original figure adapted from TRIUMF paper [4] of figures (4 - 6), demonstrating a 1986 version of a digitized helix wire beam scanner.
Current Development Activities Firstly in summary the goals which have been achieved
and will be detailed below are indicated in blue text in Table 1.
Initial proof of principle of conducted with the aid of a National Instrument development engineer to verify the suitability and capability of both software and hardware which was ultimately selected as the base platform for the BPM development work. Figure 6(a-c) shows the initial proof of principle using the digitized capture of live signals from a BPM to generate firstly the equivalent display as a current system, and secondly the sub-sequential calculated and generated 2D and 3D intensity plots (see Fig. 6).
The acceptance of the proof of principle allowed for the investing in FPGA hardware and PXI chassis to advance the development. This was done as the FPGA platform would deliver a solution which can behave deterministically, have true parallel processing, and be able to perform pre-processing of some data to reduce the process overhead of the associated computer system.
Each R series FPGA card used in this development is able to support up to 4 BPM with the native I/O on board, with full functionality of a NEC BPM81 profile monitor. Due to the FPGA data pre-processing ability this make the platform effectively scalable by adding more BPM inputs by adding additional R series FPGA I/O cards.
Engaging with the National Instruments engineer a
migration of the PC based code to a FPGA target solution was produced. This application can be screen in Fig. 7. The demonstration was successful in allowing the capture, manipulation, and display of data with no lag detectable to the accelerator operator. Though the demonstration in Fig. 7 is not the final solution, it has demonstrated progress, and that our current development platform has not shown any current limitation for the future refinement of this development.
Table 1: Long Term Goals of BPM Development Basic
Drop-in replacement for the BPM-SS6 unit.
Capture basic signal information to mimic current oscilloscope display.
Expansion System Operation
Scalable solution, the ability to add more BPMs to a common platform without creating system performance lag.
To allow operation of multiple units concurrently.
Expansion of Information
To convert the two scan peaks into a pseudo 2D and 3D intensity plot of the beam on a Cartesian plane.
To give dimensional measurement of the size position and pseudo shape of the beam.
To allow integration of the beam intensity for calibration studies again a faraday cup for continuous beam monitoring.
To allow dynamic real-time optics diagram to be generated throughout the beam path of flight path cross-section.
Control System Integrations
Controls a reading publish on network for concurrent display and operation.
Targeted and beam quality automated tuning of the ion beam through accelerator beamlines.
Alternative feedback system for Slit based Terminal Potential Stabiliser control and magnet stabilisation based on beam position.
Implantation dosage control.
Auto correction centring beam with grouped steerers.
Note: Item listed in Blue, have been demonstrated.
TUPB005 Proceedings of IBIC2015, Melbourne, Australia
ISBN 978-3-95450-176-2
300Cop
yrig
ht©
2015
CC
-BY-
3.0
and
byth
ere
spec
tive
auth
ors
BPMs and Beam Stability
(a)
(b)
(c)
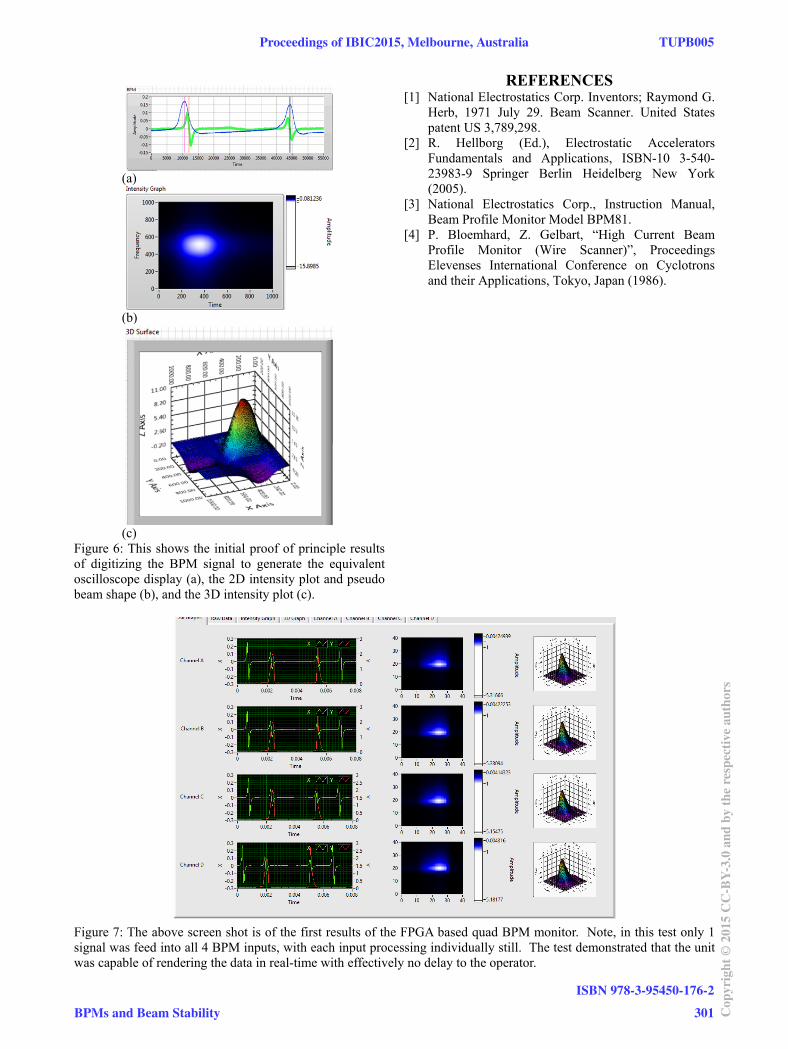
Figure 6: This shows the initial proof of principle results of digitizing the BPM signal to generate the equivalent oscilloscope display (a), the 2D intensity plot and pseudo beam shape (b), and the 3D intensity plot (c).
REFERENCES [1] National Electrostatics Corp. Inventors; Raymond G.
Herb, 1971 July 29. Beam Scanner. United States patent US 3,789,298.
[2] R. Hellborg (Ed.), Electrostatic Accelerators Fundamentals and Applications, ISBN-10 3-540-23983-9 Springer Berlin Heidelberg New York (2005).
[3] National Electrostatics Corp., Instruction Manual, Beam Profile Monitor Model BPM81.
[4] P. Bloemhard, Z. Gelbart, “High Current Beam Profile Monitor (Wire Scanner)”, Proceedings Elevenses International Conference on Cyclotrons and their Applications, Tokyo, Japan (1986).
Figure 7: The above screen shot is of the first results of the FPGA based quad BPM monitor. Note, in this test only 1 signal was feed into all 4 BPM inputs, with each input processing individually still. The test demonstrated that the unit was capable of rendering the data in real-time with effectively no delay to the operator.
Proceedings of IBIC2015, Melbourne, Australia TUPB005
BPMs and Beam Stability
ISBN 978-3-95450-176-2
301 Cop
yrig
ht©
2015
CC
-BY-
3.0
and
byth
ere
spec
tive
auth
ors