Embed Size (px)
Citation preview

May 27, 2011 10:0 AOGS - OS 9in x 6in b1143-ch01
Advances in GeosciencesVol. 24: Ocean Science (2010)Eds. Jianping Gan et al.c© World Scientific Publishing Company
INDO-PACIFIC TRIPOLE: AN INTRINSIC MODEOF TROPICAL CLIMATE VARIABILITY∗
DAKE CHEN
State Key Laboratory of Satellite Ocean Environment DynamicsHangzhou, China
and
Lamont-Doherty Earth Observatory of Columbia UniversityNew York, [email protected]
Because of the huge warm water pool that straddles across the tropical westernPacific and eastern Indian Oceans, the climate variations in these two oceansare closely related and need to be studied as a whole. Observations reveal astriking out-of-phase relationship between the zonal sea surface height (SSH)gradients in these two oceans and, to a lesser extent, between the correspondingsea surface temperature (SST) gradients. This can be explained in simpleterms as follows. The Walker circulation ascends above the warm pool, witheasterly surface winds on the Pacific side and westerly on the Indian side,which piles waters up in the warm pool and lowers SSH and SST in the easternPacific and western Indian Oceans. This produces a tripole structure withopposite zonal gradients of SSH and SST in the two oceans. When the double-cell Walker circulation weakens or strengthens, these gradients decrease orincrease together, and positive feedbacks between the gradients and the Walkercirculation take place. This tripole mode of variability is robust and can beexcited on various timescales from either the Pacific or Indian basin. It consistsof both local ocean–atmosphere coupling and inter-basin interaction, thusproviding a unified framework for the tropical Indo-Pacific climate variability.
1. Introduction
Research on the tropical Indo-Pacific climate variability dates back to thepioneering work of Gilbert Walker.1,2 Although a number of recent studiesreemphasized the connection between the Pacific and Indian Oceans,3−6 thetwo basins are often studied separately, with more attention on the ENSOphenomenon in the Pacific basin. As a result, tremendous progress has been
∗This paper is largely based on a Distinguished Lecture of Ocean Science delivered at the2009 annual meeting of Asia Oceania Geosciences Society (AOGS), and on an unpublishedmanuscript drafted a few years ago.
1

May 27, 2011 10:0 AOGS - OS 9in x 6in b1143-ch01
2 D. Chen
made in the theory, observation and prediction of this phenomenon.7−9
Now there is no doubt that ENSO depends on the ocean–atmosphereinteraction in the tropical Pacific, but uncertainties remain on how strongthis interaction is, on how much influences come from outside of thetropical Pacific and, consequently, on how predictable ENSO can be.10
At present, a hierarchy of dynamical ocean–atmosphere coupled models,ranging from intermediate couple models11,12 to coupled general circulationmodels,13,14 are routinely used for ENSO forecasting. Most of these modelshave statistically significant skills in predicting certain indices of tropicalPacific SST anomaly from several months to a year in advance.15 However,as shown by the El Nino Simulation Intercomparison Project,16 none of the24 tested models can realistically simulate all aspects of the interannualSST variability in the tropical Pacific, and there is plenty of room forimprovement, even if only very basic diagnostics are considered.
The climate variability in the tropical Indian Ocean has been a subjectof considerable debate in recent years. Many empirical analyses indicatethat the dominant interannual variability in the Indian Ocean is closelyrelated to ENSO,17−20 with a basin-wide warming during El Nino, resultingfrom weakened Walker circulation and surface latent heat flux. On theother hand, some recent studies suggest the existence of a so-called IndianOcean dipole (IOD), a mode of variability internal to the Indian Ocean,characterized by fluctuation of equatorial zonal temperature gradient.21−23
It is argued, however, that a real dipole does not exist because thefluctuation is not a distinct seesaw,24,25 and that this mode is not trulyindependent since it is highly correlated with ENSO when the correlation islagged and seasonally stratified. In any case, while the triggering processesof this mode of variability is not well understood, there are clear indicationsthat, once started, it evolves through local ocean–atmosphere interaction,with dynamics somewhat similar to that of ENSO.26−28 It is important forus to understand and predict the SST anomalies in the tropical Indian Oceanbecause, despite their relatively small magnitude, they may exert significantinfluence on regional and global climate.29−31 Ihara et al.32 found that SSTanomalies in the Indian Ocean impact the Indian Monsoon rainfall onlyduring El Nino events. They suggest that these Indian Ocean anomaliesmay be generated by teleconnections of early onset El Ninos.
The interactions between the Pacific and Indian Oceans, especiallythose between ENSO and IOD, have been a hot topic recently. By comparingmodel experiments with and without an active tropical Indian Ocean, Yuet al.4 showed that the Indian Ocean has a significant impact on the ENSOcycle. This is further confirmed by Wu and Kirtman,33 who also tried

May 27, 2011 10:0 AOGS - OS 9in x 6in b1143-ch01
Indo-Pacific Tripole 3
to explain the impact in terms of the “atmospheric bridge” provided bythe Walker circulation. On the other hand, using twin model experimentswith and without ENSO, Fischer et al.34 showed that IOD events in theirmodel could be generated by two triggers, one related to ENSO and theother to an anomalous Hadley circulation over the eastern tropical IndianOcean and maritime continent. In addition to the atmospheric bridge, the“oceanic pathway” between the Pacific and Indian basins via the IndonesianThroughflow has also been investigated in a series of recent studies,35−39
which focus on the role of the oceanic connection in establishing a linkbetween ENSO and IOD. Of particular interest is the work by Meehl et al.5
and Loschnigg et al.40 Although their emphasis is on the troposphericbiennial oscillation (TBO), their idea of TBO being an intrinsic Indo-Pacificmode, which links the anomalous convection and precipitation, winds, andocean dynamics across the two basins through the eastern (Pacific) andwestern (Indian) Walker cells, is enlightening.
Considering the existence of the huge warm water pool that encom-passes the tropical western Pacific and eastern Indian Oceans, and thecoexistence of the atmospheric double-cell Walker circulation, it is onlynatural to assume that the climate variations in these two basins may takeplace hand in hand, and that a more reasonable approach is to look atthe larger picture of the whole tropical Indo-Pacific region and examinethe common patterns of variability. In this study, we try to identify thedominant mode of short-term climate variability in the tropical Indo-Pacific,and to explore the main characteristics, the possible excitation mechanisms,and the practical implications of such a mode. Our emphasis here is notjust on ENSO, nor on IOD, but on the ocean–atmosphere interactions inboth tropical Pacific and Indian Oceans, as well as the two-way connectionsbetween the two basins that may provide a unified view on the hotlydebated issue of ENSO–IOD relationship. In the following sections, we firstexamine some observational evidence for the presence of an intrinsic mode oftropical Indo-Pacific variability, which we refer to as the Indo-Pacific Tripole(IPT),41 and then demonstrate its coupled nature and ways of developmentthrough data analysis and model experiments, followed by discussion andsome remarks on future work.
2. Evidence and Characteristics of IPT
Figure 1 shows the first mode of multivariate empirical orthogonalfunctions (MEOFs) of SST, SSH and surface wind stress for the

May 27, 2011 10:0 AOGS - OS 9in x 6in b1143-ch01
4 D. Chen
Fig. 1. Indo-Pacific Tripole as depicted by the first mode MEOFs of SST, SSH andsurface wind stress calculated using SODA dataset for September–October–November(SON) over the period 1950–2001. The upper two panels are spatial patterns of SST and
SSH with wind stress vectors superimposed, and the lower panel is normalized time series(principal component) of the mode.
September–October–November (SON) season over the 1950–2001 period,calculated from the Simple Ocean Data Analysis (SODA),42,43 a dataassimilation product based on a state-of-the-art global ocean generalcirculation model (Parallel Ocean Program) and a huge collection of variousoceanic data. A tripole structure is clearly seen in SST and SSH, with onepole going up and down in the warm pool region and the other two polesgoing down and up in the eastern Pacific and western Indian Oceans. ThePacific part is the familiar ENSO pattern while the Indian part is almostidentical to the IOD pattern identified by Saji et al.21 Had they done theircomposites of SST and wind for the entire Indo-Pacific region, they wouldhave found the same tripole structure shown here rather than a dipole.The tripole pattern is also evident in other analyses and coupled modelruns4,35,44,45 though it has not been explicitly described. Collectively, thesimplest picture we can derive from observations is as follows. The Walkercirculation ascends above the warm pool, with easterly surface winds on

May 27, 2011 10:0 AOGS - OS 9in x 6in b1143-ch01
Indo-Pacific Tripole 5
the Pacific side and westerly on the Indian side, which piles waters upin the warm pool and lowers SSH and SST in the eastern Pacific andwestern Indian Oceans. This produces a tripole structure with oppositezonal gradients of SSH and SST in the two oceans. When the double-cell Walker circulation weakens or strengthens, these gradients decrease orincrease together, and positive feedbacks between the gradients and theWalker circulation may take place.
This IPT mode of variability is so robust that it can be easily discernedeven in raw data. Figure 2 compares the zonal gradients of SST andSSH anomalies (SSTA and SSHA) in the equatorial Pacific and IndianOceans, respectively. There are several points worth noting here. First ofall, there is a striking out-of-phase relation between the SSHA gradientsin the two oceans and, to a lesser extent, between the corresponding SSTAgradients. This is certainly consistent with the IPT depicted in Fig. 1, whichis characterized by opposite gradients in the two oceans. Second, SSTA
Fig. 2. Time series of zonal gradients of SST (red) and SSH (blue) anomalies in theequatorial Pacific (upper) and Indian (lower) Oceans. Here a gradient is defined as thedifference between the average values in two 20◦ × 20◦ boxes at the eastern and westernends of each ocean. All variables are normalized by their respective standard deviations.

May 27, 2011 10:0 AOGS - OS 9in x 6in b1143-ch01
6 D. Chen
and SSHA gradients in each ocean are highly correlated with each other,indicating the importance of ocean dynamics in controlling SST variability.This is not surprising for the equatorial Pacific, since we know that ENSOresults from a dynamic ocean–atmosphere coupling, in the sense that winddrives ocean dynamics, which alters SST through thermocline fluctuation aswell as upwelling, and the SST in turn changes the wind field. The highly-coherent SST and SSH gradients in the equatorial Indian Ocean suggest thatthe same dynamic coupling may also be at work there. Finally, it is seen inFig. 2 that every major Pacific ENSO event over the past half a century hada counterpart in the Indian Ocean, but the opposite is not necessarily true.There were occasions, such as in the years of 1961, 1967 and 1994, when arelatively large Indian Ocean event did not seem to correspond to a similarPacific event. In fact, these few occasions were the major evidence used bySaji et al.21 and Yamagata et al.23 to argue for the independence of IODfrom ENSO, and they called these “pure” IOD events. We will show laterthat such events are special cases when the IPT mode is excited from theIndian basin.
Although we have focused on its oceanic manifestation when definingthe IPT, it is essentially an ocean–atmosphere coupled mode of variability inthe tropical Indo-Pacific. In our IPT scenario, the inter-basin connection isaccomplished through the atmospheric bridge over the warm pool. As shownin the upper panel of Fig. 3, the mean Walker circulation has a double-cellstructure in the Indo-Pacific equatorial band, with a broad ascending branchover the warm pool region and descending branches in the eastern Pacific andwestern Indian Oceans, connected by the opposite low-level winds over thetwo basins and the returning flows aloft. The whole system spins down duringEl Nino, as indicated by the two anomalous circulation cells rotating in theopposite direction of the mean cells (middle panel of Fig. 3). The situationreverses during La Nina when the Walker circulation cells are both enhanced(lowerpanel ofFig. 3).The systemalsoundergoes anannual cycle (not shown),with both cells being strengthened in boreal summer and weakened in winter.The close correspondence of the tropical Pacific and Indian Oceans on theannual timescale can actually be seen in Fig. 2: the stronger-than-normalannual cycle following the 1997/1998ElNino is evident in the SSHAandSSTAgradients that varies in opposite direction in the two oceans. The importantthing to notice here is that the double-cell Walker circulation oscillates as awhole on various timescales, and so does the underlying IPT. This suggeststhat the IPT is an intrinsic mode of the regional climate system and it couldbe excited through different mechanisms.

May 27, 2011 10:0 AOGS - OS 9in x 6in b1143-ch01
Indo-Pacific Tripole 7
Fig. 3. Indo-Pacific Walker circulation in SON season, as depicted by zonal mass flux46
and wind vectors in equatorial (5◦S–5◦N average) vertical (100–1000 mb) plane. Theupper panel is climatological mean, and the lower two panels are anomaly composites forall El Nino and La Nina years, respectively, over the period 1950–2001. Unit of mass fluxis 1010 kg/s.
3. Excitation and Development of IPT
Since ENSO is a powerful oscillation and every major ENSO event seems tohave a counterpart in the Indian Ocean, it is likely to be the main drivingforce for the IPT. As evident in Fig. 2, the majority of prominent IPT eventsin the past half a century occurred in El Nino or La Nina years. In order toexamine the role of ENSO in exciting the IPT, we plot in Fig. 4 a sequenceof seasonally averaged anomaly composites of SST, precipitation and wind
May 27, 2011 10:0 AOGS - OS 9in x 6in b1143-ch01
8 D. Chen
Fig. 4. Seasonal sequence of anomaly composites for three major El Ninos (1997–1998,1982–1983 and 1972–1973). SST and surface wind stress anomalies from the SODAdataset are shown in the left column, whereas precipitation and 850 mb wind from NCEPreanalysis are displayed in the right one.
fields over three major El Nino events of 1997–1998, 1982–1983 and 1972–1973. In a typical El Nino year, warm SST and westerly wind anomaliesstart to appear in the equatorial Pacific during spring season, while littlehappens on the Indian side at that time. El Nino is well under way bysummer, and SST and wind anomalies start to occur in the Indian Ocean.Over the next two seasons, El Nino enters its mature phase and a tripolepattern is seen in both SST and precipitation anomaly fields. This sequenceindicates that in strong El Nino years ENSO is the driving force for IPT,with the anomalies in the tropical Pacific leading those on the Indian side.It is interesting to note that the cold SSTA in the eastern Indian Oceandoes not survive into boreal winter. This is due to the reversal of the AsianMonsoon. The anomalous southeasterlies associated with the cold SSTA areagainst the winter monsoon winds, leading to reduced evaporation and SSTwarming.

May 27, 2011 10:0 AOGS - OS 9in x 6in b1143-ch01
Indo-Pacific Tripole 9
Fig. 5. Same as Fig. 3 but for anomalies in 1961, 1967 and 1994.
Now we turn back to the so-called “pure” IOD events and see if theyfit into the large picture of IPT. Figure 5 shows the anomalous Walkercirculation in fall seasons of 1961, 1967 and 1994. First of all, it is clearthat each of the Walker circulation cells over the Indian Ocean did havea counterpart, though a relatively weak one, in the western Pacific. Thusthese “pure” IOD events did not occur exclusively in the Indian Ocean, butextended into the Pacific warm pool. The double-cell circulation developednonetheless, but the Pacific cell was weak and did not result in a full-blownEl Nino. The seasonal evolution of the anomaly composites of these threeevents is shown in Fig. 6. During boreal spring, easterly wind anomaliesstarted to appear over the equatorial Indian Ocean while nothing much

May 27, 2011 10:0 AOGS - OS 9in x 6in b1143-ch01
10 D. Chen
Fig. 6. Same as Fig. 4 but for anomalies in 1961, 1967 and 1994.
was there in the equatorial Pacific. By summer, large southeasterly windanomalies were found off the coast of Sumatra, and strong southwesterlyanomalies in the Arabian Sea, the Bay of Bengal and the South China Sea,which had the same pattern and blew in the same directions as that of theAsian summer monsoon. In fact, various indices of both Indian and EastAsian summer monsoons all have high values in these years (not shown).In the following two seasons, a tripole pattern emerged, though the easternpole was weak and extended only as far east as the vicinity of the dateline.This sequence suggests that the IPT may also initiate in the Indian Ocean,possibly triggered by an anomalously strong summer monsoon season. Whenthis happens, though, the influence that the Indian Ocean exerts on thePacific may not be strong enough to condition the development of El Nino.
The atmospheric bridge that facilitates the two-way interaction betweenthe equatorial Pacific and Indian Oceans has been suggested as a “gear-like”connection, a possible mechanism through which ENSO influences AsianMonsoon and vice versa.47 An analogy of IPT excitation is shown by the

May 27, 2011 10:0 AOGS - OS 9in x 6in b1143-ch01
Indo-Pacific Tripole 11
DRIVING
DRIVING
Fig. 7. Schematics for the analogous mechanism of IPT excitation. See text fordiscussion.
schematics in Fig. 7, where the double-cell Walker circulation is regardedas two wheels in gear. When the large wheel (Pacific cell) speeds up orslows down, it has no problem bringing the small wheel (Indian cell) alongwith it and the system thus moves at the pace of the large wheel. On theother hand, when the small wheel is the driving wheel, it would have ahard time to bring the big wheel into action with it. But if there is an“automatic transmission” in nature, the system would shift to a lower gear.By analogy a smaller anomalous Walker circulation cell would occur inthe Pacific. Thus the IPT can have different manifestations. The MEOFmode depicted in Fig. 1 is just one, albeit the dominant, mode of the IPT,representing the case when ENSO is the driving force. A smaller tripolewith a weaker eastern branch that occurs in the western-central Pacific, asfound in a higher MEOF mode (not shown), is more appropriate for thesituation when the IPT is excited from the Indian Ocean. This variant IPTmode is somewhat similar to the “El Nino Modoki” described by Ashoket al.,48 which differs from canonical El Nino events in both characteristicsand climate impacts.49
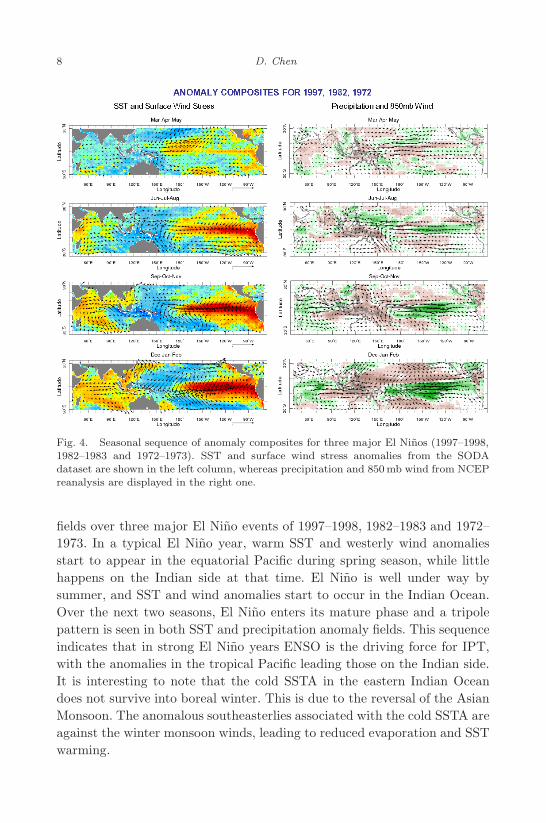
Finally, as an example, Fig. 8 shows a sequence of equatorial verticalsections in the Indo-Pacific region during the 1997/1998 El Nino, inwhich the oceanic anomalies are from an ocean model driven by observed
May 27, 2011 10:0 AOGS - OS 9in x 6in b1143-ch01
12 D. Chen
Fig. 8. Variation of seasonally averaged anomalies in the equatorial Indo-Pacific (5S–5Naverage) during 1997/1998 El Nino. For each season, the upper panel shows anomalouszonal mass flux (color) and wind vectors in the lower atmosphere (100–1000 mb), and thelower panel shows anomalous temperature (color) and salinity (contours) in the upperocean (0–500 m). The atmospheric data are from NCEP reanalysis and the oceanic dataare from Lamont OGCM.
surface winds and fluxes, while the atmospheric anomalies are from NCEP–NCAR reanalysis.50 The ocean model is a version of the sigma-coordinate,primitive-equation, reduced-gravity model developed by Gent and Cane,51
within which the hybrid mixed layer model of Chen et al.52 is embedded.It has been previously applied to many studies in the tropical PacificOcean53−56 and Indian Ocean.27 Figure 8 shows that, in the winter of1996/1997, the system was in a weak La Nina state with the anomalousWalker circulation enhancing the mean winds. Warm waters were piled upin the warm pool and lower temperatures were found in the eastern Pacificand western Indian Oceans. By the summer of 1997, the anomalous Walkercirculation cells had changed direction, and the warm anomalies propagatedaway from the warm pool. In the winter of 1997/1998, the system reachedthe mature phase of El Nino and the tripole mode reversed phase, with

May 27, 2011 10:0 AOGS - OS 9in x 6in b1143-ch01
Indo-Pacific Tripole 13
cold anomalies in the warm pool region and warmer waters on two sides.By the summer of 1998, the Walker circulation started to change directionagain and warm anomalies reappeared in the warm pool, setting the stagefor the next La Nina. This example clearly demonstrates that the Indo-Pacific ocean–atmosphere system went through this major event in concert,and that our ocean model, when driven by the observed atmosphericforcing, is capable of simulating the evolution and the structure of the IPTmode. Admittedly, the 1997/1998 El Nino is particularly strong, but similarsequences of evolution have been found for other IPT events in our modelexperiment. The concerted ocean–atmosphere coupling during El Nino overthe whole Indo-Pacific domain is also evident in many other studies.5,36,38
4. Discussion
We have shown that IPT is an intrinsic mode of climate variability in thetropical Indo-Pacific. It is characterized by opposite zonal wind anomaliesand opposite zonal gradients of sea level (and SST) anomalies in the Indianand Pacific Oceans. There is no question that ENSO, oftentimes the drivingforce and the Pacific branch of IPT, is the most dominant fluctuation in thetropical climate system. The question is how to relate the Indian Oceanclimate variability to that in the Pacific. As mentioned earlier, there aretwo drastically different opinions at present about the Indian Ocean zonalmode. One suggests that the variation of the zonal SST gradient is a result ofthe ocean–atmosphere coupling internal to the Indian Ocean,21,23,26,27 whilethe other dismisses the notion of its independence of ENSO and suggestsan insignificant role of local ocean dynamics.24,57–59 We believe that eachof these opinions tells part of the story and they can be unified under thelarger framework of IPT. Our finding agrees with the former in emphasizingthe roles of local ocean–atmosphere interaction, while agrees with the latterin emphasizing the importance of the inter-basin connection. Because of thewarm pool, the two Walker circulation cells over the equatorial Pacific andIndian Oceans share a common ascending branch. Any climate disturbancesin one cell would result in corresponding changes in the other. Thus thereason for IPT being a dominant intrinsic mode of the regional climatevariability lies in the warm pool and the associated double-cell Walkercirculation.
It seems that IPT can be excited by fluctuations in either Pacific orIndian basins on various timescales, with the Pacific ENSO being the main

May 27, 2011 10:0 AOGS - OS 9in x 6in b1143-ch01
14 D. Chen
driving force. Occasionally, however, IPT can be brought into action fromthe Indian side, possibly by anomalous Indian and East Asian summermonsoon. When this happens, the Pacific side may not develop into a full-blown ENSO episode. Instead, a weak event may occur in the western-central Pacific. Once started, the development of an IPT event depends onthe positive feedbacks between the ocean and the atmosphere. Such a viewon the excitation and development of IPT is plausible and is consistentwith available observations, but it needs to be examined more rigorously.A theoretical model of particular relevance here is that of Li et al.45 Theyuse five boxes to represent the regions of ocean–atmosphere interactionsover the tropical Indo-Pacific. The box that represents the eastern Pacificis not active, so that ENSO is specified rather than simulated. The modelhas a sustained oscillation only when external forcing such as ENSO orintraseasonal oscillation is imposed. When forced by the eastern PacificSSTA, the model is able to reproduce some of the IOD events that occurredduring El Nino years. It would be interesting to build a similar model forIPT excitation, now with an active eastern Pacific box and a specified AsianMonsoon box. Such a model should be able to generate an interannualoscillation by itself, despite the fact that the Indian basin alone is not likelyto produce self-sustaining oscillations due to the relatively deep thermoclineand the strong negative radiative feedback over this warm ocean.45 Thequestion is how this oscillation would bring the Indian Ocean into actionand how it would be affected by the imposed monsoon anomalies.
The concept of IPT has significant implications for tropical climateprediction. Under the framework of IPT, the interaction between the Pacificand Indian basins is a two-way street. Not only the Pacific ENSO eventshave a strong impact on the Indian sector, but the Indian Ocean fluctuationscan also have considerable influences on the Pacific sector, especially whenthe IPT is initiated in the Indian basin. An outstanding problem in ENSOprediction is the inability to forecast weak El Nino events which are usuallycentered around the dateline. We suggest that at least some of these weakevents are a result of IPT initiated from the Indian Ocean, and thatassimilating Indian Ocean data will help solving this problem. In fact, Clarkeand Van Gorder60 improved the skill of their empirical ENSO forecast modelby including the surface winds over the eastern equatorial Indian Ocean asa predictor. We need to further evaluate the impact of assimilating IndianOcean data, including SST, sea level and wind, on ENSO prediction. We alsoneed to explore the possibility of using Pacific observations as a precursor forIndian Ocean variability. Prediction is an important purpose of developing

May 27, 2011 10:0 AOGS - OS 9in x 6in b1143-ch01
Indo-Pacific Tripole 15
models and observing systems; it is also the ultimate test for theories andmodels. Further research along this line is likely to result in improvedforecasts of ENSO in the tropical Pacific, and to help us to gain betterunderstanding of the predictability, and possibly enhanced prediction, ofthe climate fluctuations in the tropical Indian Ocean.
5. Remarks on Future Work
Although the interactions between the Pacific and Indian Oceans have beeninvestigated before, the concept of IPT, its relations to ENSO and IOD,and its implications for predicting the tropical climate predictability arenew ideas worth further exploring. Supposedly, the present coupled generalcirculation models (CGCMs) already have the IPT mode in them, andthe forecasts based on these models already initialize the ocean in bothbasins. The questions remain on how well the Indo-Pacific interactionsare simulated in these models and what are the key parameters for aconsistent and effective model initialization. The limited predictive skillsof present models suggest plenty of room for improvement. This calls for adetailed analysis of IPT in both observational datasets and CGCM outputs,a thorough understanding of the dynamics of IPI, and process-orientednumerical experiments using models of various complexities. Some otherrelated topics of potential importance, such as the processes through whichthe Asian Monsoon system interacts with IPT, the relative importance ofoceanic pathway versus atmospheric bridge, and the effect of intraseasonaldisturbances, should also be studied, though they are of necessity left outof the scope of this paper.
The ongoing expansion of the TAO/TRITON array into the IndianOcean, and the recently established global ocean network of Argo floats,will provide invaluable new sources of observational data for studying theIndo-Pacific variability. In addition to in situ observations and reanalysisproducts, long runs of advanced CGCMs, especially those from the databaseof the Fourth and the upcoming Fifth Assessment Report (AR4 and AR5)of Intergovernmental Panel on Climate Change (IPCC), should be usedto further examine the robustness, dynamics and predictability of IPT.These datasets have been shown to be extremely useful for diagnosingtropical climate variabilities and their global impact on various timescales.For instance, Vecchi and Soden61 examined the response of the tropicalatmospheric and oceanic circulation to increasing greenhouse gases with theIPCC AR4 data, and found that changes are “El Nino-like” in the tropical

May 27, 2011 10:0 AOGS - OS 9in x 6in b1143-ch01
16 D. Chen
Pacific and “IOD-like” in the tropical Indian Ocean, apparently an IPT-likepattern. Using both reanalysis data and model ensembles, Annamalai andLiu62 studied the response of Asian summer monsoon to changes in El Ninoproperties on the inter-decadal time scale. They conclude that SSTs overthe entire tropical Indo-Pacific region have to be considered to understandthe ENSO-monsoon linkage and to make useful predictions of rainfall overIndia and the western North Pacific. We are currently investigating themechanism and impact of IPT using the IPCC AR4 dataset and othermodel runs, with particular emphasis on the lag relations among the PacificOcean, the maritime continent and the Indian Ocean. Our results will bereported on another occasion.
Acknowledgments
This work is supported by research grants from National BasicResearch Program (2007CB816005), National Science Foundation of China(40730843), National Oceanic and Atmospheric Administration, andNational Aeronautics and Space Administration.
References
1. G. T. Walker, Memoirs of the Indian Meteorological Department 21 (Part 2)(1910) 22.
2. G. T. Walker, Memoirs of the Indian Meteorological Department 24 (Part 4)(1923) 75.
3. B. P. Kirtman and J. Shukla, Quart. J. Royal. Meteor. Soc. 126 (2000) 213.4. J. Y. Yu, C. R. Mechoso, J. C. McWilliams and A. D. Arakawa, Geophys.
Res. Lett. 29 (2002) doi:10.1029/2001GL014098.5. G. A. Meehl, J. M. Arblaster and J. Loschnigg, J. Climate 16 (2003) 2138.6. B. Huang and J. D. Shukla, J. Climate 20 (2007) 2917.7. M. J. McPhaden, et al., J. Geophys. Res. 103 (1998) 14169.8. J. D. Neelin, et al., J. Geophys. Res. 103 (1998) 14261.9. M. Latif, et al., J. Geophys. Res. 103 (1998) 14375.
10. A. V. Fedorov, S. L. Harper, S. G. Philander, B. Winter and A. Wittenberg,Bull. Amer. Meteor. Soc. 84 (2003) 911.
11. M. A. Cane, S. E. Zebiak and S. C. Dolan, Nature 321 (1986) 827.12. D. Chen, M. A. Cane, A. Kaplan, S. E. Zebiak and D. Huang, Nature 428
(2004) 733.13. M. Ji, A. Kumar and A. D. Leetmaa, Tellus 46A (1994) 398.14. B. P. Kirtman, J. Shukla, B. Huang, Z. Zhu and E. K. Schneider, Mon.
Weather Rev. 125 (1997) 789.15. A. G. Barnston, et al., Bull. Am. Meteor. Soc. 75 (1994) 2097.

May 27, 2011 10:0 AOGS - OS 9in x 6in b1143-ch01
Indo-Pacific Tripole 17
16. M. Latif, et al., Climate Dyn. 18 (2001) 225.17. S. Nigam and H. S. Shen, J. Climate 6 (1993) 657.18. Y. M. Tourre and W. B. White, J. Phys. Oceanogr. 25 (1995) 1317.19. S. E. Nicholson, Int. J. Climatol. 17 (1997) 345.20. L. Yu and M. M. Rienecker, Geophys. Res. Lett. 26 (1999) 735.21. N. H. Saji, B. N. Goswami, P. N. Vinayachandran and T. Yamagata, Nature
401 (1999) 360.22. D. Anderson, Nature 401 (1999) 327.23. T. Yamagata, S. K. Behera, S. A. Rao, Z. Guan, K. Ashok and H. N. Saji,
Bull. Am. Meteor. Soc. 84 (2003) 1418.24. R. J. Allan, et al., CLIVAR Exch. 6 (2001) 18.25. S. Hastenrath, Bull. Am. Meteor. Soc. 83 (2002) 735.26. P. J. Webster, A. M. Moore, J. P. Loschnigg and R. R. Leben, Nature 401
(1999) 356.27. R. Murtugudde, J. P. McCreary and A. J. Busalacchi, J. Geophys. Res. 105
(2000) 3295.28. S.-P. Xie, H. Annamalai, F. A. Shott and J. P. McCreary, J. Climate 15
(2002) 864.29. L. Goddard and N. E. Graham, J. Geophys. Res. 104 (1999) 19099.30. M. P. Hoerling, J. W. Hurrell and T. Xu, Science 292 (2001) 90.31. M. P. Hoerling and A. Kumar, Science 299 (2003) 691.32. C. Ihara, Y. Kushnir, M. A. Cane and V. H. De la Pena, Int. J. Climatol.
27 (2007) 179.33. R. Wu and B. P. Kirtman, J. Climate 17 (2004) 4019.34. A. S. Fischer, P. Terray, E. Guilyardi, S. Gualdi, P. R. Delecluse, J. Climate
18 (2005) 3428.35. H. Annamalai, R. Murtugudde, J. Potemra, S.-P. Xie, P. Liu and B. Wang,
Deep-Sea Res. II 50 (2003) 2305.36. H. Annamalai, S.-P. Xie, J. P. McCreary and R. Murtugudde, J. Climate 18
(2005) 302.37. S. Gualdi, E. Guilyardi, A. Navarra, S. Masina and P. Delecluse, Clim. Dyn.
20 (2003) 567.38. R. Wu and B. P. Kirtman, Clim. Dyn. 25 (2005) 155.39. A. Bracco, F. Kucharski and F. Molteni, Geophys. Res. Lett. 32 (2005) doi:
10.1029/2005GL023154.40. J. Loschnigg, G. A. Meehl, P. J. Webster, J. M. Arblaster and G. P. Compo,
J. Climate 16 (2003) 1617.41. D. Chen and M. A. Cane, J. Comput. Phys. 227 (2008) 3625.42. J. A. Carton, G. Chepurin, X. Cao and B. S. Giese, J. Phys. Oceanogr. 30
(2000) 294.43. J. A. Carton, G. Chepurin and X. Cao, J. Phys. Oceanogr. 30 (2000) 311.44. B. Wang, R. Wu and T. Li, J. Climate 16 (2003) 1195.45. T. Li, B. Wang, C. P. Chang and Y. Zhang, J. Atmos. Sci. 60 (2003) 2119.46. J. W. Bergmann and H. H. Hendon, J. Atmos. Sci. 57 (2000) 2225.47. G. Wu and W. Meng, Chinese J. Atmos. Sci. 22 (1998) 470.

May 27, 2011 10:0 AOGS - OS 9in x 6in b1143-ch01
18 D. Chen
48. K. Ashok, S. K. Behera, S. A. Rao, H. Weng and T. Yamagata, J. Geophys.Res. (2007) doi:10.1029/2006JC003798.
49. H. Weng, K. Ashok, S. K. Behera, S. A. Rao and T. Yamagata, Clim. Dyn.29 (2007) 113.
50. E. Kalnay, et al., Bull. Am. Meteor. Soc. 77 (1996) 437.51. P. R. Gent and M. A. Cane, J. Comput. Phys. 81 (1989) 444.52. D. Chen, L. M. Rothstein and A. J. Busalacchi, J. Phys. Oceanogr. 24 (1994)
2156.53. P. R. Gent, J. Geophys. Res. 96 (1991) 3323.54. D. Chen, A. J. Busalacchi and L. M. Rothstein, J. Geophys. Res. 99 (1994)
20345.55. D. Chen, T. W. Liu, S. E. Zebiak, M. A. Cane, K. Kushnir and D. Witter,
J. Geophys. Res. 104 (1999) 11291.56. W. S. Kessler, L. M. Rothstein and D. Chen, J. Clim. 11 (1998) 777.57. D. P. Chambers, B. D. Tapley and R. H. Stewart, J. Geophys. Res. 104
(1999) 3035.58. A. Baquero-Bernal and M. S. Latif, J. Climate 15 (2002) 1358.59. C. J. C. Reason, R. J. Allan, J. A. Lindesay and T. J. Ansell, Int. J. Climatol.
20 (2000) 1285.60. A. J. Clarke and S. Van Gorder, Geophys. Res. Lett. 30 (2003) 1399.61. G. A. Vecchi and B. J. Soden, J. Climate 20 (2007) 4316.62. H. Annamalai and P. Liu, Quart. J. Royal Met. Soc. 131 (2005) 805.


![[Vasant Matsagar (Eds.)] Advances in Structural en(BookZZ.org)](https://img.pdfslide.net/doc/110x75/563db89c550346aa9a954785/vasant-matsagar-eds-advances-in-structural-enbookzzorg.jpg)