Embed Size (px)
Citation preview

Journal of Cellular Biochemistry Supplement 39:194–210 (2002)
Advances in Molecular Labeling, High ThroughputImaging and Machine Intelligence Portend PowerfulFunctional Cellular Biochemistry Tools
Jeffrey H. Price,1,2* Angela Goodacre,2 Klaus Hahn,3 Louis Hodgson,1,3 Edward A. Hunter,2
Stanislaw Krajewski,4 Robert F. Murphy,5 Andrew Rabinovich,1,6 John C. Reed,4 and Susanne Heynen1
1Department of Bioengineering and Whitaker Institute of Biomedical Engineering,University of California San Diego, La Jolla, California2Q3DM, Inc., San Diego, California3Department of Cell Biology, The Scripps Research Institute, La Jolla, California4The Burnham Institute, La Jolla, California5Departments of Biological Sciences and Biomedical Engineering and Center for Automated Learningand Discovery, Carnegie Mellon University, Pittsburgh, Pennsylvania6Department of Computer Science and Engineering, University of California San Diego, La Jolla, California
Abstract Cellular behavior is complex. Successfully understanding systems at ever-increasing complexity isfundamental to advances inmodern science and unraveling the functional details of cellular behavior is no exception.Wepresent a collection of prospectives to provide a glimpse of the techniques that will aid in collecting, managing andutilizing information on complex cellular processes via molecular imaging tools. These include: 1) visualizingintracellular protein activitywith fluorescentmarkers, 2) high throughput (and automated) imaging ofmultilabeled cells instatistically significant numbers, and 3) machine intelligence to analyze subcellular image localization and pattern.Although not addressed here, the importance of combining cell-image-based information with detailed molecularstructure and ligand-receptor binding models cannot be overlooked. Advanced molecular imaging techniques have thepotential to impact cellular diagnostics for cancer screening, clinical correlations of tissue molecular patterns for cancerbiology, and cellular molecular interactions for accelerating drug discovery. The goal of finally understanding all cellularcomponents and behaviors will be achieved by advances in both instrumentation engineering (software and hardware)and molecular biochemistry. J. Cell. Biochem. Suppl. 39: 194–210, 2002. � 2002 Wiley-Liss, Inc.
Key words: microscopy; protein activity; pattern analysis; cellular diagnostics; tissue microarrays; drug discovery;fluorescent probes
Imaging and molecular labeling are com-bining to build powerful investigative toolsfor functional cellular biochemistry. Knowledge
gained from the genomics and proteomics re-volutions are perhaps in some senses over-whelming the ability of current laboratorymethods such as gel electrophoresis, mass spec-troscopy, computational prediction methods,and protein chips for protein studies. Althoughhigher throughput versions of these kinds oftechniques continue to be developed [Hiroaki,2002], the need for high throughput measure-ments of molecules directly in cells is apparentdue to their tremendous complexity [Gibbs,2001]. Prospects for labeling techniques com-bined with high throughput microscopy (HTM)and higher-level machine intelligence are pre-sented here. HTMmay at first only seem to addto the potential information overload. But theprospects for machine intelligence and smartdatabase collation of information facilitate a
� 2002 Wiley-Liss, Inc.
Disclosure Statement; J. Price owns equity in Q3DM Inc.
Grant sponsor: National Science Foundation ResearchInstrumentation; Grant number: BES-9871365. Grantsponsor: The Whitaker Foundation Biomedical Engineer-ing Research Grant Program; National Institutes ofHealth; Grant numbers: R44 RR15170, R33 CA83219.Grant sponsor: WPC Research and Education Fund.
*Correspondence to: Jeffrey H. Price, MD, PhD, UCSDDepartment of Bioengineering, 9500 Gilman Drive, MS0412, La Jolla, CA 92093-0412. E-mail: [email protected]
Received 7 November 2002; Accepted 7 November 2002
DOI 10.1002/jcb.10448Published online in Wiley InterScience(www.interscience.wiley.com).

vision of the future where comprehensivecellular protein-activity-structure-function isavailable for substantially all molecules in acell. Realization of such a vision depends on thecontinued advances in computer power andstorage for possibly a few decades.Intracellular molecular function is in and of
itself complex because a single enzyme mayhave multiple activators and/or inhibitors. Theprospects for labeling intracellular proteinactivity are described in Section I. The complex-ity of obtaining information from multilabeledcells in statistically significant numbers wouldbe simplified by intelligent automation. Theprospects for imaging cells with automatedHTM are described in Section II. The functionof intracellular proteins can best be under-stood in the context of subcellular location. Theprospects for automatically differentiating pro-teins from one another using machine intelli-gence to analyze subcellular localization andpattern are described in Section III. Driven bynew understanding of proteins and function,molecular labels have the potential to revolu-tionize cellular diagnostics. The prospects fordiagnosing cells using molecular labels aredescribed in Section IV. Diagnostics based onmolecular labels are best understood in thecontext of the patterns of expression in disease.The prospects for learning new informationabout molecular patterns of cancer using tissuemicroarrays aredescribed inSectionV. Imagingautomation and the broad array of developingcellular molecular knowledge have the poten-tial to accelerate drug discovery. The prospectsfor discovering drugs by imaging subcellularmolecular activity are described in Section VI.These prospectives represent a snapshot ofonly a portion of the tremendous potential formolecular imaging.
PROSPECTING INTRACELLULAR PROTEINACTIVITY WITH FLUORESCENT LABELS
Using proteins tagged with fluorescent dyes,the ability to study proteins in their nativeenvironment has been a critical tool in cellbiology for over two decades [Taylor and Wang,1980]. However, this approach has been limitedto proteins that could be labeled and reintro-duced into correct cellular compartments viamethods such as microinjection. A revolution inusing fluorescence techniques to study biologi-cal systems came with the discovery of green
fluorescent protein (GFP) and its analoguesderived from the jellyfish Aequoria victoria[Chalfie et al., 1994; Heim and Tsien, 1996].The advantage of GFP is that it can be clonedinto expression constructs and used by simpletransfection to attain stable expression inmanycell types. Initial use of GFP was limited totagging proteins to observe the changes inlocalizations in vivo [Misteli and Spector, 1997].In these early fluorescent protein analogues,constructs were purposely designed not todisturb the fluorescence characteristics ofGFP, so that the protein localizations could bequantified with ease. With this approach, bulktranslocations of proteins could be observed;however, functional changes such as post-translational modification or conformationalchanges could not be detected.
Rapid developments in addressing the limita-tions of GFP-tagged fluorescent protein analo-gues came in the form of fluorescence resonanceenergy transfer (FRET) biosensors [Adamset al., 1991; Heim and Tsien, 1996; Miyawakiet al., 1997]. These sensors utilized GFP and itsmutants in different ‘‘colors’’ and sometimesother fluorescent dyes with overlapping fluor-escence excitation and emission spectra. Whenthe two fluorophores come within approxi-mately 80 A of one another, FRET takes place,such that excitation of the donor fluorophoreproduces emission from the acceptor fluoro-phore. The primary advantage of this techniqueis the ability to monitor interactions betweentwo components within a cell; i.e., by tagging aprotein with donor CFP and monitoring accep-tor emission from the YFP attached to anotherprotein, one observes FRET emission onlywhenthe two proteins come together. Several var-iants of this technique have been developed toobserve more specific aspects of protein activity(Fig. 1). Successful use of strategies includ-ing protein transducers, and intra- and inter-molecular FRET probes have been reported[Adamset al., 1991;Hahnet al., 1992;Miyawakiet al., 1997; Llopis et al., 1999; Ting et al., 2001;Haj et al., 2002]. Of these variants of FRETbiosensors, domain or antibody-based biosen-sors (Fig. 1d) offer the ability to monitorexposures of active sites of endogenous proteinsduring cellular events such as cell adhesion,spreading, and migration [Chamberlain andHahn, 2000; Kraynov et al., 2001]. Domainsused in this approach are a small peptidesequence derived from the consensus binding
Functional Cellular Imaging Tools 195

regions of downstream effectors for the targetprotein of interest. Similarly, antibodies specificto the target protein can be labeled with fluoro-chromes and used as biosensors [Haj et al.,2002].
Signal transduction is perhaps the area inwhich FRET biosensor technology has had themost impact. Work in a few laboratories hastargeted activation and subsequent domain-exposure events for a number of Rho-family ofGTPase proteins [Kraynov et al., 2001; Del Pozoet al., 2002; Katsumi et al., 2002]. GTPase
proteins were tagged with GFP in the N-terminal region, away from areas of the proteincritical for bioactivity, and a binding domainderived from the effector molecules was taggedwith an acceptor fluorochrome. Upon activationof the GTPase and binding of the activatedGTPase to the domain-sensor probe, GFP andthe fluorochrome were brought into close proxi-mity, effecting FRET. In the example (Fig. 2),Rac GTPase tagged with GFP was expressedas a fusion protein, and PBD (PAK BindingDomain) labeled with Alexa546 dye was micro-injected into cells. As can be seen from thefigure, FRET signals revealed highly localizedexposures of domain binding activity correlat-ing with the direction of cell polarization,whereas the GFP and Alexa546 images showedthe very different whole-cell distribution pat-terns of these proteins.
There are certain limitations associated withthe use of FRET biosensors. Some proteinscannot be tagged with GFP or a dye withoutperturbing native biology. Another potentialissue may be competitive binding between thedomain-biosensors and native ligands. Newapproaches on the horizon will likely conquerthese issues by engineering sensors that canbind to endogenous, untagged proteins. Alter-natively, proteins can be directly labeled withnovel, solvent-sensitive dyes that report proteinactivation, or by using circularly permutedGFPconstructs [Hahn et al., 1992; Baird et al., 1999;Nalbant et al., 2001; Hahn and Touchkine,2002; Touchkine et al., 2003].
IMAGING CELLS WITH AUTOMATED HIGHTHROUGHPUT MICROSCOPY
High throughput imaging has the potential toautomatically correlate cell structure, function,and behavior with the wealth of cell molecularinformation generated by genomics and proteo-mics efforts. Instead of sitting for hours, days,months, or even years in front of themicroscopeto understand how molecules govern cell be-havior, high throughput microscopy instru-mentation automates image acquisition, cellmeasurement (cytometry) andwill soon providehigh level interpretation of cell type and be-havior, all at speeds orders of magnitude fasterthan humans.
HTM means high speed, which cannot beachieved without complete automation. Theability to place a slide or microtiter plate on
Fig. 1. Types of FRET biosensors. a: Intermolecular FRET. FRETbetween donor and acceptor fluorophore attached to twoseparate proteins. When proteins come together, FRET isobserved. b: Intramolecular FRET. FRET occurs between twofluorophores attached to a single protein. Upon protein activa-tion and a conformational change, two fluorophores are broughtcloser together to be detectable by FRET. c: Protein transducer.Proteins can be engineered in such away as to induce large shiftsin conformation upon binding to certain ligands, thus bringingthe two fluorophores within FRET proximity. In this example,binding of calcium induces a conformational shift in the proteinto expose a hydrophobic pocket, where the peptide (in blue)binds to cause a large shift in the linker arm attached to thesecond fluorophore [Miyawaki et al., 1997]. d: Domain/anti-body-biosensors. A small peptide or antibody attached to afluorophore selectively binds to the target protein upon activa-tionof theprotein. Thebindingdomain/antibody canbe attachedor not attached to the protein of interest. [Adapted fromChamberlain and Hahn, 2000]
196 Price et al.
the microscope, push a button, and return laterwith thousands to millions of cells analyzedrequires automatic focus and stage motion toacquire the images, computerized image seg-mentation to locate the cells in the images,analysis software to collatemeasurements fromeach cell and high level tools for retrieval andvisualization of the results. The process ofscanning the specimen, performing autofocusand acquiring the images is shown in Figure 3.Whereas inmacroscopic photography autofocusmay be acceptable if it works say 9 out of 10times with a precision of a meter or so, in highresolutionmicroscopy, autofocusmustbe robustover tens of thousands of fields (depending onmagnification and field of view, FOV) withsubmicron precision just to analyze a singlemicroscope slide. Slides surfaces vary by asmuch as � 10 mm and microtiter plate surfacesby > 100 mm. The microscope itself is alsounstable and temperature changes can alterfocus position through ranges of 10–20 mm over24 h in a typical lab [Bravo-Zanoguera, 2001].This makes autofocus for microscopy a challen-
ging task and several different criteria forfinding the most in focus image have beentested. Usually for several different z-positionsa focus score or focus index is calculated, which
Fig. 2. Madin-Darby canine kidney (MDCK) cells expressingRac GTPase tagged with GFP. A p21-binding domain from PAK(PBD) conjugated to Alexa 546 dye (Molecular Probes, Inc.,Eugene, OR) was produced in vitro and microinjected into cellsexpressing the GFP-Rac GTPase fusion protein. FRET signalswere detected only where the domain biosensor bound to theactive Rac GTPase, showing specific localization of activity (left
column; red, areas of high FRET signal; blue, areas of low FRETsignal). Fluorescence signals from GFP-Rac GTPase (middlecolumn) and the Alexa546-PBD (right column), show that thedistribution of the protein can be seen to be quite different fromthat of the activated protein. Rac is activated at the leading edgeof moving cells, and in the juxtanuclear region. [Figure courtesyC. Chamberlain, J. Ehrlich, J. Nelson, and K. Hahn].
Fig. 3. Scanning and autofocus: Best focus is calculated from aseries of several test focus positions (typically 5–9) and set beforeimage acquisition and processing. The stage then moves to theadjacent field and autofocus is repeated with best focus from theprevious field providing the center of the autofocus search range(�2–4 mm). Stage motion, autofocus, and imaging occur in aslittle as 0.3 s/field and autofocus precision is<100 nm. [Adaptedfrom Bravo-Zanoguera, 2001].
Functional Cellular Imaging Tools 197

is a measure of the resolution (high frequencycontent), contrast, or entropy of the image[Groen et al., 1985; Price and Gough, 1994;Bravo-Zanoguera et al., 1998;Geusebroek et al.,2000]. From these focus indices, the highestvalue is chosen as the optimal focus position.Research at UCSD has created HTM that ope-rates with up to high-dry magnification objec-tives (0.95 numerical aperture, NA) at speeds of3 fields/s (Hz) and recently proven technology(reports in progress) will increase this 10-fold[Bravo-ZanogueraandPrice, 1998;Bravo-Zano-guera et al., 1999; Nguyen et al., 2000]. Thisinstrumentation is based on autofocus thatworks in 0.25 s with a precision of < 100 nm(SD) [Price and Gough, 1994; Bravo-Zanogueraet al., 1998; Oliva et al., 1999] and lampstabilization with 10–30 fold lower coefficientsof variation (CVs) than the conventional Hgvapor lamp [Heynen et al., 1997]. This systemhas been demonstrated to be able to find as fewas 1:20 million cells in ultra-rare cell detection(with analysis of 5 million cells/slide) [Bajajet al., 2000].
Each image can contain from a few large cellsat highmagnification to thousands of small cellsat low magnification. In HTM, the computerlocates each cell by segmenting the image intoregions. The region of pixels is then used tomake measurements of, e.g., quantity, shape,pattern, and distribution of labeled intracellu-lar molecules. There has been a wide range ofimage segmentation methods applied to biome-dical imaging, among which are global oradaptive thresholding, texture based classifica-tion, region growing, neural networks, Markovrandomfield approaches, andadaptive contours[Fu and Mui, 1981; Pal and Pal, 1993; Priceet al., 1996; Saeed, 1998]. All these methodsperform with different accuracies, differentexecution times and require different levels ofuser-interaction, which makes them suitablefor certain specific applications but unsuitablefor others. With images acquired at 3–30 Hz,image segmentation must be fast and becausesubsequent cytometry accuracy is dependent oncorrectly identifying pixels belonging to the cell,it must also be accurate. Because cells stainedwith fluorescent dyes exhibit large differencesin intensity, simple thresholding does not per-form well and other techniques untested oncell images [Pal and Pal, 1993] are too slow. Areal-time image segmentation method for fluor-escently stained cell nuclei makes cell identi-
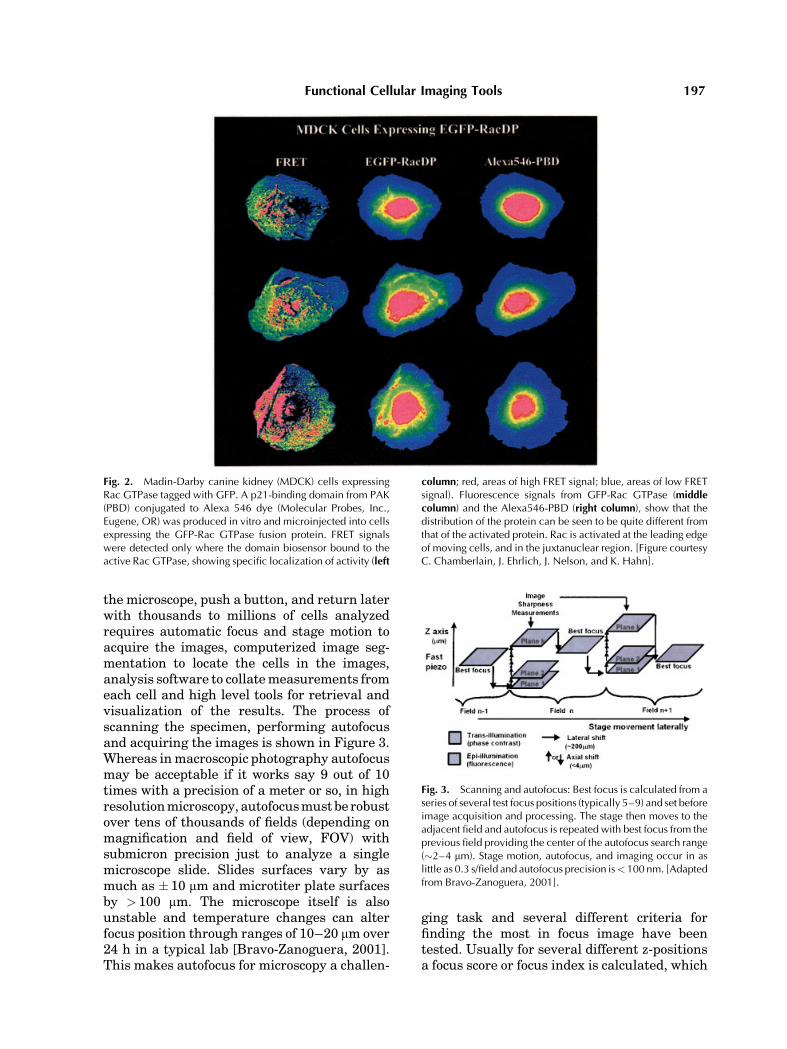
fication largely independent of fluorescenceintensity [Price et al., 1996]. Themethodutilizesnonlinear least-squares-designedfinite impulseresponse (FIR) filters to create marked object-background contrast for automatic histogram-based thresholding. The contrast improvementshown on the left in Figure 4 is the key toaccurate automatic image segmentation. Thiscontrast makes result much more threshold-independent; dim cells are segmented with thesameaccuracyas bright ones over amuch largerintensity range than was previously possible.Segmentation accuracywas 93% (percent of cor-rect pixels as compared with computer-assistedhuman segmentation) [Price et al., 1996].
In addition to precise autofocus and accuratecomputerized image segmentation, automationmust include collation of data-and-images in arelational database for rapid plotting, sorting,and access to images of cell subpopulationscharacterizedbyspecifiedmeasurementranges.Even with these tools, plotting data and itera-tively experimenting with different measure-ment ranges to find say the G2/M dividing cellsor perhaps ultimately the cancer cells mixed inwith normal ones in a clinical sample, is tootedious. The machine thus needs the intelli-gence to locate groups of cells with sharedcharacteristics automatically and report them.Examples of higher-level machine intelligencethat may lead to this kind of automation followin the next two sections.
PROSPECTING FOR SUBCELLULARLOCALIZATION AND PATTERNUSING MACHINE INTELLIGENCE
As genome sequencing efforts reached com-pletion over the past few years, a major effortwas begun to identify the genes expressed inmany cell types under various conditions (e.g.,via DNA chips). More recently, as the diver-gence between expression levels of RNA andprotein for many genes has been appreciated,the focus has shifted again from measuringRNA levels to measuring protein expression.Commonly used proteomics methods includedgel electrophoresis, mass spectroscopy, compu-tational prediction methods, and protein chips[Yarmush and Jayaraman, 2002]. Proteomicsmethods allow investigation of protein expres-sion for a particular cell type under a specificcondition as well as examination of proteinstructure, function, and interactions. However,
198 Price et al.
high throughput methods are also needed forthe analysis of protein location within cells[Boland et al., 1997; Murphy et al., 2000], sinceknowledge of subcellular location is required fora full understanding of a protein’s function. Themost common method used to examine subcel-lular localization is to mark a specific proteinwith a specific fluorescent tag and then imagethe cell expressing it using fluorescence micro-scopy. The goal of this type of fluorescenttagging is distinct from the creation of fluor-escent-protein biosensors that are designed toprovide insights into molecular processes inliving cells [Giuliano and Taylor, 1998] asdescribed in the first section. For determinationof location patterns, the goal is to specificallyavoid the environmental sensitivity requiredfor biosensors and instead to tag as manyproteins as possible in as many different loca-tions within each protein. For this purpose, anexcellent method is the creation of internalfusionswith fluorescent proteins (such asGFP),
a method termed CD-tagging [Jarvik et al.,1996, 2002; Telmer et al., 2002].
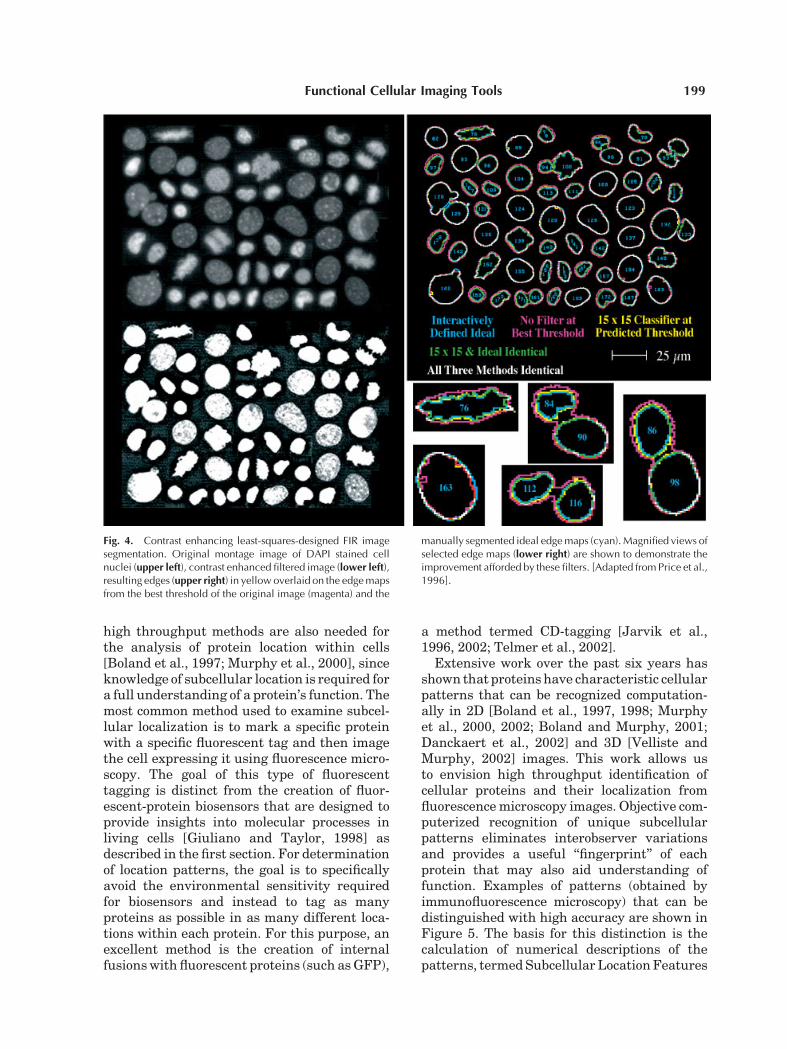
Extensive work over the past six years hasshown that proteins have characteristic cellularpatterns that can be recognized computation-ally in 2D [Boland et al., 1997, 1998; Murphyet al., 2000, 2002; Boland and Murphy, 2001;Danckaert et al., 2002] and 3D [Velliste andMurphy, 2002] images. This work allows usto envision high throughput identification ofcellular proteins and their localization fromfluorescencemicroscopy images. Objective com-puterized recognition of unique subcellularpatterns eliminates interobserver variationsand provides a useful ‘‘fingerprint’’ of eachprotein that may also aid understanding offunction. Examples of patterns (obtained byimmunofluorescence microscopy) that can bedistinguished with high accuracy are shown inFigure 5. The basis for this distinction is thecalculation of numerical descriptions of thepatterns, termedSubcellular LocationFeatures
Fig. 4. Contrast enhancing least-squares-designed FIR imagesegmentation. Original montage image of DAPI stained cellnuclei (upper left), contrast enhanced filtered image (lower left),resulting edges (upper right) in yellow overlaid on the edgemapsfrom the best threshold of the original image (magenta) and the
manually segmented ideal edgemaps (cyan). Magnified views ofselected edge maps (lower right) are shown to demonstrate theimprovement afforded by these filters. [Adapted from Price et al.,1996].
Functional Cellular Imaging Tools 199

[Boland and Murphy, 2001]. These featuresdescribe a range of characteristics of eachimage, such as thenumber of fluorescent objectsper cell, the average distance of fluorescentobjects from the center of the cell, and texturemeasures of the correlation between gray levelsof adjacent pixels. The measured values of thefeatures can be used to train classifiers (e.g.,neural networks) and the trained classifiers canbe used to assign a pattern to previously unseenimages. For images showing the subcellularlocations depicted inFigure 5, anaverage classi-fication accuracy of 83� 4.6% (mean� 95%confidence interval) has been reported forclassification of single images [Boland andMurphy, 2001]. If a set of ten images from thesame population is analyzed and the populationclass is determined by assigning the class label
that a plurality of the members were assigned,the classification accuracy can be increased to98% [Boland and Murphy, 2001]. More recentstudies yielded 88% accuracy for single 2Dimages accompanied by a parallel DNA image[Murphy et al., 2002] and 91% for single 3Dimages [Velliste and Murphy, 2002]. As illu-strated in Table I, a key result from thesestudies is that the systems can discriminatebetween patterns that are indistinguishable byhuman observers (the patterns of the Golgiproteins giantin and gpp130 can be distin-guished with greater than 80% accuracy whilehuman observers cannot distinguish themwithgreater than the 50%accuracy that results fromguessing). With such high classification accura-cies, automated analysis of cellular proteinlocalization from fluorescence images can beexpected to become an independent tool forunderstanding the structure-function relation-ships of proteins.
The development of automated screening andanalysis methods for microscope images willhave a significant impact in several fields[Giuliano and Taylor, 1998; Boland and Mur-phy, 1999]. The quantitative description andautomated classification of protein localizationprovides the opportunity for a standardizeddatabase againstwhich a protein pattern can becompared and classified [Huang et al., 2002].The Subcellular Location Features have alsobeen used to provide an objective method forcomparing sets of protein patterns, such as for a
Fig. 5. Representative images from the classes used as input tothe classification systems described in the text. These imageshave had background fluorescence subtracted and have had allpixels belowa threshold set to 0. Images are shown forHeLa cellslabeled with antibodies against ER protein (A), the Golgi proteingiantin (B), the Golgi protein GPP130 (C), the lysosomal proteinLAMP2 (D), a mitochondrial protein (E), the nucleolar proteinnucleolin (F), transferrin receptor (H), and the cytoskeletalprotein tubulin (J). Images are also shown for filamentous actinlabeled with rhodamine-phalloidin (G) and DNA labeled withDAPI (K). Scale bar¼ 10 mm. [From Boland and Murphy, 2001.]
TABLE I. Classification Results for3D Confocal Images of HeLa Cells
Confocal images of the same markers shown in Figure 1 werecollected, 28 numerical features were calculated for each image(feature set 3D-SLF9), and a neural network classifier wastrained with a portion of the images. The prediction of theclassifier for the remainder of the images was compared to thetrue class; the values in the table show the fraction of the imagesthat are actually from a given class (shown in the rows) thatwere classified as belonging to a particular class (shown in thecolumns). The overall accuracy is 91% across all 10 classes.[From Velliste and Murphy, 2002.]
200 Price et al.
protein in the presence and absence of a drug[Roques and Murphy, 2002]. The addition of aprotein localization pattern database to theexisting protein structure databases will pro-vide exciting new insights into the relationshipsbetween function, transport, and interactionof different proteins in living cells. Combiningthe computerized ability to obtain proteinpattern signatures with the high throughputautomated acquisition of images described inthe previous section, provides the prospect forrapid development of comprehensive databasesthat store this information for virtually all cell-ular proteins.
PROSPECTING FOR NEW CYTODIAGNOSTICSBY IMAGING MOLECULAR LABELS
Over the last few decades, the advances incomputation speed, imaging, and high through-put analysis methods have opened up newdiagnostic opportunities in the biological andhealth sciences. For example, the search formolecular markers for cancer detection, a sub-set of molecular biomarkers, has continued toexpand [Srivastava and Gopal-Srivastava,2002; Wu et al., 2002]. Biomarkers that havebecome useful in cancer diagnostic includeprostate specific antigen (PSA), cancer antibodyor tumor marker 125 (CA125), cancer antigen15-3 (CA15-3), several cytokeratins, some cellsurface antigens (MUC1 &MUC2), and severalgrowth factors (TGF-a, TGF-b, erb-2, erb-3)[Brotherick et al., 1998; Braun et al., 1999;Zimmerman et al., 2000; Srivastava and Gopal-Srivastava, 2002]. The combination of newbiomarkers and advanced high-throughputimaging technologies for analyzing subcellularmolecular characteristics using, e.g., fluores-cence microscopy, offers tremendous potentialfor new cytodiagnostics.If one or more biomarkers for a specific
disease are found, high throughput imagingmethods may be applied to screen body fluidscontaining exfoliated cells for early cancerdetection. Automated microscopy image acqui-sition at high throughput rates for slides, cellculture chambers, or well plates has madesubstantial progress [Price, 1990; Bravo-Zano-guera et al., 1999; Bajaj et al., 2000] and higher-level image interpretation may provide power-ful automated diagnoses. The addition ofsophisticated image analysis methods will pro-vide new, completely automated imaging ave-
nues for studying, classifying, and interpretingcellular molecules. These methods may alsoaid in understanding the underlying moleculardisease mechanisms and thereby facilitatedevelopment of new anticancer therapeutics[Giuliano and Taylor, 1998; Srivastava andGopal-Srivastava, 2002; Wu et al., 2002].
High-level image interpretation has beenused in a wide range of applications [Hudsonand Cohen, 2000; Duda et al., 2001] includingmicroscope images of: cervical smears [Kempet al., 1997; Mackin et al., 1998; Van der Laaket al., 2002]; premalignant prostate, colon andesophageal tissue [Weyn et al., 2000]; andcultured cells [Boland et al., 1998; Boland andMurphy, 2001]. However, automated imageinterpretation using classical clinical stains(e.g., hematoxylin and eosin, and variations ofthe Pap stain) has only shown limited success[Bartels and Vooijs, 1999]. The combination ofusing fluorescent biomarkers and automatedhigh-level image interpretation offers an excit-ing new alternative for classification (diagno-ses) of cells and tissue. One cellular diagnosticcategory enabled by high throughput cellularclassification is detection of rare and ultra-rarecells in blood and other large cell populations.Classification of cellular objects in images oftissue stained with specific fluorescent labels isperformed as shown in Figure 6. In this simpleexample, all the objects (including debris)encountered in HTM images of large popula-tions of fixed cells are first grouped into singlecells, cell clumps, cell doublets, debris, blurredobjects, hyperploid cells, and mitotic cells. Thishighlights the fact that in fully automatedimaging, the system must first identify generalclasses of cells in order to then carry out, e.g.,cancer versus normal classification. This isbecause amitotic cancer cell may differ somuchfrom a normal G0/G1 cell that it could not beclassified. That is, it may be necessary to findmitotic and G0/G1 cells and then classifynormal and cancer mitotic cells and normaland cancer G0/G1 cells. From the images, theobjects are extracted using image segmentationtechniques [Duda and Hart, 1973; Price et al.,1996; Jaehne, 1997] and different measure-ments, referred to as features, are performed onthese objects. The features with the highestdiscriminating power are selected and com-bined in the feature set (too large of a number offeatures makes the classifier too complex andrequires a large amount of training data, a too
Functional Cellular Imaging Tools 201

small number of featuresmightnot separate theclasses with the desired accuracy). An exampleof one pair of features (mean intensity andradius minimum) in the set used for the sevenclasses is shown on the upper right panel ofFigure 6. A classifier (e.g., a linear discriminantfunction, a neural network, a probability-basedBayesian classifier, a nearest neighbor classi-fier, or clustering techniques [Hudson andCohen, 2000; Duda et al., 2001]) processes thefeatures and finds classes of grouped featuresthat characterize types of cells. In most casesthe classifier requires a training set to deter-mine its parameters. The performance of thedeveloped classifier on naıve test data is re-ported as confusion matrix, shown at the lowerright of Figure 6, where the diagonal representsthe correctly classified number of cells. Such aconfusion matrix also allows analysis of simila-rities of classes, e.g., for this case the ‘mitotic
cells’ had a very large confusion ratio with‘doublets,’ about 40%. This suggests similarityin odd shapes occurring both in ‘doublets’ and in‘mitotic cells.’
The resulting performances of the automatedhigh-level image interpreters can vary widely(anywhere between 60 and 100%) depending onhow similar the object classes are, how discri-minating the molecular biomarker(s) used forimaging is (are), and whether the differences inthe imaged objects are simple on-off decisions,like for rare event detection of fetal nucleatedred blood cells in maternal peripheral blood[Bianchi, 1999; Bajaj et al., 2000; Bianchi et al.,2002; Yamanishi et al., 2002], images of whichare shown in Figure 7 (left), or fine differences,e.g., in texture of the molecular marker thatcan classify cells with malignancy associatedchanges [Kemp et al., 1997]. An example of abreast cancer specificmarker, anti-cytokeratin-
Fig. 6. Examples of automated cell classification using themolecular DNA probe DAPI. In this case classification wasperformed to distinguish the different cell objects encounteredduring cell-by-cell analysis of slides using HTM. The left panelshows the seven different object classes, the right top panel
shows a scatter plot of two of the features selected for the featureset, and the right bottom panel gives the results of a linear dis-criminant function classifier for previously unseen cell objects.[From Heynen, 2002.]
202 Price et al.

19 is shown in Figure 7 (right). In these andother applications, molecular imaging has thepotential to alter cytodiagnostics, especiallywhen combined with powerful new machineintelligence algorithms for interpreting imagesof millions of cells acquired with high-through-put microscopy.
PROSPECTING FOR MARKERS BYIMAGING TISSUE MICROARRAYS
Molecular microarrays, including DNA, RNAand protein arrays, have become importanttools for finding disease characteristics andmapping normal expression by testing patternsfrom thousands of molecules on one or a fewhomogenized tissues. Tissue microarray (TMA)analysis is a complementary method that cantest the resulting hundred or somolecular arrayhits on many intact tissue sections on a singleslide. Hundreds to thousands of cylindricalcores (of 0.6–1.5 mm diameter and up to2.5 mm long) are biopsied from tissue blocks,and arrayed in a single new paraffin block[Kononen et al., 1998; Skacel et al., 2002]. Thenew block is sectioned and placed on slides, andthe molecular patterns are analyzed directly inthe tissues to confirm that they are unique to aparticular type of tissue [Kononen et al., 1998].Validation of normal versus cancer expressionor one type of normal tissue against another is akey advantage of TMAs over molecular arrays.The presence of many tissue samples on oneslide dramatically increases the processing andanalysis rates. Many patients with, e.g., breastcancer, can be studied for protein expressionpatterns simultaneously after identical pre-paration. A single tissue microarray block canbe analyzed for genotype or expression by DNAand RNA in situ hybridization (ISH, or fluores-cence, FISH), and by immunohistochemistry
(IHC) or immunofluorescence (IF) [Skacel et al.,2002].
In the program on Apoptosis and Cell DeathRegulation at the Burnham Institute, research-ers can immunostain up to 240 TMA slides/week, but it takes one pathologist 2–3 h to readeach slide, making the analysis about 10-foldmore time consuming than thepreparation (andpreparation automation efforts continue, seee.g., Beecher Instruments, www.beecherinstru-ments.com). Although several semi-automatedTMAreaders are commercially available [exam-ples include: Chromavision, Inc., (www.chro-mavision.com), Biogenix (www.biogenex.com),and Aperio (www.aperio.com)], fully auto-mating the process of scoring the TMAs ischallenging because it means both machineidentification of normal versus cancer tissue (ordifferent types of normal tissue) and densito-metry of expression markers in clinicallystained samples. Using HTM developed atUCSD, TMA slides can be scanned and theimages collated and montaged for scoring andstoring in databases as shown in Figure 8.Although some researchers are exploring theuse of fluorescencemarkers [Camp et al., 2000],pathologists often prefer to diagnose the cancertissue using clinical stains [Krajewski et al.,1994, 1999; Krajewska et al., 2002]. Thus,whereas measuring the intensities of a fewfluorescence signals with wavelengths is rela-tively trivial, separating overlapping broad-spectrum wavelengths of, e.g., hematoxylinand the immunohistochemical stain diamino-benzidine (DAB), is more challenging. Multi-spectral techniques are being explored andhaveshown great promise for determining the con-tribution of each dye to the color and density ofeach pixel [Gat, 2000; Levenson andHoyt, 2000;Macville et al., 2001; Ruifrok and Johnston,2001]. We have also begun exploring texture
Fig. 7. Left: Fetal nucleated RBCs stained withcentromeric FISH probes for the X- and Y-chromo-somes, DAPI for the nuclei and anti-g-globin-FITCfor fetal hemoglobin. Right: FITC-DAPI cell imageobtained showingcytokeratin-19-positivecells (green)with DAPI-stained cell nuclei (blue).
Functional Cellular Imaging Tools 203

segmentation techniques that may successfullyseparate normal and cancer tissue. As anexample, Figure 9 shows a texture-based tech-nique largely successfully delineating normalglandular and stromal tissue.
Combining automated TMA preparationwith fully automated analysis holds promisefor very rapid prospecting ofmolecular patternsof cancer. Database software for storing andretrieving TMA images and data will provideefficient access to the large sets of data gener-ated by automated processes [Manley et al.,2001]. For rapid understanding of the relation-ship of this molecular information to diseaseand treatment, the patient treatment and out-come data must also be available to clinicalresearchers. Amulti-hospital tissue and clinicalrecords database that can serve as a model forcompleting the picture is under construction inAustralia (Personal communication, NikolajsZeps, Western Australia Institute for MedicalResearch, and www.nbcf.org.au/prioritie-sperth.shtml#d). Ultimately, worldwide clinicaldatabases that facilitate tracking of treatmentand outcome data as a function of molecular
markers would create an unparalleled oppor-tunity for cancer diagnostic and therapeuticdiscoveries.
PROSPECTING FOR DRUGS BY IMAGINGSUBCELLULAR MOLECULAR ACTIVITY
Biological drug discovery is struggling tointegrate the flood of new information emergingfrom the genomics and proteomics revolutions.While many high throughput tools provide listsof genes and proteins in cells, pharmaceuticalresearchers are increasingly asking for a com-prehensive tool set for rapidly acquiring andintegrating cell-molecular, cell-structural, andcell-functional data linked directly to compoundresponses [Giuliano et al., 1997]. Although thesimplest living cell is probably too complex forexactmodelingby themost powerful computers,even relatively simple models may shake thefoundations of biology [Gibbs, 2001]. A typicalhigh throughput screening (HTS) instrumentprocesses thousands to tens of thousands ofcompounds a day by rapidlymeasuring the bulkresponse of all of the cells in each well in a
Fig. 8. A rectangular area was automatically scanned at 20� by HTM (with several images/core) and theimages were processed to produce a downsampled montage image (upper left). The individual cores wereautomatically located in the downsampled montage and used to guide computerized reassembly of high-resolution montages of each core (right). The native high-resolution views were then available by selectingregions for zooming (lower left).
204 Price et al.

microtiter plate. The amount of a cellularproduct, such as cytokine interleukin 2 (IL2),can be assayed in thismanner as an end-point toinhibition or excitation by a library of com-pounds. A given compound may result in, e.g.,the secretion of IL-2, but the researcher does notknow which signaling pathway was utilized, orif there were other cellular responses. If thesignaling pathway used also led to cell toxicityor death, the efficacy of the candidate drugwould be compromised and the informationmight not be learned until failure inmore costlyand controversial animal testing. Multiplexedcellular responses need to be investigated todecrease these kinds of false positive leads indrug discovery. Dissecting the steps in cellularpathways is important because multiple path-ways converge and diverge to provide redun-dancy and for coordinated cellular behavioralresponses.A number of commercially available instru-
ments (including those from Cellomics, Univer-sal Imaging, Axon, Q3DM, and Amersham) areaddressing the need for automated microtiterplate instruments that automatically providecell measurements from images. Nuclear-cyto-
plasmic translocation is a commonly addressedcellular dynamic whereby a labeled proteinmoves between the cytoplasm and the nucleusupon stimulation [Auphan et al., 1995; Vermaet al., 1995; Ding et al., 1998; Mercie et al.,2000]. In Figure 10, some results of a nuclear-cytoplasmic translocation experiment involvingstimulation of the GR receptor by dexametho-sone are shown. The software in Figure 10 isalso an example of the integrated image acqui-sition, processing, and analysis that providesfor walk-away automation of these kinds ofmeasurements over large numbers of cells,wells, and microtiter plates. Automation ofcell-by-cell measurements for routine usein every assay has been very challenging.Advances in image segmentation (see Fig. 4)have led to instrumentation where cell-by-cellmeasurements are the basis of all imagecytometry assays. Another type of translocationwhere image segmentation enabling cell-by-cellmeasurements is even more challenging is theformation of pits (or vesicles) as shown inFigure 11. In this example, the pits are verysmall and the measurement precision is muchbetter using higher resolution (0.95 NA) optics.The corresponding dose response curve is forstimulation of pit formation by isoproterenol.
Automation and speed are important butmust be accompanied by measurement fidelityfor efficient analyses. Figure 12 shows that thenumber of cells required for a given statisticalsignificance increases exponentially for a givenSD as statistical significance requirements be-come more stringent. This family of curvesdemonstrates that it may be much less costly ifhigh precision measurements can be madebecause lower SDs achieve the same minimumsignificant responsewithmuch fewer cells. Thisdependence on the fidelity of image mea-surements may also be true in the examples ofhigh-level cell classification in the previoussections. The impact of the measurement pre-cision is easy to overlook but may have sub-stantial contributions to the usefulness of theconclusions.
The examples of translocation in Figures 10and 11 included stains for both the protein ofinterest and the DNA. In preliminary NFkBtranslocation experiments performed undersimilar conditions as previously published [Dinget al., 1998], the SD of FLIN was found to besmaller for G0/G1 cells. In transient transloca-tion experiments, only a few cells may be
Fig. 9. The original image containing both stroma andglandular regions was broken in two independent regions basedon texture elements.
Functional Cellular Imaging Tools 205

expressing the desired tag as verified by a co-transfected label. Analyzing only the trans-fected cells, which can represent as little as afew percent of the total cells, is very important
for measuring the dose responses. Cell hetero-geneity increases dose response complexity.Even in cloned cell lines, cell cycle position andphenotypic variations create differences in cell
Fig. 10. CytoshopTM software by Q3DM, Inc., shows thecytometrics list (left), an image table with a pan-and-scroll viewof the entire scan area (background, largewindow) and a series ofimages with corresponding histograms of the fluorescentlocalized intensity of the nucleus (FLIN¼ nuclear intensity/
cellularþnuclear intensity). Cells were labeled with GFP for theglucocorticoid receptor (GR) and stimulated with increasingconcentrations of dexamethosone, which stimulates GR causingit to translocate into the nucleus. [Labeled cells courtesy ofGordon Hager, National Institutes of Health.]
Fig. 11. Pit formation in human osteosarcoma cells. Example40x 0.95 NA fluorescent micrographs of the Norak TransfluorTM
GPCR pit formation assay using the Q3DM EIDAQTM 100 HTMinstrument. GFP expression (green) and Hoechst staining (blue)are visualized before (left) and after (middle) pit formation. The
dose response curve (right) shows measured normalized pitformation in U20S cells expressing the beta-2-adrenergicreceptor and beta arrestin 2 fused to GFP as a function ofisoproterenol concentration. The EC50¼1.48 nM (�0.11). (Cellscourtesy of Norak Biosciences, Morrisville, NC).
206 Price et al.

behavior. A lead that acts on a cellular processcorrelated to DNA synthesis will elicit a max-imal change in response in S-phase cells.Averaging the response from all the cells in awell may require laborious cell cycle synchroni-zation or result in overlooking an effective drug.Image analyses ofmultiplexedDNAandproteinstimulus-response labels correlates the com-pound response to the cell cycle phase therebyproviding direct elucidation of more complexcompound responses. These are relatively sim-ple examples of the use of multiple markers. Asexperiments using high throughput cell-by-cellimaging become more common, the demand forautomated analyses of multiplexed intracellu-lar probes for direct measurements of morecomplex cellular responses is only likely toincrease. The prospects for improved livingcell labels of protein activity (summarizedin the first section) are likely to continue todrive the need for multiplexed probes andmeasurements.
CONCLUSIONS AND PROSPECTS FORRICH INFORMATION FROM CELLULAR
MOLECULAR IMAGING
The tremendous prospects for molecularimaging are best recognized in the context ofadvances in both computing and biology. Engi-neers and computer scientists (and perhapssocieties as a whole) have adapted to theexpectation of speed and storage continuing to
advance at least at the Moore’s law rate of twofold every 18 months. Scientists have experi-enced some of the potential benefits for bio-logical research through the relatively rapidadvances in gene sequencing over the last 10–15 years that were enabled by high throughputtechnologies. The quest to understand cellularmolecular biochemistry frommolecular activityto cellular behaviorswill be similarly enabledbyhigh throughput technologies. But the informa-tion explosion represented in the detailedmolecular structure and function of hundredsof thousands of different proteins in each cellalong with detailing signaling pathways willrequire more than just a list. Computer models(see, e.g., Physiome Sciences, www.physiome.-com) and high-level machine intelligence willalso rapidly collate this information. Andalthough these computer models may neverlead to a perfect understanding of the cell[Gibbs, 2001], the prospects are intriguing.
ACKNOWLEDGMENTS
Funding for the work reported here included:National Science Foundation Major ResearchInstrumentation grant BES-9871365, theWhitaker Foundation Biomedical EngineeringResearchGrantProgram,National Institutes ofHealth grants R44 RR15170 and R33 CA83219,and the WPC Research and Education Fund.
REFERENCES
Adams SR, Harootunian AT, Buechler YJ, Taylor SS, TsienRY. 1991. Fluorescence ratio imaging of cyclic AMP insingle cells. Nature 349:694–697.
Auphan N, DiDonato JA, Rosette C, Helmberg A, Karin M.1995. Immunosuppression by gluco-corticoids: Inhibitionof NF-kB activity through induction of IkB synthesis.Science 270:286–290.
Baird GS, Zacharias DA, Tsien RY. 1999. Circular per-mutation and receptor insertion within green fluorescentproteins. Proc Natl Acad Sci USA 96:11241–11246.
Bajaj S, Welsh JB, Leif RC, Price JH. 2000. Ultra-rare-event detection performance of a custom scanning cyto-meter on a model preparation of fetal nRBCs. Cytometry39:285–294.
Bartels PH, Vooijs PG. 1999. Automation of primaryscreening for cervical cancer—Sooner or later? ActaCytologica 43:7–12.
Bianchi DW. 1999. Fetal cells in the maternal circulation:Feasibility for prenatal diagnosis. Br J Haematol 105:574–583.
Bianchi DW, Simpson JL, Jackson LG, Elias S, HolzgreveW, Evans MI, Dukes KA, Sullivan LM, Klinger KW,Bischoff FZ, Hahn S, Johnson KL, Lewis D, Wapner RJ,de la Cruz F. 2002. Fetal gender and aneuploidy
Fig. 12. The number of cells (and hence the time) required as afunction of minimum significant response. The family of curvesare for a range of underlying cell-by-cell standard deviations.a¼ 0.05 Pr(identical samples show response, type I error);b¼ 0.20 Pr(different samples show no response, type II error).
Functional Cellular Imaging Tools 207

detection using fetal cells in maternal blood: Analysis ofNIFTY I data. Prenat Diagn 22:609–615.
Boland MV, Murphy RF. 1999. Automated analysis ofpatterns in fluorescence-microscope images. Trends CellBiol 9:201–202.
Boland MV, Murphy RF. 2001. A neural network classifiercapable of recognizing the patterns of all major sub-cellular structures in fluorescence microscope images ofHeLa cells. Bioinformatics 17:1213–1223.
Boland MV, Markey MK, Murphy RF. 1997. Classificationof protien localization patterns obtained via fluorescencelight microscopy. Proceedings of the 19th Annual Inter-national Conference of the IEEE Engineering in Medi-cine and Biology Society. p 594–597.
Boland MV, Markey MK, Murphy RF. 1998. Automatedrecognition of patterns characteristic of subcellularstructures in fluorescence microscopy images. Cytometry33:366–375.
Braun S, Hepp F, Sommer HL, Pantel K. 1999. Tumor-antigen heterogeneity of disseminated breast cancercells: Implications for immunotherapy of minimal resi-dual disease. Int J Cancer 84:1–5.
Bravo-Zanoguera ME. 2001. Autofocus for high speedscanning in image cytometry. Dissertation, Universityof California San Diego.
Bravo-Zanoguera ME, Price JH. 1998. Simultaneousmultiplanar image acquisition in light microscopy. SPIEProc Optical Diagnostics of Biological Fluids andAdvanced Techniques Analytical Cytology 3260:194–200.
Bravo-Zanoguera ME, von Massenbach B, Kellner AL,Price JH. 1998. High performance autofocus circuit forbiological microscopy. Review of Scientific Instruments69(11):3966–3977.
Bravo-Zanoguera ME, von Massenbach B, Price JH. 1999.Automatic on-the-fly focusing for continuous imageacquisition in high-resolution microscopy. SPIE ProcOptical Diagnostics of Biological Fluids and AdvancedTechniques Analytical Cytology 3604:243–252.
Brotherick I, Robson CN, Browell DA, Shenfine J, WhiteMD, Cunliffe WJ, Shenton BK, Egan M, Webb LA, LuntLG, Young JR, Higgs MJ. 1998. Cytokeratin expressionin breast cancer: Phenotypic changes associated withdisease progression. Cytometry 32:301–308.
Camp RL, Lori CA, Rimm DL. 2000. Validation of tissuemicroarray technology in breast carcinoma. Lab Invest80:1943–1952.
Chalfie M, Tu Y, Euskirchen G, Ward WW, Prasher DC.1994. Green fluorescent protein as a marker for geneexpression. Science 263:802–805.
Chamberlain C, Hahn KM. 2000. Watching proteins in thewild: Fluorescence methods to study protein dynamics inliving cells. Traffic 1:755–762.
Danckaert A, Gonzalez-Couto E, Bollondi L, Thompson N,Hayes B. 2002. Automated recognition of intracellularorganelles in confocal microscope images. Traffic 3:66–73.
Del Pozo MA, Kiosses WB, Alderson NB, Meller N, HahnKM, Schwartz MA. 2002. Integrins regulate GTP-Raclocalized effector interactions through dissociation ofRho-GDI. Nature Cell Biol 4:232–239.
Ding G, Fischer P, Boltz R, Schmidt J, Colaianne J, GoughA, Rubin R, Uiller D. 1998. Characterization andquantitation of NFkB nuclear translocation induced by
interleukin-1 and tumor necrosis factor-a. J Biol Chem273:28897–28905.
Duda RO, Hart PE. 1973. Pattern classification and sceneanalysis. New York: John Wiley & Sons.
Duda RO, Hart PE, Stork DG. 2001. Pattern classification.2nd Edition. New York: John Wiley & Sons.
Fu KS, Mui JK. 1981. A survey on image segmentation.Pattern Recognit 13:3–16.
Gat N. 2000. Imaging spectroscopy using tunable filters: Areview. SPIE Proc 4056:50–64.
Geusebroek J-M, Cornelissen F, Smeulders AWM, GeertsH. 2000. Robust autofocusing in microscopy. Cytometry39:1–9.
Gibbs WW. 2001. Cybernetic cells. Sci Am 265:53.Giuliano KA, Taylor DL. 1998. Fluorescent-protein biosen-sors: New tools for drug discovery. Trends Biotechnol16:135–140.
Giuliano KA, DeBiasio RL, Dunlay RT, Gough A, VoloskyJM, Zock J, Pavlakis GN, Taylor DL. 1997. High-contentscreening: A new approach to easing key bottlenecks inthe drug discovery process. J Biomol Screen 2:249–258.
Groen FCA, Young IT, Ligthart G. 1985. A comparison ofdifferent focus functions for use in autofocus algorithms.Cytometry 6:81–91.
Hahn KM, Toutchkine A. 2002. Live-cell fluorescentbiosensors for activated signaling proteins. Curr OpinionCell Biol 14:167–172.
Hahn KM, DeBasio R, Taylor DL. 1992. Patterns ofelevated free calcium and calmodulin activation in livingcells. Nature 359:736–738.
Haj FG, Verveer PJ, Squire A, Neel BG, Bastiaens PI. 2002.Imaging sites of receptor dephosphorylation by PTP1B onthe surface of the endoplasmic reticulum. Science 295:1708–1711.
Heim R, Tsien RY. 1996. Engineering green fluorescentprotein for improved brightness, longer wavelengths, andfluorescence resonance energy transfer. Curr Biol 6:178–182.
Heynen S. 2002. Fluorescent feature fidelity and explora-tion of automated cell-by-cell classification in modelpopulations for high-throughput image cytometry. Dis-sertation, University of California, San Diego.
Heynen S, Gough DA, Price JH. 1997. Optically stabilizedmercury vapor short arc lamp as UV-light source formicroscopy. SPIE Proc Optical Diagnostics of BiologicalFluids and Advanced Techniques Analytical Cytology2982:430–434.
Hiroaki K. 2002. Systems Biology: A brief overview. Science295(5560):1662–1664.
Honda A, Adams SR, Sawyer CL, Lev-Ram V, Tsien RY,Dostmann WR. 2000. Spatiotemporal dynamics ofguanosine 30, 50-cyclic monophosphate revealed by agenetically encoded, fluorescent indicator. PNAS 98:2437–2442.
Huang K, Lin J, Gajnak JA, Murphy RF. 2002. Imagecontent-based retrieval and automated interpretation offluorescence microscope images via the protein subcel-lular location image database. Proceedings of the 2002IEEE International Symposium on Biomedical Imaging(ISBI-2002). p 325–328.
Hudson DL, Cohen ME. 2000. Neural networksand artificial intelligence for biomedical engineering.New York: Institute of Electrical and ElectronicsEngineers.
208 Price et al.

Jaehne B. 1997. Digital image processing: Concepts,algorithms, and scientific applications. Berlin, NewYork:Springer.
Jarvik JW, Adler SA, Telmer CA, Subramaniam V, LopezAJ. 1996. CD-Tagging: A new approach to gene andprotein discovery and analysis. Biotechniques 20:896–904.
Jarvik JW, Fisher GW, Shi C, Hennen L, Hauser C, AdlerS, Berget PB. 2002. In vivo functional proteomics:Mammalian genome annotation using CD-tagging. Bio-Techniques 33:852–867.
Katsumi A, Milanini J, Kiosses WB, del Pozo MA, KaunasR, Chien S, Hahn KM, Schwartz MA. 2002. Effects of celltension on the small GTPase Rac. J Cell Biol 158:153–164.
KempRA,MacAulay C, Garner D, Palcic B. 1997. Detectionof malignancy associated changes in cervical cell nucleiusing feed-forward neural networks. Anal Cell Pathol14:31–40.
Kononen J, Bubendorf L, Kallioniemi A, Barlund M,Schraml P, Leighton S, Torhorst J, Mihatsch MJ, SauterG, Kallioniemi OP. 1998. Tissue microarrays for high-throughput molecular profiling of tumor specimens. NatMed 4:844–847.
KrajewskaM, Zapata JM,Meinhold-Heerlein I, HedayatH,Monks A, Bettendorf H, Shabaik A, Bubendorf L,Kallioniemi O-P, Kim H, Reifenberger G, Reed JC,Krajewski S. 2002. Expression of Bcl-2 family memberBid in normal and malignant tissues. Neoplasia 4:129–140.
Krajewski S, Krajewska M, Shabaik A, Miyashita T, WangHG, Reed JC. 1994. Immunohistochemical determinationof in vivo distribution of Bax, a dominant inhibitor of Bcl-2. Am J Pathol 145:1323–1336.
Krajewski S, Krajewska M, Ellerby LM, Welsh K, Xie Z,Deveraux QL, Salvesen GS, Bredesen DE, Rosenthal RE,Fiskum G, Reed JC. 1999. Release of caspase-9 frommitochondria during neuronal apoptosis and cerebralischemia. Proc Natl Acad Sci USA 96:5752–5757.
Kraynov VS, Chamberlain C, Bokoch GM, Schwartz MA,Slabaugh S, Hahn KM. 2001. Localized Rac activationdynamics visualized in living cells. Science 290:333–337.
Levenson RM, Hoyt CC. 2000. Spectral imaging andmicroscopy. Am Laboratory 32:26–33.
Llopis J,Westin S, RicoteM,Wang Z, Cho CY, KurokawaR,Mullen TM, Rose DW, Rosenfeld MG, Tsien RY, GlassCK, Wang J. 1999. Ligand-dependent interactions ofcoactivators steroid receptor coactivator-1 and peroxi-some proliferator-activated receptor binding protein withnuclear hormone receptors can be imaged in live cells andare required for transcription. PNAS 97:4363–4368.
Mackin RW, Jr. Newton LM, Turner JN, Holmes TJ,Roysam B. 1998. Accuracy of nuclear classification incervical smear images. Anal Quant Cytol Histol 20:77–91.
Macville MVE, Speel EJM, van der Laak JAWM, de WildePCM, Hanselaar AGJM, Soenksen D, McNamara G,Hopman AHN, Ried T. 2001. Spectral imaging of multi-color chromogenic dyes in pathological specimens. AnalCell Pathol 22:133–142.
Manley S, Mucci NR, De Marzo AM, Rubin MA. 2001.Relational database structure to manage high-densitytissue microarray data and images for pathology studiesfocusing on clinical outcome. Am J Path 159:837–843.
Mercie P, Belloc F, Bihlou-Nabera C, Barthe C, Pruvost A,Renard M, Seigneur M, Bernard P, Marit G, BoisseauMR. 2000. Comparative methodologic study of NFkBactivation in cultured endothelial cells. J Lab Clin Med136:402–411.
Misteli T, Spector DL. 1997. Application of the greenfluorescent protein in cell biology and biotechnology. NatBiotechnol 15:961–964.
Miyawaki A, Llopis J, Heim R, McCaffery JM, Adams JA,Ikura M, Tsien RY. 1997. Fluorescent indicators for Ca2þ
based on green fluorescent proteins and calmodulin.Nature 388:882–887.
Murphy RF, Boland MV, Velliste M. 2000. Towards asystematics for protein subcellular location: Quantitativedescription of protein localization patterns and auto-mated analysis of fluorescence microscope images.Proceedings of the Eighth International Conference onIntelligent Systems for Molecular Biology 8:251–259.
Murphy RF, Velliste M, Porreca G. 2002. Robust classifica-tion of subcellular location patterns in fluorescencemicroscope images. Proceedings of the 2002 IEEEInternational Workshop on Neural Networks for SignalProcessing (NNSP 12). p 67–76.
Nalbant P, Kraynov V, Touchkine A, Hahn KM. 2001.Fluorescent biosensors report activation of endogenousunlabelled Cdc42 in living cells. ASCB conference(abstract).
Nguyen LK, Bravo-Zanoguera ME, Kellner AL, Price JH.2000. Magnification corrected optical image splittingmodule for simultaneous multiplanar acquisition. SPIEProc Optical Diagnostics of Living Cells III 3921:31–40.
Oliva M, Bravo-Zanoguera ME, Price JH. 1999. Filteringout contrast reversals for microscopy autofocus. AppliedOptics, Optical Tech & Biomed Optics 38(4):638–646.
Pal N, Pal S. 1993. A review of image segmentationtechniques. Pattern Recognit 26(9):1277–1294.
Price JH. 1990. Scanning cytometry for cell monolayers.Dissertation, University of California, San Diego.
Price JH, Gough DA. 1994. Comparison of digital autofocusfunctions for phase-contrast and fluorescence scanningmicroscopy. Cytometry 16(4):283–297.
Price JH, Hunter EA, Gough DA. 1996. Accuracy of leastsquares designed spatial FIR filters for segmentation ofimages of fluorescence stained cell nuclei. Cytometry25(4):303–316.
Roques EJS, Murphy RF. 2002. Objective evaluation ofdifferences in protein subcellular distribution. Traffic 3:61–65.
Ruifrok AC, Johnston DA. 2001. Quantification of histo-chemical staining by color deconvolution. Anal QuantCytol Histol 23:291–299.
Saeed N. 1998. Magnetic resonance image segmentationusing pattern recognition, and applied to image registra-tion and quantitation. NMR Biomed 11:157–167.
Skacel MS, Skilton B, Pettay JD, Tubbs RR. 2002. Tissuemicroarrays: A powerful tool for high-throughput analy-sis of clinical specimens. Appl ImmunohistochemMoleculMorphol 10:1–6.
Srivastava S, Gopal-Srivastava R. 2002. Biomarkers incancer screening: A public health perspective. J Nutr 132( Suppl):2471S–2475S.
Taylor DL, Wang YL. 1980. Fluorescently labeled mole-cules as probes of the structure and function of livingcells. Nature 284:405–410.
Functional Cellular Imaging Tools 209

Telmer CA, Berget PB, Ballou B, Murphy RF, Jarvik JW.2002. Epitope tagging genomic DNA using a CD-taggingTn10 minitransposon. Biotechniques 32:422–430.
Ting AY, KainKH, Klemke RL, Tsien RY. 2001. Geneticallyencoded fluorescent reporters of protein tyrosine kinaseactivities in living cells. PNAS 98:15003–15008.
Touchkine A, Kraynov V, Hahn KM. 2003. Solvatochromicdye to report protein conformational changes in livingcells. J Am Chem Soc (in press).
Van der Laak JAWM, Siebers AG, Cuijpers VMJI,Pahlplatz MMM, de Wilde PCM, Hanselaar AGJM.2002. Automated identification of diploid reference cellsin cervical smears using image analysis. Cytometry 47:256–264.
Velliste M, Murphy RF. 2002. Automated determination ofprotein subcellular locations from 3D fluorescence micro-scope images. Proceedings of the 2002 IEEE Interna-tional Symposium on Biomedical Imaging (ISBI-2002)p 867–870.
Verma IM, Stevenson JK, Schwarz EM, Van Antwerp D,Miyamoto S. 1995. Rel/NF-kB/IkB family: Intimate talesof association and dissociation. Genes Dev 9:2723–2735.
Weyn B, Jacob W, da Silva VD, Montironi R, Hamilton W,Thompson D, Bartels HG, van Daele A, Dillon K, BartelsPH. 2000. Data representation and reduction for chro-matin texture in nuclei from premalignant prostatic,esophageal, and colonic lesions. Cytometry 41:133–138.
Wu W, Hu W, Kavanagh JJ. 2002. Proteomics in cancerresearch. Int J Gynecol Cancer 12:409–423.
Yamanishi DY, Junquan X, Hujsak PG, Yang Z, Wang X,Wu L. 2002. Enrichment of rare fetal cells from maternalperipheral blood. Expert Rev Mol Diagn 2:303–311.
Yarmush ML, Jayaraman A. 2002. Advances in proteomictechnologies. Annu Rev Biomed Eng 4:349–373.
Zimmerman RL, Fogt F, Goonewardene S. 2000. Diagnosticvalue of a second generation CA15-3 antibody to detectadenocarcinoma in body cavity effusions. Cancer Cyto-pathology 90:230–234.
210 Price et al.