Embed Size (px)
Citation preview
ORIGINAL PAPER
Advances in remote sensing applications for urban sustainability
Nada Kadhim1,2• Monjur Mourshed1 • Michaela Bray1
Received: 5 July 2016 / Accepted: 23 September 2016 / Published online: 18 October 2016
� The Author(s) 2016. This article is published with open access at Springerlink.com
Abstract It is essential to monitor urban evolution at
spatial and temporal scales to improve our understanding
of the changes in cities and their impact on natural
resources and environmental systems. Various aspects of
remote sensing are routinely used to detect and map fea-
tures and changes on land and sea surfaces, and in the
atmosphere that affect urban sustainability. We provide a
critical and comprehensive review of the characteristics of
remote sensing systems, and in particular the trade-offs
between various system parameters, as well as their use in
two key research areas: (a) issues resulting from the
expansion of urban environments, and (b) sustainable
urban development. The analysis identifies three key trends
in the existing literature: (a) the integration of heteroge-
neous remote sensing data, primarily for investigating or
modelling urban environments as a complex system, (b) the
development of new algorithms for effective extraction of
urban features, and (c) the improvement in the accuracy of
traditional spectral-based classification algorithms for
addressing the spectral heterogeneity within urban areas.
Growing interests in renewable energy have also resulted
in the increased use of remote sensing—for planning,
operation, and maintenance of energy infrastructures, in
particular the ones with spatial variability, such as solar,
wind, and geothermal energy. The proliferation of sus-
tainability thinking in all facets of urban development and
management also acts as a catalyst for the increased use of,
and advances in, remote sensing for urban applications.
Keywords Remote sensing systems � Remote sensing
applications � Environmental sustainability � Urbanenvironments � Sustainable cities
Introduction
Cities are engines of economic prosperity and social
development that arise from the concentration of people
and economic activities but often manifests in unsustain-
able urban environments [57]. Economic opportunities in
cities act as a catalyst for rapid urbanisation across the
globe. Urbanisation rates are uneven and are much faster in
developing countries [7]. By 2030, the annual average rate
of urban growth is expected to be 0.04 % in Europe, 1.5 %
in the USA, 2.2 % in East Asia and the Pacific, 2.7 % in
South Asia, 2.3 % in the Middle East and North Africa, and
3.6 % in Sub-Saharan Africa [80]. Increased urban
migration has contributed to the unplanned or poorly
planned and implemented growth and expansion of cities.
The latter is a critical factor for urban stakeholders as
unplanned urban growth can have a long-term negative
impact on urban sustainability on a range of scales—local,
regional, national, and potentially inter-governmental [75].
Impacts include detrimental economic consequences such
as the reduction in the productivity of key economic sectors
[18]; environmental degradation such as poor air quality,
and increased urban temperatures and surface run-off
& Nada Kadhim
Monjur Mourshed
Michaela Bray
1 Cardiff School of Engineering, Cardiff University,
Cardiff CF24 3AA, UK
2 Department of Civil Engineering, University of Diyala,
Diyala, Iraq
123
Euro-Mediterr J Environ Integr (2016) 1:7
DOI 10.1007/s41207-016-0007-4
[53, 85, 87]; and negative societal impacts such as
increased morbidity and mortality, negative impacts on
quality of life, and the fragmentation of neighbourhoods
and related communities [29].
The effective management of the risks arising from the
reformation of urban landscapes and related environmental
systems requires evidence-based approaches for mitigating
and adapting to the undesirable changes. Gathering evi-
dence of urban change is typically a time and resource
intensive process that needs the application of appropriate
technologies to identify arising risks. Recent advances in
satellite remote sensing offer opportunities to cost-effec-
tively monitor urban change and its impact on the complex
urban socio-technical systems and enable stakeholders to
make informed decisions to reduce negative impacts on the
environment. Remotely sensed data are an important and
powerful source of information on urban morphology and
changes over time [64]. In contrast, conventional obser-
vation techniques are often logistically constrained in that
they require a great deal of effort, cost, and time to obtain
information over a large spatial expanse in a consistent
manner [52]. The lower cost and availability of data have
facilitated the way researchers accomplish research
objectives, and have fostered public engagement with
remote sensing science.
There is a growing body of literature on the application
of urban remote sensing—from the investigation on land-
cover and land-use changes to the monitoring of micro-
climatic parameters and the assessment of renewable
energy potential. Increased vulnerabilities from the impacts
of climate change and disaster risks, and urban growth
resulting from rapid urbanisation have influenced recent
developments on integrated risk modelling that combine
remote sense analysis with social and economic data for
urban sustainability assessment [57]. Collaboration
between expert stakeholders is essential to realise the full
potential offered by remote sensing for urban sustainability
[64]. Yet, there is a lack of understanding among urban
professionals of the technical characteristics of remotely
sensed data and their suitability for analysis, limitations,
and potential for application. We aim to address the gaps in
understanding by critically reviewing the technical char-
acteristics of available remote sense sources and their
applications for urban sustainability. The findings will act
as a comprehensive resource on the state-of-the-art, and
provide directions for future research.
Following the introduction, the paper is divided into
three sections. First, existing remote sensing systems and
available satellite data resources are reviewed and cate-
gorised to provide the context for subsequent discussions.
The information will also act as an indispensable resource
for urban professionals in identifying appropriate remote
sensing data for specific applications. Second, a state-of-
the-art review is presented on the applications of remote
sensing in urban sustainability. Third, the limitations of the
reviewed applications are highlighted with a discussion on
future directions for research and development.
Remote sensing systems and satellite dataresources
Three distinct stages of the development of remote sensing
(RS) instruments are illustrated in Fig. 1. The first generation
RS instruments were of low spatial resolution, 1 km–100 m,
increasing to 30–10 m in the second generation. The third
generation instruments are more capable in observing the
Earth’s surface with a very high spatial resolution, 5–0.5 m
and less, enabling the acquisition of further spatial details—
resulting in more accurate feature recognition. To enable the
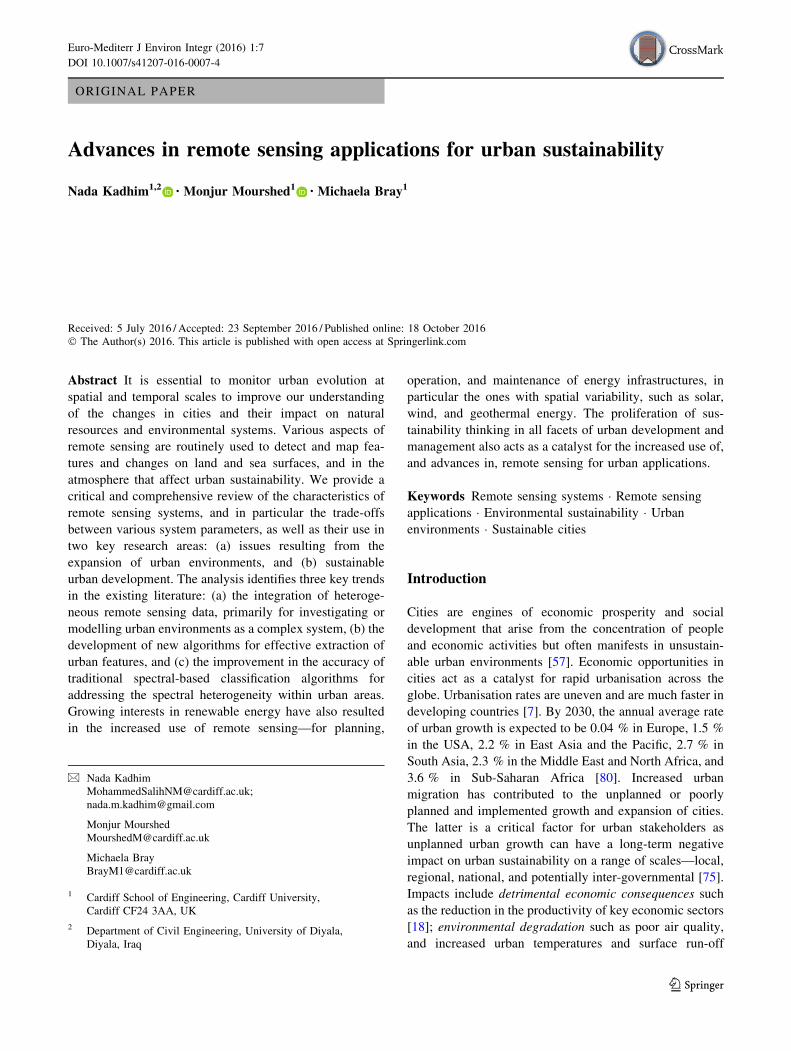
reader to gain a high-level overview of RS characteristics, we
categorised the satellites based on their orbit; sensormode and
instrument; resolution; and wavelength of electromagnetic
radiation (EMR), as shown in Fig. 2.
Orbit
RS satellites roam in the two kinds of orbits: sun-syn-
chronous and geostationary. Most RS platforms, such as
Landsat, SPOT and IKONOS, operate in a near-polar (i.e.
sun-synchronous) orbit at low altitudes and pass over each
area before noon, at 10:30 am local time [62], allowing the
acquisition of clearer images of the Earth’s surface over a
particular area on a series of days in similar illumination
conditions; i.e. when the sun position is optimal, between
9.30 and 11.30 am local time [13]. In contrast, geostationary
satellites are ideal for some communication and meteoro-
logical applications because of their very high altitudes
allowing continuous coverage of a large area of the Earth’s
surface, with the trade-off being low spatial resolution.
Sensor mode and instrument
Spatial resolution is based on pixel size and is said to be
low when it is greater than 100 m, medium when between
10 and 100 m, and high when it is less than 10 m [66].
Depending on the on-board sensor’s spatial resolution, RS
systems can be classified into two groups: low and med-
ium, and high and very high. Existing low–medium, and
high–very high RS systems and their potential applications
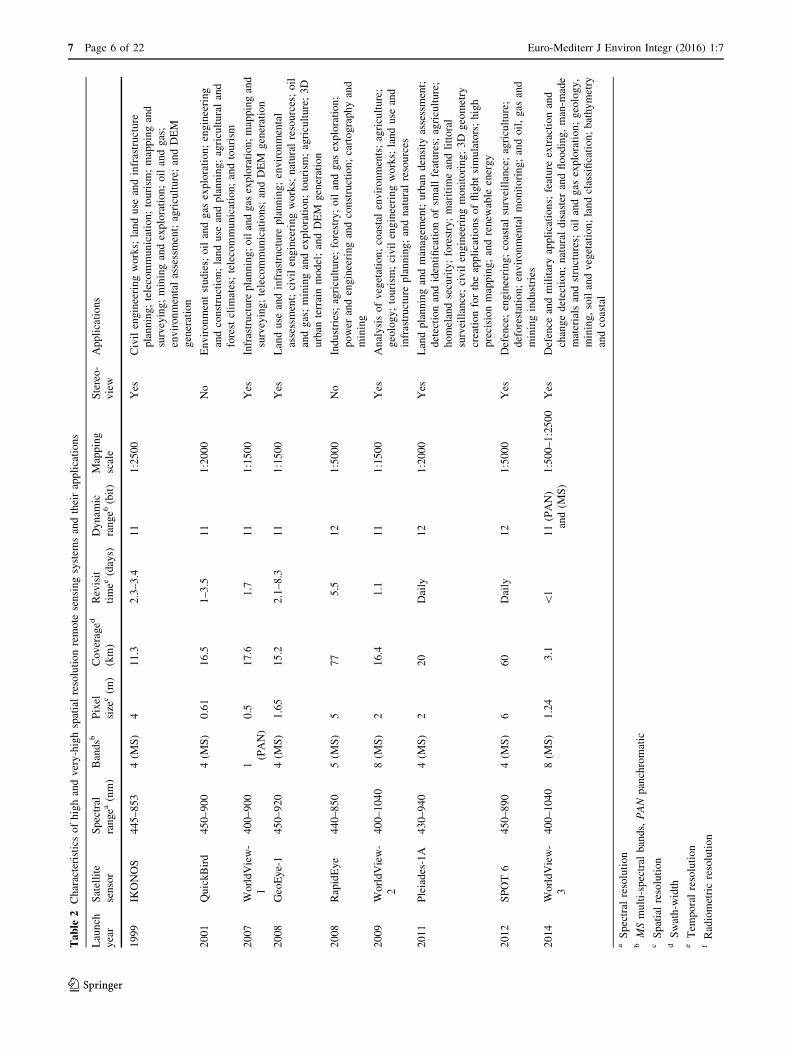
are given in Tables 1 and 2, respectively. Most of the data
are available at a low cost, and often free to download on
the Internet. A summary of selected websites for down-
loading satellite imagery, radar, LiDAR, hyperspectral,
aerial orthoimagery and digital spectral library data are
presented in Table 3.
7 Page 2 of 22 Euro-Mediterr J Environ Integr (2016) 1:7
123
1970s 1980s-1990s 2000s-Onwards
Pixel size 80*80 m,e.g., Landsat – MSS
Pixel size from 30*30 m to 10*10 m, e.g., Landsat – TM and SPOT-1, 2, and 3
Pixel size from 5*5 m to 0.5*0.5 m,e.g., SPOT-5, IKONOS and Quickbird
Less detail More detail
Covering a wide area Covering a small area
Leve
l of f
eatu
re
reco
gniti
onLe
vel o
f det
ail
Leve
l of p
lann
ing
of p
lace
Pix
el s
ize
Feature display Feature display Feature display
Pix
el s
ize
Pix
el s
ize
Regional Metropolitan plan Settlement Pattern
Local area planGreen field structure plan (city/district)
Neighbourhood planCity centre master plan
Fig. 1 A comparison of satellite generations in terms of detail,
feature recognition and planning requirements. The red square
represents the spatial resolution of the adjacent RS image. An image
with a pixel size of 80 m (Landsat-MSS) cannot recognise an object,
such as a house but its features can be effectively recognised with a
pixel size of 0.6 m (QuickBird)
Satellite orbits
Geostationary satellite orbits
Wavelengths Sensing resolutions
Sun-synchronous satellite orbits
Incoming lightLens
CD
array
Rotating mirror
Incoming lightPrism
Detector array
Sensing systems
Active sensors
Passive sensors
Transmitter
Receiver
Transmit pulses
Receive pulses
Transmitter
Receiver
Transmit pulses
Radiometer
Imaging radiometer
Spectrometer
Spectroradiometer
Radar
Scatterometer
LiDAR
Laser Altimeter
Near Infrared region(radiation reflected)
Thermal Infrared region(radiation emitted)
Microwave region
Spatial resolution
Radiometric resolution
Spectral resolution
Temporal resolution
High
Low
Visible region (radiation reflected)
Microwave
Receive pulses
Laser
Fig. 2 Classification of remote sensing sensors based on their characteristics
Euro-Mediterr J Environ Integr (2016) 1:7 Page 3 of 22 7
123
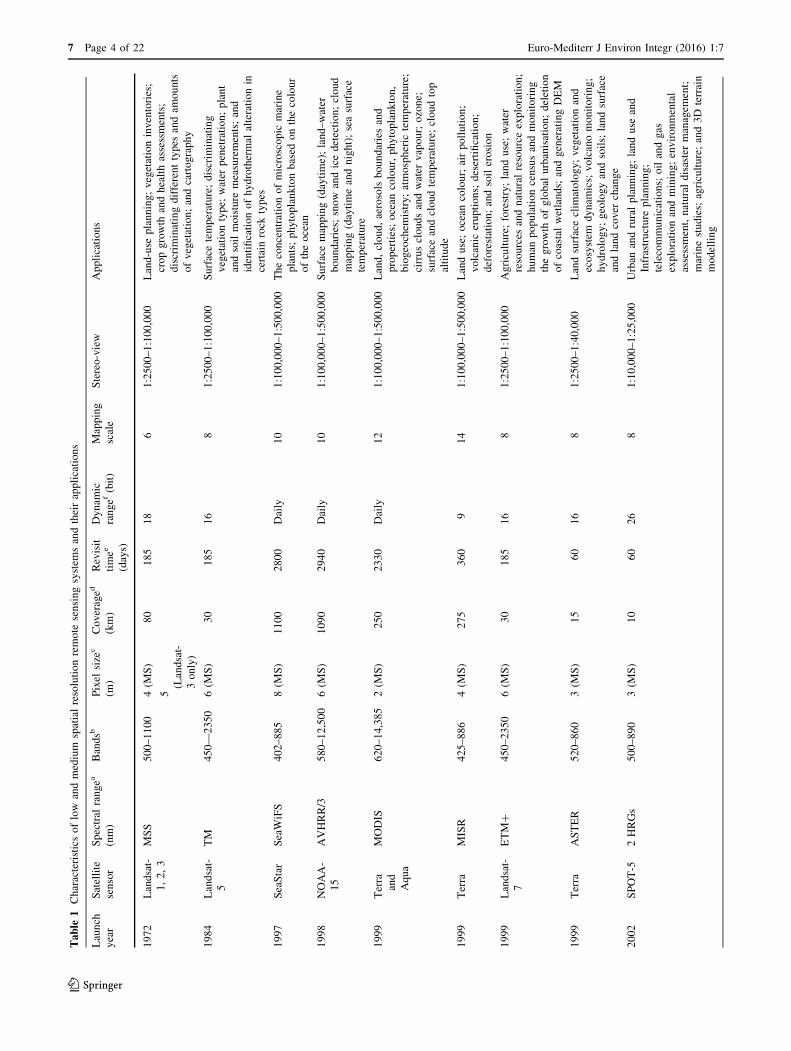
Table
1Characteristicsoflow
andmedium
spatialresolutionremote
sensingsystem
sandtheirapplications
Launch
year
Satellite
sensor
Spectral
rangea
(nm)
Bandsb
Pixel
size
c
(m)
Coveraged
(km)
Revisit
timee
(days)
Dynam
ic
rangef
(bit)
Mapping
scale
Stereo-view
Applications
1972
Landsat-
1,2,3
MSS
500–1100
4(M
S)
5
(Landsat-
3only)
80
185
18
61:2500–1:100,000
Land-use
planning;vegetationinventories;
cropgrowth
andhealthassessments;
discrim
inatingdifferenttypes
andam
ounts
ofvegetation;andcartography
1984
Landsat-
5
TM
450—
2350
6(M
S)
30
185
16
81:2500–1:100,000
Surfacetemperature;discrim
inating
vegetationtype;
water
penetration;plant
andsoilmoisture
measurements;and
identificationofhydrothermal
alterationin
certainrock
types
1997
SeaStar
SeaWiFS
402–885
8(M
S)
1100
2800
Daily
10
1:100,000–1:500,000
Theconcentrationofmicroscopic
marine
plants;phytoplanktonbased
onthecolour
oftheocean
1998
NOAA-
15
AVHRR/3
580–12,500
6(M
S)
1090
2940
Daily
10
1:100,000–1:500,000
Surfacemapping(daytime);land–water
boundaries;snow
andicedetection;cloud
mapping(daytimeandnight);seasurface
temperature
1999
Terra
and
Aqua
MODIS
620–14,385
2(M
S)
250
2330
Daily
12
1:100,000–1:500,000
Land,cloud,aerosols
boundariesand
properties;ocean
colour,phytoplankton,
biogeochem
istry;atmospheric
temperature;
cirruscloudsandwater
vapour;ozone;
surfaceandcloudtemperature;cloudtop
altitude
1999
Terra
MISR
425–886
4(M
S)
275
360
914
1:100,000–1:500,000
Landuse;ocean
colour;airpollution;
volcanic
eruptions;
desertification;
deforestation;andsoilerosion
1999
Landsat-
7
ETM?
450–2350
6(M
S)
30
185
16
81:2500–1:100,000
Agriculture;forestry;landuse;water
resources
andnaturalresourceexploration;
human
populationcensusandmonitoring
thegrowth
ofglobal
urbanisation;deletion
ofcoastalwetlands;
andgeneratingDEM
1999
Terra
ASTER
520–860
3(M
S)
15
60
16
81:2500–1:40,000
Landsurfaceclim
atology;vegetationand
ecosystem
dynam
ics;
volcanomonitoring;
hydrology;geologyandsoils;landsurface
andlandcover
change
2002
SPOT-5
2HRGs
500–890
3(M
S)
10
60
26
81:10,000–1:25,000
Urban
andruralplanning;landuse
and
Infrastructure
planning;
telecommunications;
oilandgas
explorationandmining;environmental
assessment,naturaldisastermanagem
ent;
marinestudies;
agriculture;and3D
terrain
modelling
7 Page 4 of 22 Euro-Mediterr J Environ Integr (2016) 1:7
123
Resolution
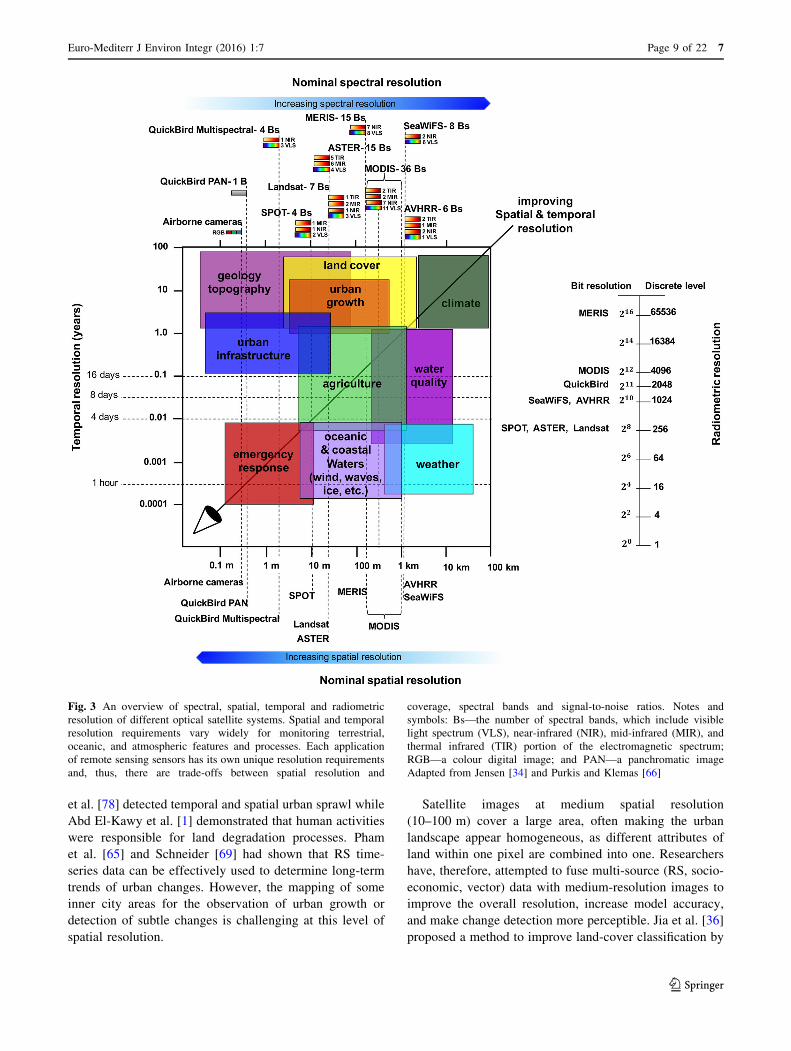
The trade-off between spatial and temporal resolution need
to be reconciled for the selection of satellite images for a
particular application, as illustrated in Fig. 3. For instance,
a high temporal resolution is essential for emergency sit-
uations, such as landfall due to hurricanes, because emer-
gency situations change rapidly and require frequent
observations on the day. In contrast, urban infrastructure
planning applications require spatial understanding over a
longer period, for which annual observations are often
sufficient. However, both use cases sometimes require high
spatial resolution images to observe their processes com-
prehensively. On the other hand, high temporal resolution
is required for applications such as weather that changes
rapidly. Operational weather forecast, therefore, requires
satellite observations with high temporal resolution often at
the cost of spatial resolution. Each RS application, thus,
has its own unique resolution requirements which need to
be appreciated.
Remote sensing of urban environments
Cities are unique because of the existence of dense artificial
structures. The increasing urbanisation rate will eventually
lead to the expedited consumption of non-renewable land
resources such as water (on- and under-ground) and food
[49], and energy resources such as oil, coal and gas—with
environmental, social and economic impact on developing
and developed countries alike [3]. Thus, the growth of
urban areas can result in substantial land-cover and land-
use changes—an ideal sustainability use case for the use of
remote sensing. The next sections are devoted to review of
remote sensing applications within urban environments,
focussing on urban growth, sprawl and change; environ-
mental impacts of urban growth; and sustainable energy
applications.
Urban growth, sprawl and change
Urban growth refers to the transformation of the landscape
from undeveloped to developed land [7]. More specifically,
the growth away from central urban areas into homoge-
neous, low-density and typically car-dependent communi-
ties is often referred to as urban/suburban sprawl. In
developing countries, urban sprawl can be unplanned and
uncontrolled [9]. Consequently, urban growth leads to the
loss of farmland, gives rise to economic and social issues,
and increases water and energy consumption, and associ-
ated greenhouse gas emissions [25]. From stakeholders’
point of view, the expansion of cities is a crucial change inTable
1continued
Launch
year
Satellite
sensor
Spectral
rangea
(nm)
Bandsb
Pixel
size
c
(m)
Coveraged
(km)
Revisit
timee
(days)
Dynam
ic
rangef
(bit)
Mapping
scale
Stereo-view
Applications
2013
Landsat-
8
OLIandTIRS
435–1551
8(M
S)
30
185
16
12
1:80,000–1:100,000
Mineral
exploration;vegetationanalysis;
largeregional
coverage;
extensivearchive
forchangedetection;availabilityof
imageryover
cloudaffected
areas
(detectingcirrusclouds);andcoastalzone
aSpectral
resolution
bMSmulti-spectral
bands
cSpatialresolution
dSwath-w
idth
eTem
poralresolution
fRadiometricresolution
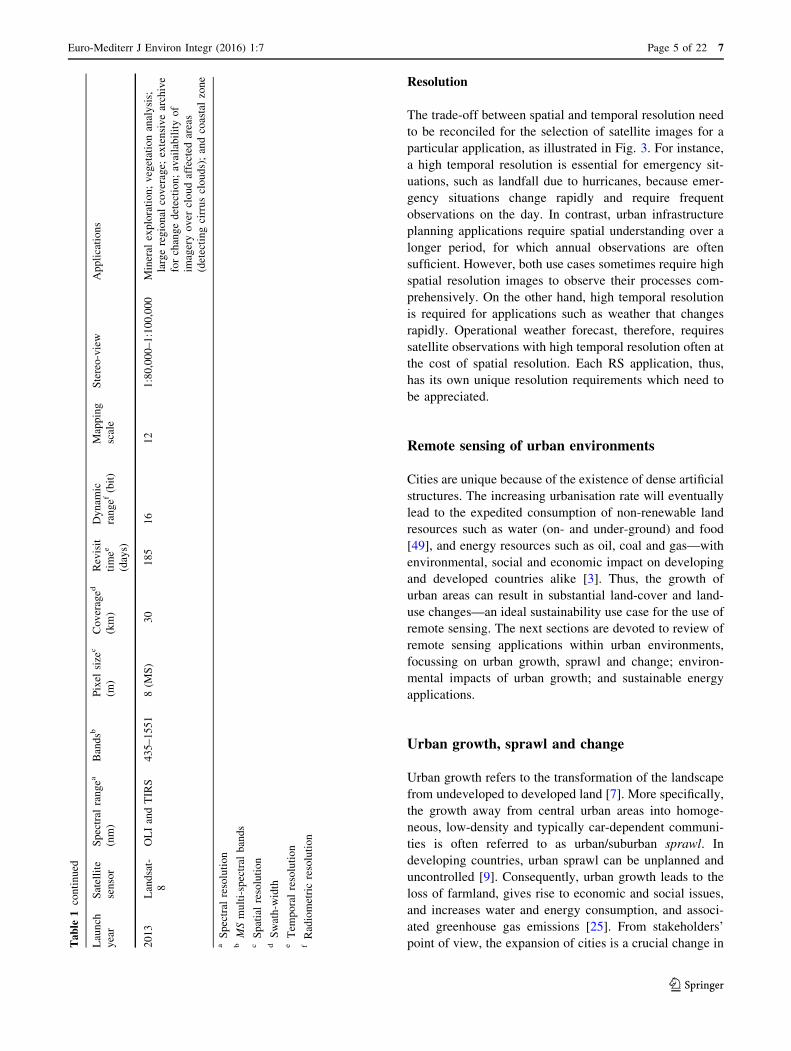
Euro-Mediterr J Environ Integr (2016) 1:7 Page 5 of 22 7
123
Table
2Characteristicsofhighandvery-highspatialresolutionremote
sensingsystem
sandtheirapplications
Launch
year
Satellite
sensor
Spectral
rangea
(nm)
Bandsb
Pixel
size
c(m
)
Coveraged
(km)
Revisit
timee
(days)
Dynam
ic
range6
(bit)
Mapping
scale
Stereo-
view
Applications
1999
IKONOS
445–853
4(M
S)
411.3
2.3–3.4
11
1:2500
Yes
Civilengineeringworks;
landuse
andinfrastructure
planning;telecommunication;tourism
;mappingand
surveying;miningandexploration;oilandgas;
environmentalassessment;agriculture;andDEM
generation
2001
QuickBird
450–900
4(M
S)
0.61
16.5
1–3.5
11
1:2000
No
Environmentstudies;
oilandgas
exploration;engineering
andconstruction;landuse
andplanning;agriculturaland
forestclim
ates;telecommunication;andtourism
2007
WorldView-
1
400–900
1
(PAN)
0.5
17.6
1.7
11
1:1500
Yes
Infrastructure
planning;oilandgas
exploration;mappingand
surveying;telecommunications;
andDEM
generation
2008
GeoEye-1
450–920
4(M
S)
1.65
15.2
2.1–8.3
11
1:1500
Yes
Landuse
andinfrastructure
planning;environmental
assessment;civilengineeringworks;
naturalresources;oil
andgas;miningandexploration;tourism
;agriculture;3D
urban
terrainmodel;andDEM
generation
2008
RapidEye
440–850
5(M
S)
577
5.5
12
1:5000
No
Industries;agriculture;forestry;oilandgas
exploration;
power
andengineeringandconstruction;cartographyand
mining
2009
WorldView-
2
400–1040
8(M
S)
216.4
1.1
11
1:1500
Yes
Analysisofvegetation;coastalenvironments;agriculture;
geology;tourism
;civilengineeringworks;
landuse
and
infrastructure
planning;andnaturalresources
2011
Pleiades-1A
430–940
4(M
S)
220
Daily
12
1:2000
Yes
Landplanningandmanagem
ent;urban
density
assessment;
detectionandidentificationofsm
allfeatures;
agriculture;
homelandsecurity;forestry;maritim
eandlittoral
surveillance;civilengineeringmonitoring;3D
geometry
creationfortheapplicationsofflightsimulators;high
precisionmapping;andrenew
able
energy
2012
SPOT6
450–890
4(M
S)
660
Daily
12
1:5000
Yes
Defence;engineering;coastalsurveillance;agriculture;
deforestation;environmentalmonitoring;andoil,gas
and
miningindustries
2014
WorldView-
3
400–1040
8(M
S)
1.24
3.1
\1
11(PAN)
and(M
S)
1:500–1:2500
Yes
Defence
andmilitaryapplications;
feature
extractionand
changedetection;naturaldisasterandflooding,man-m
ade
materialsandstructures;
oilandgas
exploration;geology,
mining,soilandvegetation;landclassification;bathymetry
andcoastal
aSpectral
resolution
bMSmulti-spectral
bands,PAN
panchromatic
cSpatialresolution
dSwath-w
idth
eTem
poralresolution
fRadiometricresolution
7 Page 6 of 22 Euro-Mediterr J Environ Integr (2016) 1:7
123
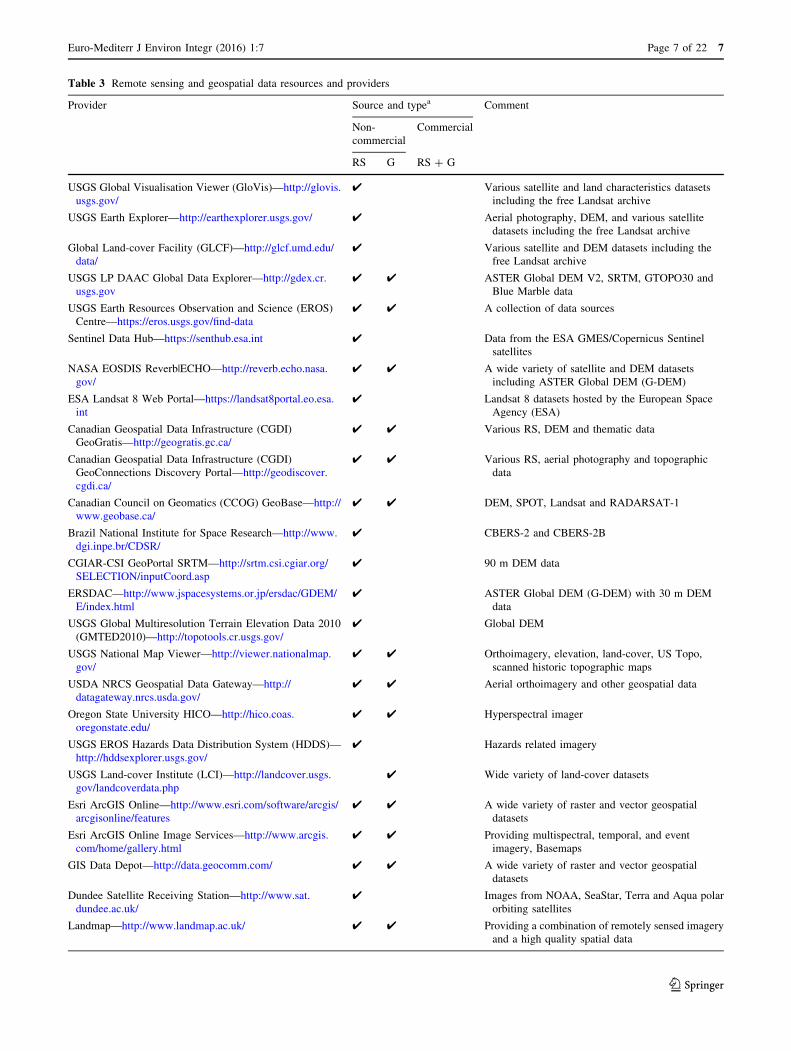
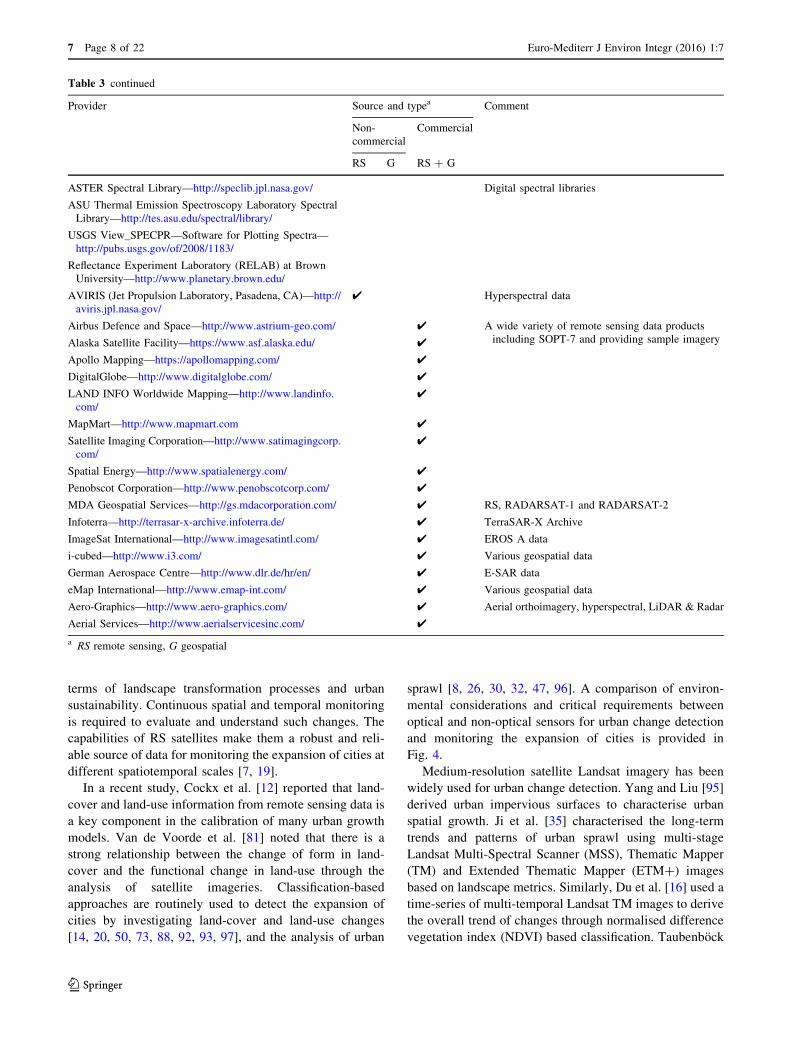
Table 3 Remote sensing and geospatial data resources and providers
Provider Source and typea Comment
Non-
commercial
Commercial
RS G RS ? G
USGS Global Visualisation Viewer (GloVis)—http://glovis.
usgs.gov/
4 Various satellite and land characteristics datasets
including the free Landsat archive
USGS Earth Explorer—http://earthexplorer.usgs.gov/ 4 Aerial photography, DEM, and various satellite
datasets including the free Landsat archive
Global Land-cover Facility (GLCF)—http://glcf.umd.edu/
data/
4 Various satellite and DEM datasets including the
free Landsat archive
USGS LP DAAC Global Data Explorer—http://gdex.cr.
usgs.gov
4 4 ASTER Global DEM V2, SRTM, GTOPO30 and
Blue Marble data
USGS Earth Resources Observation and Science (EROS)
Centre—https://eros.usgs.gov/find-data
4 4 A collection of data sources
Sentinel Data Hub—https://senthub.esa.int 4 Data from the ESA GMES/Copernicus Sentinel
satellites
NASA EOSDIS Reverb|ECHO—http://reverb.echo.nasa.
gov/
4 4 A wide variety of satellite and DEM datasets
including ASTER Global DEM (G-DEM)
ESA Landsat 8 Web Portal—https://landsat8portal.eo.esa.
int
4 Landsat 8 datasets hosted by the European Space
Agency (ESA)
Canadian Geospatial Data Infrastructure (CGDI)
GeoGratis—http://geogratis.gc.ca/
4 4 Various RS, DEM and thematic data
Canadian Geospatial Data Infrastructure (CGDI)
GeoConnections Discovery Portal—http://geodiscover.
cgdi.ca/
4 4 Various RS, aerial photography and topographic
data
Canadian Council on Geomatics (CCOG) GeoBase—http://
www.geobase.ca/
4 4 DEM, SPOT, Landsat and RADARSAT-1
Brazil National Institute for Space Research—http://www.
dgi.inpe.br/CDSR/
4 CBERS-2 and CBERS-2B
CGIAR-CSI GeoPortal SRTM—http://srtm.csi.cgiar.org/
SELECTION/inputCoord.asp
4 90 m DEM data
ERSDAC—http://www.jspacesystems.or.jp/ersdac/GDEM/
E/index.html
4 ASTER Global DEM (G-DEM) with 30 m DEM
data
USGS Global Multiresolution Terrain Elevation Data 2010
(GMTED2010)—http://topotools.cr.usgs.gov/
4 Global DEM
USGS National Map Viewer—http://viewer.nationalmap.
gov/
4 4 Orthoimagery, elevation, land-cover, US Topo,
scanned historic topographic maps
USDA NRCS Geospatial Data Gateway—http://
datagateway.nrcs.usda.gov/
4 4 Aerial orthoimagery and other geospatial data
Oregon State University HICO—http://hico.coas.
oregonstate.edu/
4 4 Hyperspectral imager
USGS EROS Hazards Data Distribution System (HDDS)—
http://hddsexplorer.usgs.gov/
4 Hazards related imagery
USGS Land-cover Institute (LCI)—http://landcover.usgs.
gov/landcoverdata.php
4 Wide variety of land-cover datasets
Esri ArcGIS Online—http://www.esri.com/software/arcgis/
arcgisonline/features
4 4 A wide variety of raster and vector geospatial
datasets
Esri ArcGIS Online Image Services—http://www.arcgis.
com/home/gallery.html
4 4 Providing multispectral, temporal, and event
imagery, Basemaps
GIS Data Depot—http://data.geocomm.com/ 4 4 A wide variety of raster and vector geospatial
datasets
Dundee Satellite Receiving Station—http://www.sat.
dundee.ac.uk/
4 Images from NOAA, SeaStar, Terra and Aqua polar
orbiting satellites
Landmap—http://www.landmap.ac.uk/ 4 4 Providing a combination of remotely sensed imagery
and a high quality spatial data
Euro-Mediterr J Environ Integr (2016) 1:7 Page 7 of 22 7
123
terms of landscape transformation processes and urban
sustainability. Continuous spatial and temporal monitoring
is required to evaluate and understand such changes. The
capabilities of RS satellites make them a robust and reli-
able source of data for monitoring the expansion of cities at
different spatiotemporal scales [7, 19].
In a recent study, Cockx et al. [12] reported that land-
cover and land-use information from remote sensing data is
a key component in the calibration of many urban growth
models. Van de Voorde et al. [81] noted that there is a
strong relationship between the change of form in land-
cover and the functional change in land-use through the
analysis of satellite imageries. Classification-based
approaches are routinely used to detect the expansion of
cities by investigating land-cover and land-use changes
[14, 20, 50, 73, 88, 92, 93, 97], and the analysis of urban
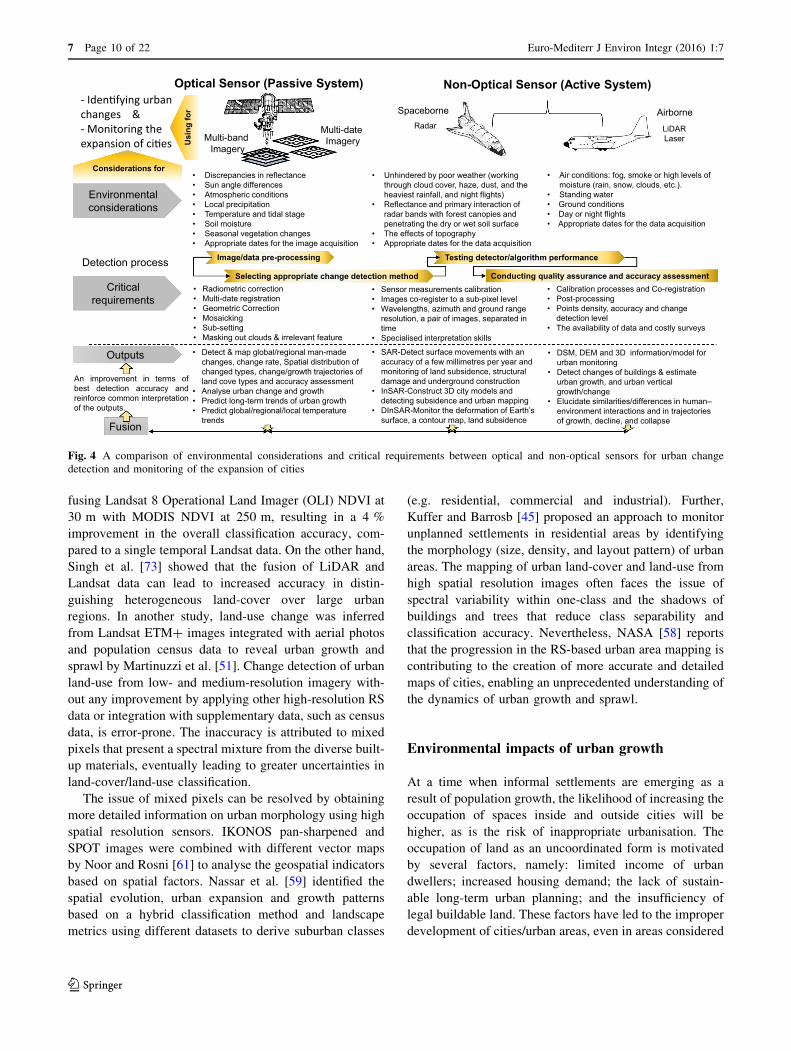
sprawl [8, 26, 30, 32, 47, 96]. A comparison of environ-
mental considerations and critical requirements between
optical and non-optical sensors for urban change detection
and monitoring the expansion of cities is provided in
Fig. 4.
Medium-resolution satellite Landsat imagery has been
widely used for urban change detection. Yang and Liu [95]
derived urban impervious surfaces to characterise urban
spatial growth. Ji et al. [35] characterised the long-term
trends and patterns of urban sprawl using multi-stage
Landsat Multi-Spectral Scanner (MSS), Thematic Mapper
(TM) and Extended Thematic Mapper (ETM?) images
based on landscape metrics. Similarly, Du et al. [16] used a
time-series of multi-temporal Landsat TM images to derive
the overall trend of changes through normalised difference
vegetation index (NDVI) based classification. Taubenbock
Table 3 continued
Provider Source and typea Comment
Non-
commercial
Commercial
RS G RS ? G
ASTER Spectral Library—http://speclib.jpl.nasa.gov/ Digital spectral libraries
ASU Thermal Emission Spectroscopy Laboratory Spectral
Library—http://tes.asu.edu/spectral/library/
USGS View_SPECPR—Software for Plotting Spectra—
http://pubs.usgs.gov/of/2008/1183/
Reflectance Experiment Laboratory (RELAB) at Brown
University—http://www.planetary.brown.edu/
AVIRIS (Jet Propulsion Laboratory, Pasadena, CA)—http://
aviris.jpl.nasa.gov/
4 Hyperspectral data
Airbus Defence and Space—http://www.astrium-geo.com/ 4 A wide variety of remote sensing data products
including SOPT-7 and providing sample imageryAlaska Satellite Facility—https://www.asf.alaska.edu/ 4
Apollo Mapping—https://apollomapping.com/ 4
DigitalGlobe—http://www.digitalglobe.com/ 4
LAND INFO Worldwide Mapping—http://www.landinfo.
com/
4
MapMart—http://www.mapmart.com 4
Satellite Imaging Corporation—http://www.satimagingcorp.
com/
4
Spatial Energy—http://www.spatialenergy.com/ 4
Penobscot Corporation—http://www.penobscotcorp.com/ 4
MDA Geospatial Services—http://gs.mdacorporation.com/ 4 RS, RADARSAT-1 and RADARSAT-2
Infoterra—http://terrasar-x-archive.infoterra.de/ 4 TerraSAR-X Archive
ImageSat International—http://www.imagesatintl.com/ 4 EROS A data
i-cubed—http://www.i3.com/ 4 Various geospatial data
German Aerospace Centre—http://www.dlr.de/hr/en/ 4 E-SAR data
eMap International—http://www.emap-int.com/ 4 Various geospatial data
Aero-Graphics—http://www.aero-graphics.com/ 4 Aerial orthoimagery, hyperspectral, LiDAR & Radar
Aerial Services—http://www.aerialservicesinc.com/ 4
a RS remote sensing, G geospatial
7 Page 8 of 22 Euro-Mediterr J Environ Integr (2016) 1:7
123
et al. [78] detected temporal and spatial urban sprawl while
Abd El-Kawy et al. [1] demonstrated that human activities
were responsible for land degradation processes. Pham
et al. [65] and Schneider [69] had shown that RS time-
series data can be effectively used to determine long-term
trends of urban changes. However, the mapping of some
inner city areas for the observation of urban growth or
detection of subtle changes is challenging at this level of
spatial resolution.
Satellite images at medium spatial resolution
(10–100 m) cover a large area, often making the urban
landscape appear homogeneous, as different attributes of
land within one pixel are combined into one. Researchers
have, therefore, attempted to fuse multi-source (RS, socio-
economic, vector) data with medium-resolution images to
improve the overall resolution, increase model accuracy,
and make change detection more perceptible. Jia et al. [36]
proposed a method to improve land-cover classification by
Fig. 3 An overview of spectral, spatial, temporal and radiometric
resolution of different optical satellite systems. Spatial and temporal
resolution requirements vary widely for monitoring terrestrial,
oceanic, and atmospheric features and processes. Each application
of remote sensing sensors has its own unique resolution requirements
and, thus, there are trade-offs between spatial resolution and
coverage, spectral bands and signal-to-noise ratios. Notes and
symbols: Bs—the number of spectral bands, which include visible
light spectrum (VLS), near-infrared (NIR), mid-infrared (MIR), and
thermal infrared (TIR) portion of the electromagnetic spectrum;
RGB—a colour digital image; and PAN—a panchromatic image
Adapted from Jensen [34] and Purkis and Klemas [66]
Euro-Mediterr J Environ Integr (2016) 1:7 Page 9 of 22 7
123
fusing Landsat 8 Operational Land Imager (OLI) NDVI at
30 m with MODIS NDVI at 250 m, resulting in a 4 %
improvement in the overall classification accuracy, com-
pared to a single temporal Landsat data. On the other hand,
Singh et al. [73] showed that the fusion of LiDAR and
Landsat data can lead to increased accuracy in distin-
guishing heterogeneous land-cover over large urban
regions. In another study, land-use change was inferred
from Landsat ETM? images integrated with aerial photos
and population census data to reveal urban growth and
sprawl by Martinuzzi et al. [51]. Change detection of urban
land-use from low- and medium-resolution imagery with-
out any improvement by applying other high-resolution RS
data or integration with supplementary data, such as census
data, is error-prone. The inaccuracy is attributed to mixed
pixels that present a spectral mixture from the diverse built-
up materials, eventually leading to greater uncertainties in
land-cover/land-use classification.
The issue of mixed pixels can be resolved by obtaining
more detailed information on urban morphology using high
spatial resolution sensors. IKONOS pan-sharpened and
SPOT images were combined with different vector maps
by Noor and Rosni [61] to analyse the geospatial indicators
based on spatial factors. Nassar et al. [59] identified the
spatial evolution, urban expansion and growth patterns
based on a hybrid classification method and landscape
metrics using different datasets to derive suburban classes
(e.g. residential, commercial and industrial). Further,
Kuffer and Barrosb [45] proposed an approach to monitor
unplanned settlements in residential areas by identifying
the morphology (size, density, and layout pattern) of urban
areas. The mapping of urban land-cover and land-use from
high spatial resolution images often faces the issue of
spectral variability within one-class and the shadows of
buildings and trees that reduce class separability and
classification accuracy. Nevertheless, NASA [58] reports
that the progression in the RS-based urban area mapping is
contributing to the creation of more accurate and detailed
maps of cities, enabling an unprecedented understanding of
the dynamics of urban growth and sprawl.
Environmental impacts of urban growth
At a time when informal settlements are emerging as a
result of population growth, the likelihood of increasing the
occupation of spaces inside and outside cities will be
higher, as is the risk of inappropriate urbanisation. The
occupation of land as an uncoordinated form is motivated
by several factors, namely: limited income of urban
dwellers; increased housing demand; the lack of sustain-
able long-term urban planning; and the insufficiency of
legal buildable land. These factors have led to the improper
development of cities/urban areas, even in areas considered
Conducting quality assurance and accuracy assessment
Outputs
Critical requirements
Environmental considerations
Optical Sensor (Passive System)
Multi-bandImagery
Multi-dateImagery
Non-Optical Sensor (Active System)
SpaceborneRadar
Airborne
LiDARLaser
• Discrepancies in reflectance• Sun angle differences• Atmospheric conditions• Local precipitation• Temperature and tidal stage• Soil moisture• Seasonal vegetation changes• Appropriate dates for the image acquisition
• Air conditions: fog, smoke or high levels of moisture (rain, snow, clouds, etc.).
• Standing water• Ground conditions• Day or night flights• Appropriate dates for the data acquisition
• Unhindered by poor weather (working through cloud cover, haze, dust, and the heaviest rainfall, and night flights)
• Reflectance and primary interaction of radar bands with forest canopies and penetrating the dry or wet soil surface
• The effects of topography • Appropriate dates for the data acquisition
• Radiometric correction• Multi-date registration• Geometric Correction• Mosaicking • Sub-setting• Masking out clouds & irrelevant feature
Image/data pre-processing
Selecting appropriate change detection method
Testing detector/algorithm performance
• Sensor measurements calibration• Images co-register to a sub-pixel level• Wavelengths, azimuth and ground range
resolution, a pair of images, separated in time
• Specialised interpretation skills
• Calibration processes and Co-registration• Post-processing• Points density, accuracy and change
detection level• The availability of data and costly surveys
• Detect & map global/regional man-made changes, change rate, Spatial distribution of changed types, change/growth trajectories of land cove types and accuracy assessment
• Analyse urban change and growth• Predict long-term trends of urban growth• Predict global/regional/local temperature
trends
• SAR-Detect surface movements with an accuracy of a few millimetres per year and monitoring of land subsidence, structural damage and underground construction
• InSAR-Construct 3D city models anddetecting subsidence and urban mapping
• DInSAR-Monitor the deformation of Earth’s surface, a contour map, land subsidence
• DSM, DEM and 3D information/model for urban monitoring
• Detect changes of buildings & estimate urban growth, and urban vertical growth/change
• Elucidate similarities/differences in human–environment interactions and in trajectories of growth, decline, and collapseFusion
An improvement in terms ofbest detection accuracy andreinforce common interpretationof the outputs.
Detection process
- Iden�fying urban changes & - Monitoring the expansion of ci�es
Considerations for
Usi
ng fo
r
Fig. 4 A comparison of environmental considerations and critical requirements between optical and non-optical sensors for urban change
detection and monitoring of the expansion of cities
7 Page 10 of 22 Euro-Mediterr J Environ Integr (2016) 1:7
123
at high risk from natural disasters such as landslide and
flooding. The negative effects of the expansion of cities
and urban growth are more motivational as a research
agenda than the positive ones. One such application is the
assessment of the quality of life and socio-economic con-
ditions in urban slums, as for every three city dwellers
worldwide one lives in a slum [63]. Many authors applied
RS techniques to identify slum locations and classify slums
from other land-use types [42–44, 67, 77, 83]. Graesser
et al. [23] distinguished the boundaries between formal and
informal settlements using an image classification
approach. Weeks et al. [89] identified the location of slums
and quantified their area using a vegetation-impervious-soil
(VIS) model, image texturing, and census data to deduce
land-use effects and to produce a slum index map.
According to Hagenlocher et al. [24], a clear link between
increasing new temporary settlements of population and
decreasing natural resources in the vicinity of these set-
tlements was revealed using a time-series of VHR optical
satellite imagery.
Other research includes the identification of slum core
and its impacts on the environment by Kit et al. [43], and
slum area change patterns by Kit and Ludeke [42]. Despite
the progress made in slum detection, there is a need to
develop methods that consider the interrelationships
between the spatial distribution of slums and socio-eco-
nomic variables. Moreover, the spatial patterns of slums
with the texture of a land-cover type must also be inves-
tigated within the urban environment in a consistent man-
ner to improve the understanding of the interrelated land
surfaces. In particular, exploiting textural differences
between urban land-uses can be beneficial for improving
urban mapping with regards to spectral heterogeneity
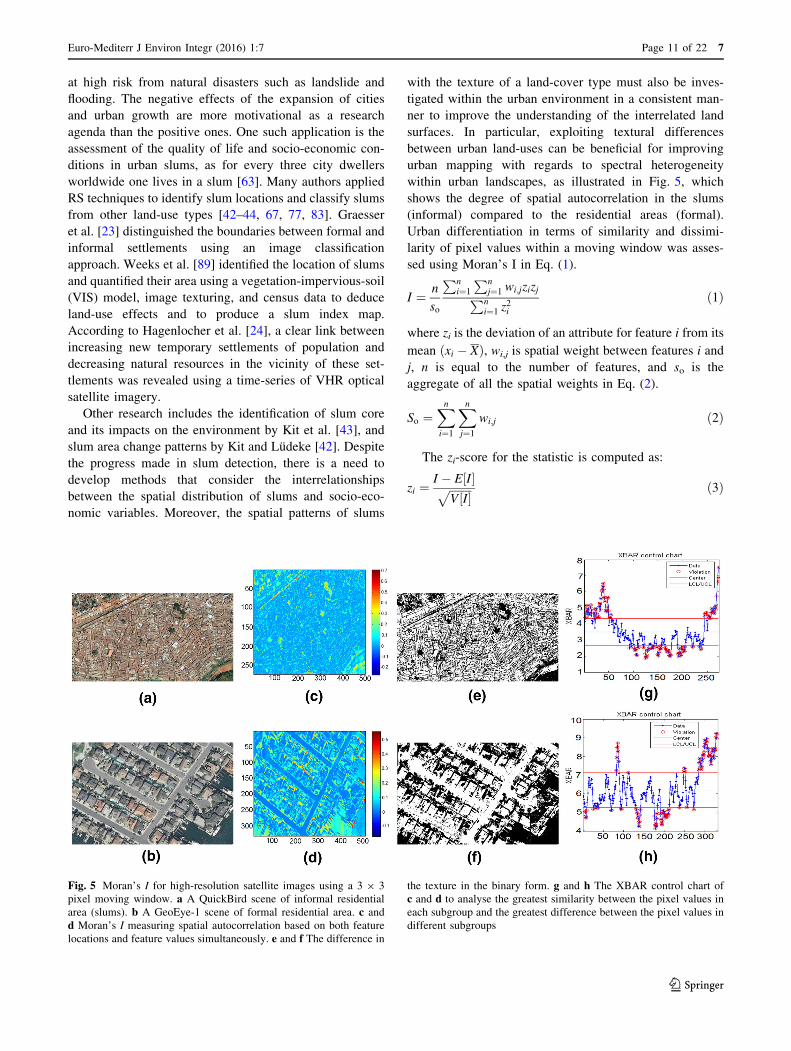
within urban landscapes, as illustrated in Fig. 5, which
shows the degree of spatial autocorrelation in the slums
(informal) compared to the residential areas (formal).
Urban differentiation in terms of similarity and dissimi-
larity of pixel values within a moving window was asses-
sed using Moran’s I in Eq. (1).
I ¼ n
so
Pni¼1
Pnj¼1 wi;jzizj
Pni¼1 z
2i
ð1Þ
where zi is the deviation of an attribute for feature i from its
mean ðxi � XÞ, wi,j is spatial weight between features i and
j, n is equal to the number of features, and so is the
aggregate of all the spatial weights in Eq. (2).
So ¼Xn
i¼1
Xn
j¼1
wi;j ð2Þ
The zi-score for the statistic is computed as:
zi ¼I � E I½ �
ffiffiffiffiffiffiffiffiV I½ �
p ð3Þ
Fig. 5 Moran’s I for high-resolution satellite images using a 3 9 3
pixel moving window. a A QuickBird scene of informal residential
area (slums). b A GeoEye-1 scene of formal residential area. c and
d Moran’s I measuring spatial autocorrelation based on both feature
locations and feature values simultaneously. e and f The difference in
the texture in the binary form. g and h The XBAR control chart of
c and d to analyse the greatest similarity between the pixel values in
each subgroup and the greatest difference between the pixel values in
different subgroups
Euro-Mediterr J Environ Integr (2016) 1:7 Page 11 of 22 7
123
where:
E I½ � ¼ 1=ðN � 1Þ ð4Þ
V I½ � ¼ E I2� �
� E I½ �2 ð5Þ
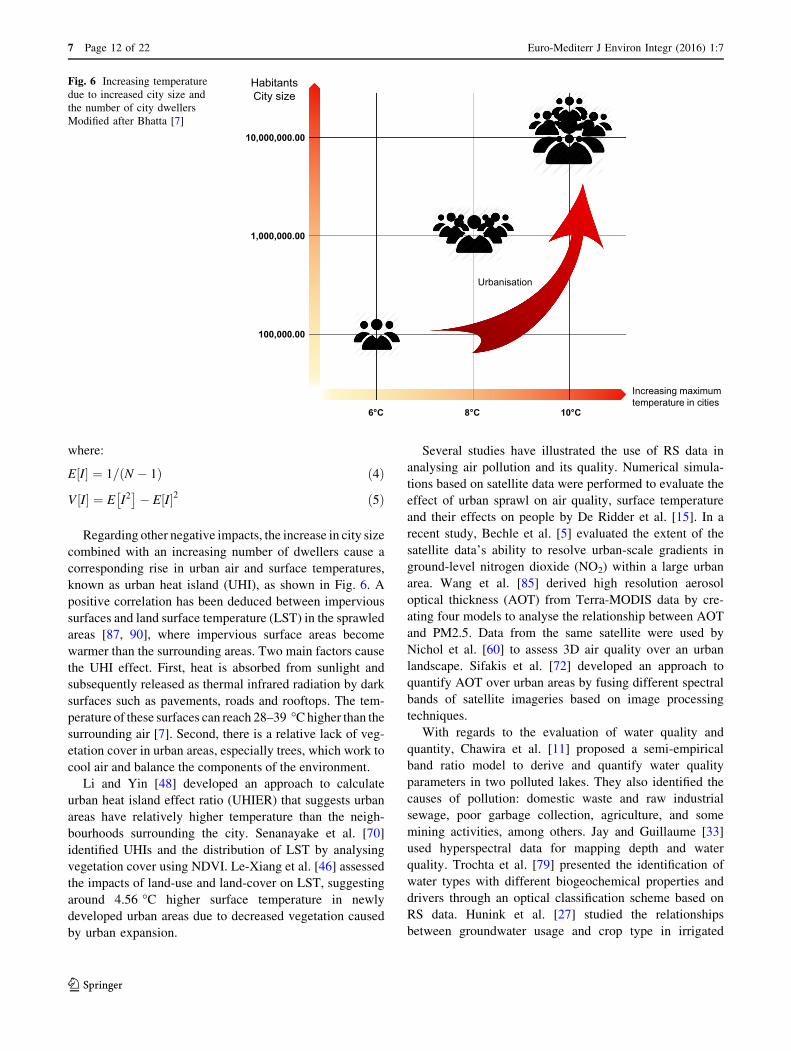
Regarding other negative impacts, the increase in city size
combined with an increasing number of dwellers cause a
corresponding rise in urban air and surface temperatures,
known as urban heat island (UHI), as shown in Fig. 6. A
positive correlation has been deduced between impervious
surfaces and land surface temperature (LST) in the sprawled
areas [87, 90], where impervious surface areas become
warmer than the surrounding areas. Two main factors cause
the UHI effect. First, heat is absorbed from sunlight and
subsequently released as thermal infrared radiation by dark
surfaces such as pavements, roads and rooftops. The tem-
perature of these surfaces can reach 28–39 �Chigher than the
surrounding air [7]. Second, there is a relative lack of veg-
etation cover in urban areas, especially trees, which work to
cool air and balance the components of the environment.
Li and Yin [48] developed an approach to calculate
urban heat island effect ratio (UHIER) that suggests urban
areas have relatively higher temperature than the neigh-
bourhoods surrounding the city. Senanayake et al. [70]
identified UHIs and the distribution of LST by analysing
vegetation cover using NDVI. Le-Xiang et al. [46] assessed
the impacts of land-use and land-cover on LST, suggesting
around 4.56 �C higher surface temperature in newly
developed urban areas due to decreased vegetation caused
by urban expansion.
Several studies have illustrated the use of RS data in
analysing air pollution and its quality. Numerical simula-
tions based on satellite data were performed to evaluate the
effect of urban sprawl on air quality, surface temperature
and their effects on people by De Ridder et al. [15]. In a
recent study, Bechle et al. [5] evaluated the extent of the
satellite data’s ability to resolve urban-scale gradients in
ground-level nitrogen dioxide (NO2) within a large urban
area. Wang et al. [85] derived high resolution aerosol
optical thickness (AOT) from Terra-MODIS data by cre-
ating four models to analyse the relationship between AOT
and PM2.5. Data from the same satellite were used by
Nichol et al. [60] to assess 3D air quality over an urban
landscape. Sifakis et al. [72] developed an approach to
quantify AOT over urban areas by fusing different spectral
bands of satellite imageries based on image processing
techniques.
With regards to the evaluation of water quality and
quantity, Chawira et al. [11] proposed a semi-empirical
band ratio model to derive and quantify water quality
parameters in two polluted lakes. They also identified the
causes of pollution: domestic waste and raw industrial
sewage, poor garbage collection, agriculture, and some
mining activities, among others. Jay and Guillaume [33]
used hyperspectral data for mapping depth and water
quality. Trochta et al. [79] presented the identification of
water types with different biogeochemical properties and
drivers through an optical classification scheme based on
RS data. Hunink et al. [27] studied the relationships
between groundwater usage and crop type in irrigated
100,000.00
1,000,000.00
10,000,000.00
6°C 8°C 10°C
HabitantsCity size
Increasing maximum temperature in cities
Urbanisation
Fig. 6 Increasing temperature
due to increased city size and
the number of city dwellers
Modified after Bhatta [7]
7 Page 12 of 22 Euro-Mediterr J Environ Integr (2016) 1:7
123
areas. The realistic spatial distribution of air and water
quality can help to define the urban landscape quality
(ULQ). The use of census data alone to quantify ULQ can
result in unreliable estimates as census data do not ade-
quately capture the environmental factors such as water-
borne diseases and various types of pollution (air, water,
toxic chemicals, etc.). Satellite RS data can fill this gap and
improve our understanding of the relationships between
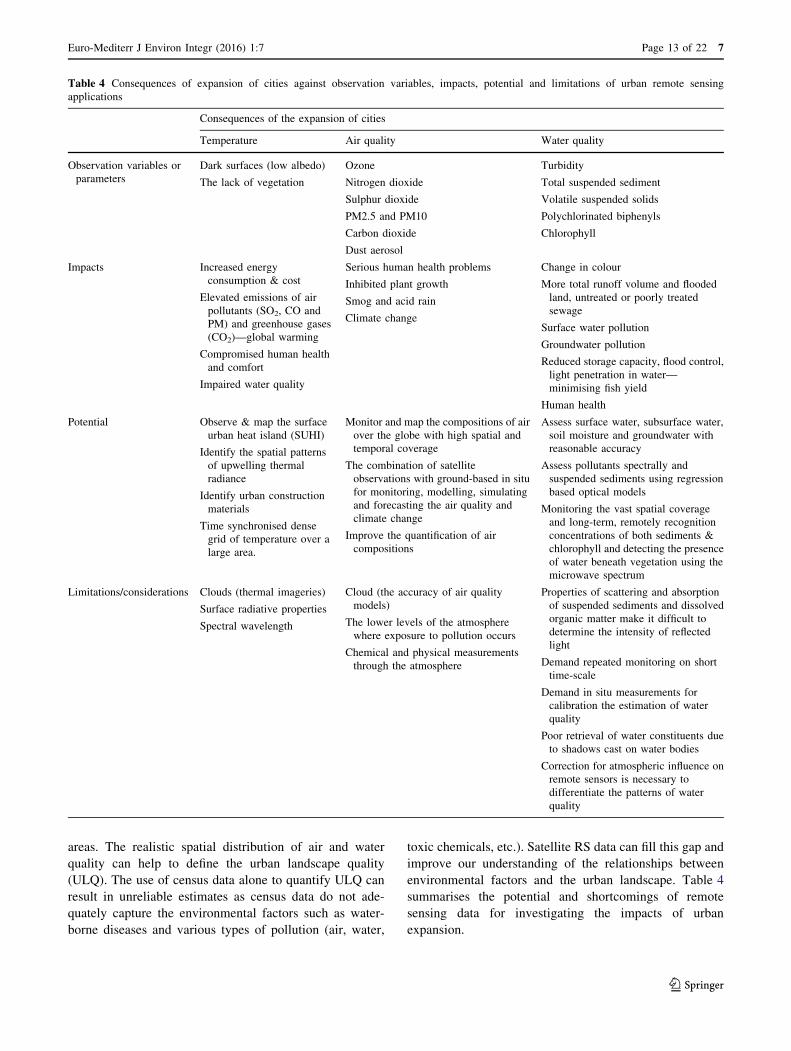
environmental factors and the urban landscape. Table 4
summarises the potential and shortcomings of remote
sensing data for investigating the impacts of urban
expansion.
Table 4 Consequences of expansion of cities against observation variables, impacts, potential and limitations of urban remote sensing
applications
Consequences of the expansion of cities
Temperature Air quality Water quality
Observation variables or
parameters
Dark surfaces (low albedo)
The lack of vegetation
Ozone
Nitrogen dioxide
Sulphur dioxide
PM2.5 and PM10
Carbon dioxide
Dust aerosol
Turbidity
Total suspended sediment
Volatile suspended solids
Polychlorinated biphenyls
Chlorophyll
Impacts Increased energy
consumption & cost
Elevated emissions of air
pollutants (SO2, CO and
PM) and greenhouse gases
(CO2)—global warming
Compromised human health
and comfort
Impaired water quality
Serious human health problems
Inhibited plant growth
Smog and acid rain
Climate change
Change in colour
More total runoff volume and flooded
land, untreated or poorly treated
sewage
Surface water pollution
Groundwater pollution
Reduced storage capacity, flood control,
light penetration in water—
minimising fish yield
Human health
Potential Observe & map the surface
urban heat island (SUHI)
Identify the spatial patterns
of upwelling thermal
radiance
Identify urban construction
materials
Time synchronised dense
grid of temperature over a
large area.
Monitor and map the compositions of air
over the globe with high spatial and
temporal coverage
The combination of satellite
observations with ground-based in situ
for monitoring, modelling, simulating
and forecasting the air quality and
climate change
Improve the quantification of air
compositions
Assess surface water, subsurface water,
soil moisture and groundwater with
reasonable accuracy
Assess pollutants spectrally and
suspended sediments using regression
based optical models
Monitoring the vast spatial coverage
and long-term, remotely recognition
concentrations of both sediments &
chlorophyll and detecting the presence
of water beneath vegetation using the
microwave spectrum
Limitations/considerations Clouds (thermal imageries)
Surface radiative properties
Spectral wavelength
Cloud (the accuracy of air quality
models)
The lower levels of the atmosphere
where exposure to pollution occurs
Chemical and physical measurements
through the atmosphere
Properties of scattering and absorption
of suspended sediments and dissolved
organic matter make it difficult to
determine the intensity of reflected
light
Demand repeated monitoring on short
time-scale
Demand in situ measurements for
calibration the estimation of water
quality
Poor retrieval of water constituents due
to shadows cast on water bodies
Correction for atmospheric influence on
remote sensors is necessary to
differentiate the patterns of water
quality
Euro-Mediterr J Environ Integr (2016) 1:7 Page 13 of 22 7
123
Sustainable urban environments
Urban sustainability must be taken into account for planned
urban growth to minimise our reliance on natural resources
and non-renewable energy. City growth can mitigate the
impacts of climate change by minimising ecological foot-
print, reducing pollution, increasing land-use efficiency,
recycling waste, and increasing the use of sustainable
materials, and by maximising renewable energy use. In
essence, the aim of urban sustainability is to manage
resources and to provide services through effective design
and implementation of policies, which require access to
detailed information on urban indicators. Remote sensing
can offer cost-effective solutions for collecting vast
amounts of data compared to resource-intensive conven-
tional approaches such as survey and field monitoring.
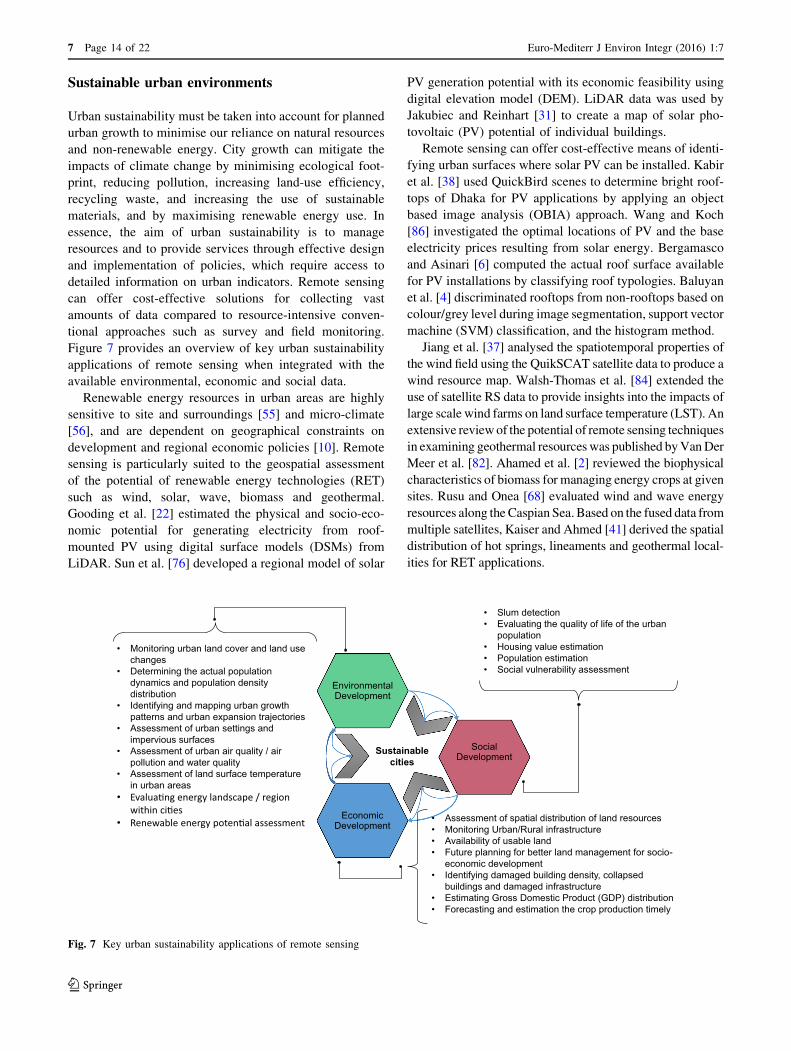
Figure 7 provides an overview of key urban sustainability
applications of remote sensing when integrated with the
available environmental, economic and social data.
Renewable energy resources in urban areas are highly
sensitive to site and surroundings [55] and micro-climate
[56], and are dependent on geographical constraints on
development and regional economic policies [10]. Remote
sensing is particularly suited to the geospatial assessment
of the potential of renewable energy technologies (RET)
such as wind, solar, wave, biomass and geothermal.
Gooding et al. [22] estimated the physical and socio-eco-
nomic potential for generating electricity from roof-
mounted PV using digital surface models (DSMs) from
LiDAR. Sun et al. [76] developed a regional model of solar
PV generation potential with its economic feasibility using
digital elevation model (DEM). LiDAR data was used by
Jakubiec and Reinhart [31] to create a map of solar pho-
tovoltaic (PV) potential of individual buildings.
Remote sensing can offer cost-effective means of identi-
fying urban surfaces where solar PV can be installed. Kabir
et al. [38] used QuickBird scenes to determine bright roof-
tops of Dhaka for PV applications by applying an object
based image analysis (OBIA) approach. Wang and Koch
[86] investigated the optimal locations of PV and the base
electricity prices resulting from solar energy. Bergamasco
and Asinari [6] computed the actual roof surface available
for PV installations by classifying roof typologies. Baluyan
et al. [4] discriminated rooftops from non-rooftops based on
colour/grey level during image segmentation, support vector
machine (SVM) classification, and the histogram method.
Jiang et al. [37] analysed the spatiotemporal properties of
the wind field using the QuikSCAT satellite data to produce a
wind resource map. Walsh-Thomas et al. [84] extended the
use of satellite RS data to provide insights into the impacts of
large scale wind farms on land surface temperature (LST). An
extensive reviewof the potential of remote sensing techniques
in examining geothermal resourceswas published byVanDer
Meer et al. [82]. Ahamed et al. [2] reviewed the biophysical
characteristics of biomass for managing energy crops at given
sites. Rusu and Onea [68] evaluated wind and wave energy
resources along the Caspian Sea.Based on the fused data from
multiple satellites, Kaiser and Ahmed [41] derived the spatial
distribution of hot springs, lineaments and geothermal local-
ities for RET applications.
Economic Development
Social Development
Environmental Development
• Monitoring urban land cover and land use changes
• Determining the actual population dynamics and population density distribution
• Identifying and mapping urban growth patterns and urban expansion trajectories
• Assessment of urban settings and impervious surfaces
• Assessment of urban air quality / air pollution and water quality
• Assessment of land surface temperature in urban areas
• Evalua�ng energy landscape / region within ci�es
• Renewable energy poten�al assessment
• Slum detection• Evaluating the quality of life of the urban
population• Housing value estimation• Population estimation • Social vulnerability assessment
• Assessment of spatial distribution of land resources• Monitoring Urban/Rural infrastructure• Availability of usable land• Future planning for better land management for socio-
economic development• Identifying damaged building density, collapsed
buildings and damaged infrastructure• Estimating Gross Domestic Product (GDP) distribution• Forecasting and estimation the crop production timely
Sustainablecities
Fig. 7 Key urban sustainability applications of remote sensing
7 Page 14 of 22 Euro-Mediterr J Environ Integr (2016) 1:7
123
Trends and future research
Studies discussed in the previous sections demonstrate the
significant potential of remote sensing in the assessment,
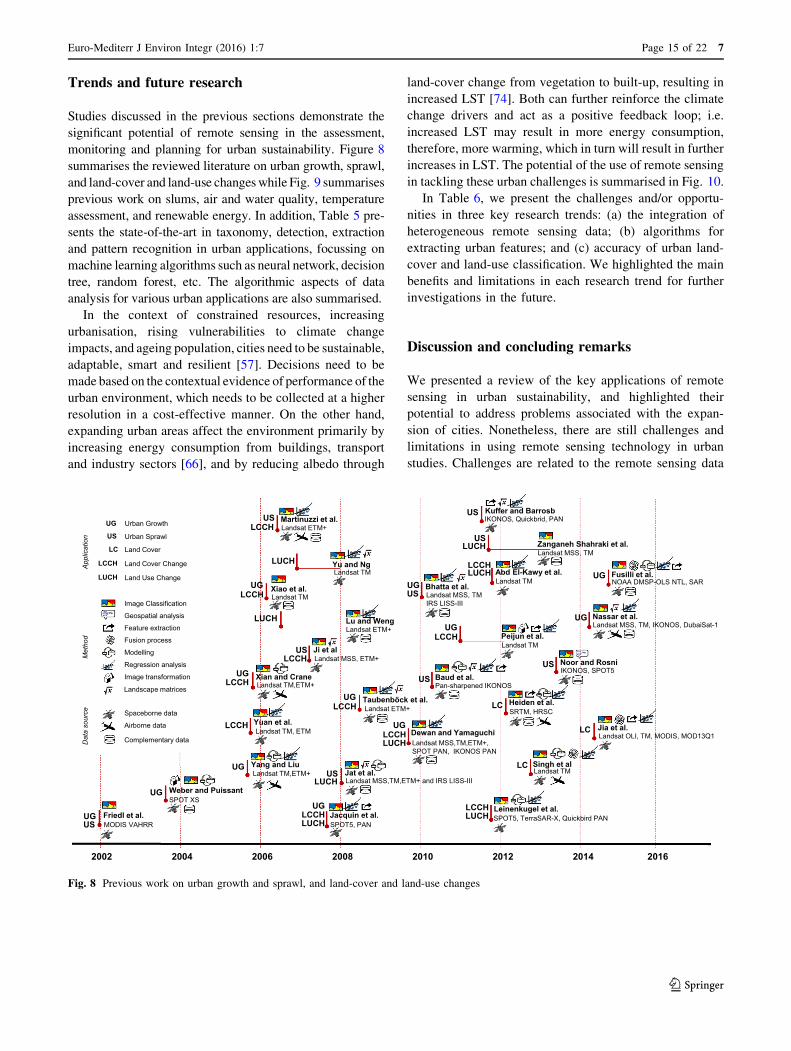
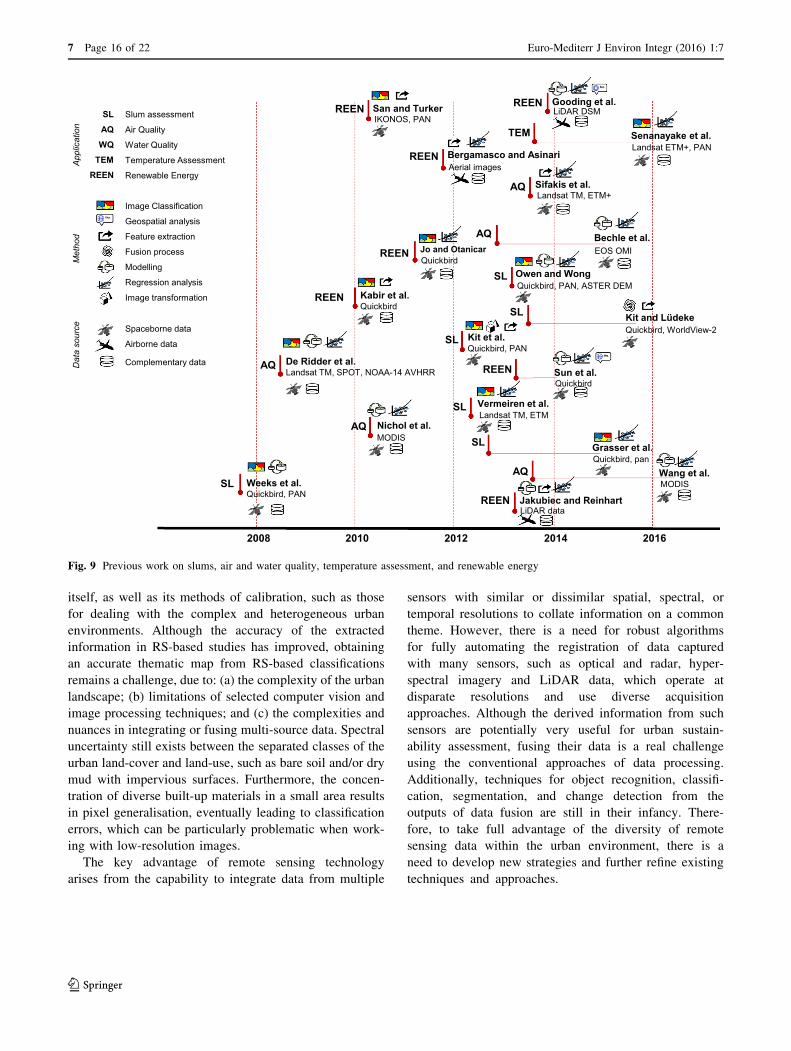
monitoring and planning for urban sustainability. Figure 8
summarises the reviewed literature on urban growth, sprawl,
and land-cover and land-use changeswhile Fig. 9 summarises
previous work on slums, air and water quality, temperature
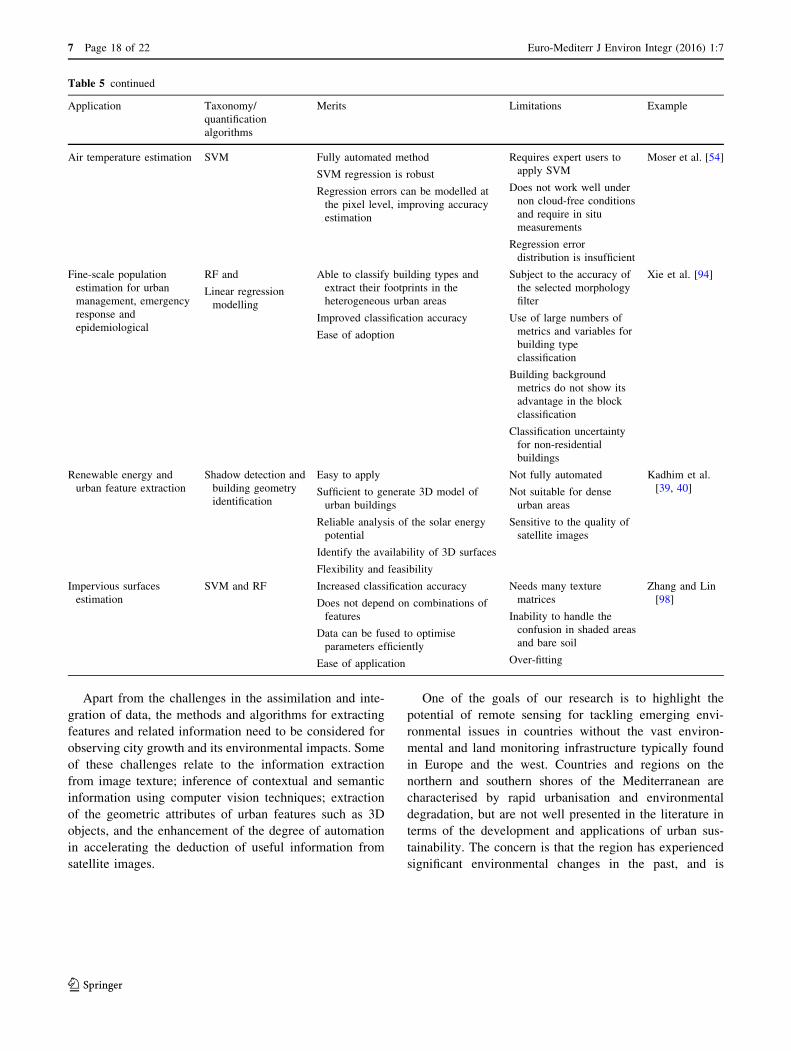
assessment, and renewable energy. In addition, Table 5 pre-
sents the state-of-the-art in taxonomy, detection, extraction
and pattern recognition in urban applications, focussing on
machine learning algorithms such as neural network, decision
tree, random forest, etc. The algorithmic aspects of data
analysis for various urban applications are also summarised.
In the context of constrained resources, increasing
urbanisation, rising vulnerabilities to climate change
impacts, and ageing population, cities need to be sustainable,
adaptable, smart and resilient [57]. Decisions need to be
made based on the contextual evidence of performance of the
urban environment, which needs to be collected at a higher
resolution in a cost-effective manner. On the other hand,
expanding urban areas affect the environment primarily by
increasing energy consumption from buildings, transport
and industry sectors [66], and by reducing albedo through
land-cover change from vegetation to built-up, resulting in
increased LST [74]. Both can further reinforce the climate
change drivers and act as a positive feedback loop; i.e.
increased LST may result in more energy consumption,
therefore, more warming, which in turn will result in further
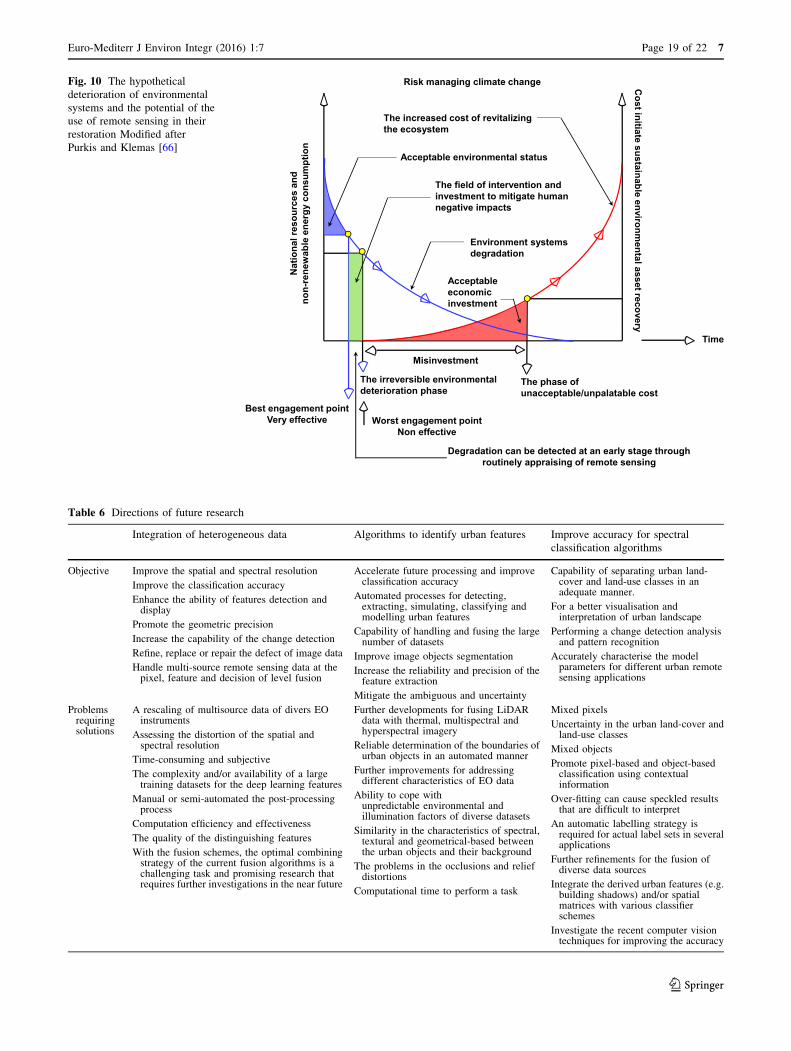
increases in LST. The potential of the use of remote sensing
in tackling these urban challenges is summarised in Fig. 10.
In Table 6, we present the challenges and/or opportu-
nities in three key research trends: (a) the integration of
heterogeneous remote sensing data; (b) algorithms for
extracting urban features; and (c) accuracy of urban land-
cover and land-use classification. We highlighted the main
benefits and limitations in each research trend for further
investigations in the future.
Discussion and concluding remarks
We presented a review of the key applications of remote
sensing in urban sustainability, and highlighted their
potential to address problems associated with the expan-
sion of cities. Nonetheless, there are still challenges and
limitations in using remote sensing technology in urban
studies. Challenges are related to the remote sensing data
Friedl et al.MODIS VAHRR
Weber and Puissant SPOT XS
Xian and Crane
Yuan et al.
Yang and Liu
Landsat TM,ETM+
Landsat TM, ETM
Landsat TM,ETM+
Ji et al
Lu and Weng
Xiao et al.
Landsat MSS, ETM+
Landsat ETM+
Landsat TM
Yu and Ng
Martinuzzi et al. Landsat ETM+
Landsat TM
Jat et al.
Jacquin et al. SPOT5, PAN
Landsat MSS,TM,ETM+ and IRS LISS-III
Dewan and Yamaguchi
Taubenböck et al. Landsat ETM+
Landsat MSS,TM,ETM+, SPOT PAN, IKONOS PAN
Bhatta et al.
Peijun et al.
Baud et al.
Landsat MSS, TMIRS LISS-III
Landsat TM
Pan-sharpened IKONOS
Leinenkugel et al.
Abd El-Kawy et al.
Zanganeh Shahraki et al.
Kuffer and Barrosb
SPOT5, TerraSAR-X, Quickbird PAN
Landsat TM
Landsat MSS, TM
IKONOS, Quickbrid, PAN
Heiden et al.
Singh et al
SRTM, HRSC
Landsat TM LC
LC
Noor and RosniIKONOS, SPOT5
Fusilli et al. NOAA DMSP-OLS NTL, SAR
Jia et al. Landsat OLI, TM, MODIS, MOD13Q1
Nassar et al. Landsat MSS, TM, IKONOS, DubaiSat-1
UG
US
LCCH
LUCH
LC
Urban Growth
Urban Sprawl
Land Cover
Land Cover Change
Land Use Change
2002 2004 2006 2008 2010 2012 2014 2016
Complementary data
Geospatial analysis
Feature extraction
Fusion process
Modelling
Regression analysis
Image transformation
Image Classification
Spaceborne data
Airborne data
Met
hod
ecruos ataD
App
licat
ion
UGUS
UG
UG
LCCH
UGLCCH
USLCCH
Landscape matrices
LUCH
LCCHUG
LUCH
USLCCH
USLUCH
UGLCCHLUCH
LCCHUG
US
LCCHUG
LUCH
LCCHUG
UGUS
LCCHLUCH
USLUCH
US
LCCHLUCH
LC
US
UG
UG
Fig. 8 Previous work on urban growth and sprawl, and land-cover and land-use changes
Euro-Mediterr J Environ Integr (2016) 1:7 Page 15 of 22 7
123
itself, as well as its methods of calibration, such as those
for dealing with the complex and heterogeneous urban
environments. Although the accuracy of the extracted
information in RS-based studies has improved, obtaining
an accurate thematic map from RS-based classifications
remains a challenge, due to: (a) the complexity of the urban
landscape; (b) limitations of selected computer vision and
image processing techniques; and (c) the complexities and
nuances in integrating or fusing multi-source data. Spectral
uncertainty still exists between the separated classes of the
urban land-cover and land-use, such as bare soil and/or dry
mud with impervious surfaces. Furthermore, the concen-
tration of diverse built-up materials in a small area results
in pixel generalisation, eventually leading to classification
errors, which can be particularly problematic when work-
ing with low-resolution images.
The key advantage of remote sensing technology
arises from the capability to integrate data from multiple
sensors with similar or dissimilar spatial, spectral, or
temporal resolutions to collate information on a common
theme. However, there is a need for robust algorithms
for fully automating the registration of data captured
with many sensors, such as optical and radar, hyper-
spectral imagery and LiDAR data, which operate at
disparate resolutions and use diverse acquisition
approaches. Although the derived information from such
sensors are potentially very useful for urban sustain-
ability assessment, fusing their data is a real challenge
using the conventional approaches of data processing.
Additionally, techniques for object recognition, classifi-
cation, segmentation, and change detection from the
outputs of data fusion are still in their infancy. There-
fore, to take full advantage of the diversity of remote
sensing data within the urban environment, there is a
need to develop new strategies and further refine existing
techniques and approaches.
2012 2014 20162008 2010
Grasser et al. Quickbird, pan
Vermeiren et al. Landsat TM, ETM
Kit et al. Quickbird, PAN
Kit and LüdekeQuickbird, WorldView-2
Owen and Wong Quickbird, PAN, ASTER DEM
SL
Bechle et al. EOS OMI
Wang et al.
MODIS Nichol et al. AQ
MODIS
Sifakis et al. Landsat TM, ETM+
Senanayake et al.
AQ
TEMLandsat ETM+, PAN
De Ridder et al.Landsat TM, SPOT, NOAA-14 AVHRR
Gooding et al. LiDAR DSM
REEN
Sun et al. Quickbird
Kabir et al. Quickbird
REEN
Jo and OtanicarREENQuickbird
Jakubiec and Reinhart LiDAR data
Bergamasco and AsinariAerial images
San and TurkerIKONOS, PAN
REEN
AQ
WQ
TEM
REEN
Complementary data
Geospatial analysis
Feature extraction
Fusion process
Modelling
Regression analysis
Image transformation
Image Classification
Spaceborne data
Airborne data
Renewable Energy
Temperature Assessment
Water Quality
Air Quality
SL Slum assessment
App
licat
ion
Met
hod
Dat
a so
urce
Weeks et al.Quickbird, PAN
SL
REEN
AQ
AQ
SL
SL
REEN
SL
SL
AQ
REEN
Fig. 9 Previous work on slums, air and water quality, temperature assessment, and renewable energy
7 Page 16 of 22 Euro-Mediterr J Environ Integr (2016) 1:7
123
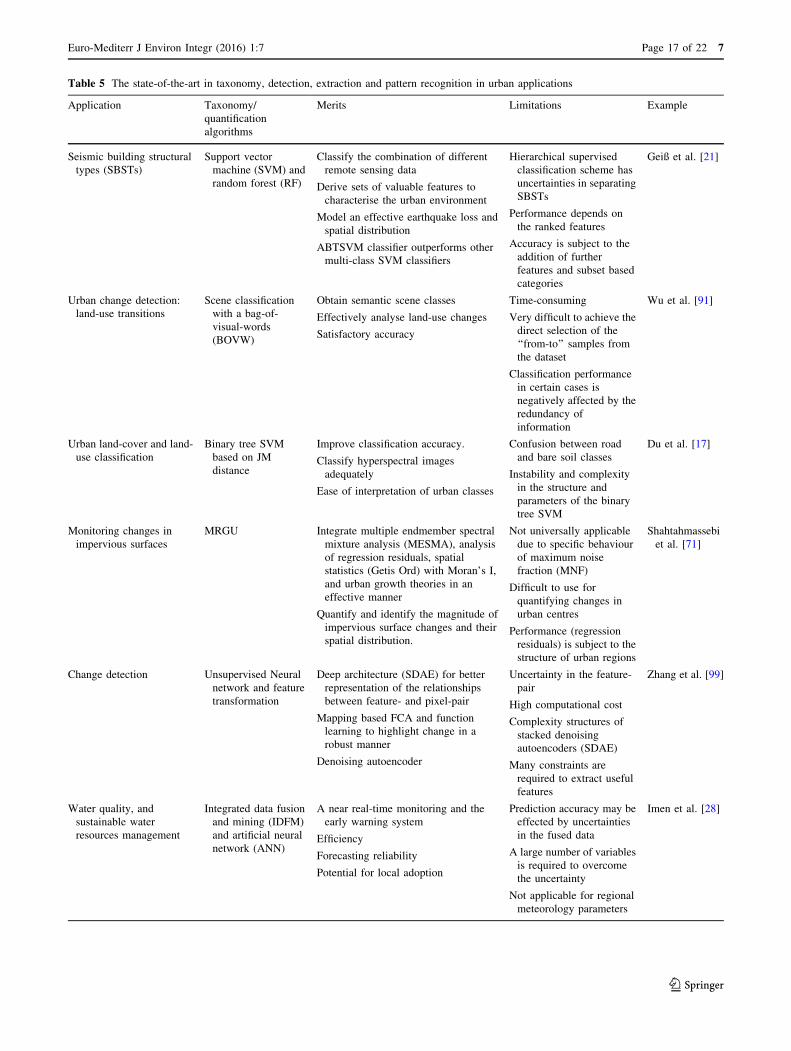
Table 5 The state-of-the-art in taxonomy, detection, extraction and pattern recognition in urban applications
Application Taxonomy/
quantification
algorithms
Merits Limitations Example
Seismic building structural
types (SBSTs)
Support vector
machine (SVM) and
random forest (RF)
Classify the combination of different
remote sensing data
Derive sets of valuable features to
characterise the urban environment
Model an effective earthquake loss and
spatial distribution
ABTSVM classifier outperforms other
multi-class SVM classifiers
Hierarchical supervised
classification scheme has
uncertainties in separating
SBSTs
Performance depends on
the ranked features
Accuracy is subject to the
addition of further
features and subset based
categories
Geiß et al. [21]
Urban change detection:
land-use transitions
Scene classification
with a bag-of-
visual-words
(BOVW)
Obtain semantic scene classes
Effectively analyse land-use changes
Satisfactory accuracy
Time-consuming
Very difficult to achieve the
direct selection of the
‘‘from-to’’ samples from
the dataset
Classification performance
in certain cases is
negatively affected by the
redundancy of
information
Wu et al. [91]
Urban land-cover and land-
use classification
Binary tree SVM
based on JM
distance
Improve classification accuracy.
Classify hyperspectral images
adequately
Ease of interpretation of urban classes
Confusion between road
and bare soil classes
Instability and complexity
in the structure and
parameters of the binary
tree SVM
Du et al. [17]
Monitoring changes in
impervious surfaces
MRGU Integrate multiple endmember spectral
mixture analysis (MESMA), analysis
of regression residuals, spatial
statistics (Getis Ord) with Moran’s I,
and urban growth theories in an
effective manner
Quantify and identify the magnitude of
impervious surface changes and their
spatial distribution.
Not universally applicable
due to specific behaviour
of maximum noise
fraction (MNF)
Difficult to use for
quantifying changes in
urban centres
Performance (regression
residuals) is subject to the
structure of urban regions
Shahtahmassebi
et al. [71]
Change detection Unsupervised Neural
network and feature
transformation
Deep architecture (SDAE) for better
representation of the relationships
between feature- and pixel-pair
Mapping based FCA and function
learning to highlight change in a
robust manner
Denoising autoencoder
Uncertainty in the feature-
pair
High computational cost
Complexity structures of
stacked denoising
autoencoders (SDAE)
Many constraints are
required to extract useful
features
Zhang et al. [99]
Water quality, and
sustainable water
resources management
Integrated data fusion
and mining (IDFM)
and artificial neural
network (ANN)
A near real-time monitoring and the
early warning system
Efficiency
Forecasting reliability
Potential for local adoption
Prediction accuracy may be
effected by uncertainties
in the fused data
A large number of variables
is required to overcome
the uncertainty
Not applicable for regional
meteorology parameters
Imen et al. [28]
Euro-Mediterr J Environ Integr (2016) 1:7 Page 17 of 22 7
123
Apart from the challenges in the assimilation and inte-
gration of data, the methods and algorithms for extracting
features and related information need to be considered for
observing city growth and its environmental impacts. Some
of these challenges relate to the information extraction
from image texture; inference of contextual and semantic
information using computer vision techniques; extraction
of the geometric attributes of urban features such as 3D
objects, and the enhancement of the degree of automation
in accelerating the deduction of useful information from
satellite images.
One of the goals of our research is to highlight the
potential of remote sensing for tackling emerging envi-
ronmental issues in countries without the vast environ-
mental and land monitoring infrastructure typically found
in Europe and the west. Countries and regions on the
northern and southern shores of the Mediterranean are
characterised by rapid urbanisation and environmental
degradation, but are not well presented in the literature in
terms of the development and applications of urban sus-
tainability. The concern is that the region has experienced
significant environmental changes in the past, and is
Table 5 continued
Application Taxonomy/
quantification
algorithms
Merits Limitations Example
Air temperature estimation SVM Fully automated method
SVM regression is robust
Regression errors can be modelled at
the pixel level, improving accuracy
estimation
Requires expert users to
apply SVM
Does not work well under
non cloud-free conditions
and require in situ
measurements
Regression error
distribution is insufficient
Moser et al. [54]
Fine-scale population
estimation for urban
management, emergency
response and
epidemiological
RF and
Linear regression
modelling
Able to classify building types and
extract their footprints in the
heterogeneous urban areas
Improved classification accuracy
Ease of adoption
Subject to the accuracy of
the selected morphology
filter
Use of large numbers of
metrics and variables for
building type
classification
Building background
metrics do not show its
advantage in the block
classification
Classification uncertainty
for non-residential
buildings
Xie et al. [94]
Renewable energy and
urban feature extraction
Shadow detection and
building geometry
identification
Easy to apply
Sufficient to generate 3D model of
urban buildings
Reliable analysis of the solar energy
potential
Identify the availability of 3D surfaces
Flexibility and feasibility
Not fully automated
Not suitable for dense
urban areas
Sensitive to the quality of
satellite images
Kadhim et al.
[39, 40]
Impervious surfaces
estimation
SVM and RF Increased classification accuracy
Does not depend on combinations of
features
Data can be fused to optimise
parameters efficiently
Ease of application
Needs many texture
matrices
Inability to handle the
confusion in shaded areas
and bare soil
Over-fitting
Zhang and Lin
[98]
7 Page 18 of 22 Euro-Mediterr J Environ Integr (2016) 1:7
123
Time
Cost initiate sustainable environm
ental asset recovery
Risk managing climate change
Nat
iona
l res
ourc
es a
nd
non-
rene
wab
le e
nerg
y co
nsum
ptio
n
Acceptable environmental status
The field of intervention and investment to mitigate human negative impacts
Environment systems degradation
Acceptable economic investment
The increased cost of revitalizing the ecosystem
Misinvestment
The irreversible environmental deterioration phase
The phase of unacceptable/unpalatable cost
Best engagement pointVery effective Worst engagement point
Non effective
Degradation can be detected at an early stage through routinely appraising of remote sensing
Fig. 10 The hypothetical
deterioration of environmental
systems and the potential of the
use of remote sensing in their
restoration Modified after
Purkis and Klemas [66]
Table 6 Directions of future research
Integration of heterogeneous data Algorithms to identify urban features Improve accuracy for spectral
classification algorithms
Objective Improve the spatial and spectral resolution
Improve the classification accuracy
Enhance the ability of features detection anddisplay
Promote the geometric precision
Increase the capability of the change detection
Refine, replace or repair the defect of image data
Handle multi-source remote sensing data at thepixel, feature and decision of level fusion
Accelerate future processing and improveclassification accuracy
Automated processes for detecting,extracting, simulating, classifying andmodelling urban features
Capability of handling and fusing the largenumber of datasets
Improve image objects segmentation
Increase the reliability and precision of thefeature extraction
Mitigate the ambiguous and uncertainty
Capability of separating urban land-cover and land-use classes in anadequate manner.
For a better visualisation andinterpretation of urban landscape
Performing a change detection analysisand pattern recognition
Accurately characterise the modelparameters for different urban remotesensing applications
Problemsrequiringsolutions
A rescaling of multisource data of divers EOinstruments
Assessing the distortion of the spatial andspectral resolution
Time-consuming and subjective
The complexity and/or availability of a largetraining datasets for the deep learning features
Manual or semi-automated the post-processingprocess
Computation efficiency and effectiveness
The quality of the distinguishing features
With the fusion schemes, the optimal combiningstrategy of the current fusion algorithms is achallenging task and promising research thatrequires further investigations in the near future
Further developments for fusing LiDARdata with thermal, multispectral andhyperspectral imagery
Reliable determination of the boundaries ofurban objects in an automated manner
Further improvements for addressingdifferent characteristics of EO data
Ability to cope withunpredictable environmental andillumination factors of diverse datasets
Similarity in the characteristics of spectral,textural and geometrical-based betweenthe urban objects and their background
The problems in the occlusions and reliefdistortions
Computational time to perform a task
Mixed pixels
Uncertainty in the urban land-cover andland-use classes
Mixed objects
Promote pixel-based and object-basedclassification using contextualinformation
Over-fitting can cause speckled resultsthat are difficult to interpret
An automatic labelling strategy isrequired for actual label sets in severalapplications
Further refinements for the fusion ofdiverse data sources
Integrate the derived urban features (e.g.building shadows) and/or spatialmatrices with various classifierschemes
Investigate the recent computer visiontechniques for improving the accuracy
Euro-Mediterr J Environ Integr (2016) 1:7 Page 19 of 22 7
123
projected to be exposed to significant risks from climate
change and increasing human impacts to its natural
resources and ecosystems. Reviews on advances in remote
sensing presented here are envisaged to encourage further
adoption in urban sustainability applications, in particular
in the countries and regions most affected by global envi-
ronmental change.
Acknowledgments This research has been funded by a grant from
the Higher Committee of Education Development (HCED) in Iraq.
The authors gratefully acknowledge the grant support by HCED for
achieving this work. The authors would also like to thank Mr
Mohammed Salih and Mrs Amera Ali for a useful discussion on the
applications of urban remote sensing. The authors are thankful to
three anonymous reviewers and the associate editor for their helpful
comments.
Compliance with ethical standards
Conflict of interest The authors declare that they have no conflict of
interest.
Open Access This article is distributed under the terms of the Creative
Commons Attribution 4.0 International License (http://creative
commons.org/licenses/by/4.0/), which permits unrestricted use, distri-
bution, and reproduction in anymedium, provided you give appropriate
credit to the original author(s) and the source, provide a link to the
Creative Commons license, and indicate if changes were made.
References
1. Abd El-Kawy OR et al (2011) Land use and land cover change
detection in the western Nile delta of Egypt using remote sensing
data. Appl Geogr 31(2):483–494
2. Ahamed T et al (2011) A review of remote sensing methods for
biomass feedstock production. Biomass Bioenergy
35(7):2455–2469
3. Ameen RFM et al (2015) A critical review of environmental
assessment tools for sustainable urban design. Environ Impact
Assess Rev 55:110–125
4. Baluyan H et al (2013) Novel approach for rooftop detection
using support vector machine. ISRN Machine Vision, Egypt
5. Bechle MJ et al (2013) Remote sensing of exposure to NO 2:
satellite versus ground-based measurement in a large urban area.
Atmos Environ 69:345–353
6. Bergamasco L, Asinari P (2011) Scalable methodology for the
photovoltaic solar energy potential assessment based on available
roof surface area: further improvements by ortho-image analysis
and application to Turin (Italy). Sol Energy 85(11):2741–2756
7. Bhatta B (2010) Analysis of urban growth and sprawl from
remote sensing data. Springer, New York
8. Bhatta B et al (2010) Quantifying the degree-of-freedom, degree-
of-sprawl, and degree-of-goodness of urban growth from remote
sensing data. Appl Geogr 30(1):96–111
9. Bhatta B et al (2010) Urban sprawl measurement from remote
sensing data. Appl Geogr 30(4):731–740
10. Calvert K et al (2013) Toward renewable energy geo-information
infrastructures: applications of GIScience and remote sensing that
build institutional capacity. Renew Sustain Energy Rev 18:416–429
11. Chawira M et al (2013) Remote sensing based water quality
monitoring in Chivero and Manyame lakes of Zimbabwe. Phys
Chem Earth Parts A/B/C 66:38–44
12. Cockx K et al (2014) Quantifying uncertainty in remote sensing-
based urban land-use mapping. Int J Appl Earth Obs Geoinf
31:154–166
13. Curran PJ (1985) Principles of remote sensing. Longman Inc,
London
14. Dewan AM, Yamaguchi Y (2009) Land use and land cover
change in Greater Dhaka, Bangladesh: using remote sensing to
promote sustainable urbanization. Appl Geogr 29(3):390–401
15. De Ridder K et al (2008) Simulating the impact of urban sprawl
on air quality and population exposure in the German Ruhr area.
Part II: Development and evaluation of an urban growth scenario.
Atmos Environ 42(30):7070–7077
16. Du P et al (2010) Monitoring urban land cover and vegetation
change by multi-temporal remote sensing information. Min Sci
Technol (China) 20(6):922–932
17. Du P et al (2012) A novel binary tree support vector machine for
hyperspectral remote sensing image classification. Opt Commun
285(13–14):3054–3060
18. Easterlin RA et al (2011) The impact of modern economic growth
on urban–rural differences in subjective well-being. World Dev
39(12):2187–2198
19. Friedl MA et al (2002) Global land cover mapping from MODIS:
algorithms and early results. Remote SensEnviron 83(1–2):287–302
20. Fusilli L et al (2014) Urban growth assessment around Winam
Gulf of Kenya based on satellite imagery. Acta Astronaut
93:279–290
21. Geiß C et al (2015) Estimation of seismic building structural
types using multi-sensor remote sensing and machine learning
techniques. ISPRS J Photogr Remote Sens 104:175–188
22. Gooding J et al (2013) Solar city indicator: a methodology to
predict city level PV installed capacity by combining physical
capacity and socio-economic factors. Sol Energy 95:325–335
23. Graesser J et al (2012) Image based characterization of formal
and informal neighborhoods in an urban landscape. IEEE J Sel
Top Appl Earth Obs Remote Sens 5(4):1164–1176
24. Hagenlocher M et al (2012) Integrated assessment of the envi-
ronmental impact of an IDP camp in Sudan based on very high
resolution multi-temporal satellite imagery. Remote Sens Environ
126:27–38
25. Hamidi S, Ewing R (2014) A longitudinal study of changes in
urban sprawl between 2000 and 2010 in the United States. Landsc
Urban Plan 128:72–82
26. Heiden U et al (2012) Urban structure type characterization using
hyperspectral remote sensing and height information. Landsc
Urban Plan 105(4):361–375
27. Hunink JE et al (2015) Estimating groundwater use patterns of
perennial and seasonal crops in a Mediterranean irrigation
scheme, using remote sensing. Agric Water Manag 162:47–56
28. Imen S et al (2015) Developing the remote sensing-based early
warning system for monitoring TSS concentrations in Lake
Mead. J Environ Manag 160:73–89
29. Jackson LE (2003) The relationship of urban design to human
health and condition. Landsc Urban Plan 64(4):191–200
30. Jacquin A et al (2008) A hybrid object-based classification
approach for mapping urban sprawl in periurban environment.
Landsc Urban Plan 84(2):152–165
31. Jakubiec JA, Reinhart CF (2013) A method for predicting city-
wide electricity gains from photovoltaic panels based on LiDAR
and GIS data combined with hourly Daysim simulations. Sol
Energy 93:127–143
32. Jat MK et al (2008) Monitoring and modelling of urban sprawl
using remote sensing and GIS techniques. Int J Appl Earth Obs
Geoinf 10(1):26–43
33. Jay S, Guillaume M (2014) A novel maximum likelihood based
method for mapping depth and water quality from hyperspectral
remote-sensing data. Remote Sens Environ 147:121–132
7 Page 20 of 22 Euro-Mediterr J Environ Integr (2016) 1:7
123
34. Jensen JR (2009) Remote sensing of the environment: an earth
resource perspective 2/e. Pearson Education, India
35. Ji W et al (2006) Characterizing urban sprawl using multi-stage
remote sensing images and landscape metrics. Comput Environ
Urban Syst 30(6):861–879
36. Jia K et al (2014) Land cover classification of finer resolution
remote sensing data integrating temporal features from time
series coarser resolution data. ISPRS J Photogr Remote Sens
93:49–55
37. Jiang D et al (2013) Evaluating the spatio-temporal variation of
China’s offshore wind resources based on remotely sensed wind
field data. Renew Sustain Energy Rev 24:142–148
38. Kabir MH et al (2010) Calculation of bright roof-tops for solar
PV applications in Dhaka Megacity, Bangladesh. Renew Energy
35(8):1760–1764
39. Kadhim NMM et al (2015) Automatic extraction of urban
structures based on shadow information satellite imagery. In:
14th conference of international building performance simulation
association (building simulation 2015), 7–9 Dec 2015. Hyder-
abad, pp 2607–2614
40. Kadhim NMSM et al (2015) Shadow detection from very high
resolution satellite image using grabcut segmentation and ratio-
band algorithms. Int Archiv Photogr Remote Sens Spat Inf Sci
40(suppl W2 XL.3):95–101. doi:10.5194/isprsarchives-XL-3-
W2-95-2015
41. Kaiser MF, Ahmed S (2013) Optimal thermal water locations
along the Gulf of Suez coastal zones, Egypt. Renew Energy
55:374–379
42. Kit O, Ludeke M (2013) Automated detection of slum area
change in Hyderabad, India using multitemporal satellite ima-
gery. ISPRS J Photogr Remote Sens 83:130–137
43. Kit O et al (2012) Texture-based identification of urban slums in
Hyderabad, India using remote sensing data. Appl Geogr
32(2):660–667
44. Kohli D et al (2012) An ontology of slums for image-based
classification. Comput Environ Urban Syst 36(2):154–163
45. Kuffer M, Barrosb J (2011) Urban morphology of unplanned
settlements: the use of spatial metrics in VHR remotely sensed
images. Proc Environ Sci 7:152–157
46. Le-Xiang Q et al (2006) Impacts of land use and cover change on
land surface temperature in the Zhujiang Delta. Pedosphere
16(6):681–689
47. Leinenkugel P et al (2011) Settlement detection and impervious
surface estimation in the Mekong Delta using optical and SAR
remote sensing data. Remote Sens Environ 115(12):3007–3019
48. Li C-F, Yin J-Y (2013) A study on urban thermal field of
Shanghai using multi-source remote sensing data. J Indian Soc
Remote Sens 41(4):1009–1019
49. Longley PA (2002) Geographical information systems: will
developments in urban remote sensing and GIS lead to ‘better’
urban geography? Progr Hum Geogr 26(2):231–239
50. Lu D, Weng Q (2006) Use of impervious surface in urban land-
use classification. Remote Sens Environ 102(1–2):146–160
51. Martinuzzi S et al (2007) Land development, land use, and urban
sprawl in Puerto Rico integrating remote sensing and population
census data. Landsc Urban Plan 79(3–4):288–297
52. Masek JG et al (2000) Dynamics of urban growth in the Wash-
ington DC metropolitan area, 1973–1996, from Landsat obser-
vations. Int J Remote Sens 21(18):3473–3486
53. Merbitz H et al (2012) GIS-based identification of spatial vari-
ables enhancing heat and poor air quality in urban areas. Appl
Geogr 33:94–106
54. Moser G et al (2015) Estimation of air surface temperature from
remote sensing images and pixelwise modeling of the estimation
uncertainty through support vector machines. IEEE J Sel Top
Appl Earth Obs Remote Sens 8(1):332–349
55. Mourshed M et al (2015) Smart grid futures: perspectives on the
integration of energy and ICT services. Energy Proc 75:1132–1137
56. Mourshed M (2016) Climatic parameters for building energy
applications: a temporal-geospatial assessment of temperature
indicators. Renew Energy 94:55–71
57. Mourshed M et al (2016) SMART: a process-oriented method-
ology for resilient smart cities. In: 2016 IEEE international smart
cities conference (ISC2), Trento, 12–15 September 2016
58. NASA (2001) Satellite maps provide better urban sprawl insight.
NASA, USA
59. Nassar AK et al (2014) Developing the desert: the pace and
process of urban growth in Dubai. Comput Environ Urban Syst
45:50–62
60. Nichol JE et al (2010) A 3D aerosol and visibility information
system for urban areas using remote sensing and GIS. Atmos
Environ 44(21):2501–2506
61. Noor NM, Rosni NA (2013) Determination of spatial factors in
measuring urban sprawl in Kuantan using remote sensing and
GIS. Proc Soc Behav Sci 85:502–512
62. Ok AO (2013) Automated detection of buildings from single
VHR multispectral images using shadow information and graph
cuts. ISPRS J Photogr Remote Sens 86:21–40
63. Owen KK, Wong DW (2013) An approach to differentiate
informal settlements using spectral, texture, geomorphology and
road accessibility metrics. Appl Geogr 38:107–118
64. Patino JE, Duque JC (2013) A review of regional science
applications of satellite remote sensing in urban settings. Comput
Environ Urban Syst 37:1–17
65. Pham HM et al (2011) A case study on the relation between city
planning and urban growth using remote sensing and spatial
metrics. Landsc Urban Plan 100(3):223–230
66. Purkis SJ, Klemas VV (2011) Remote sensing and global envi-
ronmental change. Wiley, New York
67. Rhinane H et al (2011) Detecting slums from SPOT data in
Casablanca Morocco using an object based approach. J Geogr Inf
Syst 3(3):217
68. Rusu E, Onea F (2013) Evaluation of the wind and wave energy
along the Caspian Sea. Energy 50:1–14
69. Schneider A (2012) Monitoring land cover change in urban and
peri-urban areas using dense time stacks of Landsat satellite
data and a data mining approach. Remote Sens Environ
124:689–704
70. Senanayake I et al (2013) Remote sensing based analysis of urban
heat islands with vegetation cover in Colombo city, Sri Lanka
using Landsat-7 ETM? data. Urban Clim 5:19–35
71. Shahtahmassebi AR et al (2016) Remote sensing of impervious
surface growth: a framework for quantifyingurban expansion and re-
densification mechanisms. Int J Appl Earth Obs Geoinf 46:94–112
72. Sifakis NI et al (2014) CHRISTINE Code for High ResolutIonSatellite mapping of optical ThIckness and ANgstrom Exponent.
Part II: first application to the urban area of Athens, Greece and
comparison to results from previous contrast-reduction codes.
Comput Geosci 62:142–149
73. Singh KK et al (2012) LiDAR-Landsat data fusion for large-area
assessment of urban land cover: balancing spatial resolution, data
volume and mapping accuracy. ISPRS J Photogr Remote Sens
74:110–121
74. Stone B, Norman JM (2006) Land use planning and surface heat
island formation: a parcel-based radiation flux approach. Atmos
Environ 40(19):3561–3573
75. Sun C et al (2013) Quantifying different types of urban growth
and the change dynamic in Guangzhou using multi-temporal
remote sensing data. Int J Appl Earth Obs Geoinf 21:409–417
76. Sun Y-W et al (2013) GIS-based approach for potential analysis
of solar PV generation at the regional scale: a case study of Fujian
Province. Energy Policy 58:248–259
Euro-Mediterr J Environ Integr (2016) 1:7 Page 21 of 22 7
123
77. Taubenbock H, Kraff N (2014) The physical face of slums: a
structural comparison of slums in Mumbai, India, based on
remotely sensed data. J Hous Built Environ 29(1):15–38
78. Taubenbock H et al (2009) Urbanization in India—spatiotem-
poral analysis using remote sensing data. Comput Environ Urban
Syst 33(3):179–188
79. Trochta JT et al (2015) Remote sensing of physical cycles in
Lake Superior using a spatio-temporal analysis of optical water
typologies. Remote Sens Environ 171:149–161
80. United Nations (2014) World urbanization prospects: the 2014
revision. Pop. Division, Department of Economic and Social
Affairs, UN, New York
81. Van de Voorde T et al (2011) Mapping form and function in
urban areas: an approach based on urban metrics and continuous
impervious surface data. Landsc Urban Plan 102(3):143–155
82. Van Der Meer F et al (2014) Geologic remote sensing for
geothermal exploration: a review. Int J Appl Earth Obs Geoinf
33:255–269
83. Vermeiren K et al (2012) Urban growth of Kampala, Uganda:
pattern analysis and scenario development. Landsc Urban Plan
106(2):199–206
84. Walsh-Thomas JM et al (2012) Further evidence of impacts of
large-scale wind farms on land surface temperature. Renew
Sustain Energy Rev 16(8):6432–6437
85. Wang C et al (2013) Air quality evaluation on an urban scale
based on MODIS satellite images. Atmos Res 132:22–34
86. Wang S, Koch B (2010) Determining profits for solar energy with
remote sensing data. Energy 35(7):2934–2938
87. Wang W-W et al (2003) Analysis on the spatial distribution
variation characteristic of urban heat environmental quality and
its mechanism. Chin Geogr Sci 13(1):39–47
88. Weber C, Puissant A (2003) Urbanization pressure and modeling
of urban growth: example of the Tunis metropolitan area. Remote
Sens Environ 86(3):341–352
89. Weeks JR et al (2007) Can we spot a neighborhood from the air?
Defining neighborhood structure in Accra, Ghana. GeoJournal
69(1–2):9–22
90. Weng Q et al (2007) Assessing the effects of land use and land
cover patterns on thermal conditions using landscape metrics in
city of Indianapolis, United States. Urban Ecosyst 10(2):203–219
91. Wu C et al (2016) A scene change detection framework for multi-
temporal very high resolution remote sensing images. Signal
Process 124:184–197
92. Xian G, Crane M (2005) Assessments of urban growth in the
Tampa Bay watershed using remote sensing data. Remote Sens
Environ 97(2):203–215
93. Xiao J et al (2006) Evaluating urban expansion and land use
change in Shijiazhuang, China, by using GIS and remote sensing.
Landsc Urban Plan 75(1–2):69–80
94. Xie Y et al (2015) Population estimation of urban residential
communities using remotely sensed morphologic data. IEEE
Geosci Remote Sens Lett 12(5):1111–1115
95. Yang X, Liu Z (2005) Use of satellite-derived landscape imper-
viousness index to characterize urban spatial growth. Comput
Environ Urban Syst 29(5):524–540
96. Yu XJ, Ng CN (2007) Spatial and temporal dynamics of urban
sprawl along two urban–rural transects: a case study of
Guangzhou, China. Landsc Urban Plan 79(1):96–109
97. Yuan F et al (2005) Land cover classification and change analysis
of the twin cities (Minnesota) metropolitan area by multitemporal
Landsat remote sensing. Remote Sens Environ 98(2–3):317–328
98. Zhang H, Lin H (eds) (2015) Feature selection for urban imper-
vious surfaces estimation using optical and SAR images. In: 2015
joint urban remote sensing event (JURSE). 30 March 2015–1
April 2015
99. Zhang P et al (2016) Change detection based on deep feature rep-
resentation and mapping transformation for multi-spatial-resolution
remote sensing images. ISPRS J Photogr Remote Sens 116:24–41
7 Page 22 of 22 Euro-Mediterr J Environ Integr (2016) 1:7
123