Embed Size (px)
Citation preview


Advances in the Geological Storageof Carbon Dioxide

NATO Science Series
Programme.
Sub-Series
I. Life and Behavioural Sciences IOS PressII. Mathematics, Physics and ChemistryIII. Computer and Systems Science IOS PressIV. Earth and Environmental Sciences
The NATO Science Series continues the series of books published formerly as the NATO ASI Series.
The NATO Science Programme offers support for collaboration in civil science between scientists ofcountries of the Euro-Atlantic Partnership Council.The types of scientific meeting generally supportedare “Advanced Study Institutes” and “Advanced Research Workshops”, and the NATO Science Seriescollects together the results of these meetings. The meetings are co-organized by scientists fromNATO countries and scientists from NATO’s Partner countries – countries of the CIS and Central andEastern Europe.
Advanced Study Institutes are high-level tutorial courses offering in-depth study of latest advancesin a field.Advanced Research Workshops are expert meetings aimed at critical assessment of a field, andidentification of directions for future action.
As a consequence of the restructuring of the NATO Science Programme in 1999, the NATO ScienceSeries was re-organized to the four sub-series noted above. Please consult the following web sites forinformation on previous volumes published in the Series.
http://www.nato.int/science
http://www.iospress.nl
Series II: Mathematics, Physics and Chemistry – Vol. 65
http://www.springer.com
Springer
Springer
The Series is published by IOS Press, Amsterdam, and Springer
A Series presenting the results of scientific meetings supported under the NATO Science
in conjunction with the NATO Public Diplomacy Division

Advances in the GeologicalStorage of Carbon Dioxide
International Approaches to ReduceAnthropogenic Greenhouse Gas Emissions
Published in cooperation with NATO Public Diplomacy Division
Siberian Branch-Institute of Pertoleum ChemistryRussian Academy of Sciences,Tomsk, Russia
Universita di Roma "La Sapienza", Rome, Italy
Universita di Roma "La Sapienza", Rome, Italy
edited by
and
S. Lombardi
L.K. Altunina
S.E. Beaubien

A C.I.P. Catalogue record for this book is available from the Library of Congress
.
ISBN-13 978-1-4020-4470-0 (PB)ISBN-10 1-4020-4469-0 (HB)ISBN-13 978-1-4020-4469-4 (HB)ISBN-10 1-4020-4471-2 (e-book)ISBN-13 978-1-4020-4471-7 (e-book)
Published by Springer,P.O. Box 17, 3300 AA Dordrecht, The Netherlands.
www.springer.com
Printed on acid-free paper
All Rights Reserved© 2006 SpringerNo part of this work may be reproduced, stored in a retrieval system, or transmitted in anyform or by any means, electronic, mechanical, photocopying, microfilming, recording orotherwise, without written permission from the Publisher, with the exception of anymaterial supplied specifically for the purpose of being entered and executed on a
Printed in the Netherlands.
computer system, for exclusive use by the purchaser of the work.
Proceedings of the NATO Advanced Research Workshop onAdvances in CO2 Geological Sequestration in Eastern and Western
ISBN-10 1-4020-4470-4 (PB)
November 15-18, 2004
European, CountriesTomsk, Russia
Contents
Contributing Authors ix
Preface xiii
xv
PART I Anthropogenic Greenhouse Gases in the Atmosphere 1
Study of Long-Term Variations of CO2 and CO Concentrations in
the Ground Atmospheric Layer near the City of Tomsk (Western
Siberia) 3
B.D. Belan, A.V. Fofonov, T.K. Sklyadneva and G.N.
Tolmachev
Dynamics of the Vertical Distribution of CO2 and CO
Concentrations over Western Siberia (1997-2003). 11
M.Yu. Arshinov, B.D. Belan, G. Inoue, T. Machida, M.V.
Panchenko and A.V. Fofonov
Carbon Balance and the Emission of Greenhouse Gases in Boreal
Forests and Bogs of Siberia 17
E.A. Vaganov, S.P. Efremov and A.A. Onuchin
The Interaction of CO2 Between the Atmosphere and Surface
Waters of Lake Baikal and the Influence of Water Composition 35
Acknowledgements
vi
V.M. Domysheva, M.V. Sakirko, M.V. Panchenko and D.A.
Pestunov
Remote Sensing and GIS for Spatial Analysis of Anthropogenic
Carbon Oxide Emissions 47
Yu.M. Polishchuk and O.S. Tokareva
The Sources of Carcinogenic PAH Emission in Aluminium
Production using Soderberg Cells 57
L.I.Kurteeva, S.V.Morozov and A.G.Anshits
PART II Permafrost CO2 Storage 67
Distribution of Permafrost in Russia 69
V.P. Melnikov and D.S. Drozdov
Characteristics of Permafrost in Siberia 81
A.D. Duchkov
Possibilities of SO2 Storage in Geological Strata of Permafrost
Terrain 93
A.G. Anshits, N.P. Kirik and B.V. Shibistov
Cryogels – A Promising Material for Underground Works in
Permafrost 103
L.K. Altunina, V.A. Kuvshinov and S.N. Dolgikh
Subsurface Carbon Dioxide Storage Through Clathrate Hydrate
Formation 111
P. Jadhawar, A.H. Mohammadi, J. Yang, B. Tohidi
PART III Natural Analogues of CO2 Storage 127
What Can We Learn from Natural Analogues? 129
J. M. Pearce
Near-Surface Gas Geochemistry Techniques to Assess and
2 141
S. Lombardi, A. Annunziatellis, S.E. Beaubien and G. Ciotoli
Geochemical Interactions between CO2, Pore-Waters and
Reservoir Rocks 157
Contents
Monitor CO Geological Sequestration Sites

vii
I. Czernichowski-Lauriol, C. Rochelle, I. Gaus, M. Azaroual,
J. Pearce, and P. Durst
Study of Natural CO2 Emissions in Different Italian Geological
Scenarios 175
N. Voltattorni, G. Caramanna, D. Cinti, G. Galli, L. Pizzino
and F. Quattrocchi
Natural Leakage of Helium from Italian Sedimentary Basins of the
191
G. Ciotoli, S. Lombardi and F. Zarlenga
Tectonically Controlled Methane Escape in Lake Baikal 203
J. Klerkx, M. De Batist, J. Poort, R. Hus, P. Van Rensbergen,
O. Khlystov and N. Granin
PART IV Active CO2 Injection Sites 221
The IEA Weyburn CO2 Monitoring and Storage Project 223
J.B. Riding
Assessment of the Long-Term Fate of CO2 Injected into the
Weyburn Field 231
M.J. Stenhouse, W. Zhou and R. Arthur
Strontium Isotope (87
Sr/86
Sr) Chemistry in Produced Oil Field
Waters: The IEA CO2 Monitoring and Storage Project 243
F. Quattrocchi, M. Barbieri, R. Bencini, D. Cinti, K.
Durocher, G. Galli, L. Pizzino, M. Shevalier and N.
Voltattorni
Optimization of CO2 Injection for Sequestration / Enhanced Oil
Recovery and Current Status in Canada 261
T. Babadagli
The Use of CO2 and Combustion Gases for Enhanced Oil
Recovery in Russia 271
V.A. Kuvshinov
Controls of CO2 Filtration in Heterogeneous Reservoirs with
Foam-Emulsion Systems 277
A.G. Telin
Contents
Adriatic Structural Margin
viii
State of CO2 Capture and Subsurface Storage Activities in
Germany 289
B.M. Krooss and F. May
Geophysical Monitoring of the CO2 Plume at Sleipner, North Sea 303
A. Chadwick, R. Arts , O. Eiken , P. Williamson and G.
Williams
4-D Seismics, Gas-Hydrate Detection and Overpressure Prediction
as a Combined Methodology for Application to CO2 Sequestration 315
S. Persoglia, J.M. Carcione, G. Rossi And D. Gei
PART V The Way Forward 325
The Role of Fossil Fuels in the 21st Century 327
I. Lakatos and J. Lakatos-Szabó
Stakeholder Acceptance and Understanding of CO2 Geological
Storage 345
S. Vercelli and R. Tambelli
CO2GeoNet – An EC-funded “Network of Excellence” to Study
the Geological Storage of CO2 359
N. Riley
Contents

Contributing Authors
Below is an listing of all participating authors, organised by country and
institution. Delegates to the workshop are highlighted in bold.
Belgium
International Bureau for Environmental Studies - Brussels, Belgium
- J. Klerkx, S.E. Kolobova
University of Ghent - Renard Centre of Marine Geology, Ghent, Belgium
- M. De Batist, J. Poort, R. Hus, P. Van Rensbergen
Canada
Alberta Research Council - 3608-33rd Street, NW; Calgary, AB, T2L 2A6,
Canada
- K. Durocher
University of Calgary - Department of Geology & Geophysics; 2500
University Dr. NW; Calgary, AB, T2N 1N4, Canada
- M. Shevalier
University of Alberta - Civil and Environmental Engineering; School of
Petroleum and Mining; 3-112 Markin/CNRL – NREF; Edmonton, Alberta,
T6G 2W2, Canada
- T. Babadagli
x Contributing Authors
France
French Geological Survey (BRGM) - 3 avenue Claude Guillemin, BP 6009;
45060 Orleans Cedex 2, France
- M. Azaroual, I. Czernichowski-Lauriol, P. Durst and I. Gaus
Germany
Bundesanstalt für Geowissenschaften und Rohstoffe (BGR) - Stilleweg 2
D-30655 Hannover, Germay
- F. May
RWTH-Aachen University - Institute of Geology and Geochemistry of
Petroleum and Coal; Lochnerstr. 4-20; D-52056 Aachen, Germany
- B.M. Krooss
Holland
Netherlands Institute of Applied Geoscience (TNO) - National Geological
Survey; Kriekenpitplein 18, PO Box 80015; 3508 TA Utrecht, Holland
- R. Arts
Hungary
University of Miskolc - Research Institute of Applied Chemistry; 3515
Miskolc-Egyetemváros POB 2; Hungary
- I. Lakatos and J. Lakatos-Szabó
Italy
ENEA-Cr- Casaccia- Prot/Prev, Italy
- F. Zarlenga
IGAG-CNR - Università di Roma “La Sapienza”; Rome, Italy
- M. Barbieri
Istituto Nazionale di Oceanografia e di Geofisica (OGS) – Trieste; Italy
- J.M. Carcione, D. Gei, S. Persoglia and G. Rossi
Istituto Nazionale di Geofisica e Vulcanologia (INGV) - Rome, Italy
- R. Bencini, G. Caramanna, D. Cinti, G. Galli, L. Pizzino, F.
Quattrocchi and N. Voltattorni

xiContributing Authors
Università di Roma “La Sapienza” - Dipartimento di Psicologia Dinamica e
Clinica; Rome, Italy
- R. Tambelli and S. Vercelli
Università di Roma “La Sapienza” - Dipartimento di Scienze della Terra;
Piazzale Aldo Moro, 5; 00185 Roma, Italy
- A. Annunziatellis, S.E. Beaubien, G. Ciotoli and S. Lombardi
Japan
National Institute for Environmental Studies - 16-2 Onogawa; 305-8506,
Tsukuba, Japan
- G. Inoue and T. Machida
Norway
Statoil Research Centre - Rotvoll, N-7005; Trondheim, Norway
- O. Eiken
Russia
Atmospheric Optics Institute - Siberian Branch of the Russian Academy of
Sciences (SB RAS); 1 Akademicheskii Ave.; Tomsk 634055, Russia
- M.Yu. Arshinov, B.D. Belan, A.V. Fofonov, M.V. Panchenko, D.A.
Pestunov, T.K. Sklyadneva and G.N. Tolmachev
Chemistry and Chemical Technology Institute - Siberian Branch of the
Russian Academy of Sciences; K.Marx Str. 42; Krasnoyarsk 660049, Russia
- A.G. Anshits, N.P. Kirik and L.I. Kurteeva
Earth Cryosphere Institute - Siberian Branch of the Russian Academy of
Sciences (SB RAS); P/O 1230; Tyumen, Russia
- D.S. Drozdov and V.P. Melnikov
Geophysics Institute - Siberian Branch of the Russian Academy of Sciences
(SB RAS); 3, pr. Koptyug; Novosibirsk, 630090, Russia
- A.D. Duchkov
Krasnoyarsk Regional Geological Association - 62 K.Marx St. Krasnoyarsk,
660049, Russia
- B.V. Shibistov
xii Contributing Authors
Limnological Institute - Siberian Branch of the Russian Academy of
Sciences (SB RAS); Irkutsk, Russia
- V.M. Domysheva, N. Granin, O. Khlystov and M.V. Sakirko
Mechanics Institute - Ufa Research Center of Russia; Revolutionary Str.,
96/2; Ufa 450078, Russia
- A.G. Telin
N.N.Vorozhtsov Novosibirsk Institute of Organic Chemistry - Siberian
Branch of the Russian Academy of Sciences (SB RAS); Lavrentyev Ave. 9;
Novosibirsk 630090, Russia
- S.V. Morozov
Institute of Petroleum Chemistry - Siberian Branch of the Russian Academy
of Sciences (SB RAS); 3 Academichesky Ave.; Tomsk 634021, Russia
- L.K. Altunina, V.A. Kuvshinov, Yu.M. Polishchuk and O.S. Tokareva
V.N. Sukachev Forestry Institute - Siberian Branch of the Russian Academy
of Sciences (SB RAS); Krasnoyarsk, Russia
- S.P. Efremov, A.A. Onuchin and E.A. Vaganov
“Yakutniproalmaz” Institute - Stock Company “ALROSA”; Mirny, Yakuti,
Russia
- S.N. Dolgikh
United Kingdom
British Geological Survey (BGS) - Keyworth, Nottingham NG12 5GG;
United Kingdom
- J. M. Pearce, C. Rochelle, J.B. Riding, A. Chadwick, P. Williamson and
G. Williams, N. Riley
Heriot-Watt University - Centre for Gas Hydrate Research; Institute Of
Petroleum Engineering; Edinburgh, United Kingdom
- P. Jadhawar, A.H. Mohammadi, B. Tohidi and J. Yang
United States of America
Monitor Scientific LLC - Suite #555, 3900 S. Wadsworth Blvd.; Denver CO
80235, U.S.A.
- R. Arthur, M.J. Stenhouse and W. Zhou
Preface
As is now generally accepted mankind’s burning of fossil fuels has
resulted in the mass transfer of greenhouse gases to the atmosphere, a
modification of the delicately-balanced global carbon cycle, and a
measurable change in world-wide temperatures and climate. Although not
the most powerful greenhouse gas, carbon dioxide (CO2) drives climate
change due to the enormous volumes of this gas pumped into the atmosphere
every day. Produced in almost equal parts by the transportation, industrial
and energy-generating sectors, atmospheric CO2 concentrations have
increased by about 50% over the last 300 years, and according to some
sources are predicted to increase by up to 200% over pre-industrial levels
during the next 100 years. If we are to reverse this trend, in order to prevent
significant environmental change in the future, action must be taken
immediately. While reduced use of fossil fuels (through conservation,
increased efficiency and expanded use of renewable energy sources) must be
our ultimate goal, short to medium term solutions are needed which can
make an impact today.
Various types of CO2 storage techniques have been proposed to fill this
need, with the injection of this gas into deep geological reservoirs being one
of the most promising. For example this approach has the potential to
become a closed loop system, whereby underground energy resources are
brought to surface, their energy extracted (via burning or hydrogen
extraction), and the resulting by-products returned to the subsurface. In fact
the re-injection of waste CO2 even has the potential to recover energy
reserves that would otherwise be trapped forever, such as is seen in CO2
Enhanced Oil, Gas or Coal Bed Methane Recovery, while at the same time
isolating the CO2 deep underground.

xiv
The present volume organises contributions given at a NATO Advanced
Research Workshop entitled “Advances in CO2 Geological Sequestration in
Eastern and Western European Countries”, held in Tomsk, Russia from
November 15-18, 2004. This workshop was a unique opportunity for
researchers from all over the world to share experiences and to describe
innovative approaches to this highly promising environmental technology.
The book is divided into 5 parts. Part 1 provides a background for the
discussion by describing various examples of how human activities are
modifying the atmosphere in industrially-active areas in Siberia. Part 2
outlines the innovative idea of using deep permafrost layers as either an
impermeable boundary, below which CO2 could be injected, or as a cooling
source for the formation CO2 clathrates. Part 3 gives numerous examples of
recent studies conducted on naturally-occurring sealed or leaking CO2
reservoirs, sites which have the potential to help us understand what
geological characteristics can result in the long-term isolation of CO2, what
are the effects on the ecosystem should CO2 leak to surface, and what are the
most promising technologies for the monitoring of an engineered CO2
geological storage site. Part 4, which outlines various industrial-scale
applications of CO2 geological storage, shows that this approach is
technically practical, economically feasible and, to date, is very safe. Finally
Part 5 gives us a view of the future, showing how energy uses are predicted
to change in the future, how the public must be involved in any future
decisions regarding climate change abatement and how Europe has decided
to move forward in its research on geological storage of CO2.
Preface

The organizers gratefully acknowledge the financial support of the
Scientific Affairs Division of NATO, which made this workshop possible.
A sincere thank you is also extended to all the staff at the Petroleum
Chemistry Institute in Tomsk for all their hard work in providing excellent
facilities and logistical support, and to Prof. Jan Klerkx of The International
Bureau for Envirnmental Studies (IBES) for his contribution to the
successful organisation of the event. Finally the attendance of many
members of the EC-funded Network of Excellence “CO2GeoNet”
contributed to the successful outcome of the Workshop.
Acknowledgements

PART I
ANTHROPOGENIC GREENHOUSE GASES IN
THE ATMOSPHERE
Sources, Concentrations and Processes

STUDY OF LONG-TERM VARIATIONS OF CO2
AND CO CONCENTRATIONS IN THE GROUND
ATMOSPHERIC LAYER NEAR THE CITY OF
TOMSK (WESTERN SIBERIA)
B.D. Belan, A.V. Fofonov, T.K. Sklyadneva and G.N. Tolmachev
Institute of Atmospheric Optics SB RAS 1, Akademicheskii Ave., 634055, Tomsk, Russia
Abstract: Continuous measurements of carbon dioxide near Tomsk started in 1992 while
CO monitoring began in 1998. Both analyzers operate at the TOR Station of
the Institute of Atmospheric Optics. All readouts are recorded every hour all
year round. In this paper we present some results of these measurements.
Key words: surface long-term measurements, carbon dioxide, carbon monoxide, air mass
transport.
1. INTRODUCTION
The TOR automated monitoring station was designed and put into
operation within the framework of the Tropospheric Ozone Research Project
of the EUROTRAC Programme (Belan et al., 1992; Arshinov et al., 1994).
This station allows for the continuous monitoring of the main greenhouse
gases, aerosol content, and standard meteorological parameters. Real-time
data of these observations are presented at the web page of the Institute of
Atmospheric optics (http://meteo.iao.ru).
Continuous measurements of carbon dioxide at the TOR-Station were
initiated in December 1992. Until 1995 a GIAM CO2 gas-analyser (Russian
manufactured) was used, which was subsequently replaced with a NDIR
Vaisala GMM-12 gas-sensor. Monitoring of CO was started in 1998 using
an electrochemical sensor. Prior to analysis an air sample is pumped through
tubing for 10 minutes for ventilation and calibration.
S. Lombardi et al. (eds.),
Advances in the Geological Storage of Carbon Dioxide, 3–9.
© 2006 Springer. Printed in the Netherlands.
3

4 Belan, Fofonov, Sklyadneva and Tolmachev
Although the measurement site is located in a boreal forest area near the
city of Tomsk, this location cannot be considered as a background
observational point because it is sometimes influenced by industrial
pollution sources from the city (Fig. 1). However, the analysis of long-term
measurements reveals local, regional and even global variations of these
atmospheric parameters.
Figure 1. Arrangement of the measurement site relative to Tomsk.
2. RESULTS
This paper presents the results of the last decade of observations.
It can be seen from Figures 2 and 3 that long-term behaviour of CO2 and
CO exhibit opposite tendencies. The concentration of carbon dioxide
increases from year to year while carbon monoxide concentrations generally
decrease.

CO2 and CO in the Ground Atmospheric Layer near Tomsk, Siberia 5
Figures 4 and 5 show that gases of the carbon cycle have similar seasonal
variations, with concentration maximums during the cold period of year and
minimums during the warm period. Such behaviour reflects the normal
annual cycle of vegetation activity in the region. Analysis of the seasonal
variations of carbon oxides also allows one to conclude that the strength of
the carbon sink exceeds the source during a four month period (from April to
July). This can mean that in spite of the fact that Siberia has vast areas of
Figure 2. Long-term variations of carbon dioxide concentrations. (1992-2004).
Figure 3. Long-term variations of carbon monoxide concentrations. (1998-2004).

6 Belan, Fofonov, Sklyadneva and Tolmachev
forestry, on the whole the region is an additional source of one of the main
greenhouse gases.
Figure 4. Seasonal variations of carbon dioxide concentrations near Tomsk.
Figure 5. Seasonal variations of carbon monoxide concentrations near Tomsk.
The terrestrial surface is a natural source of nitrogen monoxide.
Vegetation generates nitrous oxide, and then N2O transforms to NO
(Crutren, 1974). It can be seen from Figure 6 that nitrogen monoxide
concentrations are higher during the warm period of year when the ground
surface is not covered by snow. During the winter season nitrogen monoxide
concentrations decrease significantly. Nitrogen dioxide is formed from
nitrogen monoxide as result of interaction with ozone or hydroxyl radicals,
and thus NO2 has a seasonal variation which is similar to that of NO. That
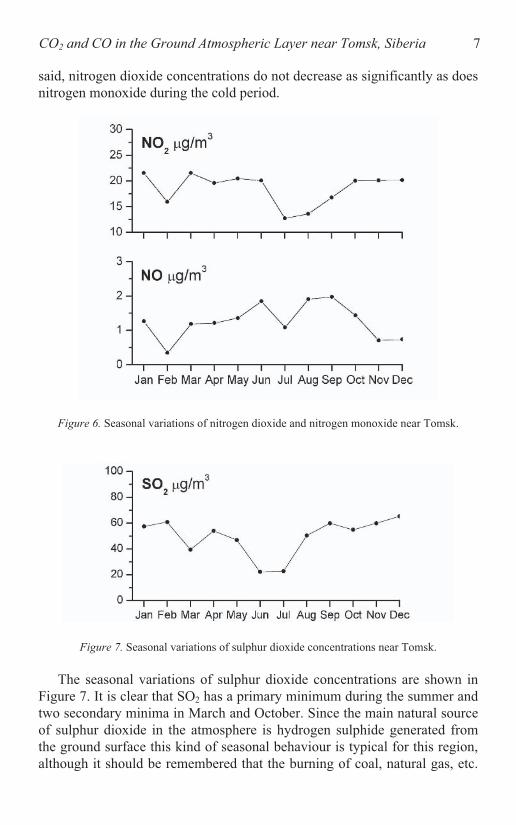
CO2 and CO in the Ground Atmospheric Layer near Tomsk, Siberia 7
said, nitrogen dioxide concentrations do not decrease as significantly as does
nitrogen monoxide during the cold period.
Figure 6. Seasonal variations of nitrogen dioxide and nitrogen monoxide near Tomsk.
Figure 7. Seasonal variations of sulphur dioxide concentrations near Tomsk.
The seasonal variations of sulphur dioxide concentrations are shown in
Figure 7. It is clear that SO2 has a primary minimum during the summer and
two secondary minima in March and October. Since the main natural source
of sulphur dioxide in the atmosphere is hydrogen sulphide generated from
the ground surface this kind of seasonal behaviour is typical for this region,
although it should be remembered that the burning of coal, natural gas, etc.
8 Belan, Fofonov, Sklyadneva and Tolmachev
in western Siberia is also a comparable source of SO2. During the summer,
when the mixing layer reaches maximum altitudes and turbulence is well
developed, sulphur dioxide is redistributed in a larger volume, so its surface
concentration decreases under the condition of a stable source. In general
during the winter, when both mixing layer height and the inversion layer are
lower, accumulation of impurities occurs in smaller volumes and the surface
concentration of SO2 increases. Most likely the minima in March and
October are caused by wet deposition, but this assumption should be verified
by measurements of precipitation acidity.
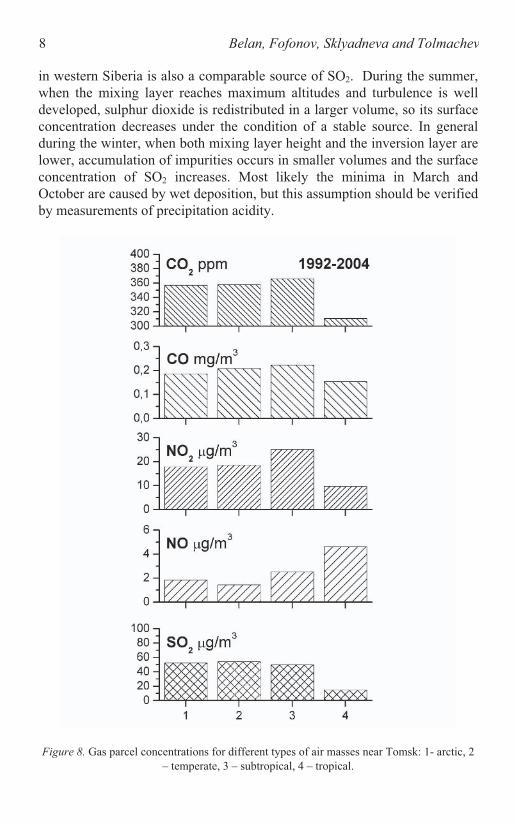
Figure 8. Gas parcel concentrations for different types of air masses near Tomsk: 1- arctic, 2
– temperate, 3 – subtropical, 4 – tropical.

CO2 and CO in the Ground Atmospheric Layer near Tomsk, Siberia 9
The average concentration of trace gases observed in different air masses
is shown in Figure 8. It can be seen from this figure that for 2, , NO2,
and NO the warmer the air mass the higher the observed concentration,
except for the tropical air mass (which can be explained by poor statistics for
this unit in the Siberian region).
3. CONCLUSIONS
In summary long-term tendencies of seasonal gas variations in the
surface atmospheric layer reflect the influence of both regional sources and
sinks as well as of long-range transport of background air mass values.
REFERENCES
Belan B.D., Kolesnikov L.A, Luk’yanov O.Yu., Mikushev M.K., Sem’yanova O.I.,
Tolmachev G.N., and Usmanova V.M., 1992, Variations of the ozone concentration in the
ground air layer. Atmospheric and Oceanic Optics. 5, (6), pp.400-403.
Arshinov M.Yu., Belan B.D., Zuev V.V., Zuev V.E., Kovalevskii V.K., Ligotskii A.V.,
Meleshkin V.E., Panchenko M.V., Pokrovskii E.V., Rogov A.N., Simonenkov D.V., and
Tolmachev G.N., 1994, TOR-station for monitoring of atmospheric parameters.
Atmospheric and Oceanic Optics. 7, (8), pp.580-584.
Crutren P.J., 1974, A review of upper atmospheric photochemistry. Can. J. Chem. 52, (8),
pp.1569-1581.

DYNAMICS OF THE VERTICAL DISTRIBUTION
OF CO2 AND CO CONCENTRATIONS OVER
WESTERN SIBERIA (1997-2003)
M.Yu. Arshinov1, B.D. Belan
1, G. Inoue
2, T. Machida
2, M.V. Panchenko
1
and A.V. Fofonov1
1Institute of Atmospheric Optics SB RAS, 1, Akademicheskii Ave., 634055, Tomsk, Russia;
2National Institute for Environmental Studies, 16-2 Onogawa, 305-8506, Tsukuba, Japan
Abstract: In this paper we present some results of airborne measurements of main
greenhouse gases over the southern part of West Siberia, which were started in
1997 within the framework of a joint Japanese-Russian Project on the study of
greenhouse gases in Siberian ecosystems.
Key words: greenhouse gases, carbon oxides, vertical distribution
1. INTRODUCTION
Airborne measurements of greenhouse gases over the southern part of
western Siberia were started in 1997 within the framework of a joint
Japanese-Russian Project on the study of greenhouse gases in Siberian
ecosystems (Belan et al., 2000). The study region and the flight routes are
shown in Figure 1. The measurement procedure consists of flask sampling of
ambient air at various elevations using an Antonov-30 aircraft laboratory.
After the flight all flask samples were analysed at the National Institute of
Environmental Studies (Japan). Measurements were carried out in the 0 to 7
km atmospheric layer at the end of each month, all year round, and as such a
seven-year database now exists which includes CO2, CO, CH4, H2 and N2O
concentration distributions. A NDIR gas-analyser (LI-6262) mounted on
board the aircraft was used to perform continuous CO2 measurements as a
control of the flask sampling measurements.
11
S. Lombardi et al. (eds.),
Advances in the Geological Storage of Carbon Dioxide, 11–16.
© 2006 Springer. Printed in the Netherlands.

12 Arshinov, Belan, Inoue, Machida, Panchenko and Fofonov
2. RESULTS
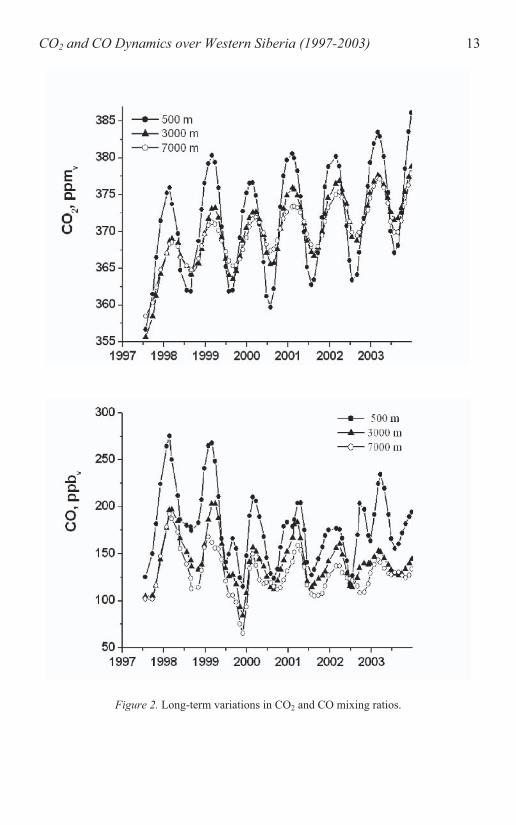
Long-term variations in CO2 and CO mixing ratios are shown in Figure2.
This figure shows that carbon dioxide concentrations had a positive trend
during the study period, which is a global characteristic feature. At the same
time carbon monoxide concentrations tended to decrease.
In spite of the fact that a summer minimum and a winter maximum is
typical for both gases there is one important difference in there variations. It
is clear that the higher mixing ratio values of the carbon oxides observed in
the lower troposphere during the winter are the result of anthropogenic
emissions and vegetation respiration. Also the presence of frequent
temperature inversions, which are typical for Siberia in the winter, lead to
the accumulation of CO and CO2 in the atmospheric boundary layer and
higher mixing ratios in the lower troposphere as compared to the free
troposphere. Differences are due to the fact that carbon monoxide
concentrations are higher during the whole year at lower altitudes, while
CO2 concentrations in the summer are significantly lower compared to the
free troposphere, as seen in Figure 3.
Figure 1. Region of airborne surveys.
CO2 and CO Dynamics over Western Siberia (1997-2003) 13
Figure 2. Long-term variations in CO2 and CO mixing ratios.

14 Arshinov, Belan, Inoue, Machida, Panchenko and Fofonov
2
During the summer photosynthesis leads to the decrease of CO2 mixing
ratios in the surface atmospheric layer, and well-developed vertical mixing
results in distribution homogeneity in the boundary layer. As for CO, the
difference in its mixing ratio at higher and lower altitudes becomes smaller
during the summer, that is it does not vary with altitude.
Figure 3. Averaged vertical distributions of CO and CO mixing ratios.

15
Figure 4. Averaged seasonal behaviour of CO2 and CO mixing ratios.
The vertical CO2 distributions observed in September and May, when
CO2 concentrations are practically invariant with altitude, represent two
opposite intermediate processes. In May photosynthesis is increasing in
strength while in September it is weakening. Averaged seasonal variations
are shown in Figures 4 and 5. Large amplitudes are observed in the
atmospheric boundary layer.
CO2 and CO Dynamics over Western Siberia (1997-2003)

16 Arshinov, Belan, Inoue, Machida, Panchenko and Fofonov
Figure 5. Seasonal amplitudes of CO2 a nd CO mixing ratios.
3. CONCLUSIONS
The study has shown that long-term variations of carbon dioxide in the
free troposphere have a positive trend during all seasons. At the same time
there is no such tendency for the boundary atmospheric layer where CO2
concentrations remain constant from year to year during summertime, that
leads to increase of seasonal amplitude. So, we can draw the conclusion that
Siberian forests are an important CO2 sink. However, the question of what
leads to the global increase of carbon dioxide still needs to be addressed. At
present it is generally recognized that this is a result of direct industrial and
transportation emissions. But analysis of variations of CO2 and CO mixing
ratios in the lower troposphere suggests that anthropogenic activity can
affect the biosphere, which leads to changes in vegetation activity and,
consequently, plants respiration behaviour; this can result in global increase
of carbon dioxide being a very powerful source of carbon on a global scale.
REFERENCES
Belan, B.D., Inoue, G., Machida, T., Nadeev, A.I., Panchenko, M.V., Plotnikov, A.P., 2000,
Variations of atmospheric greenhouse gases over Siberia. Proceeding of the 8th
Symposium on the Joint Siberian Permafrost Studies between Japan and Russia. National
Institute for Environmental Studies, Tsukuba, Japan, 2000, pp. 275-279.
CARBON BALANCE AND THE EMISSION OF
GREENHOUSE GASES IN BOREAL FORESTS
AND BOGS OF SIBERIA
E.A. Vaganov, S.P. Efremov and A.A. Onuchin
V.N. Sukachev Institute of Forest SB RAS, Krasnoyarsk, Russia
Abstract: Zonal patterns of above-ground phytomass dynamics and carbon storage in
above-ground vegetation, phytodetritus and humus were revealed based on the
study of the carbon balance and its components in forest ecosystems of the
Yenisei meridian transect. Results indicate that the carbon storage ratio in
different plant layers is determined by climatic regimes. For example pine
stands were used to calculate the full carbon budget using data on its fluxes
and storage in different biogeocenosis components. Biological productivity
indices and the carbon pool of hydromorphic complexes are highly dependant
on the mineral nutrition regime and morphological characteristics of the
stands. Experimental study results show the importance of forest and bog
ecosystems as carbon cycle regulators is determined by the complex
interaction of zonal-climatic and forest conditions as well as by forest
vegetation characteristics (which depend on varying carbon balance structure
and energy- mass exchange processes).
Key words: greenhouse gases; forest ecosystems; post- fire carbon emissions; phytomass
of forest bogs.
1. INTRODUCTION
Forests and bogs are dominant ecosystem types in middle and high
latitudes of the northern hemisphere. The present paper details the results of
studies into the role of Siberian forests and bogs in the global carbon cycle
and outlines some trends for further studies. Carbon stocks and fluxes
formed by Siberian forests and bogs make a significant contribution to the
global system, based in part on its great size (approx. 10 million km2).
17
S. Lombardi et al. (eds.),
Advances in the Geological Storage of Carbon Dioxide, 17–34.
© 2006 Springer. Printed in the Netherlands.

18
The carbon cycle is fundamental in forest ecological and climatological
studies due to the uptake and release of various natural and anthropogenic
greenhouse gases during the life cycle of plants (the so-called temporary
carbon depots). Siberian forests and bogs have several peculiarities with
respect to their participation in the global carbon cycle: 1) tree stands typical
of Siberia (with 5 coniferous species as dominants) as well as forest-bog and
bog ecosystems provide long- term carbon conservation; 2) most Siberian
forests are located in the permafrost zone, which has low productivity (about
100 m3 per ha, or 1.27 m
3 per ha / year) but extra potential for carbon
sequestration in soil; 3) a large portion of Siberian forests periodically suffer
wild fires (variable in different taiga subzones) (Furyaev et al., 2001) that
greatly shift the balance towards emission of C containing gases to the
atmosphere.
2. STUDY METHODS
The information outlined above explains the great interest of the
scientific community in studying the carbon cycle of Siberian forest and bog
areas. At present more than 20 joint international projects are aimed at
examining this problem. The methods used in these projects can be divided
into direct and indirect, ground-based and remote-sensing, and combination
techniques (i.e. methods based on direct measurements combined with
simple models which compute the difficult or non-measured characteristics
of the cycle).
Direct methods physically measure carbon cycle parameters, such as
carbon content measurements within the forest litter, in different soil
horizons, in gases below and above ground or in flowing water which
removes carbon compounds from the ecosystem.
Methods for measuring respiration (stem and soil respiration, etc.) as
well as the eddy-covariance method used for measuring carbon dioxide
fluxes along the vertical profile of ecosystems are also direct ones. The
eddy-covariance method requires special towers which are less than or much
higher than the tree canopy and which are equipped with a series of gas
analyzers located along its length (Shibistova et al., 2002a,b,c; Schulze et al.,
1999). Vertical concentration profiles of carbon dioxide and other carbon
containing greenhouse gases given in papers by Levin and Lloyd are more
spatially integrating (Levin et al., 2002; Lloyd et al., 2002), and these
measurements are used as a base for computing exchangeable carbon within
the biogeochemical cycles of vast forest areas (up to hundreds of thousands
of square kilometers).
Vaganov, Efremov and Onuchin
Carbon Balance in Siberian Forests and Bogs 19
Flux measurements of carbon-containing gases made using tall (up to
300 m) towers have a special importance in this group of methods (Bakwin
et al., 1998), as the surface atmospheric layer (c. 0-200 m) is characterized
by eddies induced by the friction of air flowing against earth surface
roughness. However, the dynamics of the overlying layer (200-2000 m) is
determined by heavy convective mixing during the day and by layer
degradation or the absence of turbulence during the night. This interval is
known as the mixing layer, and a wide range of diurnal carbon signals within
the surface layer are smoothed and weakened in the mixing layer. Therefore,
the mixing layer is an efficient integrator both of diurnal carbon cycles and
of small-scale ecosystem heterogeneities. It enables not only the precise
measurement of gas / aerosol compositions and their vertical profile
dynamics but also to compute exchange fluxes of carbon containing gases
which are integrated for the tower footprint area (about 40,000 km2).
Some meteorological instruments also host partially-automated systems
for measuring the absolute concentrations of CO, CO2, O2, N2, CH4 N2O and
the stable isotope ratios of 13
C/12
C in CO2, CH4 and CO, 18
O/16
O in CO2 and 15
N/14
N in N2O. Isotope ratios can be used to differentiate carbon sink and
release processes. For example CO has information on anthropogenic
emissions since the incomplete burning of fossil fuels is one of its main
sources.
Concentration measurements of CO2 fractions having different C and O
isotopic signatures make it possible to separate oceanic and terrestrial carbon
fluxes (Keeling et al., 1996) due to the strong contrast in the number of
heavy carbon isotopes in CO2 adsorbed during terrestrial C3 photosynthesis
compared to oceanic photosynthesis. Measurements of 18
O/16
O ratios in
atmospheric CO2 also help assess respiration intensity of terrestrial
ecosystems (Mortazavi and Chanton, 2002). Modeling has shown that
respiration and evaporation are the main factors responsible for spatial and
seasonal changes of C16
O18
O content in the atmosphere (Ciais et al., 1997;
Peylin, 1999). Observations of methane will help to better understand the
relationships between climate and ground vegetation since trends in methane
(and its isotope 14
CH4) indicate changes in the respiration of peat bogs and
permafrost soils.
Construction of the tall tower in the middle of the taiga forest region
(Zotino, Krasnoyarsk krai) will provide measurements of energy- and mass
exchange characteristics in real time, with a high temporal resolution and an
assessment of the impact of meteorological conditions on exchange
processes.
Studying carbon cycle parameters on the scale of Siberia requires the use
of remote sensing methods owing to its great size and the limited access of
many of its regions. For example satellite images can be used to determine

20
species composition, the age of tree stands, phytomass stocks and other large
scale forest ecosystem characteristics.
Computation of the total carbon budget of forests using periodic forest
inventory data is one of the most developed approaches for understanding
the role of Russian forests in the global carbon cycle This can be considered
a combined approach, as forest inventory data is not enough. Instead,
theoretical estimates of some carbon budget parameters should be introduced
and models should be applied which take into account the age and species
composition of the forest ecosystems in different physical and geographical
regions. The total carbon budget of Russian forests was calculated in a
cooperative project involving Russian forest research institutions and the
Institute of Applied System Analysis (Austria). In this work a special
database was established which includes a geographic information system
(GIS) model. The multi-layered GIS contains land status data (landscapes,
soils, vegetation, forests, land use etc.) and attributive data (phytomass,
heterotrophic respiration, disturbed lands and forests etc.) which is based on
focused studies and forest inventory reports as well as some auxiliary
models (Shvidenko et al., 2003; Nilsson et al., 2000; Shvidenko and Nilsson,
2003).
Even the most thorough measurements and assessments of carbon cycle
parameters will show only a small part of its value if they are not
coordinated with other studies within an integrated description of the
functioning ecosystems. Reducing together the minimum set of both direct
and indirect (forest inventory or remote sensing) measurements of carbon
cycle parameters needed for a relatively complete description is possible
only within integrated models due to the different spatial scales of the
various methods. An adequate model of ecosystem functioning not only
links measurement data obtained by different methods but it is also able to
assess the processes which has the most errors. For example the inaccuracy
of assessing carbon emissions caused by forest fires is one of the key factors
resulting in imprecise descriptions of the carbon cycle in Siberian forests
(Vaganov et al., 1998; Arbatskaya, 1998; Conard and Ivanova, 1997; Conard
et al., 2002). Great variability in the area of Siberian forest burned annually
(from 1 to 10 million ha) greatly affects the balance between carbon
accumulation and emission (Isaev et al., 1998).
Vaganov, Efremov and Onuchin

Carbon Balance in Siberian Forests and Bogs 21
3. RESULTS AND DISCUSSION
3.1 Spatial variability of carbon stocks in forest
ecosystems along the Yenisei meridian
During several years researchers at the Forestry Institute SB RAS carried
out detailed studies of the structure of the Yenisei transect forest ecosystems
in order to assess their diversity and composition as well as various dynamic
components, such as carbon, nitrogen and water turnovers (Forest
ecosystems, 2002). Availability of all boreal forest subzones in the transect
area makes it possible to link the stock and annual phytomass productivity
indices, the rate of organic decomposition, heterotrophic respiration, detritus
stocks, frequency and intensity of wild fires, as well as potential assessments
of carbon emission during and after forest fires as a result of the main
climatic factor - temperature. Latitudinal regularities in the forests of the
Yenisei meridian can be considered as a spatial analog of changing ground
vegetation structure due to large climate changes, such as the shifting of
forest zones during warming (Furyaev et al., 2001; Tchebakova et al., 1994).
Tree stand phytomass and ground vegetation stocks show appropriate
changes along the meridian and agree well with average annual temperature
changes and growing season length (Forest ecosystems, 2002). The growing
stock increase in forests of middle and southern taiga, as compared to the
northern taiga, parallels the decrease of ground vegetation phytomass like
mosses, lichens, grasses and small shrubs. In the more northern ecosystems
the contribution of ground vegetation to the formation of annual ecosystem
production is commensurable or exceeds wood growing stock contribution
(Knorre, 2003).
The organic matter (OM) carbon pool in the soil cover (i.e. the soil layer
equivalent to the organogenic and mineral horizon thickness, 0-50 cm depth)
of forest tundra and boreal forests of the Yenisei meridian is 114 t ha-1
,
which is divided between forest tundra (17%) and northern (23%), middle
(39%) and southern (21%) taiga. Stable humus consists of 60.5 t ha-1
, 33.4 t
C ha-1
, which is concentrated in mobile organic matter and 19.8 t ha-1
is in
phytodetritus on the soil surface and below (Fig. 1).
The upper 20-cm soil layer is characterized by a maximum accumulation
of both mobile and stable carbon. The light mineralised OM fraction makes
up 40% of the carbon stock in this part of the soil profile. With regards to
carbon accumulation in the litter the fraction share increases to 50% of total
carbon stock. In terms of structure, 19.8 t ha-1
is phytodetritus carbon
which takes an active part in exchange processes between phytomass, soil
humus and the atmosphere while 21.3 t ha-1
consists of soil organic matter
involved in biological turnover and possibly rapid overturn. It is this latter
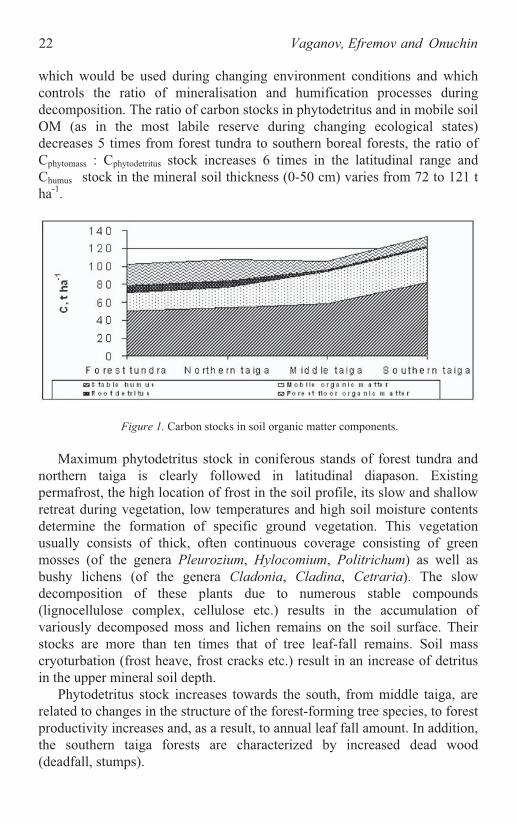
22
which would be used during changing environment conditions and which
controls the ratio of mineralisation and humification processes during
decomposition. The ratio of carbon stocks in phytodetritus and in mobile soil
OM (as in the most labile reserve during changing ecological states)
decreases 5 times from forest tundra to southern boreal forests, the ratio of
phytomass : Cphytodetritus stock increases 6 times in the latitudinal range and
humus stock in the mineral soil thickness (0-50 cm) varies from 72 to 121 t
ha-1
.
Maximum phytodetritus stock in coniferous stands of forest tundra and
northern taiga is clearly followed in latitudinal diapason. Existing
permafrost, the high location of frost in the soil profile, its slow and shallow
retreat during vegetation, low temperatures and high soil moisture contents
determine the formation of specific ground vegetation. This vegetation
usually consists of thick, often continuous coverage consisting of green
mosses (of the genera Pleurozium, Hylocomium, Politrichum) as well as
bushy lichens (of the genera Cladonia, Cladina, Cetraria). The slow
decomposition of these plants due to numerous stable compounds
(lignocellulose complex, cellulose etc.) results in the accumulation of
variously decomposed moss and lichen remains on the soil surface. Their
stocks are more than ten times that of tree leaf-fall remains. Soil mass
cryoturbation (frost heave, frost cracks etc.) result in an increase of detritus
in the upper mineral soil depth.
Phytodetritus stock increases towards the south, from middle taiga, are
related to changes in the structure of the forest-forming tree species, to forest
productivity increases and, as a result, to annual leaf fall amount. In addition,
the southern taiga forests are characterized by increased dead wood
(deadfall, stumps).
Figure 1. Carbon stocks in soil organic matter components.
Vaganov, Efremov and Onuchin

Carbon Balance in Siberian Forests and Bogs 23
In ecosystems of all forest-forming tree species the distribution of
phytodetritus components, up to class V of stand age, is: litter > root detritus
> stem wood. Prevalence of over mature stands results in detritus
accumulating due to slowly decomposed fallen stems. The latter clearly
shows itself in southern taiga larch forests, pine forests and spruce forests.
Overall carbon accumulation in forest tundra and taiga ecosystems of the
Yenisei meridian (in blocks “vegetation” and “soil”) equals about 16,000
billion t (156 t ha-1
of forested area). Approximately 26% consists of
above and below ground phytomass, while the rest is accumulated in the
organic matter of the upper 50 cm of the soil (39% in stable humus, 13% in
mobile humus and 22% in phytodetritus). Studies in other countries show
comparable values: forest ecosystems in the Netherlands are characterized
by a similar ratio with 113; 59 and 19 t ha-1
in humus, phytomass and dead
plant residues, respectively (Nabuurs and Mohren, 1993, 1995); in Finland
34 t ha-1
was found in phytomass and 72 t ha-1
in the 0-17 cm soil
interval (Kauppi et al., 1997); while in the USA Birdsey (1992) found 59%
in soil, 31% in the phytomass and 9% in plant residues on soil surface.
Carbon stocks in both blocks increase in the meridian direction. The
redistribution of pools between them varies along the transition from forest
tundra to the northern taiga, such that the Csoil / Cphytomass ratio diminishes
from 4.8 to 2.9 and remains equal in ecosystems of middle and southern
taiga (2.6 and 2.4, respectively). As Utkin et al. (2001) found, the Csoil /
Cphytomass ratio for subzones of western and eastern Siberian macro-regions
equals 3.3. From the estimate of Shvidenko and Nilsson (2003) it follows
that this ratio in the forested Russian area equals 6.8, 2.4 and 2.8 in forest
tundra and northern taiga forests, middle and southern taiga, respectively.
Intensity of mineralised carbon flux to the atmosphere is practically 90%,
determined by phytodetritus decomposition. Between 68% (in southern
taiga) and 87% (in forest tundra) of its emission is formed via litter
decomposition. Root detritus contribution does not exceed 11-17%, while
stem fall increases from forest tundra and northern taiga towards middle and
southern taiga (from 2-3 to 14-17%). Soil humus mineralisation in
ecosystems varies from 3 to 13% in the southern taiga and from 2 to 6% in
northern forests. The 2 - 5% of detritus being decomposed are humificated in
southern taiga forests and 0.1-0.2% of it in forest tundra and in larch forests
of the northern taiga.
Experimentally determined phytodetritus decomposing rates, averaged
for forest zones and subzones of the Yenisei meridian, are given in Table 1.
For the period having an average daily air temperature above 5°C the
phytodetritus decomposition rate increases 3-fold (from 0.4 to 1.1 mg g-1
day-1
) in the direction from forest tundra to southern taiga.
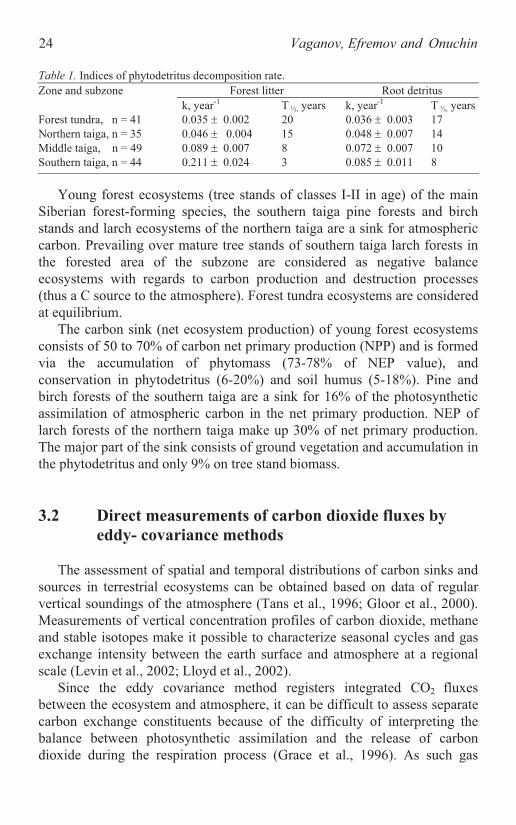
24
Forest litter Root detritus Zone and subzone
k, year-1
T ½, years k, year-1
T ½, years
Forest tundra, n = 41 0.035 0.002 20 0.036 0.003 17
Northern taiga, n = 35 0.046 0.004 15 0.048 0.007 14
Middle taiga, n = 49 0.089 0.007 8 0.072 0.007 10
Southern taiga, n = 44 0.211 0.024 3 0.085 0.011 8
Young forest ecosystems (tree stands of classes I-II in age) of the main
Siberian forest-forming species, the southern taiga pine forests and birch
stands and larch ecosystems of the northern taiga are a sink for atmospheric
carbon. Prevailing over mature tree stands of southern taiga larch forests in
the forested area of the subzone are considered as negative balance
ecosystems with regards to carbon production and destruction processes
(thus a C source to the atmosphere). Forest tundra ecosystems are considered
at equilibrium.
The carbon sink (net ecosystem production) of young forest ecosystems
consists of 50 to 70% of carbon net primary production (NPP) and is formed
via the accumulation of phytomass (73-78% of NEP value), and
conservation in phytodetritus (6-20%) and soil humus (5-18%). Pine and
birch forests of the southern taiga are a sink for 16% of the photosynthetic
assimilation of atmospheric carbon in the net primary production. NEP of
larch forests of the northern taiga make up 30% of net primary production.
The major part of the sink consists of ground vegetation and accumulation in
the phytodetritus and only 9% on tree stand biomass.
3.2 Direct measurements of carbon dioxide fluxes by
eddy- covariance methods
The assessment of spatial and temporal distributions of carbon sinks and
sources in terrestrial ecosystems can be obtained based on data of regular
vertical soundings of the atmosphere (Tans et al., 1996; Gloor et al., 2000).
Measurements of vertical concentration profiles of carbon dioxide, methane
and stable isotopes make it possible to characterize seasonal cycles and gas
exchange intensity between the earth surface and atmosphere at a regional
scale (Levin et al., 2002; Lloyd et al., 2002).
Since the eddy covariance method registers integrated 2 fluxes
between the ecosystem and atmosphere, it can be difficult to assess separate
carbon exchange constituents because of the difficulty of interpreting the
balance between photosynthetic assimilation and the release of carbon
dioxide during the respiration process (Grace et al., 1996). As such gas
Table 1. Indices of phytodetritus decomposition rate.
Vaganov, Efremov and Onuchin

Carbon Balance in Siberian Forests and Bogs 25
exchange chambers are used as an alternative approach which can give a
quantitative estimation of 2 fluxes in separate ecosystem components
(photosynthesis, soil respiration, tree stems, crown) as well as to register
spatial and temporal variability.
Continuous research has been conducted on the carbon balance of a
forest ecosystem in the southern subzone of middle taiga (60 45 N, 89 23 E)
since 1998. The measurement system was installed in an even-aged (200-
year old) pine tree stand of V bonitet class, growing on sandy soils. Mean
tree height is 22 m, basal area is 30 m/ha, leaf area index is 1.5 of the
projective cover, and crown closure is 0.7 (Wirth et al., 1999). Lichens .
Cladina spp. Cladonia spp. dominate the ground vegetation. The grass-shrub
layer mainly consists of Vaccinium vitis-idaea (L). Avror., while the
presence of green mosses and Vaccinium myrtillus (L). is minor.
Photosynthetic activity was observed in the ecosystem from early May to
late September. During the long autumn-winter period the tree stand was
transformed into a weak 2 source to the atmosphere (average 2 flux
equaled 0.05 mol m2 day
-1 - Shibistova et al., 2002). On the whole, during
the vegetation season the studied ecosystem was considered as a 2 “sink”
and the accumulating activity (up to 0.4 mol ·m-2
·day-1
), in spite of a lesser
leaf area index, was rather high and quite comparable with values
characteristic of European and Canadian boreal forests (Schulze et al., 1999;
Goulden et al., 1997; Jarvis et al., 1997).
The gross primary production (GPP) value of the studied tree stand was
much less compared to European forests. For example, GPP values of the
order of 100, 85 and 126 mol m2
year-1
were observed for forest
ecosystems in Sweden, Finland and the European part of Russia,
respectively (Valentini et al., 2000; Milyukova et al., 2002). Nevertheless
this index, varying in experiments from 46 to 53 mol m2year
-1 (Shibistova
et al., 2002; Lloyd et al., 2002), was similar to the 60 ±10 mol m2
year-1
value obtained for Canadian forests (Ryan et al., 1997). It should be noted
that the coefficient of GPP “expenditures” for autotrophic respiration ( =
0.64) also agreed with computations given for coniferous forests of Canada
(Baldocchi et al., 1997; Ryan et al., 1997).
Analysis of integrated 2 fluxes has shown a great variability in net gas
ecosystem exchange (NEE) values, showing the difference between values
of gross primary production and total constituent respiration during the
vegetation season. These fluctuations reflect a complex effect of abiotic
factors (photosynthetic active radiation, deficiency of aqueous tension and
air temperature) on photosynthetic activity (Shibistova et al., 2002; Lloyd et
al., 2002), and moreover they depend on the start time of photo-assimilating
stand activity (Suni et al., 2003). The integrated value of annual net gas
exchange of the ecosystem varied from 13 to 15 mol m2year
-1.

26
The net gas exchange of forest ecosystems is considered to be primarily
determined by respiration intensity (Valentini et al., 2000). From this point
of view the 2 emission value from soil, which makes up to 60-80% of the
total ecosystem respiration (Shibistova et al., 2002 a,b,c; Kelliher et al.,
1999; Hollinger et al., 1998:), is a key component of carbon cycle.
Thus the direct measuring of carbon dioxide fluxes by the eddy
covariance method has shown that the studied tree stand is a large
accumulator of atmospheric 2. Carbon accumulation, on average,
consisted of 1.8 t year -1
per hectare of forest area for the studied period.
3.3 Total carbon budget of Russian forests
Two main fluxes, net primary production (with positive accumulation)
and heterotrophic respiration (with negative carbon emission), are decisive
in the carbon budget of Russia (Nilsson et al., 2003; Shvidenko et al., 2003).
Net production results from green phytomass (~49%), above ground tree
mass (~26%), and underground processes (~25%). Heterotrophic respiration
is mainly determined by ground vegetation respiration, with 15% caused by
above and below ground detritus decomposition. Carbon emission fluxes by
wild fires are 37%, due to ecosystem disturbances, while biotic factors (most
significantly insect reproduction) contribute the same amount. Carbon
accumulation in the hydro- and lithosphere contributes no more than 2.2% of
the net primary production, which means that over approximately 40-45
years the annual volume of organic matter assimilated by vegetation is
essentially removed from the biological cycle. This is not so large a value
relative to the inherent time scale of the biological cycle, however it is
significant over geological time. Summarizing the various pools and fluxes
shows the net biome production (absorbing carbon from the atmosphere) of
Russian forests to be at a rate of 7.6% of the net primary production.
From flux assessments it follows that for the studied period of time
Russian forested areas have absorbed about 240 g (million ton) of carbon
per year from the atmosphere. It is now known that the “controlled” (by
forestry measures) part of the carbon budget is limited by disturbances and
other possible transformations of non-wooded lands to forested ones (forest
regeneration and forest propagation). Better integrated and temporally
averaged values were obtained when assessing the total carbon budget
parameters for the other time periods. Thus for 38 years (1961-1997)
Russian forested areas absorbed, on average, 430+/-70 million tons of
carbon per year from the atmosphere, the third part of which was determined
by changing ground vegetation. Due to disturbances in forest ecosystems
the total flux varied from 90 to 400 g of carbon per year. Net biome
Vaganov, Efremov and Onuchin

Carbon Balance in Siberian Forests and Bogs 27
production averaged in 5-year periods shows less variations: from 240 to
320 million t of carbon per year.
Assessment of the total carbon budget (Nilsson et al., 2003; Shvidenko et
al., 2003) shows that: 1) the Russian forests are presently a huge reservoir of
additional carbon sequestration (about 200-600 million t C / yr); 2) the
assessed potential carbon sequestration may be obtained only for vast areas
and using sustainable forest management; 3) realizing sustainable forest
management requires a new state policy in managing the forestry sector,
however this does not conflict with traditional forestry activities aimed at
high forest productivity, improved forest protection and maintaining forest
biodiversity.
3.4 Wildfires and carbon emissions – the main source of
uncertainties in estimating parameters of carbon
cycle of Siberian forest ecosystems
Official statistics show that between 20,000 and 40,000 fires occur
annually in Russia, affecting an area of 2 to 3 million ha of forest and other
lands (Davidenko et al. 2003). The fires are detected and controlled only in
the so-called “protected forests” and on pasturelands. However, the
application of space-borne sensors, such as the NOAA/AVHRR
Terra/Aqua/MODIS, ENVISAT/MERIS and Terra/ASTER, have improved
considerably the detection of active fires along with a better estimation of
burned areas and large-scale impacts (Sukhinin et al., 2004a).
For example, before the 1980s it was believed that, on average, fires
annually burned 1.5 million ha in the boreal forests within the former Soviet
Union. Recent investigations based on satellite imagery revealed that the
magnitude of the fires has been greatly underestimated, and now it is
believed that boreal zone fires annually destroy an average of 8 million ha,
with considerable annual fluctuation (Conard et al., 2002). For example, in
1987 satellite image evaluation revealed a total area burned in boreal forests
and other lands in the East-Asian regions of Russia of about 14 million ha
The Krasnoyarsk satellite receiving stations at the V.N. Sukachev
Institute for Forest and the Russian Ministry of Emergency are now capable
of downloading and processing both NOAA/AVHRR and Terra/MODIS
data. They cover the whole Asian part of Russia, which consists of
approximately one billion ha of vegetated land between the Urals to the
West and Sakhalin Island in the Far East. The surveyed area includes all
vegetation types (forest, tundra, steppe, etc.)(Soja et al., 2004).
(Cahoon et al., 1994).
28
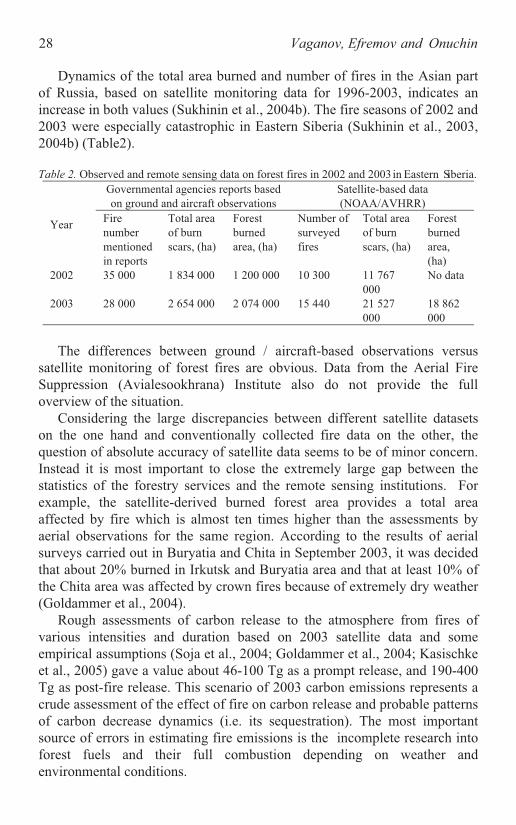
Dynamics of the total area burned and number of fires in the Asian part
of Russia, based on satellite monitoring data for 1996-2003, indicates an
increase in both values (Sukhinin et al., 2004b). The fire seasons of 2002 and
2003 were especially catastrophic in Eastern Siberia (Sukhinin et al., 2003,
2004b) (Table2).
Governmental agencies reports based
on ground and aircraft observations
Satellite-based data
(NOAA/AVHRR)
YearFire
number
mentioned
in reports
Total area
of burn
scars, (ha)
Forest
burned
area, (ha)
Number of
surveyed
fires
Total area
of burn
scars, (ha)
Forest
burned
area,
(ha)
2002 35 000 1 834 000 1 200 000 10 300 11 767
000
No data
2003 28 000 2 654 000 2 074 000 15 440 21 527
000
18 862
000
The differences between ground / aircraft-based observations versus
satellite monitoring of forest fires are obvious. Data from the Aerial Fire
Suppression (Avialesookhrana) Institute also do not provide the full
overview of the situation.
Considering the large discrepancies between different satellite datasets
on the one hand and conventionally collected fire data on the other, the
question of absolute accuracy of satellite data seems to be of minor concern.
Instead it is most important to close the extremely large gap between the
statistics of the forestry services and the remote sensing institutions. For
example, the satellite-derived burned forest area provides a total area
affected by fire which is almost ten times higher than the assessments by
aerial observations for the same region. According to the results of aerial
surveys carried out in Buryatia and Chita in September 2003, it was decided
that about 20% burned in Irkutsk and Buryatia area and that at least 10% of
the Chita area was affected by crown fires because of extremely dry weather
(Goldammer et al., 2004).
Rough assessments of carbon release to the atmosphere from fires of
various intensities and duration based on 2003 satellite data and some
empirical assumptions (Soja et al., 2004; Goldammer et al., 2004; Kasischke
et al., 2005) gave a value about 46-100 Tg as a prompt release, and 190-400
Tg as post-fire release. This scenario of 2003 carbon emissions represents a
crude assessment of the effect of fire on carbon release and probable patterns
of carbon decrease dynamics (i.e. its sequestration). The most important
source of errors in estimating fire emissions is the incomplete research into
forest fuels and their full combustion depending on weather and
environmental conditions.
Table 2. Observed and remote sensing data on forest fires in 2002 and 2003 in Eastern Siberia.
Vaganov, Efremov and Onuchin

Carbon Balance in Siberian Forests and Bogs 29
3.5 The role of forest- bog and bog ecosystems in carbon
accumulating in Siberian area
In spite of researcher efforts to make known the contribution of Siberian
bogs to the global organic carbon cycle, this problem remains as urgent as
before. Presently only the process of intensive accumulation and study of
new data can be stated (P’yavchenko, 1985; Peat resources of RSFSR, 1991;
Vompersky, 1994; Vompersky et al., 1999; Efremov et al., 1994; Efremova
et al., 1997, 1998; Makhov et al., 1994; Panikov et al., 1993; Naumov et al.,
1994; Naumov, 1997; etc.).
The main barriers to an objective assessment of this contribution are: )
absence of total and reliably differentiated account of boggy and peaty areas;
b) geographically uneven and quantitatively insufficient measurements of
peat deposits; c) fragmentary information on the group and fractional
structure of organic matter of peat deposits and the transformation of carbon
forms in these peat deposits related to environmental dynamics (e.g. T,
moisture, redox potential); d) the weak experimental basis for the current
retrospective assessments and prediction of the depositional effect of bogs
and boggy forests of Siberia.
According to the forest mapping made by Korotkov (1994) two forest
oblasts make up part of the western Siberian continental sector: the Altai-
Sayan mountains and the western Siberian plains. Each is differentiated into
forest provinces (FP), of which the first oblast covers 7 FP, and the second
covers 3 FP.
The correlation of areas, peat stocks and deposited carbon for peaty bogs
of the region are given in Table 3. One can see that plain areas, and taiga
forest zones in them with a specific index distribution in subzones, have a
decisive importance. Moreover, a rather contrasting increase of total peat
and organic matter stocks from the north to the south at the more
“smoothed” differentiation of bogs area is observed here.
Deposited peat stocks converted to bone-dry organic matter (BDM)
within the BVB reach almost 18 billion tons, which can be subdivided into
oligotrophic (50.2%), mesotrophic 18.1% and eutrophic (31.7%) peats.
Uptake and long-term isolation of atmospheric carbon by BVB equals 9.3
billion tons (oligotrophic - 49.4%, mesotrophic - 18.2%, eutrophic - 32.4%
of organic carbon). Based on calculations the biosphere contribution of BVB
to the C- depositing indices of forest- bog- peat complexes of the western
Siberian plain may be presented in generalized form as follows: in area –
6.7%, in deposited – 16.5%, in organic carbon of peat deposits –
17.2%.

30
Table 3. Correlation of areas, peat stocks and deposited carbon in peaty bogs of western
Ecoregions % of total
bog area
% of total
peat stock
% of total
carbon stock
Zauralsk- Yeniseisk FP
pretundra forests and open forests: 15,3 3,6 3,5
Tundra 4,8 0,1 0,05
Forest tundra 10,5 3,5 3,5
Zauralsk- Yeniseisk FP
taiga forests: 77,8 90,4 90,6
northern taiga 22,1 18,7 18,6
middle taiga 24,8 28,1 28,1
southern taiga 30,9 43,6 43,9
Plain steppe and forest- steppe 4,6 3,6 3,6
Total in plain area 97,7 97,6 97,7
Mountain and pre- mountain area 2,3 2,4 2,3
Total in western Siberian macro-
region
100 100 100
Progressing climate warming will undoubtedly result in the heating of
peat deposits, the fall of soil water level and the increased aeration of bog
ecosystems, which will in turn increase microbiological and fermentative
soil activity. This will result in accelerated decomposition of the organic
matter in peat and in their humification. Polysaccharides will be
transformed first, however eventually all groups and organic fractions will
be affected, including even more stable components like lignin, humic coal
and wax resins. The earlier stated proportions will be shifted in the group
and fraction composition of humus, and it will be stabilized at another level
which corresponds to the new oxidative- regenerative situation.
4. CONCLUSIONS
It is recommended that future studies focus on the following items: i)
elucidation of the reasons for the discrepancy in assessing carbon pools and
fluxes determined by various methods for some regions or smaller areas; ii)
climate change impact on the dynamics of pools and fluxes, at different
temporal and spatial resolutions; iii) the more precise assessment of carbon
emissions as a result of forest area disturbance caused by cuts, wild fires,
land use, outbreaks of mass insect reproduction, man-made pollution; iv)
elaboration of a system of carbon cycle models at different spatial levels; v)
study of models for assessing scenarios of carbon emission accumulation via
different climate changes; vi) elaboration of ecological- economical models
of the carbon budget for forest and bog areas.
Siberian forest zones.
Vaganov, Efremov and Onuchin

Carbon Balance in Siberian Forests and Bogs 31
ACKNOWLEDGEMENTS
The authors thank the researchers of the V.N.Sukachev Institute of Forest
SB RAS, including Vedrova E.F., Verkhovets S.V., Efremova T.T., Kruglov
V.B., Sukhinin A.I., Shibistova O.B., for presented materials and their help
in preparing this paper.
REFERENCES
Arbatskaya, M.K., 1998, A long- term variability of climate, tree growth and fire occurrence
in taiga forests of Middle Siberia, PhD thesis abstract, Krasnoyarsk, 21. (in Russia)
Bakwin, P. S., Tans, P. P., Hurst, D. F., and Zhao, C., 1998, Measurements of carbon dioxide
on very tall towers: Results of the NOAACMDL program, Tellus 50B:401-415.
Baldocchi, D., Vogel, C.A., and Hall, B., 1997, Seasonal variations of carbon dioxide
excange rates above and below a boreal jack pine forest, Agric. For. Meteorol. 83:147-
170.
Birdsey, R.A., 1992, Carbon storage and accumulation in United States forest ecosystems,
USDA Forest Service. General Technical Report WO-59. 51 p.
Cahoon, D.R., Stocks, B.J., Levine, J.S., Cofer, W.R., and Pierson, J.M., 1994, Satellite
analysis of the severe 1987 forest fires in northern China and southeastern Siberia., J.
Geophys. Res. 99 (D9):18627-18638.
Ciais, P., Denning, A.S., Tans, P.P., Berry, J.A., Randall, D.A., Collatz, G.J., Sellers, P.J.,
White, J.W.C., Trolier, M., Meijer, H.J., Francey, R.J., Monfray, P. and Heimann, M.,
1997, A three dimensional synthesis study of 18O in atmospheric CO2. Part 1: Surface
fluxes, Journal of Geophysical Research 102:5857-5872.
Conard, S.G., Ivanova, G.A., 1997, Wildfire in Russian boreal forests – potential impacts of
fire regime characteristics on emissions and global carbon balance estimates,
Enviromental Pollution. 98(N3): 305-313
Conard, S.G., Sukhinin, A.I., Stocks, B.J., Cahoon, D.R., Davidenko, E.P., Ivanova, G.A.,
2002, Determining effects of area burned and fire severity on carbon cycling and
emissions in Siberia, Climatic Change 55(1-2): 197-211.
Davidenko, E.P., Furyaev, V.V., Sukhinin, A.I., and Goldammer, J.G., 2003, Fire
management needs in Russia’s boreal forest zone, Paper presented at the 3rd International
Wildland Fire Congress, Sydney, Australia, 3-6 October 2003..
Efremov, S.P., Efremova, T.T., Melentieva, N.V., 1994, Carbon stocks in bog ecosystems,
Carbon in forest and bog ecosystems of Russia, Krasnoyarsk 128-140. (in Russia)
Efremova, T.T., Efremov, S.P., Melentieva, N.V., 1998, Water resources of bogs of Russia
and assessment of their chemical composition, Geographia and prirodnye resursy
(Geography and natural resources) 2:79-84. (in Russia)
Efremova, T.t., Efremov, S.P., Melentieva, N.V., 1997, Stocks and content of carbon
compounds in bog ecosystems of Russia, Pochvovedenie (Soil science) 12:1470-1477. (in
Russia)
Forest ecosystems of the Yenisei meridian, 2002, Pleshikov, F.I., (ed) Novosibirsk, Publ.
House of SB RAS,: 356 p. (in Russia)
Furyaev, V.V., Vaganov, E.A., Tchebakova, N.M., Valendik, E.N., 2001, Effects of Fire and
Climate on Successions and Structural Changes in the Siberian Boreal Forests, Eurasian J.
For. Res. N2: 1-15.

32
Gloor, M., Fan, S.-M., Pacala, S. W., and Sarmiento, J. L., 2000, Optimal sampling of the
atmosphere for purpose inverse modelling: a model study, Global Biogeochem. Cycles
14:407–428.
Federation:
conclusions for extending international cooperation in UNO frames and global
programs in monitoring and assessing fires. In: Forest fire control at the ecoregional level,
World Bank, Publ House “Alex”, Moscow,: 26-66. (in Russia)
Goulden, M.L., Daube, B.C., Fan, S.-M., Sutton, D.J., Bazzaz, Munger, J.W., Wofsy, S.C.,
1997, Physiological responses of a black spruce forest to weather, JGR-Atmospheres
102(D24):28987-28996.
Grace, J., Malhi, Y., Lloyd, J., McIntyre, J., Miranda, A.C., Meir, P., Miranda, H., 1996, The
use of eddy covariance to infer the carbon balance of Brazilian rain forests. Global
Change Biol. 2:209-218.
Hollinger, D.Y., Kelliher, F.M., Schulze, E.-D., Bauer, G., 1998, Forest-atmosphere carbon
dioxide excahnge in Eastern Siberia. Agric. For. Meteorol. 90:291-306.
Isaev, A.S., Korovin, G.N., Zavarzin, G.A., 1998, Carbon turnover on the Russian area,
Moscow, RAS, . 63-95. (in Russia)
Jarvis, P.G., Massheder, J.M., Hale, S.E., Moncrieff, J.B., Rayment, M., and Scott, S.L.,
1997, Journal of Geophysical Research. 102:28953-28986.
Jenkinson, D.S., Rainer, J.H., 1977, The turnover of soil organic matter in some of
Rothamsted classical experiments, Soil Sci. 123(5):298-305.
Kasischke, E. S., Hyer, E. J., Novelli, P. C., Bruhwiler, L. P., French, N. H. F., Sukhinin, A.
I., Hewson, J. H., and Stocks, B. J., 2005, Influences of boreal fire emissions on Northern
Hemisphere atmospheric carbon and carbon monoxide, Global Biogeochem. Cycles 19:
GB1012, doi:10.10292004GB002300.
Kauppi, P.E., Posch, M., Hänninen, H.M., et al., 1997, Carbon reservoirs in peatlands and
forests in boreal regions of Finland, Silva Fennica. 31(1):13-25.
Keeling, R.F., Piper, S.C. and Heimann, M., 1996, Global and hemispheric CO2 sinks
deduced from measurements of atmospheric oxygen concentration, Nature 381:218-221.
Kelliher, F.M., Lloyd, J., Arneth, A., et al., 1999, Carbon dioxide efflux density from the
floor of a central Siberian forest, Agric. Forest. Meteorol. 94:217-232.
Knorre, A.A., 2003, Use of registering structures at assessing annual production of
components of phytocenoses in forest and bog ecosystems of Priyeniseisk Siberia, PhD
thesis abstract. – Krasnoyarsk,: 21p. (in Russia)
Korotkov, I.A., 1994, Forest regioning of Russia and of republics of the former Soviet Union,
Carbon in forest and bog ecosystems of Russia. Krasnoyarsk,: 170 p.
Levin, I., Ciais, P., Langenfelds, R., Schmidt, M., Ramonet, M., Sidorov, K., Tchebakova, N.,
Gloor, M., Heimann, M., Schulze, E.-D., Vygodskaya, N.N., Shibistova, O. and Lloyd, J.,
2002, Three years of trace gas observations over the EuroSiberian domain derived from
aircraft sampling a concerted action, Tellus, 54B(5):696-712.
Lloyd, J., Langenfelds, R., Francey, R.J., Gloor, M., Tchebakova, N., Zolotukhine, D., Brandt, W., Werner, A., Jordan, A., Allison, C., Zrazhewske, V., Shibistova, O., and Schulze, E.-D., 2002, A trace-gas climatology above Zotino, central Siberia, Tellus ,54B(5):749-767.
Makhov, G.A., Bazhin, N.M., Efremova, T.T., 1994, Methane emission from bogs of the area
between rivers Ob’ and Tom’, Chemistry in the interest of stable development 2:619-622.
(in Russia)
Vaganov, Efremov and Onuchin
Goldammer, J.G., Sukhinin, A.I., Chisar, I., 2004, Existing fire situation in Russian

Carbon Balance in Siberian Forests and Bogs 33
Milyukova, I., Kolle, O., Varlagin, A., Vygodskaya, N.N., Schulze, E.-D., and Lloyd, J.,
2002, Carbon balance of a southern taiga spruce stand in European Russia. Tellus,
54B(5):429-442
Mortazavi B., and Chanton J. P. 2002, Carbon isotopic discrimination and control of
nighttime canopy 18O-CO2 in a pine forest in the southeastern United States,
Global Biogeochem. Cycles 16(1):10.10292000GB001390.
Nabuurs, G.J., and Mohren, G.M.J., 1993, Carbon in Dutch forest ecosystems, Netherlands J.
Agricultural Sci. 41:309-326.
Nabuurs, G.J., and Mohren, G.M.J., 1995, Modelling analysis of potential carbon
sequestration in selected forest types, Can. J. For. Res., 25(7):1157-1172.
Naumov, A.V., Efremova T.T., Efremov, S.P., 1994, On emission of carbon dioxide and
methane from bog soils of Southern Vasyuganie, Sibirsky Ekologichesky jurnal (Siberian
ecological journal), 1(3):269-274. (in Russia)
Naumov, A.V., 1997, Plant respiration and carbon dioxide emission in the bog ecosystem,
Sibirsky Ekologichesky jurnal (Siberian ecological journal), 4:385-391.
Nilsson, S., Shvidenko, A.Z., Stolbovoi, et al., 2000, Full Carbon Account for Russia, IIASA,
Laxenburg, Austria.
Panikov, N.S., Titlyanova, A.A., Paleyeva, M.V., Semenov, A.M., Mironycheva-Tokareva,
N.P., Makarov, V.I., Dubinin, E.V., Efremov, S.P., 1993, Methane emission from bogs of
West Siberian south, DAS, 330(3):388-390. (in Russia)
Peat resources of RSFSR. 1991, Moscow: Torfgeologia (Peat geology), 100 p.
Peylin, P., 1999, 18
O isotopic composition in atmospheric CO2: A new tracerto estimate
photosynthesis at global scale. PhD Dissertation, Paris IVUniversity,. 221 pp.
P’yavchenko, N.I., 1985, Peat bogs, their natural and economical importance, Moscow,
Nauka (Science) 152 p. (in Russia)
Ryan, M.G., Lavigne, L.B., and Gower, S.T., 1997, Annual carbon cost of autotrophic
respiration in boreal forest ecosystem in relation to species and climate, J. Gephys.
Research 102:28871-28883.
Shibistova, O.B., Lloyd, D., Kolle, O., Arneth, A., Tchebakova, N.M., Zolotukhin, D.A.,
Zrazhevskaya, G.K., and Schulze, E.D., 2002a, Assessment of 2 accumulating by pine
stand using the eddy covariance method, DAS, 3:425-429. (in Russia)
Shibistova, O., Lloyd, J., Zrazhevskaya, G., Arneth, A., Kolle, O., Astrakhantceva, N.,
Shijneva, I., Knohl, A., and Schmerler, J., 2002b, Ecosystem respiration budget for a Pinus
sylvestris stand in Central Siberia, Tellus 54B(5):568-589.
Shibistova, O., Lloyd, J., Evgrafova, S., Savushkina, N., Zrazhewskaya, G., Arneth, A.,
Knohl, A., Kolle, O., and Schulze, E.-D., 2002c, Seasonal and spatial variability in soil
CO2 efflux rates for a central Siberian Pinus sylvestris fores. Tellus 54B(5):552-567.
Schulze, E.-D., Lloyd, J., Kelliher, F., Wirth, Ch., Rebmann, C., Luhker, B., Mund., M.,
Knohl., A., Milyukova., I., Schulze, W., Ziegler, W., Varlagin, A., Sogachev, A.,
Valentini, R., Dore, S., Grigoriev, S., Kolle, O., Panfyorov, M., Tchebakova, N., and
Vygodskaya, N.N., 1999, Productivity of forests in the Eurosiberian boreal region and
their potential to act as a carbon sink - a synthesis, Global Change Biology 5(6):703-722.
Shvidenko A., Nilsson S. 2003 A synthesis of the impact of Russian forests on global carbon
budget for 1961-1998, Tellus 55B:391-415.
Shvidenko, A.Z., Vaganov, E.A., and Nilsson, S., 2003, Biospheric role of Russian forests at
the start of the third millenium: carbon balance and Kyoto Protocol, Sibirsky
ekologichesky jurnal (Siberian ecological journal) 6:649-658. (in Russia)

34
Soja, A.J., Sukhinin, A.I., Cahoon, D.R., Shugart, H.H., and P.W., Stackhouse, 2004,
AVHRR-derived fire frequency, distribution, and area burned in Siberia, International
Journal of Remote Sensing 25(10):1939-1960.
Soja, A.J., Cofer III, W.R., Shugart, H.H., Sukhinin, A.I., Stackhouse, Jr. P.W., McRae, D.J.,
and Conard, S.G., 2004, Estimating fire emissions and disparities in boreal Siberia (1998
through 2002), Journal of Geophysical Research 109:(D14S06).
Sukhinin, A.I., Ivanov, V.V., Ponomarev, E.I., Slinkina, O.A., Cherepanov, A.V.,
Pavlichenko, E.A., Romasko, V.Y., and Miskiv, S.I., 2003, The 2002 Fire season in the
Asian part of the Russian Federation: A view from space, Int. Forest Fire News 28:18-28.
Sukhinin, A.I., French, N.H.F., Kasischke, E.S., Hewson, J. H., Soja, A.J., Csiszar, I.A., Hyer,
E.J., Loboda, T., Conard, S.G., Romasko, V.I., Pavlichenko, E.A., Miskiv, S.I., Slinkina,
O.A., 2004, Satellite-based mapping of fires in Russia: New products for fire management
and carbon cycle studies, J. Remote Sensing of Environment 93:546-564.
Sukhinin, A.I., 2004, Dynamics of the forest fire situation in the Asian part of Russia during
the fire season of 2003 (April- September), Int. Forest Fire News 29:113-118.
Suni T., Berninger, F., Vesala, T., Makkanen, T., Harri, P., Lindroth, A., Arneth, A.,
Shibistova, O., Lloyd, J., 2003, Air temperature triggers the recovery of evergreen boreal
forest photosynthesis in spring, Global Change Biology 9:1410–1426
Tans, P. P., Bakwin, P. S., and Guenther, D. W., 1996, A feasible global carbon cycle: a plan
to decipher today’s carbon cycle based on observations, Global Change Biol. 2, 309–318.
Tchebakova, N.M., Monserud, R.A., Nazimova, D.I., 1994, A Siberian Vegetation Model
Based on Climatic parameters, Can. J. For. Res. 24:1597-1607.
Utkin, A.I., Zamolodchikov, D.G., Chestnykh, O.V., Korovin, G.N., Zukkert, N.V., 2001,
Forests of Russia as a reservoir of organic carbon of the biosphere, Lesovedenie (Forest
science) 5:8-23. (in Russia)
Vaganov, E.A., Furyaev, V.V., Sukhinin, A.I., 1998, Fires of Siberian taiga, Priroda (Nature)
7:51-62. (in Russia)
Valentini, R., Metteucci, G., Dolman, A.J. et al., 2000, Respiration as the main determinant of
carbon balance in European forests, Nature 404:861-865.
Vompersky, S.E., Tsyganova, O.P., Kovalev, A.G., Glukhova, T.V., Valyaeva, N.A., 1999,
Bog formation of the Russian area as a factor of fixing atmospheric carbon, carbon
turnover on the area of Russia. Selected scientific proceedings on the problem “Global
evolution of the biosphere. Anthropogenic contribution”, Moscow, 124-145. (in Russia)
Vompersky, S.E., 1994, Role of bogs in carbon cycle, Readings to the memory of the
academician V.N.Sukachev. XI: Biogeocenotic peculiarities of bogs and their efficient
use. Moscow: Nauka (Science) 5-38. (in Russia)
Vaganov, Efremov and Onuchin
THE INTERACTION OF CO2 BETWEEN THE
ATMOSPHERE AND SURFACE WATERS OF
LAKE BAIKAL AND THE INFLUENCE OF
WATER COMPOSITION
V.M. Domysheva1, M.V. Sakirko
1, M.V. Panchenko
2 and D.A. Pestunov
2
1Limnological Institute SB RAS, Irkutsk;
2Institute of Atmospheric Optics, SB RAS, Tomsk
Abstract: Investigations into the inventory of CO2 in the hydrosphere are primarily
aimed gas exchange between the atmosphere and oceans. However, lakes
often are not considered as possible sources and sinks, even if they can be
locally important for many geographical regions. Lake Baikal covers a
tremendous area and has locally high biotic activity, and thus it can be
expected to play an essential role in regional CO2 dynamics. Measurements of
atmospheric CO2, dissolved gases and various aqueous chemical parameters
were performed at the Limnological Institute SB RAS site near Bolshie Koty
in 2003-2004
Key words: carbon dioxide, gas exchange, chemical composition of water, organic matter.
1. INTRODUCTION
The Kyoto Protocol on climate change occupies a particularly important
place among international conventions and agreements. This Protocol, which
will start in 2005, will for the first time apply economic market mechanisms
to addressing intergovernmental and trans-boarder environmental problems.
As such specialists involved in the investigation of CO2 sources and sinks
should now concentrate on regional scale processes.
Investigations of the hydrosphere CO2 inventory are primarily focused on
the study of gas exchange between the atmosphere and ocean. Lake systems,
in contrast, are often not considered as possible sources and sinks even if
35
S. Lombardi et al. (eds.),
Advances in the Geological Storage of Carbon Dioxide, 35–45.
© 2006 Springer. Printed in the Netherlands.
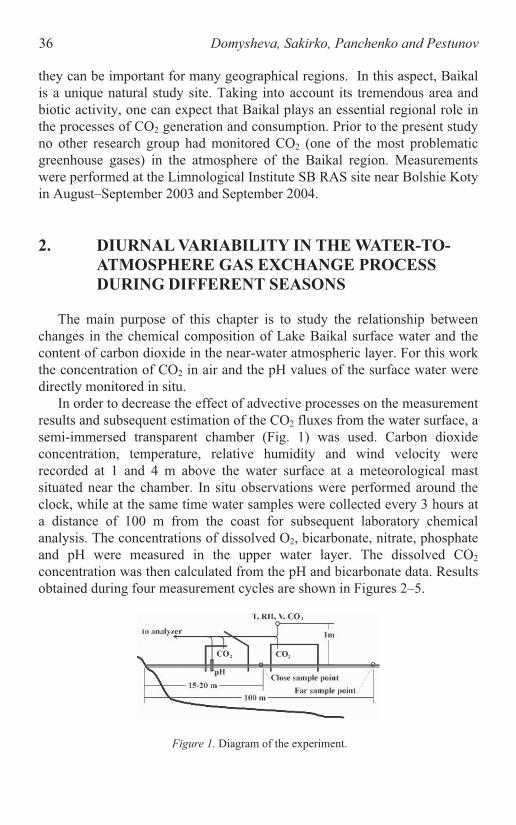
36 Domysheva, Sakirko, Panchenko and Pestunov
they can be important for many geographical regions. In this aspect, Baikal
is a unique natural study site. Taking into account its tremendous area and
biotic activity, one can expect that Baikal plays an essential regional role in
the processes of CO2 generation and consumption. Prior to the present study
no other research group had monitored CO2 (one of the most problematic
greenhouse gases) in the atmosphere of the Baikal region. Measurements
were performed at the Limnological Institute SB RAS site near Bolshie Koty
in August–September 2003 and September 2004.
2. DIURNAL VARIABILITY IN THE WATER-TO-
ATMOSPHERE GAS EXCHANGE PROCESS
DURING DIFFERENT SEASONS
The main purpose of this chapter is to study the relationship between
changes in the chemical composition of Lake Baikal surface water and the
content of carbon dioxide in the near-water atmospheric layer. For this work
the concentration of CO2 in air and the pH values of the surface water were
directly monitored in situ.
In order to decrease the effect of advective processes on the measurement
results and subsequent estimation of the CO2 fluxes from the water surface, a
semi-immersed transparent chamber (Fig. 1) was used. Carbon dioxide
concentration, temperature, relative humidity and wind velocity were
recorded at 1 and 4 m above the water surface at a meteorological mast
situated near the chamber. In situ observations were performed around the
clock, while at the same time water samples were collected every 3 hours at
a distance of 100 m from the coast for subsequent laboratory chemical
analysis. The concentrations of dissolved O2, bicarbonate, nitrate, phosphate
and pH were measured in the upper water layer. The dissolved CO2
concentration was then calculated from the pH and bicarbonate data. Results
obtained during four measurement cycles are shown in Figures 2–5.
Figure 1. Diagram of the experiment.

CO2 Interaction between the Atmosphere and Lake Baikal 37
As can be seen in all measurement series, the gas exchange process has a
well-defined diurnal behaviour, which is correlated with the change of near-
surface aqueous chemistry (pH). It can be seen that the rapid increase of
water pH and simultaneous decrease of CO2 concentration in the near-water
layer of the atmosphere begins at sunrise. This is an illustration of the fact
that the transfer of CO2 from the atmosphere to the water surface begins
practically simultaneously with the decrease of CO2 content in the water.
This process reverses direction shortly before sunset, and CO2 begins to be
transferred to the near-water layer of the atmosphere. The ratio between the
durations of “positive” and “negative” stages of the process is different in
different seasons, as well as the amplitude of the diurnal CO2 fluctuations
both in the atmosphere and in the measurement chamber, because these
parameters are related to the duration of insolation.
Figure 3. The results of measurements of CO2 and pH of water in October 2003.
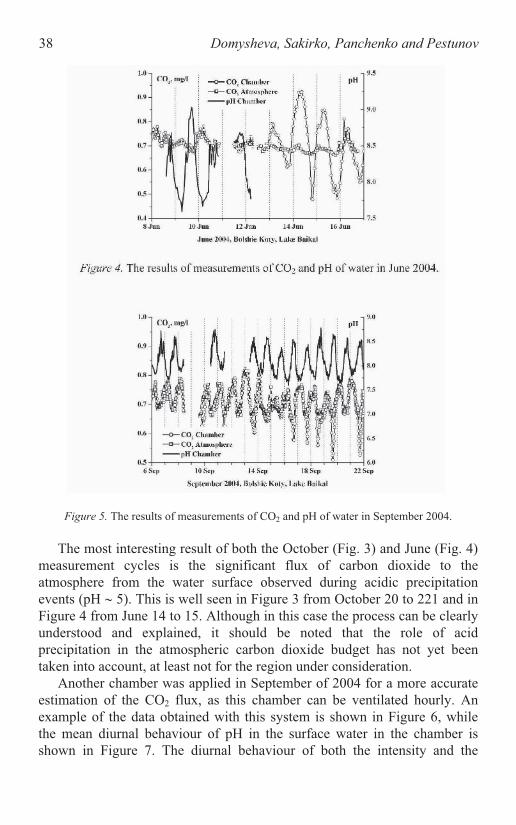
38 Domysheva, Sakirko, Panchenko and Pestunov
Figure 5. The results of measurements of CO2 and pH of water in September 2004.
The most interesting result of both the October (Fig. 3) and June (Fig. 4)
measurement cycles is the significant flux of carbon dioxide to the
atmosphere from the water surface observed during acidic precipitation
events (pH 5). This is well seen in Figure 3 from October 20 to 221 and in
Figure 4 from June 14 to 15. Although in this case the process can be clearly
understood and explained, it should be noted that the role of acid
precipitation in the atmospheric carbon dioxide budget has not yet been
taken into account, at least not for the region under consideration.
Another chamber was applied in September of 2004 for a more accurate
estimation of the CO2 flux, as this chamber can be ventilated hourly. An
example of the data obtained with this system is shown in Figure 6, while
the mean diurnal behaviour of pH in the surface water in the chamber is
shown in Figure 7. The diurnal behaviour of both the intensity and the
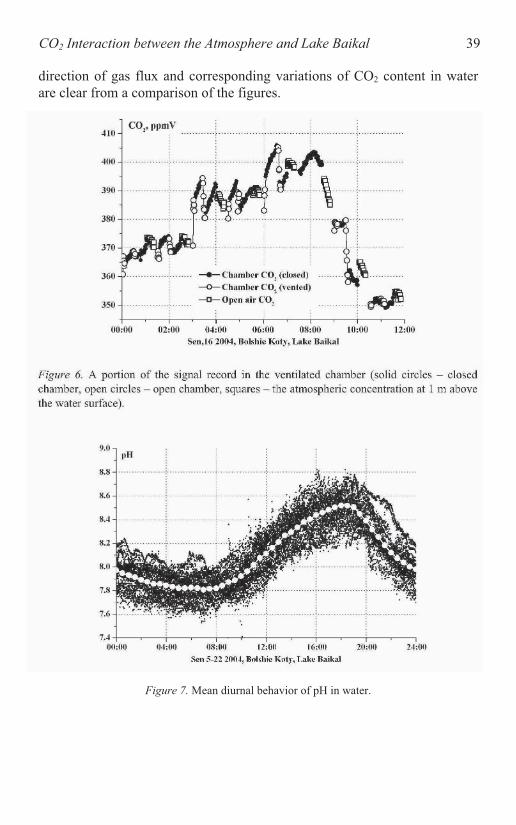
CO2 Interaction between the Atmosphere and Lake Baikal 39
direction of gas flux and corresponding variations of CO2 content in water
are clear from a comparison of the figures.
Figure 7. Mean diurnal behavior of pH in water.

40 Domysheva, Sakirko, Panchenko and Pestunov
3. ESTIMATION OF THE CO2 FLUX ACROSS THE
WATER SURFACE BY THE SEMI-IMMERSED
VENTILATED-CHAMBER METHOD
The flux (in this case) is the change of the mass of gas (m[ g]) in an
isolated air volume (v[l]) above an area (s[m2]) of the water surface due to
emission/absorption. Pure CO2 at a pressure of one atm weights 44 g/mol.
The mass of carbon dioxide in 1 litre (denoted as CCO2) at pressure P and
volume fraction c is:
][][760
][]/[96.1]/[
2
ppmVcmmHg
mmHgPlglgC
CO(1)
The mass of gas2
COM in the chamber of the volume V is:
][]/[][22
lVlgCgMCOCO
(2)
Thus, 238.2 mg of CO2 are contained in a chamber having a volume
V=320 l at the atmospheric content of carbon dioxide, where c = 400ppmV
and atmospheric pressure P = 720 mmHg.
The use of the “ventilated” chamber provides the possibility of more
accurate flux estimations, with an example shown in Figure 8.
Figure 8. An example of diurnal CO2 flux across the water surface.

CO2 Interaction between the Atmosphere and Lake Baikal 41
4. THE CHEMICAL COMPOSITION OF NEAR-
SURFACE WATER IN GAS EXCHANGE
EXPERIMENTS
A series of round-the-clock observations of some hydro-meteorological
and hydro-chemical parameters were carried out simultaneously with CO2
measurements. Measurements were performed every 3 hours at 2 stations
situated in the littoral zone of the lake at a water depth of 2 and 5 m.
Temperature, pH and the concentrations of dissolved oxygen, carbon dioxide
and bicarbonate ion were measured in the near-surface water layer (5cm).
Measurements of pH were carried out with an “Econics-Expert-001” ph-
meter (accuracy of 0.02 pH units), the oxygen concentration was measured
with the Winkler technique with a relative error of 0.3% (the sensitivity of
the method is 0.05 mg O2/l), and the bicarbonate ion concentration was
measured with the potentiometric method with an accuracy of ~ ± 2%. The
carbon dioxide concentration was determined with the titrimetric method
(the accuracy was 10%) and the concentration of free CO2 was calculated
using the 3
–
concentration, water temperature and pH reduced to in situ
temperature. The biogenic elements were determined using colorimetric
methods: silicone as silicic-molybdenum heteropolyacid, phosphates with
the formation of complex phosphorous-molybdenum acid, and nitrates by
liquid chromatography (with an accuracy of 5%).
Water samples were collected in September not only at the far site
(marked as “far” in graphs) but also between the chambers (“close”). Water
temperature differences (up to 9 C) and, possibly, the occurrence of water
plants cause the observed difference in gas geochemistry (Fig. 9).
Figure 9. Chemical composition of near-surface water at “close” and “far” sites.
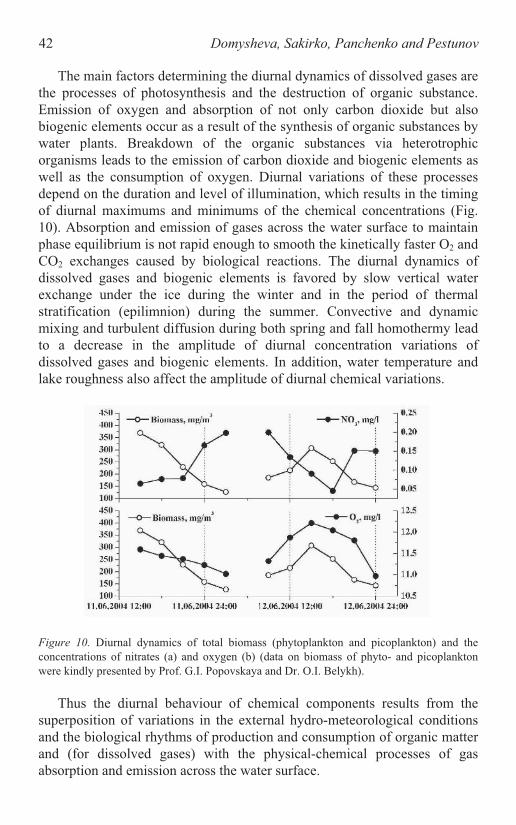
42 Domysheva, Sakirko, Panchenko and Pestunov
The main factors determining the diurnal dynamics of dissolved gases are
the processes of photosynthesis and the destruction of organic substance.
Emission of oxygen and absorption of not only carbon dioxide but also
biogenic elements occur as a result of the synthesis of organic substances by
water plants. Breakdown of the organic substances via heterotrophic
organisms leads to the emission of carbon dioxide and biogenic elements as
well as the consumption of oxygen. Diurnal variations of these processes
depend on the duration and level of illumination, which results in the timing
of diurnal maximums and minimums of the chemical concentrations (Fig.
10). Absorption and emission of gases across the water surface to maintain
phase equilibrium is not rapid enough to smooth the kinetically faster O2 and
CO2 exchanges caused by biological reactions. The diurnal dynamics of
dissolved gases and biogenic elements is favored by slow vertical water
exchange under the ice during the winter and in the period of thermal
stratification (epilimnion) during the summer. Convective and dynamic
mixing and turbulent diffusion during both spring and fall homothermy lead
to a decrease in the amplitude of diurnal concentration variations of
dissolved gases and biogenic elements. In addition, water temperature and
lake roughness also affect the amplitude of diurnal chemical variations.
Figure 10. Diurnal dynamics of total biomass (phytoplankton and picoplankton) and the
concentrations of nitrates (a) and oxygen (b) (data on biomass of phyto- and picoplankton
Thus the diurnal behaviour of chemical components results from the
superposition of variations in the external hydro-meteorological conditions
and the biological rhythms of production and consumption of organic matter
and (for dissolved gases) with the physical-chemical processes of gas
absorption and emission across the water surface.
were kindly presented by Prof. G.I. Popovskaya and Dr. O.I. Belykh).
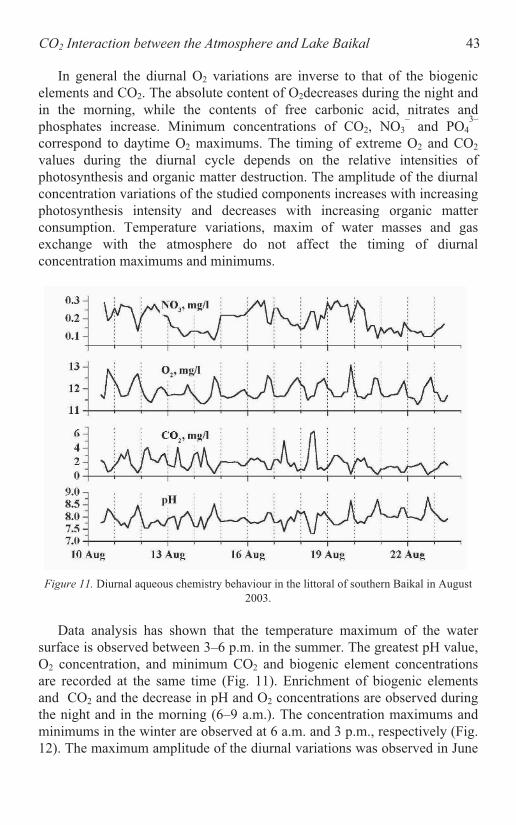
CO2 Interaction between the Atmosphere and Lake Baikal 43
In general the diurnal O2 variations are inverse to that of the biogenic
elements and CO2. The absolute content of O2decreases during the night and
in the morning, while the contents of free carbonic acid, nitrates and
phosphates increase. Minimum concentrations of 2, NO3
–
and PO4
3–
correspond to daytime O2 maximums. The timing of extreme O2 and CO2
values during the diurnal cycle depends on the relative intensities of
photosynthesis and organic matter destruction. The amplitude of the diurnal
concentration variations of the studied components increases with increasing
photosynthesis intensity and decreases with increasing organic matter
consumption. Temperature variations, maxim of water masses and gas
exchange with the atmosphere do not affect the timing of diurnal
concentration maximums and minimums.
Figure 11. Diurnal aqueous chemistry behaviour in the littoral of southern Baikal in August
2003.
Data analysis has shown that the temperature maximum of the water
surface is observed between 3–6 p.m. in the summer. The greatest pH value,
O2 concentration, and minimum CO2 and biogenic element concentrations
are recorded at the same time (Fig. 11). Enrichment of biogenic elements
and CO2 and the decrease in pH and O2 concentrations are observed during
the night and in the morning (6–9 a.m.). The concentration maximums and
minimums in the winter are observed at 6 a.m. and 3 p.m., respectively (Fig.
12). The maximum amplitude of the diurnal variations was observed in June
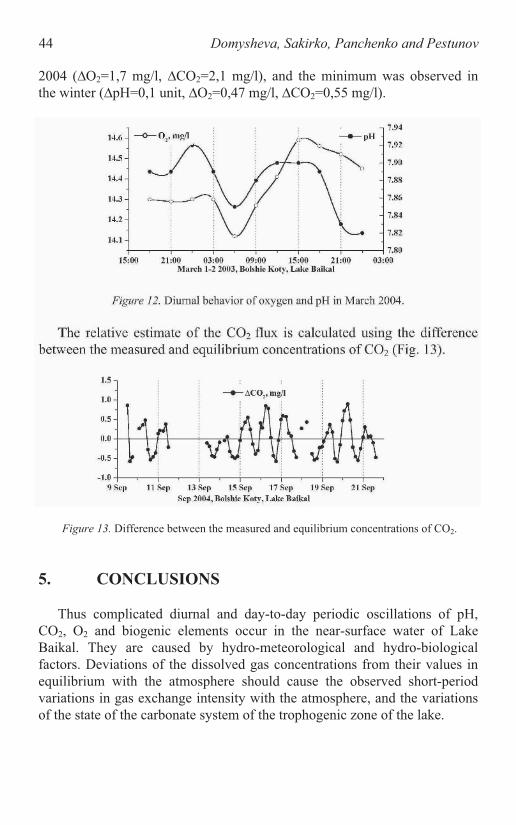
44 Domysheva, Sakirko, Panchenko and Pestunov
2004 ( 2=1,7 mg/l, 2=2,1 mg/l), and the minimum was observed in
the winter ( =0,1 unit, 2=0,47 mg/l, 2=0,55 mg/l).
5. CONCLUSIONS
Thus complicated diurnal and day-to-day periodic oscillations of pH,
CO2, O2 and biogenic elements occur in the near-surface water of Lake
Baikal. They are caused by hydro-meteorological and hydro-biological
factors. Deviations of the dissolved gas concentrations from their values in
equilibrium with the atmosphere should cause the observed short-period
variations in gas exchange intensity with the atmosphere, and the variations
of the state of the carbonate system of the trophogenic zone of the lake.
2Figure 13. Difference between the measured and equilibrium concentrations of CO .

CO2 Interaction between the Atmosphere and Lake Baikal 45
ACKNOWLEDGEMENTS
The work was supported in part by program No. 3 of the Department of
Earth Sciences RAS “Water resources, dynamics and preservations of
underground water and glaciers”, project “ The study of pollution of the
atmosphere and near-surface water of Lake Baikal” as well as SB RAS
expedition grant “Baikal”.
REMOTE SENSING AND GIS FOR SPATIAL
ANALYSIS OF ANTHROPOGENIC CARBON
OXIDE EMISSIONS
Yu.M. Polishchuk and O.S. Tokareva
Institute of Petroleum Chemistry, RAS, 3 Academichesky Ave., Tomsk, 634021, Russia
Abstract: Western Siberia hosts one of the main oil-bearing basins in Russia, producing
more than 70 % of the country’s oil. It is known that oil field flares release
carbon oxides into the atmosphere which contribute to the greenhouse effect.
This work details the development of a Geographical Information System
(GIS) technique which uses satellite image processing to assess the spatial
irregularities of anthropogenic carbon oxide emissions. This approach, which
tries to make a quantitative assessment of the impact of atmospheric pollution
on forest ecosystems, is based on calculating forest ecosystem areas (cells)
which are inside atmospheric pollution zones. Particular issues related to the
modeling of atmosphere pollution caused by oil field flares are considered.
Pollution zones were revealed by standard modeling of contaminant dispersal
in the atmosphere. Polluted ecosystem cells were calculated on the basis of oil
production volume.
Key words: remote sensing, geographic information systems, GIS, carbon oxides, gas
flares, environmental impact assessment, oil field
1. INTRODUCTION
Western Siberia hosts one of the main oil-bearing basins in Russia,
producing more than 70 % of the country’s oil. Oil reserves in Western
Siberia have been estimated to exceed 35 – 40 billion tons, and thus
production levels will remain high for at least the next two or three decades.
It is known that about half of the gas associated with the produced oil is
burnt in flares, with the subsequent release of carbon and nitrogen oxides,
hydrocarbons and soot into the atmosphere. Once released the carbon oxides
47
S. Lombardi et al. (eds.),
Advances in the Geological Storage of Carbon Dioxide, 47–55
© 2006 Springer. Printed in the Netherlands.
48 Poslishchuk and Tokareva
contribute to the greenhouse effect, soot blocks the stomas of conifer needles
that leads to the drying of forests (especially dark-coniferous ones due to a
long cycle of needle replacement), while nitrous oxides form acid
precipitation and oxidants in leaves which reduce plant viability (Polishchuk
et al., 1999). It is for these reasons linked to atmospheric pollution that Agan
forests near the largest Samotlor oil field in Western Siberia are dying.
At present, atmospheric pollution caused by oil field flaring is the main
environmental impact of oil production (Fedyunin, 1996; Polishchuk et al.,
1999)). Solving the ecological problems created by oil production in western
Siberia, perhaps through CO2 geological sequestration, requires a better
understanding of the spatial structure of anthropogenic carbon oxide
emissions. A geographic information system (GIS) approach to analysing the
spatial structure of carbon oxide emissions is discussed in this paper,
extending previous work which assessed the impact of atmospheric pollution
on the natural environment (Polishchuk and Tokareva, 2000, Polishchuk et
al., 2002). This approach to environmental impact is based on the
combination of health and geochemical methods (Polishchuk et al., 2002) for
the quantitative estimation of the forest-swamp ecosystems polluted in
western-Siberian oil-producing areas. This approach, however, requires
ecosystem maps, which are expensive and labour-intensive to produce with
traditional methods.
The use of satellite data decreases the costs of producing thematic maps,
however their application to assess environmental impact caused by oil
production is limited in the scientific literature. In addition the application of
GIS and GIS-technologies in combination with satellite imagery to study the
effects of pollution on forest-swamp ecosystems is even less common. The
application of mid-resolution space images which cover an area of up to
300-350 thousand km2 is more preferable to research ecosystem structures of
large territories.
In this regard, the main purpose of this paper is to address remote sensing
and GIS methods as applied to both the spatial analysis of oxide emissions
and the assessment of oil production impact on the natural environment in
western Siberia. The paper presents some results related to the effects of oil-
field flaring on forest-swamp ecosystems in Western Siberia.
As shown in Figure 1, the spatial distribution of atmospheric pollution in
Western Siberia is very irregular. One anomalous zone is located near the
towns of Nizhnevartovsk and Strezhevoi, caused by gas flaring in the
surrounding oil fields. The detailed analysis of this irregular spatial
distribution of oxide emission and environmental impact assessment can be
carried out using different cartographic and computer modeling techniques,
which are described in the following section.
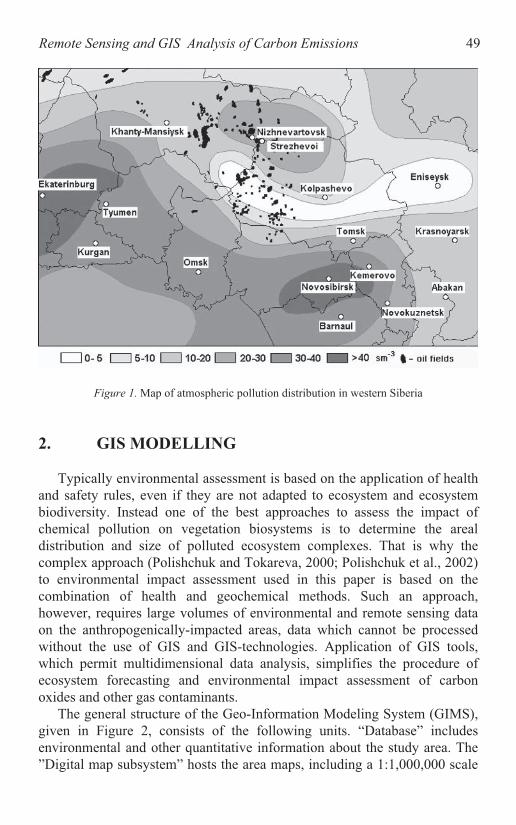
49
Figure 1. Map of atmospheric pollution distribution in western Siberia
2. GIS MODELLING
Typically environmental assessment is based on the application of health
and safety rules, even if they are not adapted to ecosystem and ecosystem
biodiversity. Instead one of the best approaches to assess the impact of
chemical pollution on vegetation biosystems is to determine the areal
distribution and size of polluted ecosystem complexes. That is why the
complex approach (Polishchuk and Tokareva, 2000; Polishchuk et al., 2002)
to environmental impact assessment used in this paper is based on the
combination of health and geochemical methods. Such an approach,
however, requires large volumes of environmental and remote sensing data
on the anthropogenically-impacted areas, data which cannot be processed
without the use of GIS and GIS-technologies. Application of GIS tools,
which permit multidimensional data analysis, simplifies the procedure of
ecosystem forecasting and environmental impact assessment of carbon
oxides and other gas contaminants.
The general structure of the Geo-Information Modeling System (GIMS),
given in Figure 2, consists of the following units. “Database” includes
environmental and other quantitative information about the study area. The
”Digital map subsystem” hosts the area maps, including a 1:1,000,000 scale
Remote Sensing and GIS Analysis of Carbon Emissions

50 Poslishchuk and Tokareva
digital map which forms the basis of the subsystem as well as other
topographical maps of other scales and different thematic digital maps. The
“Modeling subsystem” is the most dynamic part of the GIMS, as it is used to
calculate atmospheric contaminant concentrations in order to identify the
spatial distribution of atmospheric pollution.
Figure 2. General structure of the geo-information modeling system.
As is shown in Figure 2 “General software” consist of the GIS software
ArcView 3.x and ERDAS Imagine, while “Special software” consists of
various components to assess the impact of atmospheric pollution on the
ecosystem. One of the main components are program tools to identify
pollution zones by analysing modeling data from the “Modeling subsystem”
and to identify multiyear-averaged pollution zones. Air pollution zones
(Polishchuk and Tokareva, 2000) are determined for different pollutant
concentrations by modeling the pollutant dispersal in the atmosphere.
Another component of “Special software” is a computer program which
assesses impact. By overlaying pollution-zone outlines on the ecosystem
map it was possible to calculate the areas of the polluted complexes using
GIS tools. This code, developed with the program language Avenue,
calculates the relative areas of ecosystem types occurring in a pollution zone.
The program consists of some standard functions and is activated directly
within the ArcView interface. The user must first active the thematic layer
containing the pollution zone of interest and then start the calculation of the
relative areas. The layers containing ecosystem types for which the user
wants to make calculations will be accommodated in the list of the program.

51
The program calculates the area of every ecosystem type occurring in a
pollution zone, and then determines the its percentage relative to the full
ecosystem type area or the area of a satellite image. Calculation results are
represented graphically on the monitor screen, while the final impact
assessment results regard the analysis of polluted ecosystem areas
normalized to area. Clearly these relative areas will depend on the
concentration of the pollutants and the volume of the oil produced. The
results of this study are given below in the next sections.
3. SATELLITE IMAGE PROCESSING AND
MODELING OF POLLUTION ZONES
Satellite images are widely applied to the study of environmental status.
High and middle resolution images obtained from the Russian satellite
Resource–O1 were used in this paper. Satellite image processing involves
the following procedures:
1. Validation of remote sensing data.
2. Classification and interpretation.
3. Vectorization.
4. Thematic layer formation.
Ecosystem maps, forest-use plans and field data may all be used for
validation and classification. All basic forest-swamp ecosystem types are
represented within the pilot study territory (PT). The 1:1,000,000 scale
digital map was used as a topographic base map for the GIS. The middle
resolution satellite image classification was performed using ERDAS
Imagine software and forest-use maps as a classification scheme of the pilot
study territory. Classification results of the PT ecosystem types were then
moved to the entire studied area in the satellite image, which below will be
referred to as a “scene”. A fragment of a three-zone satellite image (spatial
resolution = 140 m) from the Russian satellite “Resource - O1” (scanner
MSU-SK) was used as the scene. Image vectorization was performed using
ERDAS Imagine and then vectorized data were exported to a GIS ArcView
format. The relative areas of each ecosystem type were determined using the
vectorized satellite image. The ratio of the areas of various vegetation types
characterize the ecosystem structure of the territory.
As mentioned above, the pollutant impact assessment is based on the
definition of the pollution zones and their subsequent plotting on the
computer map or satellite image. To identify the pollution zones it is
necessary to model pollutant distribution in the atmosphere. Nowadays there
Remote Sensing and GIS Analysis of Carbon Emissions

52 Poslishchuk and Tokareva
are many different models of air-chemical dispersion. The present work has
applied the OND-86 method, which is the most commonly used approach in
Russian environmental articles. It allows for the user to calculate chemical
concentrations at any point in the study area using the distance from the
emission source, year-averaged volume of emitted gas and average local
meteorological conditions. Modeling of air pollutant dispersal consists of the
following steps:
1. Determination of the locations of pollution sources using GIS and
computer maps. GIS allows a user to make spatial selections of map
objects and thus one can select pollution sources in the study area.
2. Input sources and chemical properties from the “Database”. The user
interface allows one to construct queries to the “Database” using dialog
forms and properties of selected air pollution sources and chemicals.
3. Calculation of chemical concentrations using the air pollutant dispersal
model.
Issues regarding the outlining of pollution zones were considered in
previous papers (Polishchuk and Tokareva, 2000; Polishchuk et al., 2002). In
summary this work involves the following steps:
1. Air pollution dispersion modeling.
2. Determination of pollution zone boundaries.
3. Visualisation of the pollution zones.
To outline the pollution zones it is necessary to determine chemical
concentrations throughout the study area. This is accomplished by dividing
the region into a spatial grid consisting of individual cells, the size of which
depends on the map representation scale. Every considered air pollution
source and chemical are accounted for via dispersal simulation in every cell.
The next step is to determine the boundaries of the areas, while the final step
involves the plotting of these boundaries on the computer map or satellite
image using GIS tools, as is shown in Figure 3.
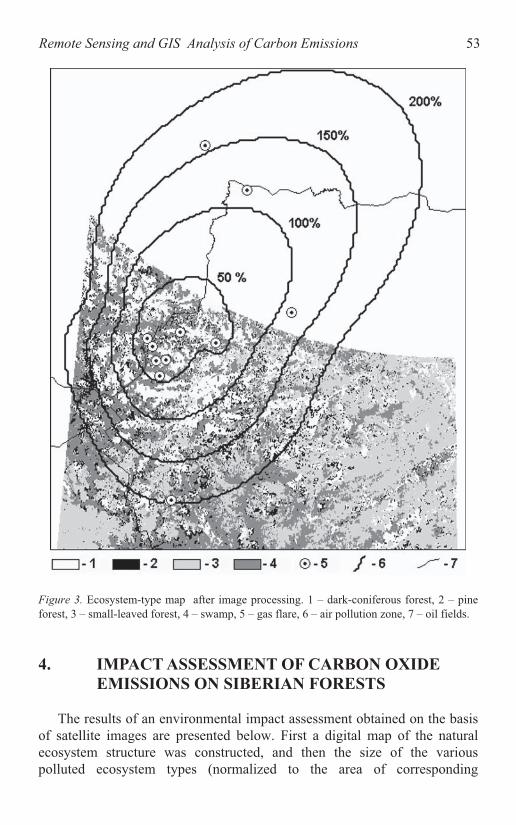
53
Figure 3. Ecosystem-type map after image processing. 1 – dark-coniferous forest, 2 – pine
forest, 3 – small-leaved forest, 4 – swamp, 5 – gas flare, 6 – air pollution zone, 7 – oil fields.
4. IMPACT ASSESSMENT OF CARBON OXIDE
EMISSIONS ON SIBERIAN FORESTS
The results of an environmental impact assessment obtained on the basis
of satellite images are presented below. First a digital map of the natural
ecosystem structure was constructed, and then the size of the various
polluted ecosystem types (normalized to the area of corresponding
Remote Sensing and GIS Analysis of Carbon Emissions

54 Poslishchuk and Tokareva
ecosystem type) were calculated. These relative areas depend on both the
pollution level and the volume of oil production, to which the volume of
burnt accompanying gas is connected. The dependency of the relative areas
of polluted ecosystems on the volume of oil production, calculated for fixed
levels of air pollution by carbon oxide emissions, are represented in Figure
4. Results of the calculations for oil fields of the Vasugan group, under
concentration, are 0,3*10-3
mg/m3.
Figure 4. Relative areas of polluted vegetation types, depending on the volume of oil
production at the Vasugan oil field. 1 – dark-coniferous forest, 2 – pine forest, 3 – small-
leaved forest, 4 – swamp.
5. CONCLUSIONS
Study results have shown that the geo-information approach to assess
ecological impact caused by chemical atmospheric pollution using remote
sensing data allows the objective definition of areas having significant
ecological loads on specific ecosystems. The described procedures,
involving satellite image processing, makes it possible to transfer the results
from the classification of one satellite image section onto other sections of a
satellite image showing regions which are difficult to access. Such an
approach allows the analysis of various vegetation types and ecosystems
over large territories using satellite imagery. This approach may be used to
carry out regular monitoring of changes in the ecological load, both
depending on oil recovery levels and ecosystem types. The paper
demonstrates the opportunity to study the spatial distribution of
55
anthropogenic carbon oxide emissions and to assess its environmental
impact.
This paper is the result of research performed within Integration projects
137, 138, and 169 of the Siberian Branch of the Russian Academy of
Sciences. This work was also performed with EC INCO Copernicus 2
support (Project ISIREMM, contract ICA2-CT-2000-10024), EC INTAS
support (Project ATMOS: A Scientific WWW Portal for the Atmospheric
Environment, contract: INTAS-00-189), and RF President’s grant support
for leading scientific schools (grant SS-1008.2003.5).
REFERENCES
Fedyunin, V.A., 1996, Environmental Protection at “Tomskneft”, Oil industry, 11, pp. 87-89.
Polishchuk, Yu., Kozin, E., Ryukhko, V., Tokareva, O., 1999, Geoinformation Systems for
Regional Environmental Studies, Proceedings of SPIE, 3983, pp. 572 – 577.
Polishchuk, Yu., Tokareva, O., 2000, Geoinformation analysis of atmosphere pollution
impact on the ecosystem of Siberian oil-producing territories, Proceedings of SPIE, 4341,
pp. 571 – 577.
Polishchuk, Yu., Tokareva, O., and Bulgakova, I., 2002, Space Images Processing
Methodology for Assessment of Atmosphere Pollution Impact on Forest-Swamp
Territories, Proceedings of SPIE, 5026, pp. 232 – 236.
ACKNOWLEDGEMENTS
Remote Sensing and GIS Analysis of Carbon Emissions
THE SOURCES OF CARCINOGENIC PAH
EMISSION IN ALUMINIUM PRODUCTION
1 2 1
1Institute of Chemistry and Chemical Technology, SB RAS, K.Marx str. 42, Krasnoyarsk
660049, Russia; 2N.N.Vorozhtsov Novosibirsk Institute of Organic Chemistry, SB RAS,
Lavrentyev av. 9, Novosibirsk 630090, Russia
Abstract: Specific yields were determined for tars, benzo(a)pyrene,
diberzo(ah)anthracene and benzo(ghi)perylene from the main PAH sources in
aluminium production using Soderberg cells with anode pastes based on
medium- (MP) and high- (HP) softening-point pitches. It was evaluated that
the most significant source of carcinogens from the Soderberg cell is the open
hole during the process stage of repositioning the current-carrying studs. This
phase of the work contributes about 60-70% of the total carcinogenic PAH
emissions to the atmosphere. It is shown that a replacement of MP with HP
results in a decrease of the specific tar yields from all sources, but it does not
reduce the specific yield of the carcinogenic PAHs and therefore the
carcinogenic danger of this technology.
Key words: aluminium production; anode pastes; carbonisation; carcinogenic PAHs;
coal-tar pitches; Soderberg cell.
1. INTRODUCTION
About 2M tons of aluminium is currently generated by the plants in
Siberia. Unfortunately only a minor part is generated using the currently
environmentally-appropriate “prebaked” technology, which ensures low
specific yields of tar that contain carcinogenic polycyclic aromatic
hydrocarbons (PAHs) (0.06 kg/t Al based on data from the Pechiney
Company). Instead the majority of aluminium is generated in Soderberg
cells with self-baking anodes, which generates the highest carcinogenic risk
57
S. Lombardi et al. (eds.),
Advances in the Geological Storage of Carbon Dioxide, 57–65.
© 2006 Springer. Printed in the Netherlands.
USING SODERBERG CELLS
L.I. Kurteeva , S.V. Morozov and A.G. Anshits
58 Kurteeva, Morozov and Anshits
in aluminium production. The specific tar yields are considerably higher for
aluminium productions that use Soderberg technology, producing 0.21 kg/t
Al with a ‘dry’ gas cleaning system (Reynolds Company) and up to 0.65 kg/t
Al with a ‘wet’ gas cleaning system at the Krasnoyarsk aluminium plant
(Kaiser Aluminium & Chemical Corporation) (Johnson and Lobachev,
1998). The reduction of carcinogenic PAH emissions is ecologically very
significant for large centres of aluminium production using Soderberg
technology (Krasnoyarsk, Bratsk, Irkutsk, Novokuznetsk).
When determining specific yields of tar and carcinogenic PAHs using
Soderberg technology, emissions from the gas cleaning system and gas
escapes from under the gas skirt are traditionally considered while the
process stage of current-carrying stud repositioning is not. It is important to
evaluate the contribution of two major sources of atmospheric PAH
emissions: 1) gases formed during slow (0.01-0.1°/min) carbonisation of
‘dry’ anode paste and anode body formation; and 2) gases released from the
open hole during stud repositioning, when rapid heating (70-100°/min)
pyrolysis of the studhole anode paste takes place, and ‘secondary’ anode
formation.
The use of high-softening-point pitches (HP) instead of medium-
softening-point pitches (MP) to prepare the anode paste is considered one of
the ways to reduce the environmental danger. Such a replacement is
associated with economic and technological advantages due to a decrease in
anode paste consumption and a decrease in specific tar yields, which should
in turn result in a decrease of carcinogenic PAH yields. However, it has not
been proven that a switch from MP to HP will decrease the carcinogenic
danger. As such it is important to compare the carcinogenic PAH yields of
carbonisation products of MP, HP and anode pastes based on MP (APMP)
and HP (APHP).
The objectives of this work are to evaluate the contributions of the main
sources of carcinogenic PAH emissions and to compare their carcinogenic
danger during aluminium production using Soderberg cells.
2. EXPERIMENTAL
Samples of medium- and high-softening-point coal-tar pitches were used
under laboratory conditions. The elemental composition and technical
characteristics of the pitches are presented in Table 1. Samples of industrial
‘dry’ anode pastes were used which contained petroleum coke calcined at
1,200°C and 30.5 wt.% MP or 27 wt.% HP. Studhole anode paste was also
used, which contained 37 wt.% MP or HP (APMP and APHP).

Sources of PAH Emissions in Aluminium Production 59
The experimental techniques for simulating the formation of slow
(1°/min) and rapid (70°/min) carbonisation were described by Koptyug et
al. (1997) and Anshits et al. (2001). Extraction of industrial dust and carbon
residues was described by Kurteeva et al. (2002). Analysis of PAHs in
pyrolysis tars and extracts was carried out using the U.S. EPA method
number 610, using a micro-capillary quartz column with an SE-54
immobilized silicone phase (12 m x 0.2 mm x 0.3 µm). The overall content
of anthracene and phenanthrene (A+Ph) was determined, as well as the
contents of the following individual PAHs: fluoranthene (Fl), pyrene (Py),
benz(a)anthracene (BaA), chrysene (Chr), benz(b)fluoranthene (BbF),
benz(e)pyrene (BeP), benz(a)pyrene (BaP), dibenz(ah)anthracene (DBA),
benz(ghi)perilene (BP). The sum of the PAHs ( PAH) was determined as a
summary content of A+P and 9 individual PAHs.
Parameter High-softening-point pitch Medium-softening-point pitch
Softening point, °C 110-113 (Metler) 75-77 (ring-rod)
Content, wt.%:
Insoluble matter:
In toluene 25.6-26.4 26.0-28.0
In quinoline 6.0-7.0 10.0-13.8
Volatiles 56 55-58
Ash 0.16-0.20 0.10-0.20
Content, wt.%:
C 92.46-93.01 91.66-92.48
H 4.00-4.40 3.90-4.10
N 1.00-1.08 1.52-1.75
S 0.27-0.36 0.16-1.27
O (determined by
difference)
1.44-1.78 1.46-1.76
C/H 1.75-1.94 1.80-1.88
3. SIMULATION OF SODERBERG ANODE
FORMATION UNDER LABORATORY
CONDITIONS
Simulation of industrial carbonisation conditions permits an estimate of
the ecological danger caused by the various process stages when using
different feedstock. As such a laboratory study of MP, HP and APMP,
APHP was carried out under conditions which simulate both regimes of
Soderberg anode formation: slow (1°C/min) carbonisation of ‘dry’ anode
paste and formation of the anode body, and rapid heating (70°C/min)
carbonisation of the studhole anode paste and formation of a ‘secondary’
Table 1. The elemental composition and technical characteristics of the studied pitches.

60 Kurteeva, Morozov and Anshits
anode. To take into account random feedstock variations a required number
of experimental data was treated statistically.
The dynamics and content of the main products (gases, tar containing
PAHs, carbon residue) during slow (1°/min) carbonisation of MP and HP
have been studied. During pitch carbonisation (1°/min) the formation of the
main ( 2, 4) (Fig. 1) and minor gases ( 2 6, 3 8, ) were observed.
Intensive gas generation was observed in the low- (480-530° ) and high-
(640-750° ) temperature intervals, with rate peaks occurring at 460-500°
and 720° . The generation of ethane and propane was only observed in the
low-temperature interval. Within the high-temperature interval the peak gas
generation rates for MP were higher compared to those for HP. For both
pitches a steady hydrogen generation rate was observed within the
temperature range of 500-800° (Fig. 1).
The thermochemical conversion processes were accompanied by thermal
effects, predominantly with heat absorption in the low-temperature range
(460-520°C) and heat release in the high-temperature range (680-720°C)
(Fig. 1). For MP there was a retarding (by 50-100°C), a cessation in growth,
or even a decrease in temperature in the reaction layer of a pitch sample as
compared with the furnace temperature in the low-temperature range. The
temperature rise rate increased in the high-temperature range. The thermal
effects here are considered minor during HP carbonisation (Fig. 1). The
main tar release occurs from 640 to 750° , at the same time as the gases,
while the main release of carcinogenic PAHs (BaP, DBA, BP) occurs within
700-800° (Fig. 2).
Thus the study of the dynamics of the main products formed during MP
and HP slow (1°/min) carbonisation indicates two intervals of intensive gas
generation: the low- and high-temperature areas, with peaks of gas
generation rates at 460-500° and 720° along with the simultaneous
generation of tar and carcinogenic PAHs within the high-temperature
interval.
During the current-carrying stud repositioning stage, anode paste is
placed into the open hole. The hole bottom temperature is 700-850°C, and
thus rapid pyrolysis of the anode paste takes place along a front of high
temperature heating.
The laboratory study showed that the tar yields during rapid heating
carbonisation of APMP and APHP are about 10 times higher (and yields of
carcinogenic PAHs are about 5-30 times higher), than with slow
carbonisation of both anode pastes (Fig. 3). Based on this it was shown that
the most significant source of atmospheric emissions of carcinogenic PAHs
is the open hole, where rapid heating carbonisation of the studhole anode
paste takes place.

Sources of PAH Emissions in Aluminium Production 61
Furnace temperature, °
V, m
ol/
(g*
min
) *
10
-5
0
2
4
6
8
400 500 600 700 800
MP
Furnace temperature, °
em
pera
ture
of
pit
ch
, °
300
400
500
600
700
800
400 500 600 700 800
HP
pitch samples ( ) with furnace temperature ramping (heating rate 1°C/min) during
carbonisation of MP (sampling 16) and HP (sampling 7).
,°
Yie
ld,
wt.
%
0
1
2
3
4
5
550 600 650 700 750 800
, tar
, summa PAHs
,°
0.0
0.1
0.2
0.3
0.4
0.5
550 600 650 700 750 800
BaA
Chr
BbF
BeP
BaP
DBA
BP
Figure 2. Dependence of tar and PAH yields on carbonisation (heating rate 1°C/min)
temperature of MP (---) and HP ( ).
It was established that the tar yields during slow and rapid heating
carbonisation of HP and APHP are reduced approximately 1.5 times as
compared with MP and APMP. These results verify data by Mirtchi et al.
(1995) and Sertakov et al. (1998) regarding a decrease in tar yields when
using HP instead of MP. However, the yields of BaP and other carcinogenic
PAHs are not reduced (Fig. 3), and thus the replacement of MP with HP
does not result in a decrease in the yield of carcinogenic PAHs and,
therefore, the carcinogenic danger of Soderberg technology.
Under actual industrial conditions, tars containing carcinogenic PAHs are
generated in an adsorbed state on the surface of dispersed particles such as
soot, alumina (Lane, 1989). In order to understand how well the laboratory
experiments represent true industrial conditions, a comparison was made of
the profiles of PAHs generated from anode paste pyrolysis tars in the
laboratory and the profiles of extraction tars of industrial dusts and slimes
from the Krasnoyarsk aluminium plant (KrAZ), for both carbonisation
regimes. Earlier these profiles were analysed by Anshits et al. (2001), and it
Figure 1. Variations in the formation rate of hydrogen ( ), methane ( ) and temperature of

62 Kurteeva, Morozov and Anshits
was shown that they are practically identical. Based on these results one can
conclude that the laboratory data can be used to assess the carcinogenic
danger of slow and rapid heating stages of Soderberg anode formation.
Yie
ld.
wt.
% o
f an
od
e p
aste
0
2
4
6
8
10
12
14
16
18
APMP APHP APMP APHP
tar
1°C/min
70°C/min
Yie
ld.
wt.
% o
f an
od
e p
aste
0.0
0.1
0.2
0.3
0.4
APMP APHP APMP APHP
BaA
BaP
DBA
1°C/min
70°C/min
Figure 3. Yields of tars and carcinogenic PAHs of slow (1°/min) and rapid (70°/min) heating
carbonisation of anode pastes based on the medium- (APMP) and high- (APHP) softening-
point pitches. Sampling for the slow carbonisation : 8 for APMP, 9 for APHP; sampling for
the rapid heating carbonisation : 3 for APMP, 5 for APHP.
4. EVALUATION OF INDUSTRIAL SOURCES OF PAH
EMISSIONS UNDER THE CONDITIONS OF
SODERBERG ANODE FORMATION
Specific yields of tar and carcinogenic PAHs generated from the main
technogenic sources from KrAZ when using APMP and APHP were
calculated using the Methodika VAMI (1988). This method uses anode paste
consumption values, the efficiency factors for all gas cleaning system
devices, the permeability of the gas skirt, and the results of laboratory
research into carbonisation of pitches and anode pastes based on these
pitches.
As an example, Figure 4 schematically illustrates the balance of specific
yields of tar and the most dangerous carcinogenic PAHs (BaA, BaP and
DBA) from the main sources of the KrAZ Soderberg electrolyser when
using APMP and the ‘wet’ gas-cleaning system. The local sources of tars
containing PAHs include:
emission from the hole during stud repositioning;
gas escape from under the gas skirt;
emission of the ‘wet’ gas-cleaning system;
slimes during slime storage.

Sources of PAH Emissions in Aluminium Production 63
tar 7,7 ± 2,3
BaA 0,3 ± 0,1
BaP 0,05 ± 0,01
DBA 0,01 ± 0,003
burners
slime storage: tar 2,4; BaP 0,008
dust of
electrofilters
tar 1,7
BaP 0,005
slimes
tar 0,7;
BaP 0,003
emission of the
gas-cleaning system
tar 0,9
BaA 0,035
BaP 0,006
DBA 0,001
under the
gas skirt
tar 1,2
BaA 0,046
BaP 0,007
DBA 0,002
from the hole
tar 2,1
BaA 0,038
BaP 0,034
DBA 0,024
‘wet’ gas-cleaning
system
Figure 4. Specific yields of tar and carcinogenic PAHs from the main sources of the KrAZ
Soderberg electrolyzer using anode paste based on medium-softening point pitch and ‘wet’
Rapid carbonisation of the studhole anode paste determines the emissions
from the hole, slow carbonisation of ‘dry’ anode paste determines other
emissions.
It is interesting to compare the specific yields of carcinogenic PAHs
generated from the main local sources, i.e. from the hole during stud
repositioning, gas escape from under the gas skirt and emission of the gas-
cleaning system. The calculated specific yield values of tar and carcinogenic
PAHs (BaA, BaP and DBA) from the main sources when using anode pastes
based on MP and HP, and ‘wet’ and ‘dry’ gas-cleaning systems, are
presented in Table 2.
These results indicate that the most dangerous local source of
carcinogenic PAHs is emission from the open hole at the process stage of
stud repositioning, which is about 60-70% of the total atmospheric emission.
It stipulated low specific tar yields in aluminium production using the
Soderberg technology of the Reynolds Company, Kaiser Aluminium &
Chemical Corporation and other firms. In particular, when using HP-based
anode paste the specific yield of BaP from the hole is 0.037 kg/t Al while the
total atmospheric emission is 0.048 kg/t Al, which includes emissions from
the hole, gas escape from under the gas skirt, and emissions from the ‘dry’
gas cleaning system. Traditionally this source has not been considered in
calculations of specific yields of tar. Thus, the calculated total specific yield
gas-cleaning system.

64 Kurteeva, Morozov and Anshits
of tar when using APMP is 2.1 kg/t Al, excluding emissions from the hole
(Table 2), which corresponds to data reported for the Krasnoyarsk
aluminium plant (2.09 kg/t Al - Zhuravlev and Petushkov, 1998). When
using HP, the specific tar yield is 0.9 kg/t Al excluding emissions from the
hole (Table 2). There is a good correlation with data from the KrAZ-Kaiser-
VAMI project (Johnson and Lobachev, 1998) – 0.39-0.65 kg/t Al. The total
emission of carcinogenic PAHs in this project is reduced due to the use of
the ‘dry’ gas cleaning system, and not due to the replacement of MP with
HP.
Table 2. Specific yields (kg/t Al) of tar and carcinogenic PAHs from the main sources of
technogenic waste produced by the Krasnoyarsk aluminium plant when using anode pastes
APMP APHP Technogenic
emission tar BaA BaP DBA tar BaA BaP DBA
From the hole 2.1 0.038 0.034 0.024 1.5 0.049 0.037 0.017
From under the
gas skirt
1.2 0.046 0.007 0.002 0.8 0.048 0.009 0.002
From the gas
cleaning system:
‘wet’ 0.9 0.035 0.006 0.001 0.6 0.036 0.007 0.0016
‘dry’ - - - - 0.1 0.006 0.002 0.0002
A replacement of APMP with APHP in aluminium production using
Soderberg cells results in a decrease in the yield of tar from all local sources.
However, in this case the yield of BaP and other carcinogenic PAHs from
these sources is not reduced.
5. CONCLUSIONS
The laboratory research into slow and rapid carbonisation of MP and
HP, and anode pastes based on these products, has been studied. The
dynamics and the content of the main products formed (gases, tar containing
PAHs, carbon residue) during slow (1°/min) carbonisation of MP and HP
have been studied.
It was shown that during rapid (70°/min) carbonisation of anode pastes,
the yields of tar are about 10 times higher and yields of carcinogenic PAHs
are about 5-30 times higher than with slow carbonisation . Based on this, the
most significant source of carcinogenic danger of Soderberg cells was found
to be the open hole during the process stage of repositioning the current-
carrying studs. Despite the finding that this stage contributes 60-70% of the
based on MP (APMP) and HP (APHP).

Sources of PAH Emissions in Aluminium Production 65
carcinogenic emissions of PAHs to the atmosphere, this source is
traditionally not considered.
Specific yields were determined for tars, BaA, BaP and DBA from the
main sources of PAHs in aluminium production using vertical stud
Søderberg cells with anode pastes based on MP and HP. It was shown that
use of HP in the anode pastes results in a considerable decrease of specific
tar yields from all sources, as compared with MP, while the specific yields
of BaP and other carcinogenic PAHs does not change significantly. A
replacement of MP with HP in aluminium production using Søderberg
technology does not reduce the carcinogenic danger of this production
technique.
REFERENCES
Anshits, A.G., Kurteeva, L.I., Tsyganova, S.I., Suzdorf, A.R., Anshits, N.N., and Morozov,
S.V, 2001, The Estimation of the Carcinogenic Substance Emission Using Medium- and
High-Softening-Point Pitches in Aluminium Production in Soderberg electrolyzer,
Chemistry for Sustainable Development. 9, pp. 345-352.
Johnson J.A., and Lobachev S.V., 1998, Krasnoyarsk Aluminium Anode Paste Plant:
Modernization and Phase 1 Conversion to Dry Anode Operation, Light Metals. pp. 721-
728.
Koptyug, V.A., Anshits, A.G., Savinov, V.I., Suzdorf, A.R., Morozov, S.V., Kurteeva, L.I.,
Vereshchagin, S.N., Frizorger, V.K., Anshits, N.N., and Krak, M.I., 1997, Ecological risk
of aluminium production in Soderberg electrolyzers. Formation of the Main Products of
Thermochemical Conversion of Medium-Softening-Point Pitches during Slow Pyrolysis
and Estimation of Their Carcinogenic Danger, Chemistry for Sustainable Development. 5,
pp. 553-567.
Kurteeva, L.I., Tsyganova, S.I., Morozov, S.V., Anshits, N.N., Suzdors, A.R., Plekhanov,
V.P., and Anshits, A.G., 2002, Study of the Stage Determing the Emission of
Carcinogenic Polycyclic Aromatic Hydrocarbons during the Carbonisation of the
medium-softening-point pitches, Chemistry for Sustainable Developmen. 10, pp. 431-441.
Lane, D.A., 1989, In: Chemical analysis of polycyclic aromatic compounds, T. Vo-Dinh, ed.,
John Wiley & Sons, New York, p.31.
Metodika VAMI, 1988, Method of waste determination in aluminium production using
vertical stud Søderberg cells, VAMI, Leningrad, pp.1-30. (in Russian).
Mirtchi, A.A., Proulx, A.L., and Castonguay, L., 1995, Reduction of the PAH Emissions for
Horizontal Stud Soderberg Potrooms, Light metals. pp. 601-605.
Sertakov, N.N., Aleksandrov, A.I., and Lazarenko, O.Yu., 1998, Influence of Different
Factors on the Quality of Anode Paste, Nonferrous Metals. 6, pp. 41.
Zhuravlev, Yu.A., and Petukhov, M.P., 1998, Economical Aspects of Modernization of
Production in Krasnoyarsk Aluminium Plant, Nonferrous Metals. 5, pp. 53-58.

PART II
PERMAFROST CO2 STORAGE
The Potential for using Permafrost Terrains
for the Geological Storage of Carbon Dioxide

DISTRIBUTION OF PERMAFROST IN RUSSIA
Frozen ground and CO2 sequestration
V.P. Melnikov and D.S. Drozdov
Earth Cryosphere Institute SB RAS, P/O 1230, Tyumen, Russia (E-mail: [email protected],
Abstract: Vast areas of the Russian north is underlain by permafrost, and many of these
areas also host exploitable oil and gas reserves as well as various industries
which are sources of atmospheric CO2 pollution. It has been suggested that
permafrost in this region could be used to host or to isolate man-made CO2 in
deep geological reservoirs, however an in-depth understanding of permafrost
distribution, morphology, structure and stability is required in order to
examine its feasibility and long-term safety. The present work outlines the
spatial distribution of permafrost in Russia, defines the various formation
histories, mechanisms and structures, and discusses the permafrost types
which may be best suited to CO2 sequestration.
Key words: Cryolithozone / permafrost distribution or extent / lithology / cryopeg / talik /
sub-permafrost CO2 sequestration
1. INTRODUCTION
Cryolithozone occupies 2/3 of the Russian Federation territory, including
northern and north–eastern regions of Russia. Within these areas cryotic
rocks containing ice inclusions make up a part or all of the near-surface part
of the earth’s crust. To the south, outside the cryolithozone, only seasonal
soil freezing occurs.
The cryolithozone areas are primarily under-developed regions with
inclement climatic conditions. The economics of these regions are basically
dependent upon either traditional activities which have little affect on the
geo-ecology of the area, or on natural resource development. The
geocryological aspect is particularly important for petroleum and natural gas
industries, since the most significant fields and prospects are situated in the
69
S. Lombardi et al. (eds.),
Advances in the Geological Storage of Carbon Dioxide, 69–80.
© 2006 Springer. Printed in the Netherlands.
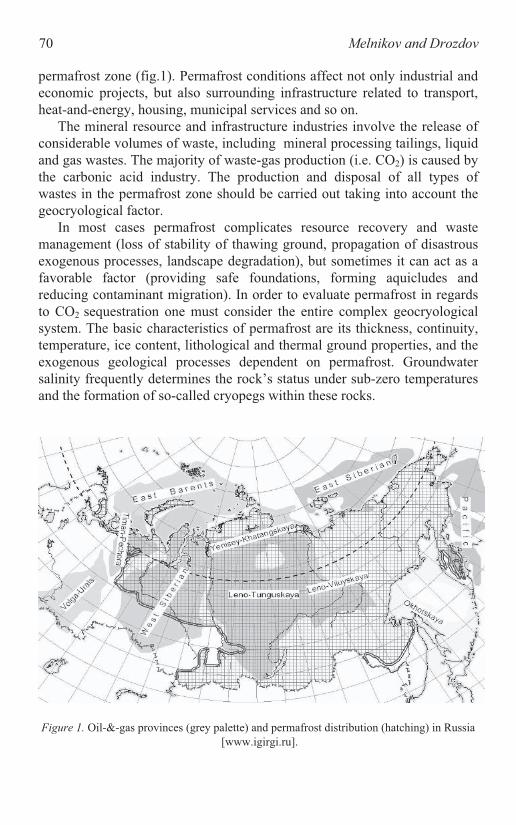
70 Melnikov and Drozdov
permafrost zone (fig.1). Permafrost conditions affect not only industrial and
economic projects, but also surrounding infrastructure related to transport,
heat-and-energy, housing, municipal services and so on.
The mineral resource and infrastructure industries involve the release of
considerable volumes of waste, including mineral processing tailings, liquid
and gas wastes. The majority of waste-gas production (i.e. CO2) is caused by
the carbonic acid industry. The production and disposal of all types of
wastes in the permafrost zone should be carried out taking into account the
geocryological factor.
In most cases permafrost complicates resource recovery and waste
management (loss of stability of thawing ground, propagation of disastrous
exogenous processes, landscape degradation), but sometimes it can act as a
favorable factor (providing safe foundations, forming aquicludes and
reducing contaminant migration). In order to evaluate permafrost in regards
to CO2 sequestration one must consider the entire complex geocryological
system. The basic characteristics of permafrost are its thickness, continuity,
temperature, ice content, lithological and thermal ground properties, and the
exogenous geological processes dependent on permafrost. Groundwater
salinity frequently determines the rock’s status under sub-zero temperatures
and the formation of so-called cryopegs within these rocks.
Figure 1. Oil-&-gas provinces (grey palette) and permafrost distribution (hatching) in Russia
[www.igirgi.ru].
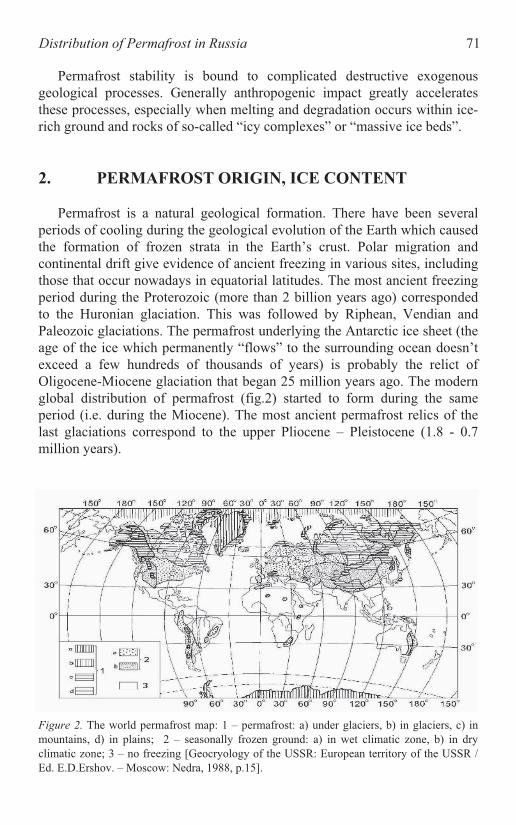
Distribution of Permafrost in Russia 71
Permafrost stability is bound to complicated destructive exogenous
geological processes. Generally anthropogenic impact greatly accelerates
these processes, especially when melting and degradation occurs within ice-
rich ground and rocks of so-called “icy complexes” or “massive ice beds”.
2. PERMAFROST ORIGIN, ICE CONTENT
Permafrost is a natural geological formation. There have been several
periods of cooling during the geological evolution of the Earth which caused
the formation of frozen strata in the Earth’s crust. Polar migration and
continental drift give evidence of ancient freezing in various sites, including
those that occur nowadays in equatorial latitudes. The most ancient freezing
period during the Proterozoic (more than 2 billion years ago) corresponded
to the Huronian glaciation. This was followed by Riphean, Vendian and
Paleozoic glaciations. The permafrost underlying the Antarctic ice sheet (the
age of the ice which permanently “flows” to the surrounding ocean doesn’t
exceed a few hundreds of thousands of years) is probably the relict of
Oligocene-Miocene glaciation that began 25 million years ago. The modern
global distribution of permafrost (fig.2) started to form during the same
period (i.e. during the Miocene). The most ancient permafrost relics of the
last glaciations correspond to the upper Pliocene – Pleistocene (1.8 - 0.7
million years).
Figure 2. The world permafrost map: 1 – permafrost: a) under glaciers, b) in glaciers, c) in
mountains, d) in plains; 2 – seasonally frozen ground: a) in wet climatic zone, b) in dry
climatic zone; 3 – no freezing [Geocryology of the USSR: European territory of the USSR /
Ed. E.D.Ershov. – Moscow: Nedra, 1988, p.15].
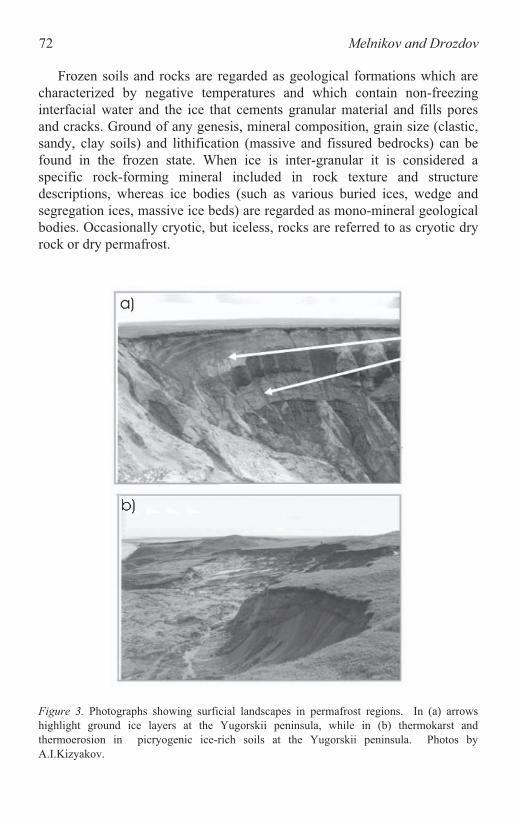
72 Melnikov and Drozdov
Frozen soils and rocks are regarded as geological formations which are
characterized by negative temperatures and which contain non-freezing
interfacial water and the ice that cements granular material and fills pores
and cracks. Ground of any genesis, mineral composition, grain size (clastic,
sandy, clay soils) and lithification (massive and fissured bedrocks) can be
found in the frozen state. When ice is inter-granular it is considered a
specific rock-forming mineral included in rock texture and structure
descriptions, whereas ice bodies (such as various buried ices, wedge and
segregation ices, massive ice beds) are regarded as mono-mineral geological
bodies. Occasionally cryotic, but iceless, rocks are referred to as cryotic dry
rock or dry permafrost.
Figure 3. Photographs showing surficial landscapes in permafrost regions. In (a) arrows
highlight ground ice layers at the Yugorskii peninsula, while in (b) thermokarst and
thermoerosion in picryogenic ice-rich soils at the Yugorskii peninsula. Photos by
A.I.Kizyakov.

Distribution of Permafrost in Russia 73
The frozen strata are subdivided into syngenetic and epigenetic according
to the time of their formation versus the time of accumulation of the mineral
and biogenic components. For the most part the frozen strata have had an
epicryogenic origin, i.e. previously accumulated or formed units had frozen
during a cooling epoch. The ice content inside this ground shows an
approximate correlation with the water content present before freezing. In
some cases conditions are created for the redistribution of moisture
throughout the section as a result of moisture addition to the freezing front
throughout the aquifers. In these cases ice beds from tens of centimeters to
tens of meters are formed inside the freezing rock strata (fig. 3).
Syngenetically frozen strata have frozen in parallel with mineral and/or
biogenic rock accumulation. They include recent Upper-Pleistocene and
Holocene clay and silt deposits of fluvial and littoral plains, shelf deposits
(for example, in Yakutia), aeolian-alluvial-deluvial slopes of arctic rock
masses, and depressions of large northern lakes. The moisture content in this
ground, freezing while accumulated, is essentially unlimited. The ice
accumulates in abundance within so-called “cryostructures” and often forms
wedge ices. Their total volume can reach 80% and more (fig.4).
Figure 4. Photographs showing thermokarst in ice wedges at the Bolvanskii Peninsula, with
(a) giving an areal view from a helicopter while (b) shows a cross-section of one of the ice
wedges. Photos by M.Z.Kanevsky.

74 Melnikov and Drozdov
To a lesser extent the state difference (frozen/unfrozen) affects bedrock,
and their cryogenesis is always epigenetic. Ice within fissures and cavities do
not significantly influence rock strength, however permeability is changed
appreciably, with frozen fractured saturated stratum being transformed into
an aquiclude. The presence of spatially restricted taliks leads to active water
exchange and enhanced leaching across them . The cryotic dry rocks only
occur in the uppermost part of a geological section, (typically only 1-3 m
below surface in granular rocks) and thus are of interest with respect to CO2
sequestration only as an upper aquiclude above a CO2 underground storage
facility. In this case most attention should be paid to the chemically active
residuals, because under the conditions of talik water exchange and in the
presence of dissolved CO2 fast reactions can take place which could lead to
increased porosity and enhanced CO2 escape out of the storage.
Pebbly, gravelly and sandy ground (except silty sands) in frozen or
unfrozen states don’t vary greatly from each other in ice content, but the
difference in conductivity and strength is rather considerable. In the frozen
state it is a strong foundation which can take an almost unlimited
construction load and it is a stable aquiclude providing an effect barrier to
gas and water migration even at moderate thicknesses of the frozen horizon.
The moisture content in frozen clastic and sandy ground is usually
slightly higher than in thawed ground. However at an aquiclude’s boundaries
(for instance, thawed aquicludes – clays) massive ice beds up to several tens
of meters thick (fig.3) can be generated while freezing sandy strata. In such
places the total thickness of ice layers can reach 80% of the overall frozen
strata thickness within near-surface zones which are intersected by
constructions. If human engineering works affect the massive ice beds, they
may initiate the potentially disastrous geocryological processes of
thermokarst and thermoerosion, thereby destroying landscapes as well as
nearby engineering infrastructure.
Silty and clayey ground attract the special attention of geocryologists,
constructors and other experts, as they can accumulate significantly greater
quantities of water during both epi- and syncryogenic freezing than in their
thawed state. This is the result of their mineral and granulometric
composition which ensures the abundant migration of moisture to the
freezing front. Lenticular, layered, reticulate or honeycomb cryostructures
are formed, and the mineral ground-mass is dissected by an ice net and
layers. Their thickness and spaces between layers range from sub-millimetre
to several centimetres. The ground-mass is also divided into polygons by
macrocracks and filled syngenetic ice wedges. Several meters thick wedges
can form a multilayer structure having a total thickness of tens of meters. Air
filled pores are essentially absent and ice content can reach more than 80%.
In this case thermokarst and thermoerosion lead to disastrous results.
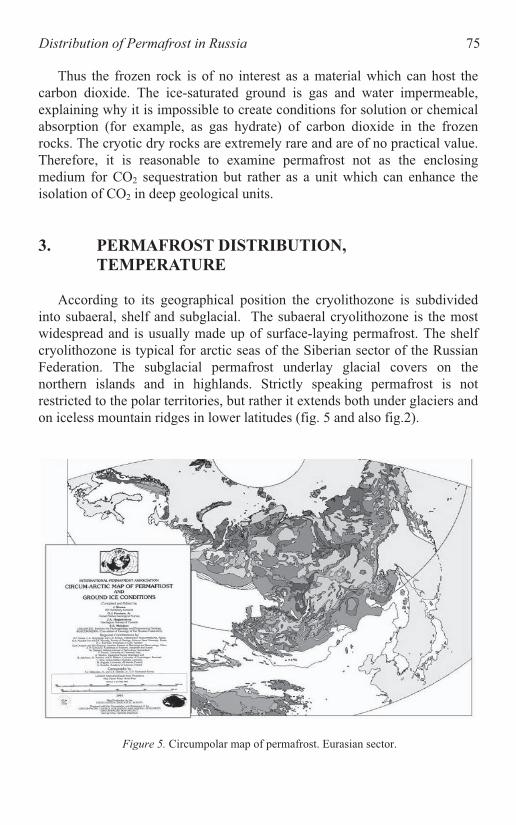
Distribution of Permafrost in Russia 75
Thus the frozen rock is of no interest as a material which can host the
carbon dioxide. The ice-saturated ground is gas and water impermeable,
explaining why it is impossible to create conditions for solution or chemical
absorption (for example, as gas hydrate) of carbon dioxide in the frozen
rocks. The cryotic dry rocks are extremely rare and are of no practical value.
Therefore, it is reasonable to examine permafrost not as the enclosing
medium for CO2 sequestration but rather as a unit which can enhance the
isolation of CO2 in deep geological units.
3. PERMAFROST DISTRIBUTION,
TEMPERATURE
According to its geographical position the cryolithozone is subdivided
into subaeral, shelf and subglacial. The subaeral cryolithozone is the most
widespread and is usually made up of surface-laying permafrost. The shelf
cryolithozone is typical for arctic seas of the Siberian sector of the Russian
Federation. The subglacial permafrost underlay glacial covers on the
northern islands and in highlands. Strictly speaking permafrost is not
restricted to the polar territories, but rather it extends both under glaciers and
on iceless mountain ridges in lower latitudes (fig. 5 and also fig.2).
Figure 5. Circumpolar map of permafrost. Eurasian sector.

76 Melnikov and Drozdov
Alpine permafrost can be found in the Caucasus, in Mongolia and in Tien
Shan. In Tien Shan (i.e. at the latitude south of the Caspian Sea and Japan)
the alpine permafrost areas are more than the whole Northland. Nevertheless
alpine permafrost in low latitudes is rather an exotic event, and thus northern
and eastern regions are the dominant areas of permafrost distribution.
Permafrost can be subdivided into 4 types based on unit continuity: i)
continuous (frozen rocks occupy 90-100% of the territory); ii) discontinuous
(50-90% permafrost); iii) island or sporadic (10-50% permafrost); and iv)
isolated patches (0-10% permafrost). Their distribution is controlled by strict
latitudinal (for plains and mountains) and altitude (for mountains) zonality
(fig. 6). The boundary of the continuous permafrost distribution shifts more
and more southward as it moves from west to east. Permafrost temperature
decreases in the same direction (from –2 to –100° C and below), while its
thickness increases in the plains (from the first tens of meters to 300 - 500 m
and more) and in mountain ridges (up to 1500 m).
Figure 6. Permafrost in Russia: Space distribution, iciness and temperature at the depths of
Local natural and human factors are superimposed on the zonal and
altitude regularities of the permafrost distribution, thus highlighting the local
changeability of the geocryological conditions. For example, taliks can
appear in continuous permafrost in river valleys and lake depressions due to
the defrosting effect of the hydrosphere, while frozen sites can disappear
zero seasonal amplitudes. [by E.S. Melnikov, K.A.Kondratieva, G.F.Gravis].
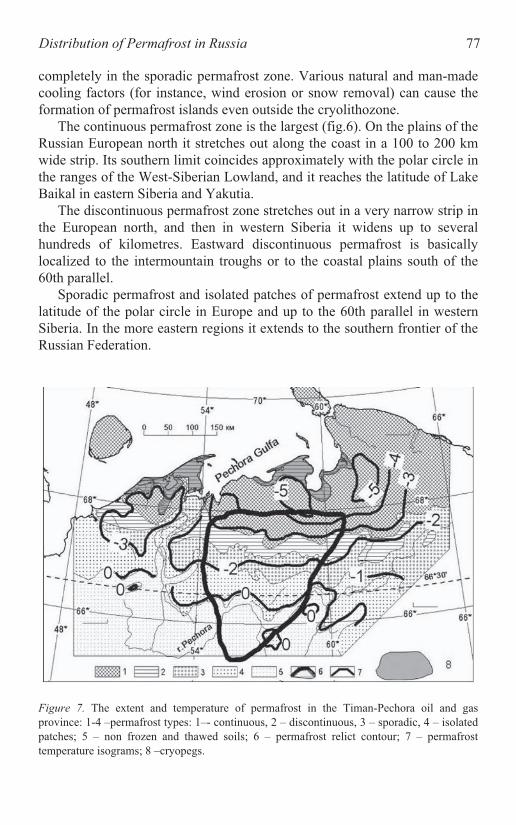
Distribution of Permafrost in Russia 77
completely in the sporadic permafrost zone. Various natural and man-made
cooling factors (for instance, wind erosion or snow removal) can cause the
formation of permafrost islands even outside the cryolithozone.
The continuous permafrost zone is the largest (fig.6). On the plains of the
Russian European north it stretches out along the coast in a 100 to 200 km
wide strip. Its southern limit coincides approximately with the polar circle in
the ranges of the West-Siberian Lowland, and it reaches the latitude of Lake
Baikal in eastern Siberia and Yakutia.
The discontinuous permafrost zone stretches out in a very narrow strip in
the European north, and then in western Siberia it widens up to several
hundreds of kilometres. Eastward discontinuous permafrost is basically
localized to the intermountain troughs or to the coastal plains south of the
60th parallel.
Sporadic permafrost and isolated patches of permafrost extend up to the
latitude of the polar circle in Europe and up to the 60th parallel in western
Siberia. In the more eastern regions it extends to the southern frontier of the
Russian Federation.
Figure 7. The extent and temperature of permafrost in the Timan-Pechora oil and gas
province: 1-4 –permafrost types: 1–- continuous, 2 – discontinuous, 3 – sporadic, 4 – isolated
patches; 5 – non frozen and thawed soils; 6 – permafrost relict contour; 7 – permafrost
temperature isograms; 8 –cryopegs.
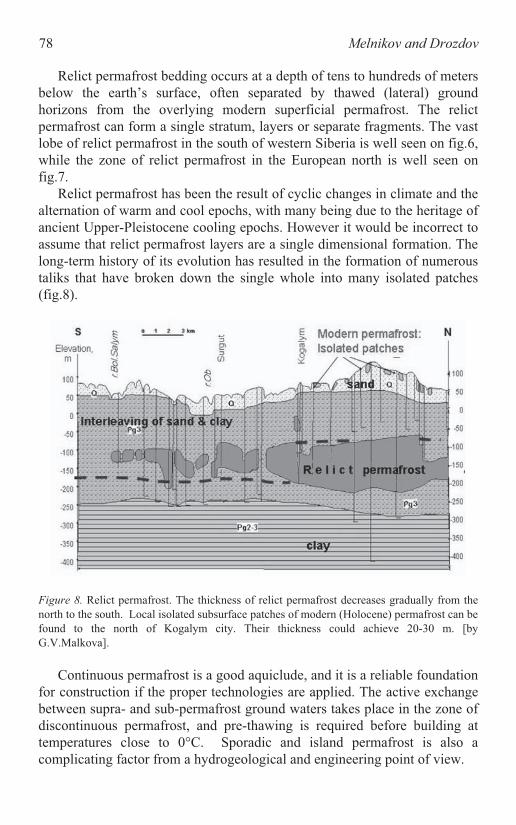
78 Melnikov and Drozdov
Relict permafrost bedding occurs at a depth of tens to hundreds of meters
below the earth’s surface, often separated by thawed (lateral) ground
horizons from the overlying modern superficial permafrost. The relict
permafrost can form a single stratum, layers or separate fragments. The vast
lobe of relict permafrost in the south of western Siberia is well seen on fig.6,
while the zone of relict permafrost in the European north is well seen on
fig.7.
Relict permafrost has been the result of cyclic changes in climate and the
alternation of warm and cool epochs, with many being due to the heritage of
ancient Upper-Pleistocene cooling epochs. However it would be incorrect to
assume that relict permafrost layers are a single dimensional formation. The
long-term history of its evolution has resulted in the formation of numerous
taliks that have broken down the single whole into many isolated patches
(fig.8).
Figure 8. Relict permafrost. The thickness of relict permafrost decreases gradually from the
north to the south. Local isolated subsurface patches of modern (Holocene) permafrost can be
found to the north of Kogalym city. Their thickness could achieve 20-30 m. [by
Continuous permafrost is a good aquiclude, and it is a reliable foundation
for construction if the proper technologies are applied. The active exchange
between supra- and sub-permafrost ground waters takes place in the zone of
discontinuous permafrost, and pre-thawing is required before building at
temperatures close to 0°C. Sporadic and island permafrost is also a
complicating factor from a hydrogeological and engineering point of view.
G.V.Malkova].
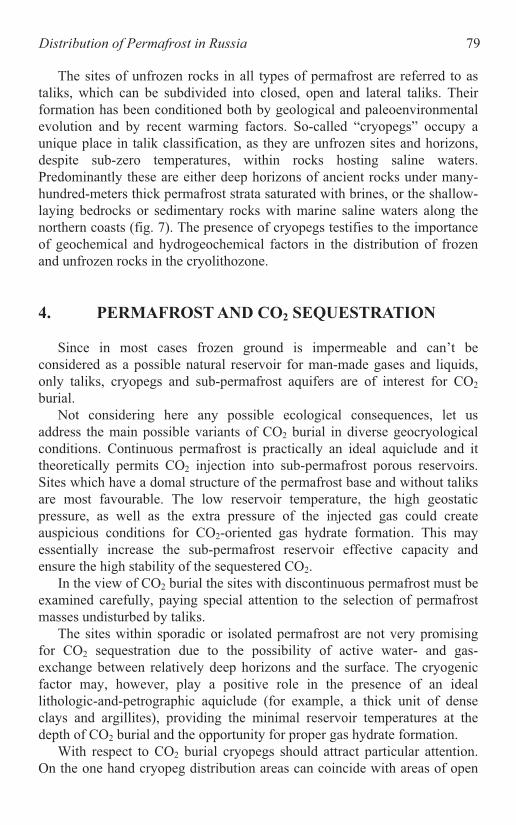
Distribution of Permafrost in Russia 79
The sites of unfrozen rocks in all types of permafrost are referred to as
taliks, which can be subdivided into closed, open and lateral taliks. Their
formation has been conditioned both by geological and paleoenvironmental
evolution and by recent warming factors. So-called “cryopegs” occupy a
unique place in talik classification, as they are unfrozen sites and horizons,
despite sub-zero temperatures, within rocks hosting saline waters.
Predominantly these are either deep horizons of ancient rocks under many-
hundred-meters thick permafrost strata saturated with brines, or the shallow-
laying bedrocks or sedimentary rocks with marine saline waters along the
northern coasts (fig. 7). The presence of cryopegs testifies to the importance
of geochemical and hydrogeochemical factors in the distribution of frozen
and unfrozen rocks in the cryolithozone.
4. PERMAFROST AND CO2 SEQUESTRATION
Since in most cases frozen ground is impermeable and can’t be
considered as a possible natural reservoir for man-made gases and liquids,
only taliks, cryopegs and sub-permafrost aquifers are of interest for CO2
burial.
Not considering here any possible ecological consequences, let us
address the main possible variants of CO2 burial in diverse geocryological
conditions. Continuous permafrost is practically an ideal aquiclude and it
theoretically permits CO2 injection into sub-permafrost porous reservoirs.
Sites which have a domal structure of the permafrost base and without taliks
are most favourable. The low reservoir temperature, the high geostatic
pressure, as well as the extra pressure of the injected gas could create
auspicious conditions for CO2-oriented gas hydrate formation. This may
essentially increase the sub-permafrost reservoir effective capacity and
ensure the high stability of the sequestered CO2.
In the view of CO2 burial the sites with discontinuous permafrost must be
examined carefully, paying special attention to the selection of permafrost
masses undisturbed by taliks.
The sites within sporadic or isolated permafrost are not very promising
for CO2 sequestration due to the possibility of active water- and gas-
exchange between relatively deep horizons and the surface. The cryogenic
factor may, however, play a positive role in the presence of an ideal
lithologic-and-petrographic aquiclude (for example, a thick unit of dense
clays and argillites), providing the minimal reservoir temperatures at the
depth of CO2 burial and the opportunity for proper gas hydrate formation.
With respect to CO2 burial cryopegs should attract particular attention.
On the one hand cryopeg distribution areas can coincide with areas of open

80 Melnikov and Drozdov
taliks formed by both thermal and chemogenic processes. This fact reduces
the insulating reliability of the waterproof stratum. On the other hand the
temperature of the cryopeg-reservoir is 1 to 20° C lower than the
temperature of the fresh-water reservoir, which is a significant point when
one considers the possibility of underground gas hydrate formation. In
addition, one can expect that some part of the injected CO2 will react with
the cryopeg brines and generate stable carbonate minerals. The last two
factors are important if one wishes to examine the problem of CO2
sequestration in the European north of Russia, where active prospecting and
the development of continental, shelf and island oil-and-gas fields are being
performed today.

CHARACTERISTICS OF PERMAFROST IN
SIBERIA
A.D. Duchkov
Institute of Geophysics SB RAS, 3, pr. Koptyug, Novosibirsk, 630090, Russia
Abstract: Permafrost is a huge natural "thermometer" sensitive to significant changes in
climate. During the Late Pleistocene permafrost reached as far south as 48-49
ºN, covering Siberia. During Holocene warming the extent of the permafrost
has greatly decreased. This process may now be intensified due to global
warming of the climate during the 20-21 centuries. Siberian meteorological
stations show that the last 30-40 years are characterized by an air temperature
increase of 0.02-0.05 ºC per year. If this warming trend is maintained the
overall temperature increase in northern Siberia may reach 1.2-2 ºC by 2050.
In this case the southern permafrost border will be moved to the north by 300-
400 km. Calculations were made to estimate possible changes in permafrost
parameters under the influence of climatic variations. In some blocks it is
possible that frozen rocks will thaw from the surface to a depth of 12-17 m by
2100.
Key words: Russia, Siberia, thermal and phase state of permafrost, temperature of rocks,
meteorological stations, climate warming, temperature field modeling,
degradation of permafrost
1. INTRODUCTION
Permafrost occupies about 80% of Siberia, the north-eastern part of
Asia. Within its boundaries one can find large cities and industrial
complexes. Permafrost stability is mainly governed by temperature. The
changes in temperature (due to climatic variations or anthropogenic factors)
may result in either permafrost degradation or stabilization. In this article we
consider modern data collected on the temperature field of Siberian
permafrost.
81
S. Lombardi et al. (eds.),
Advances in the Geological Storage of Carbon Dioxide, 81–91.
© 2006 Springer. Printed in the Netherlands.

82 Duchkov
Temporal changes in the temperature of the upper rock layer are basically
determined by air temperature variations (i.e. climate). Long lasting negative
air temperatures on the Earth’s surface result in ground cooling and the
formation of frozen rock layers (permafrost). Terrestrial heat flow limits the
depth extension of the permafrost .
Geocryological studies have shown that the permafrost in Siberia was
mostly developed in Late Pleistocene, during the epoch of Sartanian
glaciation (18-27 thousand years ago) (Kondratieva et al., 1993). The
average air temperature at that time was about 8-10 º less than at present.
Under these favourable conditions permafrost spread over Siberia, with its
southern border reaching 48-49º N. Subsequently the spatial extent of the
permafrost was greatly reduced. In Western Siberia the southern permafrost
border was displaced to the north up to 60ºN. In Eastern Siberia the
permafrost has almost the same spatial coverage but has likely been reduced
in thickness. Heat transfer occurs extremely slowly in rocks, and thus a
present temperature field of frozen rocks contains ("remembers") anomalies
related to the most significant climate variations of the last epoch. As such
permafrost is a huge natural "thermometer" sensitive to significant changes
in climate.
2. STRUCTURE AND TEMPERATURE FIELD OF
PERMAFROST
2.1 Structure of permafrost
Permafrost reaches the greatest thickness (over 1 km) in Yakutiya,
central Siberia (Duchkov and Balobaev, 2001), where it forms the most
cooled block of lithosphere in Northern Eurasia. Terrestrial heat flow (q) in
this area does not exceed 30 mW/m2. In other areas of Siberia, where the
heat flow reaches 50-70 mW/m2, permafrost thickness does not exceed 400-
600 m.
Three types of permafrost are observed in Siberia (Fig. 1). In northern
areas there is continuous permafrost which begins directly at surface and
which may reach considerable depths. To the south one can observe broken
or insular permafrost, where blocks of frozen rock may be separated by
isolated thawed zones (taliks). For example in western Siberia one can
observe isolated blocks of frozen rock (buried or relic permafrost) south of
60ºN. The average air (Ta) and surface (Ts) temperatures determine the type
of permafrost. The value Ts is usually defined in thermal physics as an
annually averaged rock temperature at a depth of 15-20 m. In northern areas
Ts is higher than Ta by 3-7 º (depending on latitude) because of the
shielding effect of snow cover and vegetation. Continuous permafrost is
Characteristics of Permafrost in Siberia 83
formed in those areas where negative values of Ta and Ts are observed.
Permafrost decay begins from the surface when Ts becomes positive (see
Fig. 1).
Figure 1. Modern parameters of western Siberia permafrost along a northerly profile
(Duchkov and Balobaev, 2001; Duchkov et al., 1995). – Plots of air temperature (Ta) and
2.2 Modern temperature field of permafrost
Temperature sections (temperature distribution with depth below ground
surface) may be divided into two groups typical for stable and unstable
permafrost (see examples in Fig. 5). The upper part of stable permafrost is
cooled between -6 to -15 ºC. At certain depths the temperature begins to
increase due to the influence of terrestrial heat flow. It reaches zero at a
depth of between 200-600 m.
In blocks of unstable (warm) permafrost the temperature in the entire
frozen rock layer is not much below zero, on the order of - 0.2 to -0.5 º .
Unstable permafrost is usually formed in blocks of sedimentary rocks
saturated with fresh water. In this case the frozen rocks contain ice, and the
bottom permafrost boundary is a phase boundary. Such a situation is found
in the Meso-Cenozoic depressions of Siberia. The speed of a moving phase
boundary is about one order of magnitude slower than the speed of a moving
thermal wave. Therefore the temperature field of the permafrost doesn’t
have enough time to follow the varying conditions at surface (in comparison
with dry rocks or those saturated with mineralised waters). Therefore blocks
ground temperature (Ts); B – Distribution of the upper and lower permafrost boundaries.
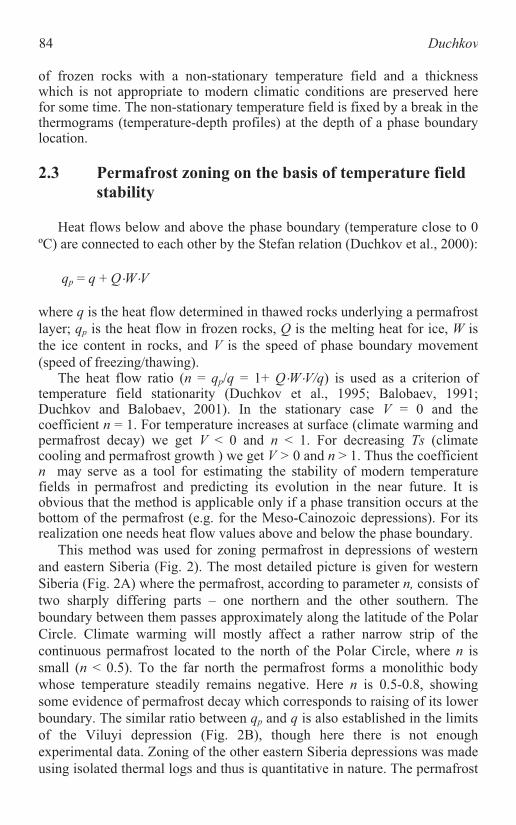
84 Duchkov
of frozen rocks with a non-stationary temperature field and a thickness
which is not appropriate to modern climatic conditions are preserved here
for some time. The non-stationary temperature field is fixed by a break in the
thermograms (temperature-depth profiles) at the depth of a phase boundary
location.
2.3 Permafrost zoning on the basis of temperature field
stability
Heat flows below and above the phase boundary (temperature close to 0
º ) are connected to each other by the Stefan relation (Duchkov et al., 2000):
qp = q + Q W V
where q is the heat flow determined in thawed rocks underlying a permafrost
layer; qp is the heat flow in frozen rocks, Q is the melting heat for ice, W is
the ice content in rocks, and V is the speed of phase boundary movement
(speed of freezing/thawing).
The heat flow ratio (n = qp/q = 1+ Q W V/q) is used as a criterion of
temperature field stationarity (Duchkov et al., 1995; Balobaev, 1991;
Duchkov and Balobaev, 2001). In the stationary case V = 0 and the
coefficient n = 1. For temperature increases at surface (climate warming and
permafrost decay) we get V < 0 and n < 1. For decreasing s (climate
cooling and permafrost growth ) we get V > 0 and n > 1. Thus the coefficient
n may serve as a tool for estimating the stability of modern temperature
fields in permafrost and predicting its evolution in the near future. It is
obvious that the method is applicable only if a phase transition occurs at the
bottom of the permafrost (e.g. for the Meso-Cainozoic depressions). For its
realization one needs heat flow values above and below the phase boundary.
This method was used for zoning permafrost in depressions of western
and eastern Siberia (Fig. 2). The most detailed picture is given for western
Siberia (Fig. 2A) where the permafrost, according to parameter n, consists of
two sharply differing parts – one northern and the other southern. The
boundary between them passes approximately along the latitude of the Polar
Circle. Climate warming will mostly affect a rather narrow strip of the
continuous permafrost located to the north of the Polar Circle, where n is
small (n < 0.5). To the far north the permafrost forms a monolithic body
whose temperature steadily remains negative. Here n is 0.5-0.8, showing
some evidence of permafrost decay which corresponds to raising of its lower
boundary. The similar ratio between qp and q is also established in the limits
of the Viluyi depression (Fig. 2B), though here there is not enough
experimental data. Zoning of the other eastern Siberia depressions was made
using isolated thermal logs and thus is quantitative in nature. The permafrost

Characteristics of Permafrost in Siberia 85
of eastern Siberia as a whole is more cooled and resistant to climate
warming. Today the entire Siberian region is characterized by a decaying
type of permafrost (everywhere n < 1), and thus global climate warming may
speed up the process of permafrost decay. This rate could be estimated given
data on possible scenarios for climate warming in the 21st century.
Figure 2. Schematic zoning of the permafrost temperature field for western (A) and eastern
(B) Siberia according to its stability level (Duchkov and Balobaev, 2001). A: 1 - n =0-0.1; 2 –
n = 0.1-0.2; 3 – n =0.2-0.5; 4 - n = 0.5-0.8; 5 - n = 0.8-1; 6 – the southern permafrost
boundary . B: 4 – site with permafrost thickness of about 1.5 km; 5 – site with talik.
3. SCENARIOS OF TEMPERATURE CHANGE AT
THE EARTH SURFACE
As was mentioned earlier, permafrost evolution is affected by significant
(in amplitude) and long-term variations of air and surface temperatures (Ta
and Ts). Many meteorological stations in Siberia have been performing
measurements of these parameters for more than 100 years, and thus these
data can be used for estimating modern climatic cycles.
3.1 Model of surface temperature change
In meteorological records from Siberia one can see an increase in air and
ground temperatures throughout the area during the last 40-50 years
(Duchkov et al., 2000; Skachkov, 2001; Pavlov and Anan'eva, 2004).
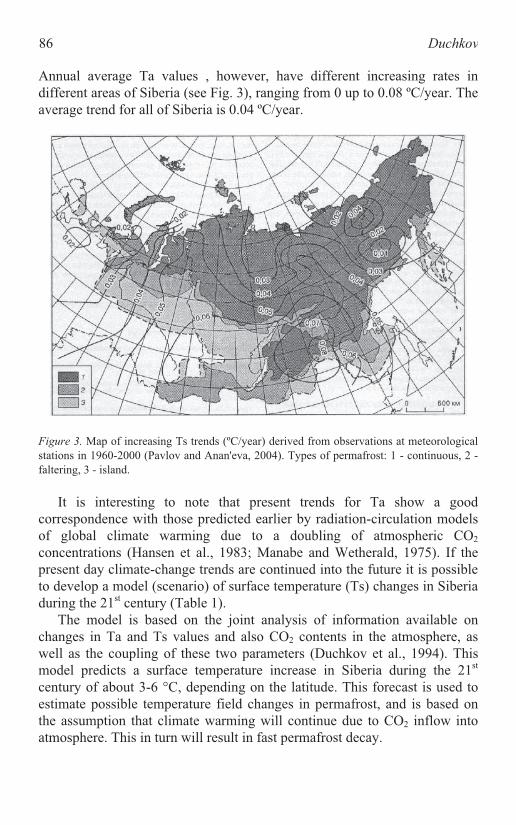
86 Duchkov
Annual average Ta values , however, have different increasing rates in
different areas of Siberia (see Fig. 3), ranging from 0 up to 0.08 ºC/year. The
average trend for all of Siberia is 0.04 ºC/year.
Figure 3. Map of increasing Ts trends (ºC/year) derived from observations at meteorological
stations in 1960-2000 (Pavlov and Anan'eva, 2004). Types of permafrost: 1 - continuous, 2 -
faltering, 3 - island.
It is interesting to note that present trends for Ta show a good
correspondence with those predicted earlier by radiation-circulation models
of global climate warming due to a doubling of atmospheric CO2
concentrations (Hansen et al., 1983; Manabe and Wetherald, 1975). If the
present day climate-change trends are continued into the future it is possible
to develop a model (scenario) of surface temperature (Ts) changes in Siberia
during the 21st century (Table 1).
The model is based on the joint analysis of information available on
changes in Ta and Ts values and also CO2 contents in the atmosphere, as
well as the coupling of these two parameters (Duchkov et al., 1994). This
model predicts a surface temperature increase in Siberia during the 21st
century of about 3-6 ° , depending on the latitude. This forecast is used to
estimate possible temperature field changes in permafrost, and is based on
the assumption that climate warming will continue due to CO2 inflow into
atmosphere. This in turn will result in fast permafrost decay.
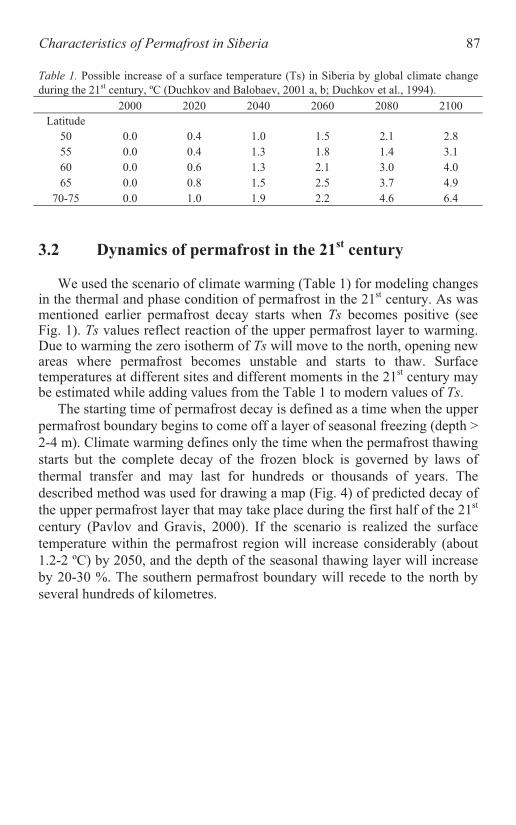
Characteristics of Permafrost in Siberia 87
Table 1. Possible increase of a surface temperature (Ts) in Siberia by global climate change st
2000 2020 2040 2060 2080 2100
Latitude
50 0.0 0.4 1.0 1.5 2.1 2.8
55 0.0 0.4 1.3 1.8 1.4 3.1
60 0.0 0.6 1.3 2.1 3.0 4.0
65 0.0 0.8 1.5 2.5 3.7 4.9
70-75 0.0 1.0 1.9 2.2 4.6 6.4
3.2 Dynamics of permafrost in the 21st century
We used the scenario of climate warming (Table 1) for modeling changes
in the thermal and phase condition of permafrost in the 21st century. As was
mentioned earlier permafrost decay starts when Ts becomes positive (see
Fig. 1). Ts values reflect reaction of the upper permafrost layer to warming.
Due to warming the zero isotherm of Ts will move to the north, opening new
areas where permafrost becomes unstable and starts to thaw. Surface
temperatures at different sites and different moments in the 21st century may
be estimated while adding values from the Table 1 to modern values of Ts.
The starting time of permafrost decay is defined as a time when the upper
permafrost boundary begins to come off a layer of seasonal freezing (depth >
2-4 m). Climate warming defines only the time when the permafrost thawing
starts but the complete decay of the frozen block is governed by laws of
thermal transfer and may last for hundreds or thousands of years. The
described method was used for drawing a map (Fig. 4) of predicted decay of
the upper permafrost layer that may take place during the first half of the 21st
century (Pavlov and Gravis, 2000). If the scenario is realized the surface
temperature within the permafrost region will increase considerably (about
1.2-2 º ) by 2050, and the depth of the seasonal thawing layer will increase
by 20-30 %. The southern permafrost boundary will recede to the north by
several hundreds of kilometres.
during the 21 century, ºC (Duchkov and Balobaev, 2001 a, b; Duchkov et al., 1994).

88 Duchkov
Figure 4. Prediction of permafrost evolution in Siberia due to climate warming (Pavlov and
3.3 Modeling changes of temperature field
Transformation of the permafrost temperature field caused by Ts
variations may be modeled numerically while solving a 1-D equation of heat
conduction for some real sections. In the presence of a phase transition at the
permafrost borders one should use two heat conduction equations for two
blocks: frozen and thawed. The effective difference-iterative method for
solving one- and many-dimensional Stefan type problems was used
(Balobaev, 1991). Information used for modeling included present day
thermal logs, data on terrestrial heat flow values and physical properties of
rocks, yielding predicted Ts changes in the 21st century (according to Table
1). Temperature distributions with depth were calculated for several future
time values starting from the year 2010 till 2100 (Fig. 5).
Calculations were made for 20 sites. Some numerical results
corresponding to blocks of continuous permafrost in rocks containing ice
(western Siberia) are shown in Figure 5. One can see that climate warming
and a rise in surface temperature should result in warming up and thawing of
frozen rocks in the surface layer. But the character of the temperature field
transformation is different in different permafrost blocks. By the end of the
21st century there will only be a rise of permafrost temperature in the far
north (Fig. 5A), and not actual thawing. However one can see that warming
may create favourable conditions for an increase in the seasonally thawing
Gravis, 2000).
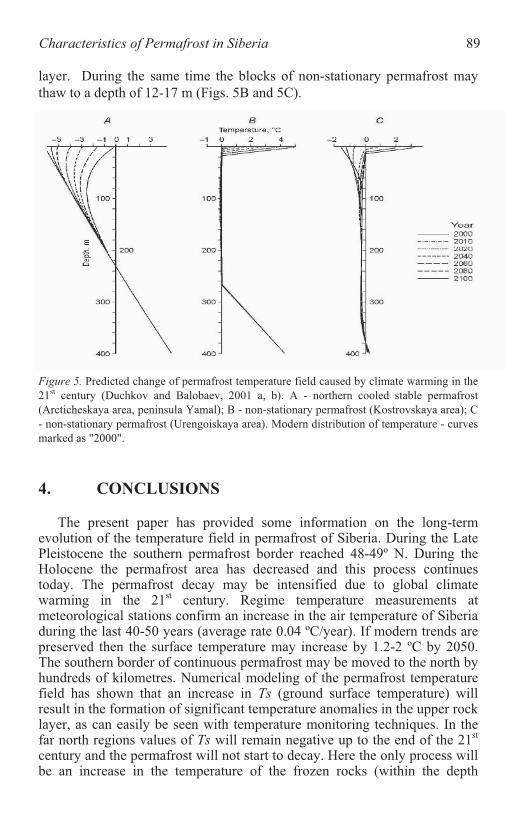
Characteristics of Permafrost in Siberia 89
layer. During the same time the blocks of non-stationary permafrost may
thaw to a depth of 12-17 m (Figs. 5B and 5C).
Figure 5. Predicted change of permafrost temperature field caused by climate warming in the
21st century (Duchkov and Balobaev, 2001 a, b). A - northern cooled stable permafrost
(Arcticheskaya area, peninsula Yamal); B - non-stationary permafrost (Kostrovskaya area); C
- non-stationary permafrost (Urengoiskaya area). Modern distribution of temperature - curves
marked as "2000".
4. CONCLUSIONS
The present paper has provided some information on the long-term
evolution of the temperature field in permafrost of Siberia. During the Late
Pleistocene the southern permafrost border reached 48-49º N. During the
Holocene the permafrost area has decreased and this process continues
today. The permafrost decay may be intensified due to global climate
warming in the 21st century. Regime temperature measurements at
meteorological stations confirm an increase in the air temperature of Siberia
during the last 40-50 years (average rate 0.04 ºC/year). If modern trends are
preserved then the surface temperature may increase by 1.2-2 ºC by 2050.
The southern border of continuous permafrost may be moved to the north by
hundreds of kilometres. Numerical modeling of the permafrost temperature
field has shown that an increase in Ts (ground surface temperature) will
result in the formation of significant temperature anomalies in the upper rock
layer, as can easily be seen with temperature monitoring techniques. In the
far north regions values of Ts will remain negative up to the end of the 21st
century and the permafrost will not start to decay. Here the only process will
be an increase in the temperature of the frozen rocks (within the depth

90 Duchkov
interval 0-260 m) due to conductive heat transfer, but no phase transition
processes. In contrast in non-stationary permafrost blocks the upper
permafrost layer (upper 12-17 m) will undergo thawing by 2100. Further
analysis is required to better quantify estimations of the discussed thermal
processes in permafrost. But one important process clearly shown in this
paper is that fast thawing in the upper layer of frozen ground will occur in
the case of climate warming. This process is rather serious as it may cause
destructive influence on all engineering constructions: pipelines, roads,
petroleum and gas stations and other buildings. Also permafrost decay will
promote the release of natural or human-sequestered gases (CO2, CH4)
preserved in frozen rocks.
ACKNOWLEDGEMENTS
The author wishes to thank colleagues from different institutes of the
Siberian Branch of the Russian Academy Sciences for providing
experimental data used in this work and the Directors of the NATO-ARW
“Advances in CO2 geological sequestration in eastern and western European
countries” for the opportunity to make this presentation. The research was
supported by Integration projects of the RAS (No. 13.16 and 13.17) and SB
RAS (No. 121).
Balobaev V.T., 1991, Geothermy of frozen zone of North Asia lithosphere, Novosibirsk:
Nauka. p. 194 (in Russian).
Duchkov, A.D., and Balobaev, V.T., 2001a, Geothermal studies of permafrost response to
global natural changes. In: Permafrost response on economic development, environmental
security and natural resources. Paepe, R., and Melnikov, V., (Eds.), Kluwer Academic
Publishers. Dordrecht. pp. 317-332.
Duchkov, A.D., and Balobaev, V.T., 2001b, Evolution of a thermal and phase condition of
Siberian permafrost. In: Global changes in the natural environment – 2001, Dobretsov,
N.L., and Kovalenko, V.I. (Eds.). Novosibirsk: Publishing house of the SB RAS: Geo p.
Duchkov, A.D., Sokolova L.S., Pavlov, A.V., 2000, An estimation of modern changes of
temperature of air and ground in Western Siberia, Cryosphere of Earth, 4 (1), pp. 52-59.
(in Russian).
Duchkov, A.D., Balobaev, V.T., Devyatkin, V.N., and Sokolova, L.S., 1995,. Geothermal
model of western Siberian permafrost, Geologiya i Geofizika (Russian Geology and
Duchkov, A.D., Balobaev, V.T. Volod'ko, B.V., Devyatkin, V.N., Lysak, S.V., Puzankov,
Yu.M., Nozhkin, A.D., Sokolova, L.S., Berezkin, V.I., Bogomolova, L.M., Botulu, E.A.,
Dorofeeva, R.P., Duk, V.L., Egorov, A.S., Zedgenizov, A.N., Zuy, A.N., Kitsul, V.I.,
79-104. (in Russian).
Geophysics), 36 (8), pp. 70-79. (in Russian).
REFERENCES

Characteristics of Permafrost in Siberia 91
Koveshnikov, A.M., Kotov, A.B., Kurchikov, A.R., Medvedev, V.I., Popov, N.V.,
Rusakov, V.G., Smelov, A.P., Stogniy, V.V., Turkina, O.M., and Shender, N.I., 1994,.
Temperature, permafrost and radiogenic heat generation in an Earth's crust of Northern
Asia. Novosibirsk: Publishing house of the SB RAS: UIGGM, 141 p. (in Russian).
Hansen, J.E., Russell, G., Rind, D., Stone, D., Lacis, A., Lebedeff, S., Ruedly, R. and Travis,
L., 1983, Efficient three-dimensional global models for climatic studies: models I and II.
Monthly Weather Rev., 111, pp. 609-622.
Kondratieva, K.A., Khurutzky, S.F., and Romanovsky, N.N., 1993, Changes in the extent of
permafrost during the late Quaternary period in the territory of the former Soviet Union,
Permafrost and periglacial processes, 4 (1), pp. 113-119.
Manabe, S., and Wetherald, R.T., 1975, The effect of doubling the CO2 concentration on the
climate of a general circulation model, J. Atmos. Sci., 32, pp. 3-15.
Pavlov, A.V., and Anan'eva, G.V., 2004, An estimation of modern changes of air temperature
in territory Siberian permafrost, Cryosphere of Earth, 8 (2), pp. 3-9 (in Russian).
Pavlov, A.V., Gravis, G.F., 2000, Permafrost and a modern climate, Priroda, 4, pp. 10-18 (in
Russian).
Skachkov, Yu.B., 2001, Tendencies of modern changes of air temperature in Republic Saha
(Yakutia), Questions of geography of Yakutia. Yakutsk: Publishing house of the YaGU,
pp. 26-31 (in Russian).
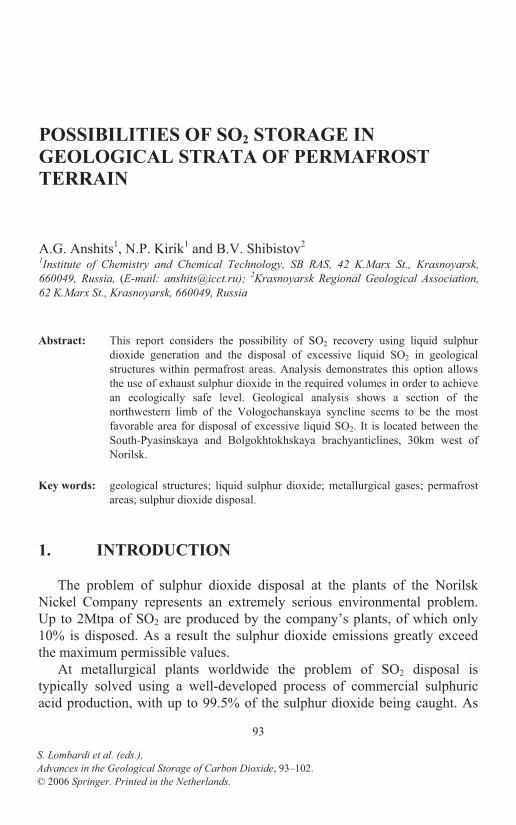
POSSIBILITIES OF SO2 STORAGE IN
GEOLOGICAL STRATA OF PERMAFROST
TERRAIN
A.G. Anshits1, N.P. Kirik
1 and B.V. Shibistov
2
1Institute of Chemistry and Chemical Technology, SB RAS, 42 K.Marx St., Krasnoyarsk,
660049, Russia, (E-mail: [email protected]); 2Krasnoyarsk Regional Geological Association,
62 K.Marx St., Krasnoyarsk, 660049, Russia
Abstract: This report considers the possibility of SO2 recovery using liquid sulphur
dioxide generation and the disposal of excessive liquid SO2 in geological
structures within permafrost areas. Analysis demonstrates this option allows
the use of exhaust sulphur dioxide in the required volumes in order to achieve
an ecologically safe level. Geological analysis shows a section of the
northwestern limb of the Vologochanskaya syncline seems to be the most
favorable area for disposal of excessive liquid SO2. It is located between the
South-Pyasinskaya and Bolgokhtokhskaya brachyanticlines, 30km west of
Norilsk.
Key words: geological structures; liquid sulphur dioxide; metallurgical gases; permafrost
areas; sulphur dioxide disposal.
1. INTRODUCTION
The problem of sulphur dioxide disposal at the plants of the Norilsk
Nickel Company represents an extremely serious environmental problem.
Up to 2Mtpa of SO2 are produced by the company’s plants, of which only
10% is disposed. As a result the sulphur dioxide emissions greatly exceed
the maximum permissible values.
At metallurgical plants worldwide the problem of SO2 disposal is
typically solved using a well-developed process of commercial sulphuric
acid production, with up to 99.5% of the sulphur dioxide being caught. As
93
S. Lombardi et al. (eds.),
Advances in the Geological Storage of Carbon Dioxide, 93–102.
© 2006 Springer. Printed in the Netherlands.

94 Anshits, Kirik and Shibistov
this option is unacceptable for Norilsk due to the geographical isolation and
required sulphuric acid transportation, it was decided to apply the
technology of enriched sulphurous gas disposal (20-50% SO2), and the
recovery of elemental sulphur via the technology of the Outokumpu
Company, Finland (Abramov et al., 1987). Originally it planned to utilize
coal dust as a reducing agent, but the process was later converted to natural
gas. The technology includes the high-temperature (approx. 1250°C) natural
gas reduction of sulphur dioxide to elemental sulphur with the subsequent
recovery of sulphur from off-gases during the Klaus’ catalytic stages, with
sulphur condensation after each step. The technology was first applied for
flash smelter gases, and later with a modification it was used for liquid bath
smelter gases, subsequently named Vanyukov smelting (VS) (Mechev et al.,
1989). Sulphur production from flash smelter gases is currently down (for
over 10 years - Platonov et al., 2004), and only 14% of the SO2 produced
from VS off-gases is disposed of (Ladin et al., 2003a).
The objective of the present work was to assess the possibility of using
an alternative option of effluent sulphurous gas disposal in order to attain the
maximum permissible emission level. This procedure involves straight
condensation with the recovery of liquid sulphur dioxide and disposal of
excessive liquid sulphur dioxide in geological structures within permafrost
areas.
2. ASSESSMENT OF DISPOSAL OPTIONS FOR
ENRICHED AND IMPOVERSIHED GASES TO
REACH MAXIMUM PERMISSIBLE EMISSION
LEVELS
According to the General Production Development Strategy adopted by
the Norilsk Nickel Company (Geoinfo, 2003), the proportion of enriched
sulphurous gases in the total volume of generating gases is expected to
increase up to 80% by 2007. It is planned to dispose of these gases, and
recover sulphur, using the methane technology once it is updated. According
to calculations, after system updating sulphur recovery will be around 90-
92%, and the off-gases generated in sulphur production will contain 1-3
vol.% SO2 (Ladin et al., 2003a, b).
It should be noted, however, that despite a number of improvements over
the last 20 years during which methane technology has been used for
sulphurous gas disposal and sulphur recovery, sulphur recovery from both
flash smelter gases and liquid bath smelter gases has not exceeded 60%
(Burukhin et al., 2000).
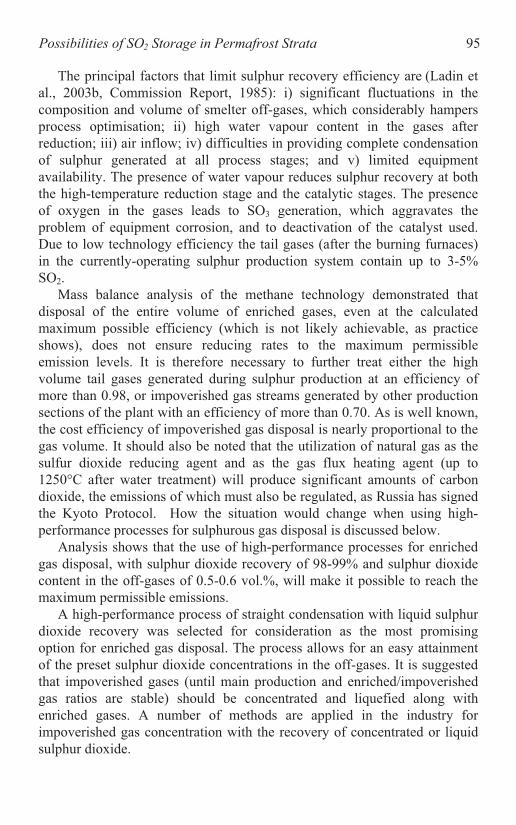
2 95
The principal factors that limit sulphur recovery efficiency are (Ladin et
al., 2003b, Commission Report, 1985): i) significant fluctuations in the
composition and volume of smelter off-gases, which considerably hampers
process optimisation; ii) high water vapour content in the gases after
reduction; iii) air inflow; iv) difficulties in providing complete condensation
of sulphur generated at all process stages; and v) limited equipment
availability. The presence of water vapour reduces sulphur recovery at both
the high-temperature reduction stage and the catalytic stages. The presence
of oxygen in the gases leads to SO3 generation, which aggravates the
problem of equipment corrosion, and to deactivation of the catalyst used.
Due to low technology efficiency the tail gases (after the burning furnaces)
in the currently-operating sulphur production system contain up to 3-5%
SO2.
Mass balance analysis of the methane technology demonstrated that
disposal of the entire volume of enriched gases, even at the calculated
maximum possible efficiency (which is not likely achievable, as practice
shows), does not ensure reducing rates to the maximum permissible
emission levels. It is therefore necessary to further treat either the high
volume tail gases generated during sulphur production at an efficiency of
more than 0.98, or impoverished gas streams generated by other production
sections of the plant with an efficiency of more than 0.70. As is well known,
the cost efficiency of impoverished gas disposal is nearly proportional to the
gas volume. It should also be noted that the utilization of natural gas as the
sulfur dioxide reducing agent and as the gas flux heating agent (up to
1250°C after water treatment) will produce significant amounts of carbon
dioxide, the emissions of which must also be regulated, as Russia has signed
the Kyoto Protocol. How the situation would change when using high-
performance processes for sulphurous gas disposal is discussed below.
Analysis shows that the use of high-performance processes for enriched
gas disposal, with sulphur dioxide recovery of 98-99% and sulphur dioxide
content in the off-gases of 0.5-0.6 vol.%, will make it possible to reach the
maximum permissible emissions.
A high-performance process of straight condensation with liquid sulphur
dioxide recovery was selected for consideration as the most promising
option for enriched gas disposal. The process allows for an easy attainment
of the preset sulphur dioxide concentrations in the off-gases. It is suggested
that impoverished gases (until main production and enriched/impoverished
gas ratios are stable) should be concentrated and liquefied along with
enriched gases. A number of methods are applied in the industry for
impoverished gas concentration with the recovery of concentrated or liquid
sulphur dioxide.
Possibilities of SO Storage in Permafrost Strata
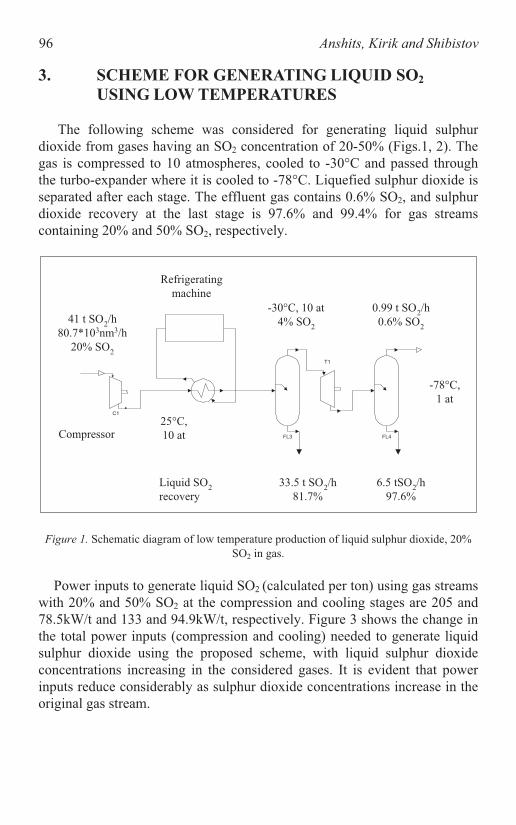
96 Anshits, Kirik and Shibistov
3. SCHEME FOR GENERATING LIQUID SO2
USING LOW TEMPERATURES
The following scheme was considered for generating liquid sulphur
dioxide from gases having an SO2 concentration of 20-50% (Figs.1, 2). The
gas is compressed to 10 atmospheres, cooled to -30°C and passed through
the turbo-expander where it is cooled to -78°C. Liquefied sulphur dioxide is
separated after each stage. The effluent gas contains 0.6% SO2, and sulphur
dioxide recovery at the last stage is 97.6% and 99.4% for gas streams
containing 20% and 50% SO2, respectively.
T1
C1
FL3 FL4
41 t SO2/h
80.7*103nm3/h
20% SO2
Compressor
Refrigerating
machine
-30°C, 10 at
4% SO2
0.99 t SO2/h
0.6% SO2
-78°C,
1 at
25°C,
10 at
Liquid SO2
recovery
33.5 t SO2/h
81.7%
6.5 tSO2/h
97.6%
Figure 1. Schematic diagram of low temperature production of liquid sulphur dioxide, 20%
SO2 in gas.
Power inputs to generate liquid SO2 (calculated per ton) using gas streams
with 20% and 50% SO2 at the compression and cooling stages are 205 and
78.5kW/t and 133 and 94.9kW/t, respectively. Figure 3 shows the change in
the total power inputs (compression and cooling) needed to generate liquid
sulphur dioxide using the proposed scheme, with liquid sulphur dioxide
concentrations increasing in the considered gases. It is evident that power
inputs reduce considerably as sulphur dioxide concentrations increase in the
original gas stream.

97
T1
C1
FL3 FL4FL3
102.5 t SO2/h
80.5*103nm3/h
50% SO2
Refrigerating
machine-30°C, 10 at
4% SO2
0.6 t SO2/h
0.6% SO2
-78°C,
1 at
Compressor
Liquid SO2
recovery
24.9 t SO2/h
24.3 %
73.1 t SO2/h
95.6 %
3.9 t SO2/h
99.4 %
25°C,
10 at
Figure 2. Schematic diagram of low temperature production of liquid sulphur dioxide, 50%
SO2 in gas.
20 40 60 80 100
0
50
100
150
200
250
300
350
Pow
er,
kW
/t l
iquid
SO
2
SO2 content in gas, % vol
Figure 3. Power inputs for low temperature production of liquid SO2: - with heat
recuperation, - without heat recuperation.
Power inputs can be reduced at the cooling stage by using cold recovery.
The calculations based on using cold recovery for 20% SO2 streams under
the scheme shown in Figure 4 demonstrate that power inputs reduce by
nearly 2.5 times at the cooling stage. Another way to conserve energy can be
2Possibilities of SO Storage in Permafrost Strata
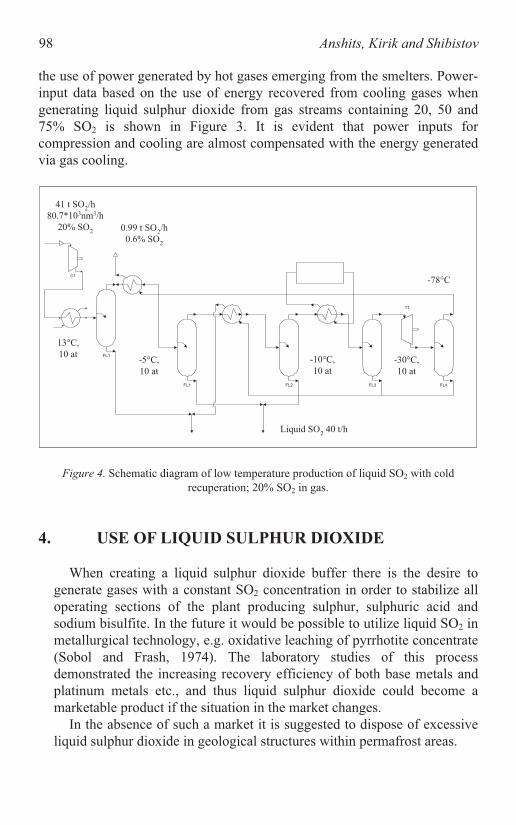
98 Anshits, Kirik and Shibistov
the use of power generated by hot gases emerging from the smelters. Power-
input data based on the use of energy recovered from cooling gases when
generating liquid sulphur dioxide from gas streams containing 20, 50 and
75% SO2 is shown in Figure 3. It is evident that power inputs for
compression and cooling are almost compensated with the energy generated
via gas cooling.
T1
C1
FL1 FL2 FL3 FL4
FL1
41 t SO2/h
80.7*103nm3/h
20% SO2
0.99 t SO2/h
0.6% SO2
-10°C,
10 at
-30°C,
10 at
-78°C
-5°C,
10 at
13°C,
10 at
Liquid SO2 40 t/h
Figure 4. Schematic diagram of low temperature production of liquid SO2 with cold
recuperation; 20% SO2 in gas.
4. USE OF LIQUID SULPHUR DIOXIDE
When creating a liquid sulphur dioxide buffer there is the desire to
generate gases with a constant SO2 concentration in order to stabilize all
operating sections of the plant producing sulphur, sulphuric acid and
sodium bisulfite. In the future it would be possible to utilize liquid SO2 in
metallurgical technology, e.g. oxidative leaching of pyrrhotite concentrate
(Sobol and Frash, 1974). The laboratory studies of this process
demonstrated the increasing recovery efficiency of both base metals and
platinum metals etc., and thus liquid sulphur dioxide could become a
marketable product if the situation in the market changes.
In the absence of such a market it is suggested to dispose of excessive
liquid sulphur dioxide in geological structures within permafrost areas.

99
5. ASSESSMENT OF THE POSSIBILITY TO
DISPOSE LIQUID SO2 IN GEOLOGICAL
STRUCTURES
Methods exist worldwide for the geological disposal of various waste
streams, including the injection of CO2 (Pearce and Rochelle, 1999, Bachu
and Gunter, 2004), CO2/H2S mixtures (Bachu et al., 2003), and liquid toxic
and radioactive waste (Stepanov, 2004).
The selection criteria for deep industrial liquid waste storage are relatively
well developed (Stepanov, 2004). It is preferable to select water saturated
units located within negative platform structures. These should have
capacitance properties and be isolated from shallow groundwater and surface
water with an overlying impermeable argillaceous mass. The reservoirs
should be capable of holding significant volumes of waste and contain it
within a limited section of the unit over a long period of time.
The selection of disposal sites for acid gases mainly depends on properties
such as phase equilibrium, water content and solubility, and the generation
of hydrates causing blockages in both boreholes during pumping and in
compressors (Bachu et al., 2003).
Sulphur dioxide is a readily liquefied gas, forming at t = -10°C at a
pressure of 760 millimetres of mercury. The critical parameters for SO2 are
T=157.5°C and P=77.8 atmospheres. Sulphur dioxide forms gas hydrates
relatively easily, even at temperatures of up to +12°C. Sulphur dioxide gas-
hydrate has a low generation pressure equilibrium, for example at 12.1°C the
vapor pressure equilibrium is 2.3 atmospheres. Two types of solutions can
be formed depending on the sulphur dioxide content in the SO2-H2O system:
sulphur dioxide solution in water and water solution in sulphur dioxide.
Depending on the sulphur dioxide concentration, SO2 gas-hydrate is in
equilibrium with one of the solutions or with ice below 12°C. There is a
narrow range of water concentration in liquid sulphur dioxide when gas-
hydrate is not formed in the solution between temperatures of -30 to -40°C
(at 50 atm). When the water content in the mixture is higher the temperature
must be maintained over 12°C to avoid gas-hydrate formation.
6. SELECTION OF LIQUID SO2 DISPOSAL SITE IN
THE NORILSK INDUSTRIAL AREA
A geological analysis of the Norilsk Industrial Area was conducted to
select the most appropriate site for liquid sulphur dioxide disposal based on
available data.
2Possibilities of SO Storage in Permafrost Strata

100 Anshits, Kirik and Shibistov
Figure 5. Geological profile of the Vologochanskaya syncline (Mezhvilk et al., 1972): T1hl -
Lower Triasian, Chachankanskaya Series, T1sv - Lower Triasian, Syverminskaya Series, D1zb
- Lower Devonian, Zubovskaya Suite, D1zb - Lower Devonian, Zubovskaya Suite, S2ld2 -
Upper Silurian, Upper Ludlow Series, S2ld1 - Upper Silurian, Lower Ludlow Series, S1w -
Lower Silurian, Wenlock Series, S1ln - Lower Silurian, Llandovery Series, O2mn - Middle
Ordovician, Mangazeysky Series, O2kr - Middle Ordovician, Krivolutsky Series, O1 n -
Lower Ordovician, Chunsky Series.
A section of the northwestern limb of the Vologochanskaya syncline
seems to be the most favorable area. It is located between the South-
Pyasinskaya and Bolgokhtokhskaya brachyanticlines, 30km west of Norilsk
(Fig.5). The Vologochanskaya syncline is formed by Lower and Mid-
Paleozoic carbonate-terrigenous rocks and Lower Triassic volcanogenic
rocks, and is stable tectonically. The size of the syncline provides enough
space for a large reservoir suitable for long-term storage, while the negative
structure provides a proper isolation from the biosphere. Silurian and
Devonian rocks, as well as oil-saturated Lower Triassic tufogenic rocks
separated by basalt covers, have good reservoir properties. The prevalence of
carbonate rocks in the Paleozoic is a favorable factor for liquid SO2 disposal.
The structure of the syncline and the alternation of reservoir beds with
impermeable cover beds create a multilevel target for disposal of liquid
sulphur dioxide. The topography of the syncline is a vast, poorly split
watershed area with an elevated width of permafrost, which serves as a
fluid-resistant cover.
7. PRINCIPAL RESULTS AND CONCLUSIONS
It was demonstrated that in order to reach the maximum permissible
emission of sulphur dioxide, straight condensation of sulphur-containing

101
gases could be used as the basic technology for enriched gas recycling,
the sulphur dioxide recovery of which is 98-99% .
The power inputs of straight condensation depends considerably on SO2
content. Power inputs at the compression stage are 205 and 79 kW/t SO2
liq., for input streams of 20 and 50 % SO2, respectively. Utilization of
naturally cold conditions would allow for a significant reduction in
refrigerating machine costs. The use of energy generated by cooling hot
gases emerging from the liquid bath smelters (e.g., use of steam
turbines) would allow for compensating up to 90-100% of total power
inputs.
It is proposed to dispose excessive liquid SO2 in the geological structures
of the Norilsk Industrial Area, with isolation being accomplished via
both stratigraphic traps and the overlying gas-hydrate layer at the lower
edge of the permafrost. A geological analysis of the area demonstrates
that there is a theoretical possibility of such disposalThe northwestern
portion of the Vologochanskaya syncline, between the South-
Pyasinskaya and Bolgokhtokhskaya anticlines, is proposed as a liquid
sulphur dioxide disposal site.
There are two types of geological reservoirs: aluminosilicate
volcanogenic and terrigenic rocks and carbonate rocks. The first type
ensures sulphur dioxide disposal without reactive interaction, while the
latter ensures sulphur dioxide disposal with the formation of calcium
salts.
REFERENCES
Abramov, N.P., Yeremin, O.G., Baryshev, A.A., Zaltsman, S.L., and Kuzhel, B.I., 1987,
Experience of mastering of sulphur production from emission gases of flash furnaces at
NGMK, Tsvetnye metally, 7:26-28 (in Russian).
Bachu, S., and Gunter, W.D., 2004, Overview of Acid-Gas Injection Operations in Western
Canada, in: Proc.7th Int. Conf. on Greenhouse Gas Control Technologies. Volume 1:
Peer-Reviewed Papers and Plenary Presentations, edited by E.S. Rubin, D.W. Keith and
C.F. Gilboy, IEA Greenhouse Gas Programme, Cheltenham, UK,
Bachu, S., Haug, K., Michael, K., Buschkuehle, B.E., and Adams, J.J., 2003, Deep Injection
of Acid Gas in Western Canada, in: Proc. 2-th Int. Sym. on Underground Injection Science
and Technology, Berkeley, CA, Oct 22-25 (2003).
Burukhin, A.N., Kaytmazov, N.G., Dyachenko, V.T., Galantsev V.N., and Ilyukhin, I.V.,
2000, Production of fertilizers in Norilsk?, Tsvetnye metally, 6:63-64 (in Russian).
Commission Report, 1985, Report of Temporal Scientific and Technical Commission,
Resolution of Gov. Science and Engineering Committee of USSR NN 305, 554,
(unpublished).
Geoinfo, 02.04.2003; http://www.infogeo.ru/metals/news
2Possibilities of SO Storage in Permafrost Strata
102 Anshits, Kirik and Shibistov
Ladin, N.A., Danilov, M.P., Severilov, A.V., Kozlov, A.N.,. Sapegin, Yu.V, Baryshev, A.A.,
Derevnin, B.T., and Semenov, M.Yu., 2003a, Modernization of sulphur dioxide recovery
at “Nadeshda” smelter for further introduction at smelting divisions of “MMC Norilsk
Nikel”s, polar branch, in: Book of abstracts “Metallurgy of Non-Ferrous & Rare Metals”,
Krasnoyarsk, Russia, 9-12 September, 2003 , pp. 152-153.
Ladin, N.A., Danilov, M.P., Severilov, A.V., Kozlov, A.N., Sapegin, Yu.V., Baryshev A.A.,
and Derevnin, B.T., 2003b, Modernization of sulpfur dioxide recovery at “Nadeshda” of
“MMC Norilsk Nikel”s, Khimicheskaya tekhnologiya,12:4-6 (in Russian).
Mechev, V.V., Abramov, N.P., Sokolov, O.K., Yeremin, O.G., Baryshev, A.A., and Orlov,
V.N., 1989, Development and mastering of sulphur production from metallurgical
emission gases, Tsvetnye metally, 7:69-72 (in Russian).
Mezhvilk, A.A., Karzeva, G.N., and Mikhalyuk, Yu.R., 1972, Geological map of USSR 1:
200000, list R-45-XXI,XXII (M.: Izd-vo Nedra,) (in Russian).
Pearce, J., and Rochelle, C., 1999, CO2 storage: mineral reactions and their influences on
reservoir permeability–a comparison of laboratory and field studies, in: Proc. Fourth Int.
Conf. on Greenhouse Gas Control Technologies, Interlaken, Switzerland, 30 August - 2nd
September (Pergamon Press, 1999), p.1087.
Platonov, O.I., Vasil’ev, Yu.V., Ryabko, A.G., Tsemekhman, L.Sh., and Yatsenko, S.P.,
2004, Relative to the choice of reduction scheme of emission gas from Vanyukov’
furnace Tsvetnye metally, 2:68-72 (in Russian).
Sobol, S.I., and Frash, T.M., 1974, Sulphur anhydride in autoclave treatment of sulfide-
containing raw materials, Tsvetnye metally, 2:14-21 (in Russian).
Stepanov, A.N., 2004, Deep disposal of liquid toxic wastes is effective protection of nature,
Prirodnye resursy Rossii: upravlenie, ekonomika, finansy, 1:95-100 (in Russian).
CRYOGELS – A PROMISING MATERIAL FOR
UNDERGROUND WORKS IN PERMAFROST
L.K. Altunina1, V.A. Kuvshinov
1 and S.N. Dolgikh
2
1Institute of Petroleum Chemistry SB RAS, 3 Academichesky Avenue, 634021, Tomsk, Russia;
2Institute “Yakutniproalmaz”, Stock Company “ALROSA”, Mirny, Yakutia
Abstract: Cryotropic gel-forming systems have been developed at the Institute of
Petroleum Chemistry SB RAS in Tomsk, Russia. They are capable of
generating gels at 0–20 , subsequently converting to cryogels during freeze-
thaw cycles which exhibit high elasticity and adhesion to rock. Both
laboratory and field experiments are reported here, including 2003–2004 pilot
tests conducted to seal a leaking interval at the base of a dam at the Irelyakh
hydrosystem, Stock Company “ALROSA”, Yakutia.
Key words: cryogel, permafrost, viscosity, elasticity, sealing, cutoff wall, dam
1. INTRODUCTION
The use of permafrost is considered as one option for 2 geological
storage. From this view point two issues arise:
– depending on injection depth and site conditions the 2 may occur as
individual and mixed gas hydrates, mineral and organo-mineral complexes
(clathrates and carbonates) or in other forms;
– the long-term existence of underground 2 storage implies permafrost
conservation and consolidation.
The present paper discusses cryogels – a promising material for
underground works in permafrost regions. These are polymer gels generated
due to freezing and subsequent thawing of aqueous polymer solutions. The
more ”freezing – thawing” cycles the cryogel is subjected to the better its
mechanical properties: strength and elasticity increase and formation bond
intensifies (Lozinsky, 1998, 2002). Cryogels, i.e. cryotropic gels, are
103
S. Lombardi et al. (eds.),
Advances in the Geological Storage of Carbon Dioxide, 103–110.
© 2006 Springer. Printed in the Netherlands.

104 Altunina, Kuvshinov and Dolgikh
peculiar polymer solutions, with a higher critical solution temperature
(Rebinder, 1979; Papkov, 1974). The spatial pattern of cryogels is formed
during phase transformation and is stabilized with intermolecular bonds of
different nature: covalent, coordination and ionic-electrostatic. This variable
bond type generates the cryogel manifold and allows their properties to be
varied significantly (Lozinsky, 1998, 2002; Sergeev et al., 1978).
Cryogels based on polyvinyl alcohol (PVA) are of great interest both
scientifically and from an applied viewpoint. They are widely used in
biotechnology, medicine, food industry and others (Sergeev et al., 1978;
Lozinsky, 1998). In many respects this interest results from the excellent
mechanical, diffusional and thermophysical properties of PVA cryogels,
polymer availability, its non-toxicity and biocompatibility, as well as its
relatively simple gelation technique involving freeze-thaw cycling. It is
possible to regulate physico-chemical properties of cryogels within wide limits
(Sergeev et al., 1978; Lozinsky, 1998) by varying polymer characteristics
(molecular mass, chain-length distribution, content of residual o-acyl groups,
tacticity and PVA concentration in the system), solvent composition,
additive nature and cryogenic process conditions (temperature and freezing
duration, thawing rate, number of over freezing cycles, etc.). In practice water
is used as the basic solvent for PVA. PVA is resistant to oils and fats, aliphatic
and aromatic hydrocarbons, weak acids and alkalis. In addition PVA exhibits
universal adhesive and bonding properties and is also atmosphere and
oxidation-resistant.
2. RESULTS
2.1 Laboratory Experiments
Gelation kinetics and the rheological properties of PVA solutions of
different concentrations (from 0.5 to 10 wt%) have been studied in the
temperature range from –30 to +10 . We have also studied PVA solutions
containing additives, which affect gelation kinetics and rheological
properties of gels and cryogels, as well as their adhesion to rocks, in order to
create flow barriers within ground constructions. Viscosity and Young’s
modulus were chosen as rheological characteristics.
Viscosity was measured using a “Reokinetika” vibration viscosimeter
equipped with a tuning-fork gauge. Distilled water was used as a calibration
liquid.
Modulus of elasticity for gels was determined based on ”tension –
deformation” diagrams, obtained during quasi-elastic cylindrical-sample
compression using in-house developed equipment based on a micrometer

105
and electronic scales. The modulus of elasticity was calculated as the angle
of slope of the initial linear segment, where Hooke’s law is observed,
relative to the compression – deformation curve.
The kinetics of cryotropic gelation of 5 and 10 % PVA solutions was
studied at - 32 and - 18 by using the modulus of elasticity as the principle
monitoring parameter. Solutions were maintained at sub-zero temperatures
for a pre-determined time and then they were subjected to thawing at 2 and
18 . The mode of thawing is a factor which significantly affects visco-
elastic properties of cryogels. Slow thawing promotes generation of cryogels
exhibiting high viscosity and modulus of elasticity, and thus the lower the
freezing temperature the stronger the cryogels (Figs. 1 and 2). At higher
thawing rates the effect of freezing temperature on the visco-elastic
properties of cryogels decreases.
The effect of the number of ”freeze-thaw” cycles on the properties of
cryogels, prepared from aqueous PVA solutions, has been studied. The
cryogels were frozen at - 18 and - 32 and then thawed at 18 and 6 .
The results obtained in the study indicate that the modulus of elasticity
increases with the number of “freeze-thaw” cycles and it does not depend on
the thawing rate (Fig. 3). The greatest increase in elasticity was observed
after 2 – 4 freeze-thaw cycles.
different rates.
Figure 1. Viscosity change of 5 % PVA solution after thermostatting at –32 and thawing at
Cryogel Applications in Permafrost

106 Altunina, Kuvshinov and Dolgikh
solution and which were frozen at –32 and –18 ), on the number of freeze-thaw cycles at
Figure 2. Elasticity changes of 5 % PVA solution after thermostatting at –32 and
thawing at different rates.
18 and 6 .
Figure 3. Dependence of the modulus of elasticity (for cryogels obtained from 10% PVA

107
We studied gelation kinetics of a 5 % PVA solution at +2 and
compared the visco-elastic properties of the prepared gel with those of
cryogels obtained from the same solution during freezing at –18 and –32 ,
followed by thawing at +18 . The study showed a significant increase in
gel viscosity and modulus of elasticity at the lower freezing temperature
(Fig. 4).
The viscoelastic properties of gels prepared from 5 and 7 % PVA
solutions at –5, 0, +2 and +22 have also been studied. The gels contained
electrolytes as additives, which affected gelation kinetics and the rheological
properties of gels and cryogels, as well as their adhesion to rocks. Gelation
kinetic studies of PVA solutions containing electrolytes as additives already
showed that the gels were formed in several hours at 0 – 18 o
.
Moreover subsequent thermostatting or freezing – thawing of the gels
improved their strength. It has been determined that viscosity and elasticity
of the solutions increased 3–5 times when a cross-linking agent was added to
the PVA aqueous solutions, depending on agent concentration and
thermostatting time (1 to 8 days) at +2
Strength changes occurring in cryogels with different fine-filling agents
were also studied, such as crushed carbonate rock (fraction 0.16 – 0.5 mm),
sand and crushed core material having sandstone / argillite ratios of 2:1; 1:1
and 1:2. The highest modulus of elasticity was observed with the filling
Figure 4. Dynamics of modulus of elasticity for 5 % PVA solution thermostated at different.
temperatures.
Cryogel Applications in Permafrost

108 Altunina, Kuvshinov and Dolgikh
agents in a 1:1 ratio and cryogel prepared from a PVA solution with a cross-
linking agent and filled with crushed carbonate rock and core material.
Moreover the modulus of elasticity of the cryogel also increased with an
increase in PVA and cross-linking agent concentrations. The addition of
electrolyte and a cross-linking agent to the PVA solution significantly
increased the modulus of elasticity in all PVA solutions – crushed carbonate
rock ratios (Fig. 5).
The filtration characteristics of gel-forming systems were studied under
thermobaric conditions simulating water filtration through anti-filtration
barriers in constructions in the northern climatic zone. Experiments
consisted of water filtration at a constant discharge rate through a laboratory
model of a filtering medium.
The model was packed with crushed carbonate rock (fraction 0.16-0.5
mm), with permeability varying from 9.78 to 87 m2. A gel-forming solution
containing 3 % PVA and a cross-linking agent (Fig. 6) was injected into a
model consisting of crushed carbonate rock with a permeability of 87 m 2
at
6o
at lower pressure values (from 0.3 to 2.25 atm/m). The model was
subsequently held at 6°C for 5 hours to form the gel, and then once again
water infiltration experiments were continued. At pressure increases up to 50
atm/m no water infiltration was observed (Fig. 6).
Figure 5. Increase in modulus of elasticity for PVA solutions with added electrolyte and
cross-linking agents after thermostatting with crushed carbonate rock at a ratio of 1:2 at +2 .

109
2 o
Figure 7 presents the results of the creation of a cutoff barrier in a model
consisting of crushed carbonate rock having a permeability of 10.254 m 2
at
20o
. Injection of a gel-forming solution containing 10 % PVA and
electrolyte was performed at a pressure gradient of 3.5–4 atm/m. The model
was subsequently held for 12 hours at 20 o
to form the gel, after which
water infiltration was once again initiated.. No water infiltration was
observed at pressure increases up to 140-160 atm/m (Fig. 7).
2 o
Thus, PVA-based gel-forming solutions with a cross-linking agent and
electrolyte as additives are capable of creating reliable cutoff barriers in
carbonate rocks. The study of infiltration characteristics of soils with PVA-
based gel-forming solutions under thermobaric conditions demonstrated that
after gelation one could observe a sharp decrease in water mobility, even up
to pressure differences higher than 100 atm/m.
Figure 6. Creation of a cutoff wall via injection of a gel-forming solution (3 % PVA and a
cross-linking agent) into a crushed carbonate rock model with permeability of 87 µm at 6 .
Figure 7. Creation of cutoff screen via injection of gel-forming system: 10 % PVA and
electrolyte into a model of carbonate rock with permeability of 10.254 µm at 20 .
Cryogel Applications in Permafrost
110 Altunina, Kuvshinov and Dolgikh
2.2 Field Experiments
In order to seal a leaking interval at the base of a dam at the Irelyakh
hydrosystem in Mirny City, Sakha Republic (Yakutia) we have developed
the CRYOGEL-1 system based on PVA and a cross-linking agent. The
system is capable of forming gels at 0–20 during several hours and then
cryogels during the freeze-thaw process. In August-September of 2003, 51
tons of cryogel-forming solution were injected into 5 holes at the base of the
dam. This injection formed a cryogel barrier that is 15m in length, 3 m thick
and covers an area of about 430 m2 at a depth ranging from 16 to 45 m. The
barrier created a cutoff wall which decreased water infiltration by 150 times.
The results of geophysical studies and hydrodynamic investigations in a test
hole, drilled between the third and the fourth holes into which the cryogel
was injected, show that the average specific water absorbing was 0.15
L/(min m m water column) up to 40 m deep, highlighting the positive results
of the research.
In 2004 the work at the Irelyakh hydrosystem dam was continued. Based
on the regulations of IPC SB RAS Stock Company, “Korona-TEK” designed
and made equipment for the preparation and injection of cryogel-forming
solutions. In September-November of 2004 starboard plugging of the dam,
where the filtration was the strongest, was successfully carried out. A total of
70 tons of cryogel-forming solution was injected into 13 holes to create a
cryogel barrier at a depth ranging from 13 to 43 meters.
In 2005 cryogel-forming solutions will be injected into more than 100
holes to create a cutoff wall along the full length of the Irelyakh
hydrosystem dam.
REFERENCES
Lozinsky, V.I., 1998, Cryotropic gelation of poly(vinyl alcohol) solutions. Uspekhi khimii,
67(6):, p. 641.
Lozinsky, V.I., 2002, Cryogels on the basis of natural and synthetic polymers: preparation,
properties and application, Uspekhi khimii, 71(6), p. 259.
Rebinder P.A. Selected works. Surface phenomena in dispersed systems. Physico-chemical
mechanics. «Nauka», ., 1979, 381 p.
Papkov, S.P., 1974, Gelatinous state of polymers, Khimia, ., 256 p.
Sergeev, G.B., and Batyuk, V.A., 1978, Cryochemistry, Khimia, M., 295 p.
SUBSURFACE CARBON DIOXIDE STORAGE
THROUGH CLATHRATE HYDRATE
FORMATION
P. Jadhawar, A.H. Mohammadi, J. Yang, B. Tohidi
Centre for Gas Hydrate Research, Institute of Petroleum Engineering, Heriot-Watt
University, Edinburgh, United Kingdom.
Abstract: Rising atmospheric emissions as a result of fossil fuel consumption is a major
concern for the developed and developing countries, considering the role it
plays in the greenhouse effect and hence global climate change. Various
schemes for underground CO2 storage (viz. geologic disposal into coal seams,
depleted oil/gas reservoirs, salt caverns, and deep oceans) have already been
reported in the literature. Subsurface CO2 storage through clathrate hydrate
formation is a novel option for the reduction of atmospheric carbon content
and permanent underground CO2 disposal over geological periods. Depths of
CO2 injection, respective pressure-temperature conditions, water salinity etc.
are all important factors for successful CO2 sequestration. Furthermore if CO2
is injected/stored in methane hydrate reservoirs it could be possible to produce
low-carbon methane energy, thereby offsetting the cost of CO2 transportation
and disposal. In this communication, we present the results of experiments
carried out to understand the mechanisms of CH4 displacement in hydrate
structure by injected CO2 and the formation of simple CO2 or mixed CH4-CO2
hydrates, thereby simulating the conditions of CO2 injection into CH4 hydrate
reservoirs. We used two sets of experimental rigs specifically designed for
studying gas hydrates in porous media. They are the Medium Pressure Glass
Micromodel (80 bar) for visual observation of gas hydrate formation /
dissociation and distribution in porous media, and the Ultrasonic Rig (400 bar)
for studying CO2 sequestration in CH4 hydrates in synthetic porous media.
Key words: subsurface CO2 sequestration, permafrost oil and gas reservoirs, CH4 hydrate
reservoirs, simple CH4 / CO2 hydrates or mixed CH4 -CO2 hydrates.
111
S. Lombardi et al. (eds.),
Advances in the Geological Storage of Carbon Dioxide, 111–126.
© 2006 Springer. Printed in the Netherlands.

112 Jadhawar, Mohammadi, Yang and Tohidi
1. INTRODUCTION
Gas hydrates were first identified in 1810 by Sir Humphrey Davy (Davy,
1811) and their compositions were later established by Faraday (Faraday
1823). Gas hydrates are naturally occurring crystalline inclusion compounds
(clathrates) characterized by strictly determined structures for different gases
(Makogon, 1997). Clathrates form when water establishes, due to hydrogen
bonding, a cage-like structure around small guest molecules (e.g., light
alkanes, carbon dioxide, hydrogen sulphide, nitrogen and oxygen) at low
temperature and high-pressure conditions. Their formation, stable existence
and decomposition depend upon the pressure, temperature and composition
of the system. Gas hydrates can exist in one of the three most-common
structures, I, II (Claussen, 1951; von Stackelberg and Müller, 1954; Jeffrey
and McMullan, 1967) and H (Ripmeester et al., 1987) (Figure 1). Both CH4
and CO2 form structure I hydrate (Davidson, 1973), as do the mixtures of
these gases (Adisasmito et al., 1991).
Figure 1. Different forms of clathrate hydrate structures. The numbers over the arrows
Very large sedimentary deposits of natural gas hydrates (14 1012
t.o.e.),
whose existence was proven 30 years ago (Makogon, 1997), are inferred to
occur in two types of geologic environments: permafrost regions (where cold
temperatures dominate) and beneath the sea in sediments off the outer
continental margins (where high subsurface pressures dominate). Both
deposit types are regarded as potential energy storehouses. While methane,
propane, and other gases are included in the hydrate structure, methane
hydrates are the most common, and thus so are the structure-I hydrates. The
indicate the number of cage types. (Modified from Sloan, 2003).
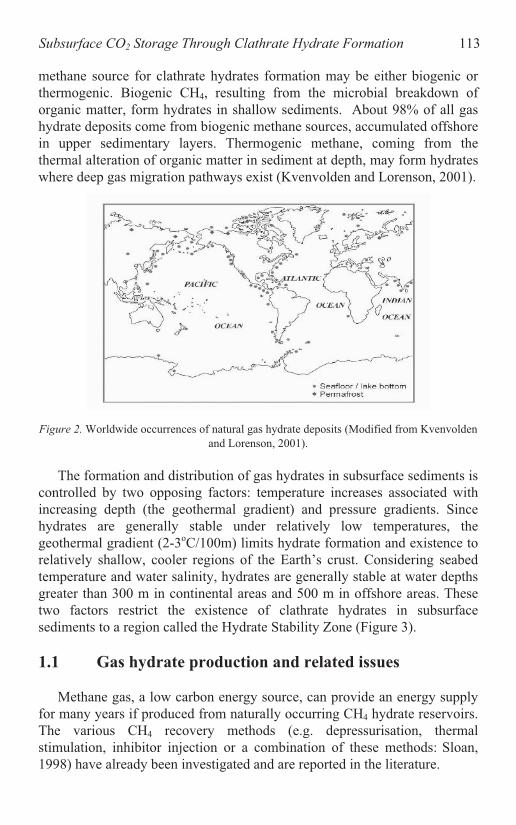
Subsurface CO2 Storage Through Clathrate Hydrate Formation 113
methane source for clathrate hydrates formation may be either biogenic or
thermogenic. Biogenic CH4, resulting from the microbial breakdown of
organic matter, form hydrates in shallow sediments. About 98% of all gas
hydrate deposits come from biogenic methane sources, accumulated offshore
in upper sedimentary layers. Thermogenic methane, coming from the
thermal alteration of organic matter in sediment at depth, may form hydrates
where deep gas migration pathways exist (Kvenvolden and Lorenson, 2001).
Figure 2. Worldwide occurrences of natural gas hydrate deposits (Modified from Kvenvolden
and Lorenson, 2001).
The formation and distribution of gas hydrates in subsurface sediments is
controlled by two opposing factors: temperature increases associated with
increasing depth (the geothermal gradient) and pressure gradients. Since
hydrates are generally stable under relatively low temperatures, the
geothermal gradient (2-3oC/100m) limits hydrate formation and existence to
relatively shallow, cooler regions of the Earth’s crust. Considering seabed
temperature and water salinity, hydrates are generally stable at water depths
greater than 300 m in continental areas and 500 m in offshore areas. These
two factors restrict the existence of clathrate hydrates in subsurface
sediments to a region called the Hydrate Stability Zone (Figure 3).
1.1 Gas hydrate production and related issues
Methane gas, a low carbon energy source, can provide an energy supply
for many years if produced from naturally occurring CH4 hydrate reservoirs.
The various CH4 recovery methods (e.g. depressurisation, thermal
stimulation, inhibitor injection or a combination of these methods: Sloan,
1998) have already been investigated and are reported in the literature.

114 Jadhawar, Mohammadi, Yang and Tohidi
These production methods may induce instability in the hydrate rich
sediments. The likely mechanism is that hydrate decomposition at the base
of the hydrate stability zone convert consolidated sediments into loose gas-
charged sediments. This causes a decrease in the shear strength and
facilitates the occurrence of landslides, tsunamis or other natural disasters,
such as the 1986 Lake Nyos disaster (Rogers, 1996). After massive
landslides on the continental slopes, mud volcano eruptions could cause
massive hydrate dissociation and the release of CH4 into the atmosphere,
which would contribute to climate change. Natural gas pipelines laid from
production platforms to shore may warm sea floor sediments and decompose
surrounding hydrates. A concern of the oil and gas industry is also the fact
that drilling through hydrate zones might destabilize supporting foundations
for platforms and production wells. Disruptions to the ocean floor from
hydrate decomposition could also result in surface slumping or faulting,
endangering work crews and the environment. Loss of seawater buoyancy
because of hydrate-released gas could endanger floating structures (Hovland
and Gudmestad, 2001).
Sea Floor
273 283 293
Temperature / K
Dep
th/M
etr
e
0
1500
500
1000
Zone of
Gas Hydrates
in Sediments
Zone of
Gas Hydrates
in Sediments
Hydrate Phase
Boundary
Hydrate Phase
Boundary
Hydrate Phase
Boundary
Hydrothermal
Gradient
Geothermal
Gradient
Hydrothermal
Gradient
Hydrothermal
Gradient
Hydrothermal
Gradient
Geothermal
Gradient
Geothermal
Gradient
Hydrate
Stability
Zone
A
Figure 3. A. Seafloor CH4 hydrate stability zone. B. Permafrost CH4 hydrate stability zone.
1.2 Greenhouse gases and their mitigation
Rising levels of the greenhouse gases (mainly CO2) in the atmosphere
have been a great concern for most of the developed and developing nations
because of the major climate changes that have been observed in recent
decades. One of the options for mitigating the rising greenhouse gas
concentrations is their sequestration and storage in subsurface formations.
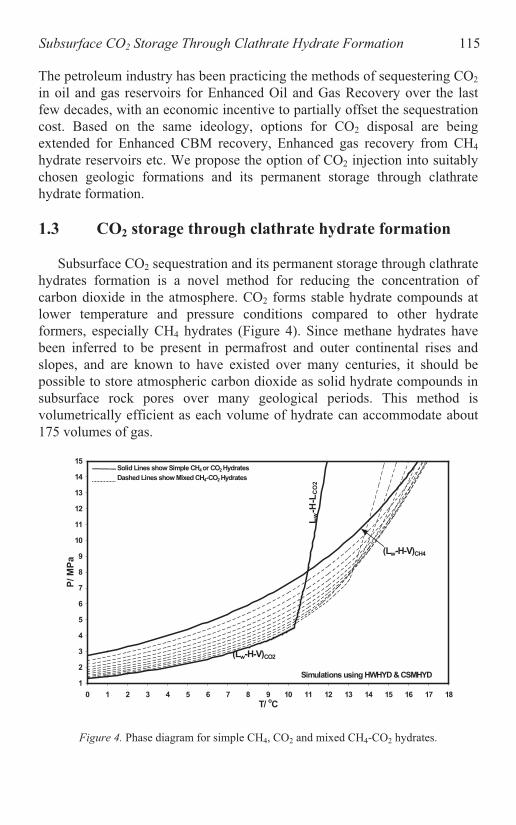
Subsurface CO2 Storage Through Clathrate Hydrate Formation 115
The petroleum industry has been practicing the methods of sequestering CO2
in oil and gas reservoirs for Enhanced Oil and Gas Recovery over the last
few decades, with an economic incentive to partially offset the sequestration
cost. Based on the same ideology, options for CO2 disposal are being
extended for Enhanced CBM recovery, Enhanced gas recovery from CH4
hydrate reservoirs etc. We propose the option of CO2 injection into suitably
chosen geologic formations and its permanent storage through clathrate
hydrate formation.
1.3 CO2 storage through clathrate hydrate formation
Subsurface CO2 sequestration and its permanent storage through clathrate
hydrates formation is a novel method for reducing the concentration of
carbon dioxide in the atmosphere. CO2 forms stable hydrate compounds at
lower temperature and pressure conditions compared to other hydrate
formers, especially CH4 hydrates (Figure 4). Since methane hydrates have
been inferred to be present in permafrost and outer continental rises and
slopes, and are known to have existed over many centuries, it should be
possible to store atmospheric carbon dioxide as solid hydrate compounds in
subsurface rock pores over many geological periods. This method is
volumetrically efficient as each volume of hydrate can accommodate about
175 volumes of gas.
1
2
3
4
5
6
7
8
9
10
11
12
13
14
15
0 1 2 3 4 5 6 7 8 9 10 11 12 13 14 15 16 17 18
T/ oC
P/
MP
a
Lw-H
-LC
O2
(Lw-H-V)CH4
(Lw-H-V)CO2
Simulations using HWHYD & CSMHYD
Solid Lines show Simple CH4or CO2 Hydrates
Dashed Lines show Mixed CH4-CO2 Hydrates
Figure 4. Phase diagram for simple CH4, CO2 and mixed CH4-CO2 hydrates.

116 Jadhawar, Mohammadi, Yang and Tohidi
Low temperatures, high pressures and the availability of adequate
amounts of hydrate-forming gas are the necessary conditions for hydrate
formation that are known to be prevalent in natural permafrost sediments in
oil and gas reservoir provinces. Drilling, exploration and production
activities for the exploitation of these oil and gas reservoirs have been taking
place over many decades. Carbon dioxide sequestration in the sedimentary
sections, which have been depleted of oil and gas volumes, would not only
re-pressurize these reservoirs and consequently produce oil and gas, but
would also safely store the injected carbon dioxide as clathrate hydrates in
the later stages. In-place infrastructure can be used to inject the carbon
dioxide into subsurface permafrost sedimentary sections (including
formations other than oil and gas provinces), which would diminish the cost
of CO2 disposal. Injected CO2 would be converted into hydrates and occupy
the pore spaces of the host rock. The possibility of their atmospheric seepage
would be very little as the overlying permafrost layers would act as an
impermeable barrier in the form of a cap rock, thus preventing diffusion or
upward migration of CO2 through pores (Duxbury and Romanovsky, 2004;
Clarke, 2001). Even in offshore sediments where oil and gas reservoirs exist,
there is an increased chance of hydrate accumulations associated with them
(e.g. North Sea, Indian Ocean, Taiwan).
Our experimental investigations were aimed at better understanding the
processes affecting CO2 injection into CH4 hydrate reservoirs, thereby
allowing permanent storage of CO2 in the form of clathrate hydrates.
2. EXPERIMENTAL INVESTIGATIONS OF CO2
INJECTION INTO CH4 HYDRATE RESERVOIRS
Injecting CO2 into subsurface CH4 hydrate reservoirs would displace
some of the CH4 in the hydrate crystal lattice, converting simple CH4
hydrates into either simple CO2 hydrates or double CH4-CO2 hydrates. This
process could be of particular interest for many reasons. It enables low
carbon energy recovery in the form of CH4 gas, while offsetting the cost of
CO2 transportation and storage. In addition sediment pore spaces potentially
re-occupied by the CO2 hydrate would maintain the mechanical stability of
the gas-producing formations, thus preventing the possible hazard of slope
failures. The most important part of this production process is that the
injected greenhouse gas, carbon dioxide, is permanently and safely stored as
clathrate hydrates in subsurface geologic formations over geologic times.
Oghaki et al. (1996) investigated the possibility of methane production
from hydrate reservoirs in conjunction with CO2 injection. Later, Hirohama
et al. (1996), Komai et al.(1999, 2003) and Ota et al. (2004) investigated

Subsurface CO2 Storage Through Clathrate Hydrate Formation 117
these processes. All of these studies were conducted under bulk conditions
(i.e. absence of porous media). The kinetics of replacement was investigated
on the micro-scale by Uchida et al. (2001) and Lee et al. (2003). Sivaraman
(2003) studied the effect of CO2 on methane recovery in the presence of
porous media, with the test pressure below the CO2 saturation pressure.
McGrail et al. (2004) used micro-emulsions along with CO2 to investigate
similar processes.
2.1 CO2 sequestration experiments on ultrasonic Rig-1
In the present work experiments into the replacement of CH4 in hydrates
by injected CO2 were carried out under isothermal conditions (2 0C) within
operating pressures just above the methane hydrate dissociation pressures, in
the range of 50 psia. This test mimics reservoir conditions where
replacement is observed under excess gas conditions (i.e. very little or no
free water). The compositions of coexisting phases have been measured via
the gas chromatography (GC) method.
2.1.1 Materials
CH4 and CO2 gases used in the evaluation of CH4 replacement were
purchased from Air Products PLC, with a certified purity of 99.995 vol. %.
Glass beads were purchased from BioSpec Products Inc. Distilled water was
used in all experiments.
2.1.2 Apparatus
The experimental set up shown in Figure 5 was used to investigate the
replacement of CH4 in the hydrate structure by the injected CO2. It consists
of a high-pressure stainless steel cell, a feed system for CH4, CO2 and water,
and instrumentation for measuring temperature and pressure. The high-
pressure cell is constructed of stainless steel with an internal pressure rating
of 6,000 psia and an internal volume of 630 cc. The cell is surrounded by a
coolant jacket with circulating fluids controlled by a programmable cryostat
(-20oC to 80
oC) that can be kept stable to within 0.05
oC. Sediments can
be compacted to any given overburden pressure by means of a piston
system. In this work half of the experimental cell, as shown in Figure 5, was
filled with glass beads. Pore fluid pressure was controlled independently.
Temperatures and pressures were monitored by means of a PRT and
Quartzdyne pressure transducers (accuracy of 1.16 psia for 0-20000 psia),
respectively. In addition, the pressure could be held constant for long periods
of time with a high-pressure Quizix pump.

118 Jadhawar, Mohammadi, Yang and Tohidi
Figure 5. Experimental set-up for the CO2 sequestration tests.
The analytical work was carried out using a Varian 3600 Gas
Chromatograph configured with two thermal conductivity detectors (TCD):
one is dedicated for ‘parts-per-million’ moisture analysis of hydrocarbon
gases, while the other conducts conventional gas analysis. Composition
measurement of the C1-CO2 binary gas samples fall into the conventional gas
analysis category, and the separations were performed on a 3m x 1/8” x
2mm i.d. column, using an oven temperature program of 20 ºC to 250 ºC,
ramped at 15 ºC per minute, with no isothermal periods. Detector
temperature was 300 ºC, and the 6-port ‘Valco’ injection valve was
maintained at laboratory temperature, with no heating applied. For
calibration purposes several CH4-CO2 gravimetric standards were prepared
in-house to cover the range of concentrations encountered; this was done
using a small, stainless steel pressure vessel of around 15cm3 and weighing
with a ‘Mettler’ “Mass Comparator” balance (accurate to ± 0.001g). From
these the appropriate relative molar response factors for the CO2 were
calculated across the required range of concentrations, with the CH4 and CO2
mole fractions then calculated using the derived response factors.
2.1.3 Experimental procedure
These preliminary tests were carried out under excess gas conditions for
their simplicity, though most methane hydrate reservoirs are believed to be
under excess water conditions. The test consisted of the following three
steps: i) methane hydrate formation; ii) injection of CO2 in the methane
hydrate-vapour system; and finally, iii) measurement of methane recovery

Subsurface CO2 Storage Through Clathrate Hydrate Formation 119
through replacement in hydrates by CO2 over gas chromatograph. Most of
the water and methane was utilized for the methane hydrate formation. The
test was conducted in a synthetic porous media (glass beads) under
thermodynamic conditions where both CO2 and CH4 hydrate are stable. Also
the system pressure was kept below the saturation pressure of CO2.
In this experiment, glass beads of 0.5 mm diameter were used to act as
the reservoir sediments. Glass beads were placed into the cell to occupy 50%
of the total cell volume, and then saturated with distilled water. CH4 was
introduced in the cell at room temperature so as to have the system pressure
at a value higher than the three-phase equilibrium pressure of methane
hydrate at that temperature. After gas injection, the test system was left at
about 20 C and 2000 psia overnight to stabilize and reach phase
equilibrium. The following day, normally, the test system was directly
cooled down to the target temperature by a cooling bath to form hydrates.
During the initial stages of cooling the system pressure continues to decrease
for a number of hours. However, as the methane hydrate begins to form a
sharp decrease in cell pressure is observed, indicating that CH4 is being
absorbed from the headspace into the hydrate structure. Growth of methane
hydrates was continued even before the injection of CO2 into the cell. The
results of CH4 hydrate formation tests are presented in Table 1.
Table 1. Test conditions and details of methane hydrate formation.
Test T /0C P / psia n1 nh n2 nw
1 2 520 to 485 1.815 0.524 1.291 0.395
In Table 1 n1 is the moles of methane injected into the vapour phase
before hydrate formation while n2 represents the moles of methane
remaining after hydrate formation, nh shows the amount of the methane
(moles) enclathrated in the hydrates, and nw are the moles of free water
remaining after CH4 hydrate formation and before CO2 injection in the cell.
The cell temperature was then increased to a value within the CH4
hydrate stability region so that the cell system could be monitored for
changes in vapour phase composition. Methane in the vapour phase was
subsequently partially replaced by carbon dioxide in two to three injection
cycles while keeping the internal pressure higher than the three-phase
(liquid-vapour-hydrate) equilibrium pressure for methane hydrates. On
completion of the CO2 injection step, the pressure of the system was
adjusted to the target conditions for the investigation of methane
replacement by CO2 in hydrates. CH4 hydrates, along with 2% free water,
were allowed to soak with the CO2-CH4 gas mixture for a certain period. For
each equilibrium condition, samples were withdrawn once every 24 to 72
hours, and analyzed with the GC for the possible rise in methane content.

120 Jadhawar, Mohammadi, Yang and Tohidi
2.1.4 Results and discussions
Initial composition of the gas phase was 30.33% CH4 and 69.67% CO2
at the beginning of replacement step. Pressure and temperature conditions
were such that CO2 would remain in gaseous state. During the initial 20
hours of the process the methane recovery rate was high, which may be
attributed to the simultaneous enclathratisation of both CH4 and CO2. Carbon
dioxide has a higher affinity towards occupying cavities in the hydrate
structure than does CH4, and thus most of the free water could be utilised for
CO2 hydrate formation. It is more likely that the rate of CO2 going into the
hydrate state would be higher than CH4. A small decrease in system pressure
was observed during this period, and no rise in temperature was observed
(which could be due to large heat capacity of the system). Headspace CO2
started replacing CH4 in the hydrate lattice from this point onwards. It is
expected that the methane hydrates in the immediate vicinity of the CO2-CH4
headspace would be initially converted into CO2 hydrates. Slow diffusive
mass transfer of CO2 through the porous sediments drove further methane
replacement and continued to rise over the next 80 hours. Most likely mixed
CH4-CO2 hydrates were formed at this stage, which slowed down the
exchange during the latter stage. For replacing methane in hydrates, CO2
took 206 hours to recover 8.3 mole% of methane. This replacement rate in
porous media was high compared to the results published by Hirohama et al.
(1996). These authors recovered 6.9 mole% of methane in the gas phase over
800 hours when CO2 was used to replace methane in hydrates in the
presence of a methane hydrate - water system (i.e. bulk conditions). The
possible reason for the higher replacement rate could be due to the high gas-
solid interface available in the porous media.
The replacement reaction is started when the cell pressure is controlled
under isothermal conditions. CO2 probably starts to replace methane in the
hydrates within the first layer near the methane hydrate – gas mixture
interface. Later replacement of CH4 in the host hydrate lattice by CO2
remains a diffusion-limited process. Replacement processes were continued
until termination of the tests.
2.2 CO2 storage investigation with a visual glass
micromodel
A Visual Micromodel was used to study the potential for the
underground sequestration of carbon dioxide in methane hydrate reservoirs.
Phase behaviour of reservoir fluids in porous media have been extensively
studied earlier using micromodels (Sohrabi et al., 2000), while its potential
application in gas hydrate studies has been demonstrated by Tohidi et al.

Subsurface CO2 Storage Through Clathrate Hydrate Formation 121
(2001). Pore scale studies were aimed towards providing insight into gas
hydrate growth from dissolved gas (CO2-water) and gas hydrate distribution
/ cementing characteristics of grains in THF-, CO2- and CH4-water systems.
Later Anderson et al. (2001) produced visual information on phase
distribution in porous media, and hydrate-grain cementation for CH4-water
and CH4-CO2-water systems. Here we present the results of experiments
conducted using the Medium Pressure Micromodel for studying the effect of
CO2 injection on already-existing methane hydrates in porous media.
2.2.1 Experimental investigation
Two micromodel rigs are currently in operation: a medium pressure set-
up (1204 psia) and a high-pressure set-up (5947 psia). The central glass
micromodels consist of an etched glass base-plate topped with a sealed glass
cover plate (Figure 6). Either a geometrically designed network of pores,
tubes or reproductions of actual thin sections of real sediments can be used
to construct the micromodels by etching with hydrofluoric acid. The cover
plate has an inlet and an outlet, which allows fluids to be pumped through
the enclosed pore network using small-volume piston vessels or a precision
Quizix pump (Figure 7).
In both set-ups the glass micromodels are mounted in a vessel that exerts
an overburden pressure and are surrounded by coolant jackets controlled by
temperature-controlled baths. Temperature is measured by a probe mounted
in the overburden cell, and transducers measure pressure on the model inlet
and outlet lines. Temperature can be kept stable to within 0.05 oC.
Temperatures and pressures are monitored by means of a PRT and
Quartzdyne pressure transducers (accuracy of 1.16 psia for 0-20000 psia),
respectively.
Magnifying cameras are mounted above the models, with illumination
being provided by cold light sources. Because the micromodel pore structure
is only one pore thickness deep it is possible to clearly observe phase
changes and fluid flow behaviour. Digital video footage is recorded during
the experiment, and the pictures presented here are ones recorded either from
video footage or camera clippings.
Existing equipment has been employed in the study of a wide variety of
hydrate systems pertaining to various scenarios, from hydrates in sub-sea
sediments to flow assurance. The technique provides novel visual
information on the mechanisms of clathrate growth, micro-scale dissociation
and phase distribution, with respect to pressure, temperature, wettability and
fluid composition (presence of inhibitors, liquid hydrocarbons, free and
dissolved gas).

122 Jadhawar, Mohammadi, Yang and Tohidi
PC /
Digital VCR0.00
Cryostat
Magnifying
camera
P
Micromodel
Piston vessel
(inlet)
Piston vessel
(oulet)
Pressure
transducers
Coolant
Temperature
probe
P
Insulated jacket
Figure 7. Glass micromodel: experimental set-up.
In all experiments the liquid (water) phase was dyed with methyl blue.
Hydrates and gas exclude this dye, thus increasing the contrast between the
phases, while it is not known to have any measurable effect on clathrate
stability.
2.2.2 Results and discussion
Glass micromodels are used for the visual observation of the CO2
trapping mechanism. The tests were conducted in the simple methane
hydrate - water system, thereby mainly simulating reservoir conditions
where excess free water exists in naturally-occurring hydrate-rich sediments.
Formation of small methane hydrate crystals occurs from free CH4 gas,
which is then followed by the injection of CO2 into the methane hydrate-
water system. Figures 8-A through D are representative micromodel images
of the phase distribution prior to and after CO2 injection. This experiment
was conducted under temperature and pressure conditions where only simple
CH4 hydrates are stable, but not simple CO2 hydrates, and CO2 is in the
liquid state. Temperature was kept constant throughout the experiment.
Figure 6. Glass micromodels: pore structure and operational scheme.
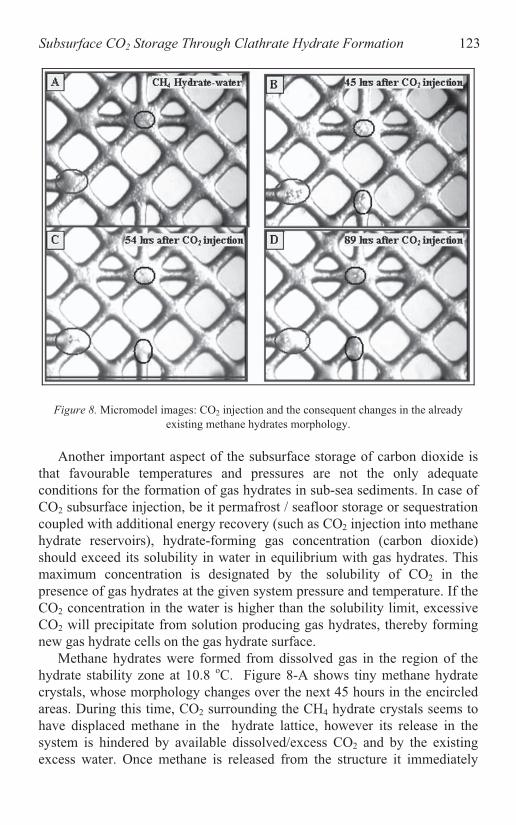
Subsurface CO2 Storage Through Clathrate Hydrate Formation 123
Figure 8. Micromodel images: CO2 injection and the consequent changes in the already
existing methane hydrates morphology.
Another important aspect of the subsurface storage of carbon dioxide is
that favourable temperatures and pressures are not the only adequate
conditions for the formation of gas hydrates in sub-sea sediments. In case of
CO2 subsurface injection, be it permafrost / seafloor storage or sequestration
coupled with additional energy recovery (such as CO2 injection into methane
hydrate reservoirs), hydrate-forming gas concentration (carbon dioxide)
should exceed its solubility in water in equilibrium with gas hydrates. This
maximum concentration is designated by the solubility of CO2 in the
presence of gas hydrates at the given system pressure and temperature. If the
CO2 concentration in the water is higher than the solubility limit, excessive
CO2 will precipitate from solution producing gas hydrates, thereby forming
new gas hydrate cells on the gas hydrate surface.
Methane hydrates were formed from dissolved gas in the region of the
hydrate stability zone at 10.8 oC. Figure 8-A shows tiny methane hydrate
crystals, whose morphology changes over the next 45 hours in the encircled
areas. During this time, CO2 surrounding the CH4 hydrate crystals seems to
have displaced methane in the hydrate lattice, however its release in the
system is hindered by available dissolved/excess CO2 and by the existing
excess water. Once methane is released from the structure it immediately

124 Jadhawar, Mohammadi, Yang and Tohidi
mixes with the dissolved CO2. Since the thermodynamic conditions are
favourable for clathrate hydrate formation the mixed CH4-CO2 gas hydrates
forms. The time lapsed in this process is very small, about 8 to 9 hours,
when we carefully analyze the morphology change in the encircled sections
of Figure 8-C over Figure 8-B. Mixed hydrate formation occurred around the
locations where methane hydrates were already present before CO2 injection.
CO2 hydrates were formed from the gas dissolved in the water phase. The
solubility of CO2 played an important role in the formation of CO2 hydrate
from the water phase, which resulted in a concentration gradient and the
subsequent diffusion across CO2 hydrate-water interface. The re-formation
of the mixed-gas hydrates was nearly complete after 89 hours (Figure D).
However under real reservoir conditions the heat released from CO2 and
mixed CH4-CO2 hydrate formation could result in local temperature
increases and the dissociation of methane hydrates. This possible
phenomenon was not investigated in this phase of the work. Nevertheless,
the glass micromodel proved to be an invaluable facility for generating
micro-scale data to better understand gas hydrate formation and dissociation
mechanisms.
3. CONCLUSIONS
The experimental results of CO2 sequestration in CH4 hydrate reservoirs
and subsequent CH4 recovery (under excess gas conditions) were obtained
by using two types of experimental set ups. The experimental investigation
using the Ultrasonic Rig imitated CO2 injection in a methane hydrate
reservoir under excess gas conditions. An increase in CH4 composition in the
headspace gas samples indicates that CH4 enclathrated in the host hydrate
lattice was partially replaced by the injected CO2. Injection of CO2 below its
saturation pressure in this test produced 7.97-mole% methane in 206 hours.
The experimental results show that the CH4 recovery rate in porous media
was higher than previous results obtained by Hirohama et al. (1996) under
bulk conditions.
The tests in the Visual Glass Micromodel showed that CO2 injection into
sediments containing methane hydrates under excess water conditions was
converted into either CO2 hydrates or mixed CO2-CH4 hydrates. However, it
should be noted that these tests were conducted under constant temperature
conditions, which may not be the case in real reservoirs due to the release of
heat as a result of CO2 and/or mixed CH4- CO2 hydrate formation.
Subsurface CO2 Storage Through Clathrate Hydrate Formation 125
ACKNOWLEDGEMENTS
The Scottish Higher Education Funding Council provided the financial
support for this work, which is gratefully acknowledged. The authors wish to
thank Mr Jim Pantling for construction and maintenance of the experimental
equipment. One of authors (Mr Jadhawar) wishes to thank the Institute of
Petroleum Engineering and the Centre for Gas Hydrate Research for
financial support. The authors would also like to acknowledge Ross
Anderson, Rod Burgass and Alastair Reid for their help with the
experiments.
REFERENCES
Adisasmito, S, Frank, RJ, and Sloan, ED Jr, 1991, Hydrates of Carbon-Dioxide and Methane
Mixtures. Journal of Chemical Engineering Data 36(1): 68-71.
Anderson, R, Biderkab, AB, Tohidi, B., and Clennell, MB., 2001, Visual Observation of Gas
Hydrate Formation in Glass Micromodels. EAGE 63rd Conference & Technical Exhibition
Clarke, J, 2001, Gas Hydrate Deposits in Oil-Gas Provinces of Russia. Internet Geology News
Letter No. 80.
Claussen, WF, 1951, A second water structure for inert gas hydrates. Journal of Chemical
Physics 19:1425-1432.
Davidson, DW, 1973, Clathrate Hydrates, in: Water: A Comprehensive Treatise, F. Franks,
ed., Plenum Press, New York, pp.115-163.
Davy, H, 1811, Phil. Trans. Roy. Soc. London 101, 1 (Quoted in Sloan, 1998).
Duxbury, N, and Romanovsky, V, 2004, Permanent Sequestration of Emitted Gases in the
form of Clathrate Hydrates. NASA TechBriefs.: NPO-30256, 55.
Faraday, M, 1823, Phil. Trans. Roy. Soc. London 113, 160 (Quoted in Sloan, 1998).
Hirohama, S, Shimoyama, Y, Wakabayashi, A, Tatsuta, S, and Nishida, N, 1996, Conversion
of CH4-Hydrate to CO2-Hydrate in liquid CO2. Journal of Chemical Engineering of Japan;
29(6):1014-1020.
Hovland, M, and Gudmestad, OT, 2001, Potential Influence of Gas Hydrates on Seabed
Installations, in: Natural Gas Hydrates- Occurrence, Distribution and Detection, CK Paul
and WP Dillon, eds., Geophysics Monograph 124, American Geophysical Union,
Washington, pp. 307-315.
Jeffrey, GA, and McMullan, RK, 1967, The Clathrate Hydrates, in: Progress in Inorganic
Chemistry. Cotton, F.A, ed., Interscience, New York, pp. 43-108.
Komai, T, Kawabe, Y, Kawamura, T, and Yoon, J, 2003, Extraction of Gas Hydrates using
CO2 sequestration. In: International Offshore and Polar Engineering Conference, Hawaii
USA, 2003.
Komai, T, Yamamoto, Y, and Ogha, K, 1999, Dynamics of Reformation and Replacement of
CO2 and CH4 gas hydrates. In: Third International conference on Gas Hydrates, Salt lake
City, Utah, USA.
Kvenvolden, KA, and Lorenson, TD, 2001, The Global Occurrence of Natural Gas Hydrate,
in: Natural Gas Hydrates- Occurrence, Distribution and Detection, Paul, CK and Dillon,
— Amsterdam, The Netherlands, 11 - 15 June, 2001.
126 Jadhawar, Mohammadi, Yang and Tohidi
WP, eds., Geophysics Monograph 124, American Geophysical Union, Washington: pp. 3-
18.
Lee, H, Seo, Y, Seo, YT, Moudrakovski, IL, and Ripmeester, JA, 2003, Recovering methane
from solid methane hydrate with carbon dioxide. Angewandte Chemie-International
Edition 42(41):5048-5051.
Makogon, YF, 1997, Hydrates of Hydrocarbons. PennWell Books, Oklahoma.
McGrail, BP, Zhu, T, Hunter, RB, White, MD, Patil, SL, and Kulkarni, AS, 2004, A New
Method for Enhanced Production of Gas hydrates with CO2. In: Gas Hydrates: Energy
Resource Potential and Associated Geologic Hazards, AAPG Hedberg conference,
Vancouver, Canada, 2004.
Oghaki, K, Takano, K, Sangawa, H, Matsubara, T, and Nakano, S, 1996, Methane
Exploitation by Carbon Dioxide from Gas Hydrates- Phase Equilibria for CO2 - CH4
mixed hydrate system. Journal of Chemical Engineering of Japan 29(3): 478-483.
Ota, M, Abe, Y, Watanabe, M, Smith, RL, and Inomata, H, 2005, Methane Recovery from
Methane Hydrate using pressurized CO2. Fluid Phase Equilibria, Vol 228-229: 553-559,
PPEPPD proceedings, Available online Nov 2004. .
Ripmeester, J.A., Tse, J.S., Ratcliffe, C.I., and Powell, B.M., 1987, A new clathrate hydrate
structure. Nature: 325, 135.
Rogers, RE, Yevi, 1996, Gas hydrate theory explains lake Nyos disaster. In: Proceedings of
The 2nd International Conference on Natural Gas Hydrates, Toulouse, France, 1996.
Sivaraman, R, 2003, The potential role of hydrate technology in sequestering carbon dioxide.
Gas TIPS. Fall 2003 . http://www.gastechnology.org/
Sloan, ED Jr, 1998, Clathrate Hydrates of Natural Gases. Marcel Dekker Inc., New York.
Sloan, ED Jr, 2003, Fundamental Principles and Applications of Natural Gas Hydrates.
Nature 426:353-359.
Sohrabi, M, Henderson, GD, Tehrani, DH, and Danesh, A, 2000, Visualization of Oil
recovery by Water Alternating Gas (WAG) injection using High Pressure Injection Using
High Pressure Micromodels-Water-Wet System. Proceedings of the 2000 SPE Annual
Technical Conference and Exhibition, Dallas, Texas, 1-4 October, SPE 63000.
Tohidi, B, Anderson, R, Clennell, B, Burgass, RW, and Biderkab, AB, 2001, Visual
Observation of Gas Hydrate Formation and Dissociation in Synthetic Porous Media by
Means of Glass Micromodels. Geology 29(9): 867–870.
Uchida, T, Takeya, S, Ebinuma, T, and Narita, H, 2001, Replacing Methane with CO2 in
clathrate hydrate: Observations using Raman Spectroscopy. In: Proceedings of
Greenhouse Gas Control Technologies, East Melbourne..523-527.
von Stackelberg, M, and Müller, HR, 1954, Feste Gas Hydrate II., Zeitschrift fuer
Elektrochem 58:25-31 (Quoted in Sloan, 1998).

PART III
NATURAL ANALOGUES OF CO2 STORAGE
The Use of Natural Accumulations of Carbon Dioxide or other
Greenhouse Gases to Predict the Eventual Evolution
of Man-Made Storage Reservoirs

WHAT CAN WE LEARN FROM NATURAL
ANALOGUES?
An overview of how analogues can benefit the geological storage
of CO2.
J. M. Pearce
British Geological Survey, Keyworth, Nottingham NG12 5GG, UK
Abstract: The timescales needed for the geological storage of carbon dioxide (CO2) are
potentially thousands of years. Therefore, before large-scale underground CO2
storage can take place, it will be necessary to demonstrate that the processes
are well understood, risks to the environment and human populations are low,
and environmental disturbances can be minimised. One way of demonstrating
that CO2 can remain trapped underground for geologically significant times is
to provide evidence from existing naturally occurring accumulations. These
accumulations occur in a variety of geological environments and many can be
demonstrated to have retained CO2 for periods longer than those being
considered for CO2 storage. This fact will build confidence in the concept with
non-specialist policy-makers, environmental NGOs and the public. Studies of
natural analogues can be used to further validate predictive geochemical and
geomechanical models, increasing confidence in these models to predict how
CO2 will behave during and after storage, helping to determine how much of
the CO2 will be permanently trapped through mineral reactions. The results
have identified that kinetic reaction data need to be improved. It is unlikely
that in reservoirs similar to those investigated here, significant mineral
trapping can be expected, except over long geological timescales. Natural
accumulations can be used to test methodologies for monitoring CO2 leakage
that may be appropriate for use above repositories, both onshore and offshore,
to establish baseline conditions and to monitor sites at the surface during and
after storage. Soil gas surveys and analyses of gas leakage rates can define
how CO2 migrates through the near surface environment. Techniques for
determining the sealing capacity of caprocks have been tested on natural seals
known to retain CO2 and caprocks from future potential storage sites can be
compared with these datasets.
Key words: geological storage, natural analogues, greenhouse gas emissions, risk
assessment
129
S. Lombardi et al. (eds.),
Advances in the Geological Storage of Carbon Dioxide, 129–139.
© 2006 Springer. Printed in the Netherlands.
130 Pearce
1. INTRODUCTION
In order to address the global warming threat posed by anthropogenic
greenhouse gases, the European Union member states have committed
themselves, through the Kyoto Protocol, to an 8% reduction in their
greenhouse gas emissions from 1990 levels during the period 2008-2012.
In the medium to long term, however, it is becoming increasingly
recognised that reductions of up to 60% will be needed in order to stabilise
greenhouse gas levels in the atmosphere. Such a strategy requires several
parallel approaches, including more efficient energy use, increased use of
renewable energy sources, reduction of reliance on fossil fuels, removal of
carbon dioxide (CO2) from the atmosphere and geological storage of CO2.
The capture and underground storage of industrial quantities of carbon
dioxide is currently being demonstrated at the Sleipner West gas field in the
Norwegian sector of the North Sea (see Chadwick et al., this volume). It has
been suggested that such geological storage could offer potential long-term
storage of significant quantities of CO2 that would otherwise be emitted to
the atmosphere.
Although the storage duration needed may be a few hundred years, so as
to reduce atmospheric emissions during the fossil fuel era, it is likely that
CO2 will remain trapped for considerably longer, geological timescales. In
order not to burden future societies with unacceptable environmental
consequences, it is therefore necessary to have some understanding of site
performance over the long term (104 to 10
5 years may be an appropriate
timeframe).
This requires careful integration of several different approaches. Initial
site characterisation will be necessary to provide a model of the geological
system, as well as identifying past system behaviour. This site
characterisation will include detailed baseline surveys that can be compared
with future monitoring of site performance.
The prediction of site performance over long timescales also requires an
understanding of, inter alia, CO2 behaviour within the reservoir, the
possibilities and mechanisms of migration out of the reservoir, and the
potential impacts of a leak on the near surface environment. The
assessments of such risks will rely on a combination of predictive models of
CO2 behaviour, that should in themselves include both a consideration of
fluid migration and long-term CO2-porewater-mineralogical interactions (see
for example Stenhouse et al., this volume). Such predictive models must
therefore be verified through comparison with laboratory-based experiments
that provide carefully constrained thermodynamic equilibrium data on
specific geochemical processes (see for example Czernichowski et al., this
volume). However, such experiments are necessarily limited to relatively
What Can We Learn from Natural Analogues? 131
short timescales and so other lines of evidence are required from natural
systems where processes have operated for geological timescales.
This paper discusses some of the processes that have been studied at
various analogue sites in western Europe during the EC-funded Nascent
project (Pearce et al., 2004a) and serves as an introduction to other chapters
in this book that provide much greater detail of specific studies (Lombardi et
al., Chadwick et al., and Czernichowski et al., this volume; see also Schroot
et al., 2005).
2. WHAT CAN ANALOGUE SITES TELL US?
The industrial demonstration projects that are now underway allow
injection, reservoir evaluation and short term monitoring technologies to be
refined and demonstrated. However, by their nature, such sites are very
unlikely to leak. In contrast, some natural sites provide opportunities to
study processes controlling how leaks may occur, their potential impacts on
near-surface ecosystems and groundwaters and to develop and demonstrate
methodologies for monitoring CO2 leakage.
A key benefit of studying natural geological analogues is also their
temporal and spatial scales. Many processes that must be assessed when
predicting the performance of a storage site occur over long, often geological
timescales and can only partially be simulated in the laboratory or observed
in relatively short-term demonstrations. Studies of areas where these
processes have been occurring naturally can therefore complement
laboratory and demonstration studies (Pearce et al., 1996).
There have been several studies in recent years that have used natural
CO2 systems to understand long-term processes. As briefly reviewed here,
and described elsewhere in this volume, Pearce et al. (2004a and references
therein) have examined diagenetic processes, migration along fractures,
caprock integrity and near-surface processes at several sites across Europe.
Shipton et al. (2004) have studied CO2 migration mechanisms along the
Little Grand fault in the northern Paradox Basin. Stevens and Tye (2004)
have studied CO2 sources and trapping mechanisms in three CO2 fields in
the US: St John’s Dome in Arizona and Texas, Jackson Dome in Mississippi
and McElmo Dome in Colorado. Baines and Worden (2001) compared
diagenesis in otherwise geologically similar CO2-rich and CO2-poor North
Sea oilfields.
Techniques for monitoring CO2 in the shallow subsurface can also be
tested at naturally leaking sites. These methodologies are appropriate for use
above repositories, both onshore and offshore, to establish baseline
conditions and to monitor sites at the surface during and after storage. Soil
132 Pearce
gas surveys and analyses of gas leakage rates can define how CO2 migrates
through the near surface environment as well as identify migration pathways
(using tracer gases like Rn and He) that may be potential routes for CO2
escape in the near-surface (Lombardi et al., this volume). In addition,
studies of the long-term geochemical interactions within the CO2 reservoirs
have been used to validate predictive geochemical models.
However, studies of analogue systems are not without their limitations.
Establishing the timing of reservoir filling can often only be achieved
indirectly and so precise ‘dating’, necessary to ascertain geochemical
reaction kinetics, can be difficult. Natural systems are complex and
particular care must be taken to identify those processes that are solely
attributable to the presence of CO2.
Although natural CO2 accumulations provide greater confidence in the
potential to store CO2 for long periods, not all natural accumulations should
be considered directly analogous to a storage scenario. For example, many
near-surface CO2-rich springs and seeps occur in volcanic terrains, which
may not be tectonically comparable to storage in a sedimentary basin. These
sites do provide many opportunities to study near-surface processes and to
test monitoring methodologies. When studying natural systems to assess
potential impacts on ecosystems, it is important to be aware that ecosystems
may have evolved to cope, or exploit, the high CO2 environment, which
would be in contrast to an ecosystem being initially exposed to elevated CO2
concentrations for the first time.
3. WESTERN EUROPEAN ‘ANALOGUES’
Natural CO2 occurrences are common across Europe (Pearce et al.,
2004b and Figure 1) and, although they occur in a wide variety of geological
settings, their distribution is principally controlled by the Cenozoic rift
system and associated Tertiary volcanism. These occurrences can be
classified into:
CO2-rich waters both at depth and in springs. These are often exploited
for mineral waters and occur in a variety of geological settings, with the
sources of CO2 including mantle degassing, volcanic activity and
thermal metamorphism of limestones.
Dry CO2 gas vents (‘moffettes’). These are associated with Cenozoic
rifts such as the Eger and the Tyrrhenian rift systems. They are also
associated with hydrothermal fields and Quaternary to Recent volcanic
activity, such as in the Eiffel volcanic complex within the Rhenish
Massif; the Larderello geothermal field, Italy and, of course, currently
active volcanism.

What Can We Learn from Natural Analogues? 133
CO2 gas accumulations. These occur in Cenozoic extensional basins
such as within the sub-basins of the back-arc Pannonian Basin and the
Florina-Ptolemais-Aminteo graben system. In addition, Mesozoic and
Palaeozoic basins subject to Cenozoic tectonism such as the Triassic to
Jurassic Southeast Basin of France (see below) and sub-basins within the
Southern Permian Basin in Saxo-Thuringia, Germany (see below) can
also host CO2 accumulations.
The natural CO2 accumulations in the Pannonian basin and the small gas
pools in the Southeast Basin may be considered the closest analogues to a
storage site in the Western Europe, since CO2 has been trapped here for
geological timescales. Many other known CO2 accumulations are associated
with volcanic regions and as such are not directly analogous to a storage site.
However, they do provide opportunities to study near-surface leakage
processes and the potential impacts on ecosystems on a scale not easily
replicated experimentally.
Figure 1. The locations of some natural CO2 occurrences in Europe and sites studied during
the Nascent project.
4. INTERACTIONS IN RESERVOIRS
Understanding the long-term effects of CO2 on a reservoir is important
for several reasons. In certain circumstances, CO2 may dissolve in the
reservoir pore water and react with minerals within the reservoir, which
could ultimately lead to long-term trapping through precipitation of
134 Pearce
carbonate minerals. Our ability to model the geochemical and
geomechanical processes that occur in the reservoir, that could ultimately
influence its long-term storage performance, can be tested by modelling
natural analogues of geological storage. Czernichowski et al. have discussed
this in more detail (this volume). In addition, how CO2 might migrate from
the initial storage reservoir through fractures, and information about
processes that could occur in fractures in limestones, has been obtained in
this study.
Montmiral is one of several small CO2 gas accumulations in the
Southeast Basin of France but it is the only one currently being exploited.
CO2 is currently produced via a single production well as an industrial gas.
In order to determine the CO2-water-rock interactions within the reservoir, it
was necessary to reconstitute the original brine composition, which has been
evolving to increasing salinity during the lifetime of the CO2 production.
This temporal variability is due to changes in the respective volumes of
discharged brine and CO2-H2O gas mixture (Pauwels et al., 2004). The brine
composition indicates that the CO2-water-rock system is not at equilibrium.
Diagenetic studies suggest that the introduction of CO2 into this
particular reservoir caused dissolution of feldspar, and a slight increase in
reservoir porosity. The observed increase in porosity indicated an open
system, i.e. the reservoir has been flushed with fresh CO2-charged waters
(Gaus et al., 2004). Even after contact times of at least hundreds of
thousands of years, feldspars are still present. This illustrates that reaction
kinetics can be much slower than expected, based on short term kinetic data
derived from the literature. Reservoir temperature is an important parameter
when assessing the storage capacity of a reservoir, with reaction rates
potentially increasing by orders of magnitude where high temperatures
prevail. However, to accurately constrain the kinetic rates of the
geochemical reactions more detailed information on the reservoir evolution
is required. No evidence was found of extensive mineral trapping of CO2,
through precipitation of carbonates. Reconstruction of the brine composition
under reservoir conditions through geochemical modelling suggests that one
kg of brine contained 0.86 mol CO2 and 0.087 mol HCO3. For comparison,
the amount of dissolved CO2 at Sleipner is 1.14 mol/kg H2O (dependent on
the fugacity, and thus temperature and pressure, plus salinity of the water).
Therefore, a concentration of 0.86 mol/kg H2O means, for an average
porosity of 8%, that 3.44 g CO2 will be dissolved in the pore waters of a
volume per dm3 rock. The total mass stored depends entirely on the volume
of the reservoir. There is insufficient information on the Montmiral
reservoir to estimate the volume saturated with CO2.

What Can We Learn from Natural Analogues? 135
5. LEAKAGE THROUGH CAPROCKS –
PROCESSES AND IMPLICATIONS
The caprock or caprocks form the barriers that will prevent CO2 from
migrating out of the reservoir rock. Therefore understanding the sealing
capacity of these low permeability rocks for CO2 specifically will be
necessary for site characterisation and estimating storage capacity. Capillary
breakthrough measurements with CO2 have been performed on initially
water-saturated caprock samples from natural CO2 sites (Hildenbrand, et al.,
2004). The capillary displacement pressure for CO2 is lower than that for
the other gases on caprocks of equal effective permeability, i.e. for a given
caprock permeability, the pressure at which CO2 enters the caprock is lower
than for nitrogen or methane. Considering the strong variability of
permeability and capillary breakthrough values in natural caprocks, this
effect, although discernible, is not expected to result in a substantially
increased risk of capillary leakage when storing CO2 in depleted methane- or
nitrogen-dominated natural gas reservoirs.
Although diffusive loss of CO2 through caprocks is considered
negligible, the rate of potential geochemical “corrosion” of caprocks is
determined by diffusion. Laboratory experiments have provided some basic
information on the diffusion coefficients of CO2 in seal rocks and have also
shown evidence of chemical interactions of the CO2 with the minerals
(Hildenbrand et al., 2004). The interrelation of diffusive transport and
chemical reaction of CO2 in naturally occurring shale, marlstone and
carbonate rocks requires further investigation.
Studies of fracture calcite mineralisation at Montmiral revealed that the
latest millimetre-thick calcite generation formed in a CO2-rich fluid,
providing evidence of CO2 migration above the reservoir. It is not clear how
far through the overlying rocks the CO2 has migrated. The CO2-rich fluid
also contained hydrocarbons that could have been mobilised in a similar
manner to that employed during enhanced oil recovery. Geochemical
modelling indicates that pressure decreases alone are insufficient to cause
calcite precipitation and that a decrease in temperature is also required. The
amounts of calcite precipitated however, are very small.
Continuous monitoring over deep-seated fault systems, basalt intrusions,
gaps in the overlying cap rock (salt beds) and near former production wells
of a natural CO2 accumulation, in the Vorderrhön area, Germany, showed no
evidence for a leak (Teschner et al., 2004). This may be because leaks, if
they exist at all, release only small quantities of CO2, which have to
penetrate several aquifers where CO2 will be naturally attenuated. The
quantities of biogenic CO2 recorded, which were produced in the shallow
subsurface during the summer growing period, are much larger.

136 Pearce
6. MIGRATION IN THE SHALLOW SUBSURFACE
The shallow subsurface may be the last barrier before CO2 escape to the
atmosphere. A detailed understanding of gas migration in this environment
is therefore important to assess risk to human health and the environment.
Detailed soil gas and gas flux surveys, conducted in and around gas vents
in several locations in central Italy, demonstrated how gas leaks occur over
very small areas, on the order of a couple of metres, but that elevated CO2
concentrations occur as a large halo around the actual vent, due to lateral
migration in the unsaturated zone. This work is discussed in more detail by
Lombardi et al. (this volume).
Accumulations of shallow gas (mainly composed of methane) are known
to occur in various parts of the North Sea and their study can provide a better
understanding of gas migration in the shallow subsurface (Schroot et al.,
2005).
7. ASSESSING THE POTENTIAL IMPACTS OF A
LEAK
To be able to evaluate site performance, some performance criteria will
be needed, which will require a clear understanding of the potential impacts
of a leak, in order to best inform policy makers and the public at large.
The San Vittorino Plain to the north of Rome, Italy, is a thinly populated
area which has seen two major effects caused by the high-volume leakage of
CO2: modified groundwater chemistry and sinkhole formation. A clear
correlation exists between high concentrations of CO2, anomalous
groundwater chemistry and the location of sinkholes. Modified groundwater
chemistry resulted in a 5 to 10 times increase in most major and trace
elements in surface springs, wells and water-filled sinkholes in the vicinity
of a number of known fault structures. It is believed that acidic gases have
risen along high-permeability pathways in the faults, causing the dissolution
of carbonate and possibly silicate minerals. In spite of the increased ionic
content of these altered ground waters a comparison with drinking water
standards indicate that they are still considered safe for human consumption.
Closely linked to the formation of the anomalous waters at San Vittorino
is the creation of various sub-circular collapse structures, many of which are
now filled with water. These features, which pose a hazard for local
infrastructure, were likely formed by acidic dissolution and the removal of
fine-grained material by flowing ground water, followed by collapse due to
low to moderate strength earthquakes. As such, the formation of such
features will be highly dependent on the chemical composition of the local

What Can We Learn from Natural Analogues? 137
geology and the groundwater flow rates. A geochemical monitoring station
was developed to monitor possible future collapse events. This monitoring
station continually measures the concentration of CO2 and H2S dissolved in
ground water, processes the data and then sends it via modem to a remote
laboratory. The development and application of this technology has shown
that such stations would be effective in monitoring dissolved gas
concentrations and relatively inexpensive to construct and operate. The
same system could be easily modified to monitor soil gas concentrations and
installed above a CO2 storage site (e.g. near an abandoned well) as an early
warning system.
Ciampino is a rapidly growing city, close to Rome, which is constructed
on the flanks of an extinct volcanic complex. Due to anomalously high heat
flow and the occurrence of faults, significant quantities of CO2 are released
to the atmosphere at numerous points throughout the community. Concern
has been expressed regarding the safety of the local population, as a sudden
CO2 release once killed 30 cows pastured in the city limits. Soil gas surveys
and a limited number of gas flux measurements were conducted throughout
the area in an effort to delineate areas of high risk. The soil gas surveys
indicated areas with CO2 concentrations in excess of 70%, along with
associated high values of Rn. Despite the fact that a number of new housing
developments had been built above these anomalous areas, a small pilot-
scale study of indoor gas concentrations yielded CO2 values that were
typically less than 1%. These relatively low values are likely due to the
Italian habit of leaving their windows open to allow for an exchange of air.
Although risks exist in the Ciampino area, much is being done to minimise
any danger to the local inhabitants, including the use of soil gas surveys to
develop zoning bylaws and to identify pre-existing residential areas which
may be at risk. Education programmes are also underway to explain to the
local inhabitants what simple things they can do to greatly lower any risk.
The level of risk to human health related to CO2 leaking from natural
analogues is dependent on many factors that control the generation,
migration and accumulation at dangerous levels of this gas. Work conducted
partially within the Nascent project on the Latera site has attempted to
examine some of the geological phenomena which influence gas emanation
hazards, such as the occurrence of faults and the depth to source, using
geostatistical analysis and GIS techniques. In addition, soil gas data should
allow the generated risk model to be calibrated against the measured gas
distribution. It is expected that the method developed during this study
could be applied for site assessment of locations being considered for CO2
storage.
A detailed hydrogeochemical survey of groundwaters was performed
across the whole Florina Basin to determine if any changes in water
138 Pearce
chemistry could be observed in areas containing high CO2 concentrations.
The waters close to the CO2 field have increased Ca, Mg, CO3 contents and
high total hardness. The remaining water samples show a good quality with
some increased content of some elements in a few of those samples.
REFERENCES
Baines, S.J., and Worden, R.H., 2001, Geological CO2 disposal: understanding the long term
fate of CO2 in naturally occurring accumulations, Proceedings of: The Fifth Greenhouse
Gas Control Technologies Conference (GHGT5), 311-315, CSIRO, Collingwood.
Chadwick, A., Arts, R., Eiken, O., Williamson, P., and Williams, G., 2005, Geophysical
monitoring of the CO2 plume at Sleipner, North Sea: An outline review, this volume.
Czernichowski-Lauriol, I., Rochelle, C., Gaus, I., Azaroual1, M., Pearce, P., and Durst, P.,
2005, Geochemical interactions between CO2, pore-waters and reservoir rocks: Lessons
Gaus I., Le Guern C., Serra H., 2004. Natural analogues for the storage of CO2 in the
geological environment (NASCENT). WP4: Modelling of CO2/fluid/rock interactions.
BRGM/RP-52934-FR.
Hildenbrand, A., Schlomer, S., Krooss, B.M., Littke, R., 2004, Gas breakthrough experiments
on pelitic rocks: comparative study with N2, CO2 and CH4, Geofluids, 4(1):61-80.
Lombardi, S., Annunziatellis, A., Beaubien, S.E., Ciotoli, G., 2005, Near-surface gas
geochemistry techniques to assess and monitor CO2 geological sequestration sites: The use
Pauwels, H., Le Nindre, Y.M., Petelet-Giraud, E., Girard, J.P., Czernichowski-Lauriol, I.,
Gaus, I., Pearce, J.M., Shepherd, T.J., Kemp, S.J., and Bouch, J.E., 2004, Montmiral and
Carbogaseous Province of France. In: Natural analogues for the storage of CO2 in the
geological environment: report on field characterisation including soil gas surveys,
characterisation of offshore shallow gas seeps, hydrogeochemistry and diagenetic studies.
J.M. Pearce, ed., British Geological Survey Technical Report, pp. 338.
Pearce, J.M., Holloway, S., Rochelle, C. A., Bateman, K., Wacker, H., Nelis, M., Studlick, J.,
and Shew, R., 1996, Natural occurrences as analogues for the geological disposal of
carbon dioxide. Energy Conversion and Management, 37(6-8):1123-1128.
Pearce, J.M. (ed.), 2004a, Natural analogues for the geological storage of CO2. Final report of
the Nascent project. British Geological Survey Technical Report. 122 pages.
Pearce, J.M., Czernichowski-Lauriol, I., Lombardi, S., Brune, S., Nador, A., Baker, J.,
Pauwels, H., Hatziyannis, G., Beaubien, S.E., and Faber, E. 2004b, A review of natural
CO2 accumulations in Europe as analogues for geological sequestration. In: Geological
Storage of Carbon Dioxide, S. Baines, and R.H. Worden (eds). Geological Society,
London, Special Publication, 233, 29-42.
Schroot, B.M., Klaver, G.T., and Schüttenhelm R.T.E., 2005, Surface and subsurface
expressions of gas seepage to the seabed—examples from the Southern North Sea,
Shipton, Z. K., Evans, J.P., Dockrill, B., Heath, J.M., Williams, A., Kirchner, D., and Kolesar,
P.T., 2005, Natural leaking CO2-charged systems as analogs for failed geologic storage
reservoirs. 695-708. In: Thomas, D.C. and Benson, S.M., Carbon Dioxide Capture for
Storage in Deep Geologic Formations, Volume 2, 699-712.
learned from laboratory experiments, field studies and computer simulations, this volume.
of natural analogue sites in Italy as field laboratories, this volume.
Marine and Petroleum Geology, 22(4):499-515.

What Can We Learn from Natural Analogues? 139
Stevens, S.H. and Tye, S., 2004, Isotopic analysis of natural CO2 fields: How long has nature
stored CO2? GHGT-7: Seventh International Conference on Greenhouse Gas Control
Technologies, Vancouver, B.C., Canada, 5-9 September 2004.
Stenhouse, M.J. Zhou, W., and Arthur R., 2005, Assessment of the long-term fate of CO2
injected into the Weyburn Field: System-level modeling of CO2 migration and potential
Teschner, M., Brune, S., Faber., E. and Poggenburg, J., 2004, Automatic gas-geochemical
monitoring stations in the Vorderrhon region, Thuringia, Germany. In: CO2 Leakage
mechanisms and migration in the ear-surface. S.J. Kemp, ed., Final report, WP3, Nascent
project, British Geological Survey Commissioned report CR/03/196, 65 pages.
impacts, this volume.
NEAR-SURFACE GAS GEOCHEMISTRY
TECHNIQUES TO ASSESS AND MONITOR CO2
GEOLOGICAL SEQUESTRATION SITES
S. Lombardi, A. Annunziatellis, S.E. Beaubien and G. Ciotoli
Dipartimento di Scienze della Terra, Università di Roma “La Sapienza”, Piazzale Aldo Moro,
5, 00185 Roma, Italy
Abstract: As is well known the long-term effects and stability of a man-made CO2
geological storage facility is very difficult to predict with laboratory or
modeling experiments due to the size and long time scales involved. Instead
attractive additional sources of information are natural sites where CO2
produced at great depths is either trapped in porous reservoirs or leaks to the
surface. These sites can be considered as “natural analogues” of what may
occur over geological time spans within an engineered CO2 geological storage
site. The study of these sites can be subdivided into three broad fields: i)
understanding why some reservoirs leak while others don’t; ii) understanding
the possible effects of CO2 should it leak into the near-surface environment;
and iii) using the leaking sites to develop, test and optimise various monitoring
technologies. The present article summaries many of the near-surface gas
geochemistry results obtained in central Italy during the EC-funded
NASCENT project (Natural Analogues for the Storage of CO2 in the
Geological Environment). These include a comparison of leaking (Latera) and
a non-leaking (Sesta) CO2 reservoirs, detailed soil gas surveys to outline
migration pathways, the development of a geochemical continuous-monitoring
station to study temporal changes in CO2 concentrations, and field experiments
involving the injection of a gas mixture in the shallow subsurface to outline
migration pathways and to understand the behaviour of various gas species
based on their different chemical-physical-biological characteristics. Put
together this data provides useful information for site selection, risk
assessment and monitoring techniques, which is needed if CO2 geological
storage is to become an accepted and widely-applied technology.
Key words: soil gas surveys, geochemical monitoring stations, injection tests, leaking –
non-leaking natural CO2 reservoirs
141
S. Lombardi et al. (eds.),
Advances in the Geological Storage of Carbon Dioxide, 141–156.
© 2006 Springer. Printed in the Netherlands.
The use of natural analogue sites in Italy as field laboratories

142 Lombardi, Annunziatellis, Beaubien and Ciotoli
1. INTRODUCTION
The geological storage of anthropogenic CO2 has long been considered
one of the safest and most technologically feasible methods for the short-
term reduction of atmospheric loading of this greenhouse gas. In fact,
geological sequestration has the potential to provide mankind with a finite
period of time in which to change its energy strategy (through improved
efficiency of energy production, transfer and use, energy conservation
measures and the eventual move from fossil fuels to renewable sources of
energy) while at the same time attaining immediate CO2 reductions
However in order to convince legislators, environmental groups, industry
and the public at large that this is the proper path to follow, the method must
be shown to be safe and effective over geologically significant periods of
time. Traditionally laboratory and modeling experiments have been
performed to try and predict the possible fate of various engineered systems,
however both approaches suffer from limitations related to scaling up their
results to large natural systems over thousands to millions of years. Another
approach which can address these difficulties are natural analogues, in other
words natural sites where the studied phenomenon has already been
occurring over extremely long periods of time. In the case of CO2
geological storage sites there are numerous locations world-wide where CO2
is (or has been) produced at depth, with the resulting gas either being trapped
in deep reservoirs (analogous to hydrocarbon reservoirs) or is leaking to
surface along preferential migration pathways like faults or fractures.
Work performed during the EC-funded NASCENT project (Natural
Analogues for the Storage of CO2 in the Geological Environment) addressed
this issue through the study of a number of natural CO2 sites in Europe
(Pearce, 2004). These sites were used as natural laboratories, with the
analysis of water, rock and gas samples with various geochemical,
geophysical and modeling approaches. The resulting database and
associated studies are a unique tool for the better understanding of the
various physical and chemical processes involved, as well as for the
development of new tools for site assessment and monitoring of any
eventual CO2 geological storage site.
The present article summarises some of results obtained during
NASCENT on three natural analogue sites in central Italy, focusing on near-
surface gas geochemistry as a tool to understand the micro and macro scale
migration of gas, the possible effects of CO2 leakage on the shallow
environment, and the development of tools and instruments for site selection
and/or subsequent monitoring. The three site include Sesta, a non-leaking
site, and Latera and San Vittorino, two leaking sites. Work involved soil gas

Near-Surface Gas Geochemistry for CO2 Geological Sequestration 143
and gas flux surveys, as well as an injection test and the development of a
geochemical continuous-monitoring station.
2. METHODS
2.1 Soil gas
The probe used to collect soil gas samples consists of a modified ¼ inch,
thick-walled, stainless-steel tube. The bottom end of the tube is closed with
a sharp drive point, while small lateral holes are drilled along the first 5cm
of this end to act as sampling ports. The other end is left open so that a
septum can be attached, while two steel cylinders are welded on the outside
wall to act as pounding surfaces when installing and removing the probe
with a co-axial hammer. The probes were generally placed at a depth of 50
to 90 cm in order to avoid any atmospheric input. Once the probe was in
place a septum holder was attached to the open end of the tube, and a needle
and 60ml plastic syringe were used to draw off gas. The first two 60ml
volumes were discarded to clean the system, and then a 60ml sample was
drawn for field analysis of radon while a second was placed in a previously
evacuated, 25ml volume, stainless-steel canister for subsequent laboratory
analyses.
All soil gas samples were analysed in the field for Rn222
using a Scintrex
EDA200 alpha scintillometer. All soil gas samples were also analysed for
hydrocarbon species (C1-C4), sulphur species (COS and SO2) and
permanent gases (N2, O2 and CO2) using two Fissons 8000-series bench gas
chromatographs. All samples were also analysed for helium using a Varian
Portatest leak detector (model 938-41); helium concentrations are expressed
as He (i.e. He = Hesample – Heatmosphere).
2.2 Gas Flux
Gas flux measurements were conducted using the chamber technique,
whereby the open end of a container was placed on the soil surface and
measurements of CO2 concentrations were made every second via a
connected infra-red analyser. The non-destructive analyser was connected to
the chamber via an inlet and an outlet tube such that air was recycled
through the chamber via a pump in the instrument, thereby guaranteeing a
constant internal pressure during the measurement. In the present study a 13
x 13 x 9 cm Plexiglas chamber was used along with a Draeger Multiwarn
infrared analyser equipped with CO2 (0-25%), H2 (0-1000ppm) and H2S (0-
144 Lombardi, Annunziatellis, Beaubien and Ciotoli
100ppm) sensors. Measurements were conducted for no more than 75
seconds in order to ensure that the natural flux rate from the soil was not
affected. Data was then transferred to a PC and the flux rate was calculated
using the following formula from Hutchinson and Livingston (1993)
f = (Cfinal – Cinitial) V/ t A
Where f is the flux in m3
m-2
s-1
, V is the volume of the chamber (m3), A
is the surface area measured (m2) and t is the time difference (sec) between
the first and last measurements of the CO2 concentrations (ml/ml). Values
were then converted into kg m-2
d-1
.
3. LEAKING VS NON-LEAKING CO2 RESERVOIRS
Due to the fact that the Italian peninsula is still tectonically and
volcanically active there are numerous sites where CO2 produced naturally at
depth either becomes trapped in permeable but isolated strata or migrates to
surface via faults and is released to the atmosphere. Recent work on leaking
(Latera) and sealed (Sesta) sites in central Italy with near-surface
geochemical techniques have attempted to explain such different behaviours,
despite the fact that both occur in faulted, geothermal areas. Clearly
understanding these two types of systems will be highly useful for predicting
the safety and long-term isolation of man-made CO2 geological
sequestration sites.
3.1 Latera
The Latera geothermal field is located in the west-central part of the
Italian peninsula within the Latera caldera. Although studied since the early
1970s for geothermal energy, the area was well known long before that for
carbonate rich springs and CO2-rich gas vents which inferred the occurrence
of CO2 production / reservoirs at depth. The great age of these gas
reservoirs (more than 0.1 Ma old) and the fact that local inhabitants have
lived for thousands of years above these reservoirs and associated gas vents
means that the Latera site is an excellent natural analogue of what might
happen at surface in the unlikely event of leakage from an engineered
geological storage site for anthropogenic CO2.
Locally the geology consists of a metamorphic basement, “Tuscan”
limestones, “Ligurian” flysch, volcanic units and post-orogenic sediments.
Formation of the local geothermal reservoir was likely due to the
combination of compressional tectonics during the Eocene to Miocene

Near-Surface Gas Geochemistry for CO2 Geological Sequestration 145
(which formed the subsurface structural high within the host Tuscan
limestones - Bertrami et al., 1984; Barberi et al., 1984) and subsequent
volcanic activity and tensional tectonics (which supplied the necessary fluids
and high heat flow for the thermo-metamorphic formation of CO2 - Duchi et
al., 1992). Finally the collapse structures associated with the various stages
of local volcanism have either remained open for fluid flow (resulting in
springs or gas vents on surface) or have become sealed by fault gouge or
secondary mineral precipitation (thereby isolating entire blocks and creating
heat/water convection cells).
Extensive work has been performed on the Latera test site by the authors
during the NASCENT project, including regional, detailed and highly
detailed soil gas surveys, detailed gas flux measurements, electrical
tomography surveys, gas vent characterization and aqueous geochemistry.
This research has been conducted to outline major gas migration pathways
and to quantify the amount of gas reaching the atmosphere. Only some of
the gas geochemistry data will be discussed here; the interested reader is
referred to the final reports of the project itself (Pearce, 2004) for a more
extensive treatment of the data.
Figure 1. Soil gas CO2 concentration distribution obtained during a regional geochemical
survey in the Latera area. The two small squares in the central portion of the map indicate the
location of the two detailed soil gas surveys.

146 Lombardi, Annunziatellis, Beaubien and Ciotoli
A preliminary, regional soil-gas survey was conducted in the western
sector of the Latera caldera with the goal of locating the fault systems which
dissect the collapsed area and form the main route of gas migration towards
the surface. Sampling was performed in an area of about 65 km2 using a
uniform distribution of about 2 samples/km2 for a total of 110 samples. The
CO2 contour map shows the spatial distribution of this gas species (Fig. 1).
The major anomalies occur in the central and south-western parts of the
Latera caldera, in good correspondence with mapped structural elements
shown in the figure. Previous geophysical investigations in these areas
highlighted a series of NW-SE and NE-SW oriented discontinuities which
offset the carbonate substratum and formed the structural high hosting the
geothermal reservoir. Elevated values are likely due to gas migration along
these geochemically active faults, which result in the clearly anisotropic CO2
anomalies. This migration of deep (magmatic) gases is also indicated by the
presence of He and Rn anomalies in the same area (not shown).
Two subsequent detailed surveys (locations shown in Figure 1) were
conducted in areas which exhibited elevated soil gas CO2 concentrations
during the regional survey. As samples were concentrated around gas vents
the observed concentrations are significantly higher than those measured in
the regional survey. For example during the first detailed survey, CO2
concentrations of up to 97% and CH4 values of over 1000 ppm were
measured. Radon values (up to 480 Bq/l) also exceeded the amount expected
if this radioactive gas were only produced in situ via the decay of 226
Ra in
the local shallow volcanic rocks. Contour maps of these gas species (not
shown) highlight two clear circular anomalous zones, one next to a straight
creek segment with gas bubbling at its base (fault?) and the other near a
geothermal exploration well. Both of these circular anomalies correspond to
vent structures that leak significant quantities of CO2 to the atmosphere. In
contrast the second detailed survey, conducted about 1km north of the first
in an area defined by electrical tomography anomalies, had slightly lower
mean CO2, CH4 and Rn values but higher He values (Table 1). Contour
maps of CO2 and He (not shown) give a similar distribution of spotty
anomalies aligned parallel to the known NE-SW tectonic elements, with the
major anomalies occurring in the area of significant gas vents.
Table 1. Minimum, maximum and mean values for four gas species analysed during the two
CO2 CH4 Rn He
Min Max Mean Min Max Mean Min Max Mean Min Max Mean
DS1 0.05 97.3 9.1 0.26 1076 57.6 12.7 480 127 -540 310 -88
DS2 0.04 97.2 3.1 n.d. 1120 12.0 14.6 313 109 -913 2943 -105
detailed soil gas surveys (DS1 and DS2).

Near-Surface Gas Geochemistry for CO2 Geological Sequestration 147
Finally detailed soil gas profiles were conducted across a known gas vent
occurring in the area of the second detailed profile to outline relative gas
distributions and the size and form of the vent. In this work samples were
collected about every 1 m and analysed for a series of different gas species,
both in the field and in the laboratory.
0
20
40
60
80
100
CO
2 (
%)
0
1000
2000
3000
4000
5000
He
(p
pb
)
CO2
He
0 50 100 150 200 250
Distance (m)
0
400
800
1200
1600
CH
4 (
pp
m)
H2S
CH4
0
200
400
600
800
H2S
(p
pm
)
Figure 2. Soil gas concentrations of various species, measured along a profile crossing
Figure 2 shows the results for four of these gas types, CO2, He, H2S and
CH4. As can clearly be seen in this figure the survey crossed a number of
gas vents, however the distribution of the various species is not consistent
from one vent to another. For example CO2 and He are the two gases with
the most significant number of anomalies, with both showing a similar
spatial and relative concentration distribution. In contrast H2S and CH4 are
much more spatially restricted, with H2S showing elevated values in the vent
located around 25m while CH4 is more concentrated in the one at 200m.
The different relative distribution of CO2 / He versus H2S / CH4 can be
explained in terms of gas abundance and reactivity. For example He is a
highly mobile and non-reactive molecule, and thus it is logical that it shows
a large number of wide peaks along the entire profile. CO2, on the other
hand, which shows essentially the same distribution, is far more reactive due
to its high solubility in water and its involvement in acid-base reactions. The
similarity of the reactive CO2 and the conservative He implies that the high
CO2 flux / concentration (>90%) supplies an excess mass of CO2 at a rate
which is greater than that of dissolution and eventual reaction. In contrast
the relatively low concentrations and reactive nature (be it chemical or
numerous gas vents in the Latera area.
148 Lombardi, Annunziatellis, Beaubien and Ciotoli
microbiological) of both H2S and CH4 has resulted in the consumption of
these gases in the unsaturated zone. Only in the centre of vents, which have
sufficiently high flux rates, is it possible for these species to migrate closer
to the soil-atmosphere interface, as is observed in the two vents at 25 and
200m.
3.2 Sesta
The Sesta study site is located approximately 260 km to the NW of Rome
and about 130 north of the Latera site (described above). In contrast to the
Latera caldera, where there is extensive evidence of CO2 leakage at surface,
there are no such manifestations at the Sesta site. Instead the existence of a
CO2 rich gas reservoir at depth was only discovered during deep drilling
undertaken for geothermal resource exploration. In terms of CO2 geological
storage it would thus be important to understand the difference between the
two sites; in other words why does the Latera reservoir leak whereas the one
at Sesta appear to have been sealed for hundreds of thousands of years?
The general area surrounding Sesta is of great interest as a geothermal
resource, as it is characterized by one of the highest heat flux rates in Italy.
The actual study site occurs within a NNW-SSE trending graben containing
a Pliocene clay cover which overlies part of the geothermal field, just to the
east of the Larderello geothermal field. Both the eastern and western sectors
of the graben are characterized by metamorphic lithologies which are
bounded by NNW-SSE and SSW-NNE normal faults. Although delimited by
these boundary faults, no active faults and/or fracture systems are observed
within the valley. The CO2 gas cap is hosted within tectonic wedges and
confined by a flysch nappe.
Work at Sesta included the same types of gas geochemical surveys which
were applied at Latera in an effort to understand if the Sesta site is truly
sealed or if it exhibits microseepage from the gas reservoir. Extensive
outcrop on the boundaries of the area limited soil gas sampling to the centre
of the valley where there was sufficient sedimentary cover; measurements of
gas flux were conducted in areas where soil gas samples could not be taken.
A regional soil-gas survey (about 15 samples/km2) was conducted in the
study area, with the main statistical results given in Table 2. The studied
gases generally show a uniform distribution and low concentrations which
are comparable with other similar Italian basins, although the high CH4
standard deviation and the strong difference between mean and median for
CO2 and CH4 highlight the “spot” distribution of some anomalies in the data
set. Most of these isolated anomalies, however, can be explained by near
surface processes. For example the highest CO2 and methane values (11%
and 890 ppm, respectively) were measured close to a garbage dump and thus

Near-Surface Gas Geochemistry for CO2 Geological Sequestration 149
are most likely linked to shallow biological degradation of organic matter.
Furthermore, the spatial soil gas distribution of the various species does not
exhibit any clear structural alignment. This supports the idea that there are
no preferential migration pathways, such as faults or fracture networks, in
the centre of the valley. Radon, a commonly used fault tracer (e.g. Ciotoli et
al., 1998; Ciotoli et al., 1999), has a background value of about 5 Bq/L,
which is less than the calculated mean value for Italy (about 20 Bq/L) based
on an unpublished database of 15,000 samples constructed by the authors.
The most elevated values were observed on the eastern side of valley and are
probably linked to the normal bordering graben faults. Finally helium values
are almost always less than 200 ppb, with only two significant anomalies (up
to 7000 ppb) along the extreme sectors of the valley, again close to the
bordering faults.
Table 2. Statistics of some gas species analysed during soil gas surveys at the Sesta study site.
CH4 CO2 O2 N2 Rn He
samples 250 250 250 250 250 250
mean 7.71 0.68 21.18 78.12 5.01 -548.22
median 2.39 0.35 21.39 78.13 2.77 -455.7
min n.d. 0.04 9.95 57.46 0.37 -2088
max 888.3 11.01 23.36 83.68 58.09 6823.74
quart. inf. 2.07 0.2 20.87 77.06 1.85 -1059.7
quart. sup. 2.82 0.79 21.76 79.21 6.1 -64.44
variance 3427.4 1.35 1.4 4.46 58.85 584893
std. dev. 58.54 1.16 1.18 2.11 7.04 764.78
Gas flux measurements were performed in order to complete the
investigation in the areas where outcropping lithological units did not allow
for the collection of soil gas samples, as well as to better evaluate the
sequestration capacity of the flysch nappe which overlays the CO2 gas cap.
Table 3 compares the main statistical parameters of flux data from various
Italian sites (including both Sesta and Latera) located in different geological
settings. Although the limited number of measurements at each site does not
allow for a true statistical comparison, as expected the volcanic areas (like
Latera) have far higher flux rates compared to the sedimentary basins (like
Sesta), both because of deep gas production via thermo-metamorphism and
the occurrence of permeable fault structures. A good example of this can be
seen by comparing the Sesta and Siena data, as the basin-wide averages are
very similar, whereas the detailed flux survey values above the Siena
Rapolano fault are two orders of magnitude higher (similar to the Latera and
Ciampino values). These results highlight the low permeability of the flysch
and sediments overlying the gas cap at Sesta and indicate that the site has
efficiently sequestered the CO2 at depth despite the occurrence of normal
faults bordering the graben.

150 Lombardi, Annunziatellis, Beaubien and Ciotoli
Table 3. Statistical comparison of gas flux rates from different sites located in different
geological settings throughout Italy.
Geological setting Site count minimum maximum median
Sed. basins Sesta 25 6.0 x 10⁻⁹
7.9 x 10⁻⁸
2.7 x 10⁻⁸
Siena basin 12 n.d. 5.4 x 10⁻⁸
1.1 x 10⁻⁸
Siena Rapolano fault 11 1.0 x 10⁻⁸
1.8 x 10⁻⁵
2.6 x 10⁻⁶
Volcanic areas Latera 25 7.0 x 10⁻⁸
2.0 x 10⁻⁵
9.0 x 10⁻⁶
Ciampino 5 1.8 x 10⁻⁷
1.3 x 10⁻⁵
3.4 x 10⁻⁶
Tectonic basins S. Vittorino 8 5.3 x 10⁻⁷
5.7 x 10⁻⁵
2.1 x 10⁻⁵
Fucino 15 3.0 x 10⁻⁹
9.7 x 10⁻⁸
2.4 x 10⁻⁸
4. INJECTION TEST
An injection test was performed within the NASCENT project which
consisted of the injection of a gas mixture into a fault structure and the
subsequent monitoring of soil gas and groundwater chemistry in order to
outline permeable pathways and flow rates in the subsurface. Such types of
gas injection tests have been used by various researchers to better understand
the dynamics of gas migration in the shallow environment (Ciotoli et al., in
submission; Gascoyne and Wuschke, 1997; Lineham et al., 1996).
The gas injection test was conducted within the area of the Latera study
site, at a location which has numerous gas vents and which, based on
geophysical surveys and the alignment of the vents, has a fault crossing the
site at depth. During this experiment a total of 8000 L of gas (40% Ar, 40%
He and 20% CO2) was injected into a faulted interval between 9 and 12 m
below ground surface. Soil gas samples were collected at regular intervals
around the injection borehole from a grid of fixed sample points (64) and
analysed both in the field and the laboratory for the injected gas species.
Ground water samples were also collected from 6 peizometers drilled to 5m
depth into the shallow aquifer in order to monitor for breakthrough of the
highly soluble CO2 in the dissolved phase.
Results from the gas injection test highlight the importance of
understanding the chemical and physical characteristics of the gases being
monitored, as aqueous solubility, gas density and both water- and gas-phase
diffusivities play a critical role in the travel times and mass attenuation
features of migrating gases. The gas mixture injected at the Latera test site
consisted of three rather different species, ranging from the highly insoluble,
highly mobile low density helium to the very soluble, reactive and dense gas
carbon dioxide, while argon has characteristics which lie between these two
extremes. These differences are mirrored in the results obtained during the

Near-Surface Gas Geochemistry for CO2 Geological Sequestration 151
test, with helium arriving very early at surface within a very small area
around the injection well and at high concentrations. In contrast CO2 arrived
much later, had a more diffuse distribution and was observed at much lower
relative concentrations than those seen for He. In addition injected helium
returned to background values within a very brief period of time, on the
order of weeks, whereas the injected CO2 appears to continue to slowly seep
from the system even a month after the experiment had ceased.
A mechanism to explain these results is proposed whereby at early times
the more soluble gases are stripped from the gas bubbles, enriching them in
helium, and that this gas phase, upon reaching the water table, migrates
rapidly through the unsaturated zone to surface due to its low density and
high diffusivity. In contrast at later times the groundwater in the bubble
flow path becomes progressively more saturated in CO2, resulting in less
transfer to the dissolved phase and more of this gas reaching the water table.
Once in the unsaturated zone the more dense CO2 moves laterally on top of
the water table, resulting in the observed lateral dispersion, temporal
attenuation and lower concentrations (due to both dilution by soil gas and
removal into the aqueous phase) observed in the soil gas surveys. Lateral
migration of CO2 saturated groundwater, and eventual release of this gas to
the unsaturated zone via vent activity is another possible mechanism,
however this can only explain anomalies observed down gradient from the
injection point. In any case, dissolved gas results confirm the importance of
CO2 mass transfer into the aqueous phase, as measured concentrations of
dissolved CO2 in observation piezometers increased by 2 to 3 times
background levels in wells located down-gradient from the injection well
5. MONITORING STATION
One way to allay public concern regarding CO2 storage safety is to
develop early warning systems which can monitor gas compositions and
concentrations in the near-surface environment. Increased concentrations of
CO2 or other associated gases in these phases, above natural biogenic
variations, would then trigger a warning. One such station has recently been
developed and deployed in the San Vittorino area of central Italy. Although
the monitoring station (jointly funded by the EC NASCENT project and the
Civil Protection Agency - Region of Lazio) was originally deployed to
monitor for dissolved gas precursors related to CO2-induced sinkhole
formation, it could easily be deployed to monitor soil gas above a CO2
sequestration site (for example above abandoned wells).
The San Vittorino plain is a triangular-shaped intramontane basin filled
with fluvial-lacustrine sediments and local travertine deposits, and is

152 Lombardi, Annunziatellis, Beaubien and Ciotoli
surrounded by mountains formed by carbonate and siliciclastic successions
thrusted onto various bedrock lithologies (Centamore and Nisio, 2003). The
plain is bordered by normal and/or strike-slip faults and is also cross-cut by
other regionally important features. The fault segments that cross the plain
are not easy to identify due to the plastic nature of the filling sediments,
however evidence of their existence is given by the occurrence of flowing
springs, mineralised waters, gas bubbling vents and generally elevated soil
gas and gas flux values throughout the valley. It has been the interaction of
these deep acidic gases, like CO2 +/-H2S, with the spring and ground waters
which have resulted in the formation of more than 30 sinkholes in the central
and eastern sectors of the plain
The monitoring station uses gas permeable tubing to sample gases
dissolved in groundwater via diffusion. As the internal volume of the tube
represents a “head space”, equilibrium concentrations will be governed by
Henry’s Constant. The use of gas permeable tubing has been shown to be
effective for other gas species (e.g. Jacinthe and Groffman, 2001; Jacinthe
and Dick, 1996). The gas permeable tubing is placed in a piezometer
(installed above a microgravity minimum in the town of Vasche) and is
linked at surface with the monitoring station, which houses CO2, H2S and
H2 sensors, a continual power supply and an external data relay system. The
in-house developed software system is programmable to sample at different
intervals, however a sample time of once every 4 hours was chosen to allow
the sampling tube to re-equilibrate with the surrounding water. Recorded
data can be down-loaded from the laboratory via modem.
12/2
1/0
2
12/2
5/0
2
12/3
0/0
2
01/0
4/0
3
01/0
8/0
3
01/1
3/0
3
01/1
7/0
3
01/2
2/0
3
01/2
7/0
3
02/0
1/0
3
02/0
6/0
3
02/1
0/0
3
02/1
6/0
3
02/2
2/0
3
02/2
7/0
3
03/0
4/0
3
03/0
9/0
3
03/1
3/0
3
03/1
8/0
3
03/2
3/0
3
03/2
8/0
3
04/0
1/0
3
04/0
9/0
3
04/1
7/0
3
0
0.5
1
1.5
2
2.5
0.25
0.75
1.25
1.75
2.25
CO
2 (
%,
V/V
)
2.4
2.8
3.2
3.6
MA
GN
ITU
DE
Figure 3. Dissolved CO2 results from the monitoring station installed in Vasche (after
Annunziatellis et al., 2004). Dots indicate individual values while the running average is a
black line. The vertical bars are earthquakes near the station registered by the Istituto
Nazionale di Geofisica e Vulcanologia in Italy.

Near-Surface Gas Geochemistry for CO2 Geological Sequestration 153
The geochemical monitoring station began to collect data on December
20, 2002, and during the intervening period it has collected approximately 2
years worth of dissolved gas data. Some of the data collected during the
monitoring period is shown in Figure 3 (note that the values are not
dissolved gas concentrations but rather the concentration in the silicone
tubing which has equilibrated with the groundwater). The general decreasing
trend of the line chart also shows several sharp drops in the signal, which
could be linked to different environmental variables (such as water and
atmospheric temperatures affecting the sensors) or to the occurrence of
earthquakes. The first case cannot be verified because this prototype station
was not equipped with temperature sensors. The second hypothesis can be
studied by comparing the dissolved gas data with the occurrence of
earthquakes in an area surrounding the station site, as shown in the figure.
In particular there were about 4 magnitude-3 earthquakes in the region
during the monitoring period. The line chart shows abrupt decreases in
correspondence with earthquakes which occurred in the Reatini Mts, the
Sibillini Mts and at Gran Sasso Mt. There are, however, other CO2 decreases
which cannot be correlated with seismic events in the region and thus there
may be multiple processes which contribute to the signal.
6. SUMMARY AND CONCLUSIONS
The present work presents an overview of some results obtained by the
authors within the NASCENT project. This EC-funded project examined
various sites throughout Europe which can be considered as natural
analogues of anthropogenic geological CO2 storage, due to the
accumulation, or leakage at surface, of naturally-produced deep CO2. The
goals of this work can be subdivided into three broad fields: i) understanding
why some reservoirs leak while others don’t; ii) understanding the possible
effects of CO2 should it leak into the near-surface environment; and iii)
using the leaking sites to develop, test and optimise various monitoring
technologies.
In regards to the first point, the leaking natural analogue site at Latera
provides insight into both macro- and micro-scale gas migration
mechanisms, as well as spatial and temporal variations in gas behaviour.
This study suggests that: i) gas emanation along “gas bearing” faults is not
homogeneously distributed; ii) gas release to the atmosphere is highly
localised and spatially restricted; and iii) the near-surface spatial distribution
of different deep-origin gases depends on their mobility, reactivity and
solubility. In regards to the non-leaking Sesta site, both soil gas and flux
values highlight that the clayey cover (which is characterized by recent but
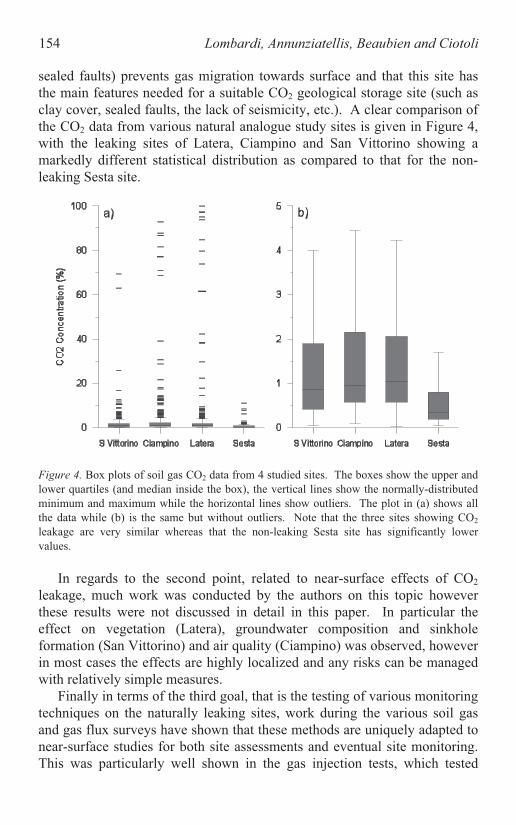
154 Lombardi, Annunziatellis, Beaubien and Ciotoli
sealed faults) prevents gas migration towards surface and that this site has
the main features needed for a suitable CO2 geological storage site (such as
clay cover, sealed faults, the lack of seismicity, etc.). A clear comparison of
the CO2 data from various natural analogue study sites is given in Figure 4,
with the leaking sites of Latera, Ciampino and San Vittorino showing a
markedly different statistical distribution as compared to that for the non-
leaking Sesta site.
Figure 4. Box plots of soil gas CO2 data from 4 studied sites. The boxes show the upper and
lower quartiles (and median inside the box), the vertical lines show the normally-distributed
minimum and maximum while the horizontal lines show outliers. The plot in (a) shows all
the data while (b) is the same but without outliers. Note that the three sites showing CO2
leakage are very similar whereas that the non-leaking Sesta site has significantly lower
values.
In regards to the second point, related to near-surface effects of CO2
leakage, much work was conducted by the authors on this topic however
these results were not discussed in detail in this paper. In particular the
effect on vegetation (Latera), groundwater composition and sinkhole
formation (San Vittorino) and air quality (Ciampino) was observed, however
in most cases the effects are highly localized and any risks can be managed
with relatively simple measures.
Finally in terms of the third goal, that is the testing of various monitoring
techniques on the naturally leaking sites, work during the various soil gas
and gas flux surveys have shown that these methods are uniquely adapted to
near-surface studies for both site assessments and eventual site monitoring.
This was particularly well shown in the gas injection tests, which tested
Near-Surface Gas Geochemistry for CO2 Geological Sequestration 155
monitoring techniques as well as examined migration mechanisms. Results
from the gas injection test also highlighted the importance of understanding
the chemical and physical characteristics of the gases being monitored, as
aqueous solubility, gas density and both water- and gas-phase diffusivities
play a critical role in the travel times and mass attenuation features of
migrating gases. This was clearly shown by the highly different
breakthrough and migration behaviour of He and CO2 during the test.
Another technique tested during the project was geochemical continuous
monitoring stations, which have the potential to monitor for leaking CO2 in
the vicinity of deep injection wells or along known tectonic structures. The
development, construction, testing and application of the prototype
geochemical station during this work has provided “proof of concept” and
has shown that the unit is capable of monitoring dissolved CO2 in
groundwater, sensing variations in concentration and transmitting the data in
real-time back to the laboratory for processing and interpretation.
The experience gained during this work on natural analogues in Italy has
already been shown to be practical, economical and highly useful during its
application to real-life CO2 geological sequestration sites in Algeria (In
Salah EGR project) and Canada (Weyburn EOR project).
ACKNOWLEDGEMENTS
Funding provided by the European Community (NASCENT project -
ENK5-CT-2000-00303) and the Civil Protection Agency of the Region of
Lazio, Italy, is gratefully acknowledged.
REFERENCES
Annunziatellis, A., Beaubien, S.E., Ciotoli, G., and Lombardi, S., 2004, Allaying public
concern regarding CO2 geological sequestration through the development of automated
stations for the continuous geochemical monitoring of gases in the near surface, GHGT7 -
7th International Conference on Greenhouse Gas Control Technologies, Vancouver,
Canada, 5-9 September 2004, 4 p.
Barberi, F., Innocenti, F., Landi, P., Rossi, U., Saitta, M., Santacroce, R., and Villa, I.M.,
1984, The Evolution of Latera Caldera (Central Italy) in the Light of Subsurface Data,
Bull. Volcan., 47:125-140.
Bertrami, R., Cameli, G.H. and Lovari, F., 1984, Discovery of Latera Geothermal Field:
Problems of the Exploration and Research., Seminar on Utilization of Geothermal Energy
for Electric Power Production and Space Heating., Florence, May 14-17, pp.
Centamore, E., and Nisio, S., 2003, Effects of uplift and tilting in the Central-Northern
Apennines (Italy), Quaternary International, 101-102:93-101.
156 Lombardi, Annunziatellis, Beaubien and Ciotoli
Ciotoli, G., Etiope, G., Guerra, M., and Lombardi, S., 1999, The detection of concealed faults
in the Ofanto basin using the correlation between soil-gas fracture surveys,
Tectonophysics, 299:321-332.
Ciotoli, G., Guerra, M., Lombardi, S., and Vittori, E., 1998, Soil gas survey for tracing
seismogenic faults: a case-study the Fucino basin (central Italy). J. Geophys. Res. 103B:
23781-23794.
Ciotoli, G., Etiope, G., Guerra, M., Lombardi, S., Duddridge, G.A., and Grainger, P.,
Migration and behaviour of gas injected into a fault in low permeability ground.
Submitted to Quarterly Journal of Engineering Geology and Hydrogeology.
Duchi, V., Minissale, A., Paolieri, M., Prati, F., and Valori, A., 1992, Chemical composition
of natural deep and shallow hydrothermal fluids in the Larderello geothermal field,
Journal of volcanology and geochemical research, 49:313-328.
Gascoyne, M., Wuschke, D.M., 1997, Gas migration through water-saturated, fractured rock:
Hutchinson, G.L., Livingston, G.P., 1993, Use of chamber systems to measure trace gas
fluxes. In: Agricultural ecosystem effects on trace gases and global climate change, ASA
Special Publication n°55.
Jacinthe, P.A., and Dick, W.A., 1996, Use of silicone tubing to sample nitrous oxide in the
soil atmosphere, Soil Biology and Biochemistry, 26(6):721-726.
Jacinthe, P.A., and Groffman, P.M., 2001, Silicone rubber sampler to measure dissolved gases
in saturated soils and waters, Soil Biology and Biochemistry, 33:907-912.
Lineham, T.R., Nash, P.J., Rodwell, W.R., Bolt, J., Watkins, V.M.B., Grainger, P., Heath,
M.J., and Merefield, J.R., 1996, Gas migration in fractured rock: results and modelling of
a helium gas injection experiment at the Reskajeage Farm Test Site, SW England, United
Kingdom. J. of Contaminant Hydrology, 21:101-113.
Pearce, J.M. (ed.), 2004, Natural analogues for the geological storage of CO2. Final report of
the Nascent project. British geological Survey Technical Report. 122 pages.
results of a gas injection test, Journal of Hydrology, 196:76-98.
GEOCHEMICAL INTERACTIONS BETWEEN
CO2, PORE-WATERS AND RESERVOIR ROCKS
Lessons learned from laboratory experiments, field studies and
computer simulations
I. Czernichowski-Lauriol1, C. Rochelle
2, I. Gaus
1, M. Azaroual
1, J. Pearce
2,
and P. Durst1
1BRGM, French Geological Survey, 3 avenue Claude Guillemin, BP 6009, 45060 Orleans
Cedex 2, France (Email: [email protected]);2British Geological Survey, Kingsley
Dunham Centre, Keyworth, Nottingham, United Kingdom, NG12 5GG.
Abstract: The degree of reactivity between CO2, pore-waters and minerals may have
significant consequences on CO2 storage capacity, the injection process, and
long-term safety and stability. Geochemical reactions are highly site-specific
and time-dependent. They need to be assessed on a site-to-site basis according
to best practises by combining numerical modelling and observations from
laboratory experiments, field monitoring, and natural analogues. A selection of
lessons learned from three European projects about the reactivity of CO2 with
reservoir rocks and cap rocks is presented here for three sites: Sleipner
(Norway) and Weyburn (Canada) where more than 1 Mt of CO2 per year has
been injected underground since 1996 and 2000 respectively, and Montmiral,
a natural CO2 field in France.
Key words: CO2 geological storage, geochemical studies, reactivity, reservoir, cap rock,
experiments, modelling, CO2 trapping, Sleipner, Weyburn, Montmiral.
1. INTRODUCTION
The capture and geological storage of CO2 is increasingly seen as a
viable strategy to reduce the release of greenhouse gases to the atmosphere
(IPCC, 2002; OECD/IEA, 2004). The injection of a relatively reactive
substance such as CO2 into the deep subsurface will result in chemical
disequilibria and the initiation of various chemical reactions. This paper
gives an overview of the potential impact of geochemical reactions, based on
157
S. Lombardi et al. (eds.),
Advances in the Geological Storage of Carbon Dioxide, 157–174.
© 2006 Springer. Printed in the Netherlands.
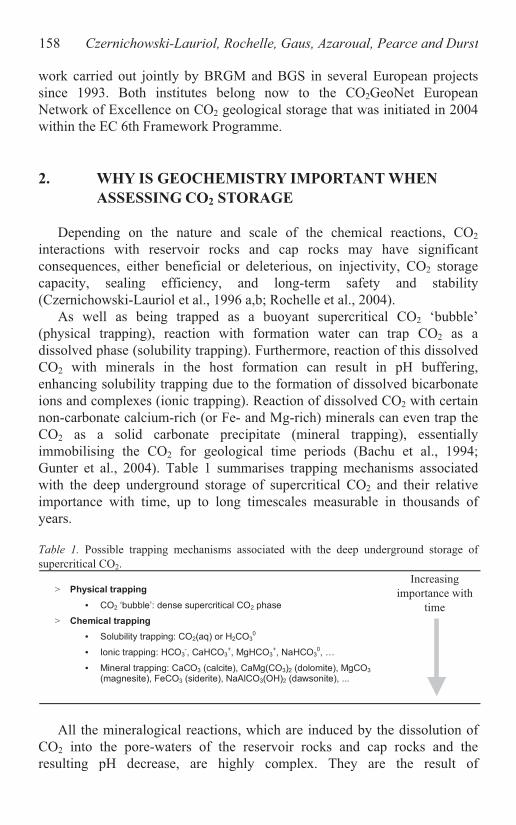
158 Czernichowski-Lauriol, Rochelle, Gaus, Azaroual, Pearce and Durst
work carried out jointly by BRGM and BGS in several European projects
since 1993. Both institutes belong now to the CO2GeoNet European
Network of Excellence on CO2 geological storage that was initiated in 2004
within the EC 6th Framework Programme.
2. WHY IS GEOCHEMISTRY IMPORTANT WHEN
ASSESSING CO2 STORAGE
Depending on the nature and scale of the chemical reactions, CO2
interactions with reservoir rocks and cap rocks may have significant
consequences, either beneficial or deleterious, on injectivity, CO2 storage
capacity, sealing efficiency, and long-term safety and stability
(Czernichowski-Lauriol et al., 1996 a,b; Rochelle et al., 2004).
As well as being trapped as a buoyant supercritical CO2 ‘bubble’
(physical trapping), reaction with formation water can trap CO2 as a
dissolved phase (solubility trapping). Furthermore, reaction of this dissolved
CO2 with minerals in the host formation can result in pH buffering,
enhancing solubility trapping due to the formation of dissolved bicarbonate
ions and complexes (ionic trapping). Reaction of dissolved CO2 with certain
non-carbonate calcium-rich (or Fe- and Mg-rich) minerals can even trap the
CO2 as a solid carbonate precipitate (mineral trapping), essentially
immobilising the CO2 for geological time periods (Bachu et al., 1994;
Gunter et al., 2004). Table 1 summarises trapping mechanisms associated
with the deep underground storage of supercritical CO2 and their relative
importance with time, up to long timescales measurable in thousands of
years.
Table 1. Possible trapping mechanisms associated with the deep underground storage of
supercritical CO2.
Increasing
importance with
time
All the mineralogical reactions, which are induced by the dissolution of
CO2 into the pore-waters of the reservoir rocks and cap rocks and the
resulting pH decrease, are highly complex. They are the result of
> Physical trapping
• CO2 ‘bubble’: dense supercritical CO2 phase
> Chemical trapping
• Solubility trapping: CO2(aq) or H2CO3
0
• Ionic trapping: HCO3
-, CaHCO3
+, MgHCO3
+, NaHCO3
0, …
• Mineral trapping: CaCO3 (calcite), CaMg(CO3)2 (dolomite), MgCO3
(magnesite), FeCO3 (siderite), NaAlCO3(OH)2 (dawsonite), ...

Geochemical Interaction of CO2, Porewater and Reservoir Rock 159
interdependent thermodynamic, kinetic, flow and transport processes and
can occur in the bulk of the reservoir rock or cap rock, but can also occur in
fractures. They result in modification of porosity and permeability, which
can either hinder the actual injection of CO2, or aid its migration out of the
storage volume. For example, rapid calcite dissolution around the injection
well might increase injectivity while rapid mineral precipitation might block
flow pathways needed to maintain high injection rates. Dissolution of
minerals in the cap rock might result in the formation of flow pathways that
might aid CO2 migration; equally, a self-sealing mechanism could occur
which would aid containment. The geomechanical consequences of the
chemically-induced changes in fractures and bulk rock petrophysical
properties need to be assessed as they will have an effect on long term
storage stability and security.
A recurring theme is that geochemical reactions are highly site specific,
depending on the precise mineralogy, fluid chemistry, pressure and
temperature of the host formation. They are also strongly time-dependent,
due to the wide range of reaction kinetics. So it is important to recognise that
geochemical investigations need to be carried out on a site-to-site basis.
3. BEST PRACTISE FOR ASSESSING THE
GEOCHEMICAL EFFECTS OF CO2 STORAGE
General recommendations for assessing the geochemical effects of CO2
storage can be found in the SACS Best Practise Manual (IEA-GHG, 2003),
with specific examples being based on experience gained during the SACS
and SACS2 projects investigating CO2 storage at Sleipner.
3.1 Determination of baseline geochemical conditions
prior to CO2 injection
A good geochemical understanding of the system will require knowledge
of the ‘baseline’ conditions of mineralogy and fluid chemistry prior to CO2
injection. Only with this information can changes due to the presence of CO2
be assessed. It is important therefore, that sample acquisition be
implemented prior to CO2 injection operations.
As a minimum requirement, the first prerequisite is to have core material
from a well intersecting the reservoir formation and the cap rock formation.
Core and cuttings from additional wells will improve characterisation,
particularly if vertical and lateral heterogeneity is suspected. The second
prerequisite is to have at least one formation water sample, carefully
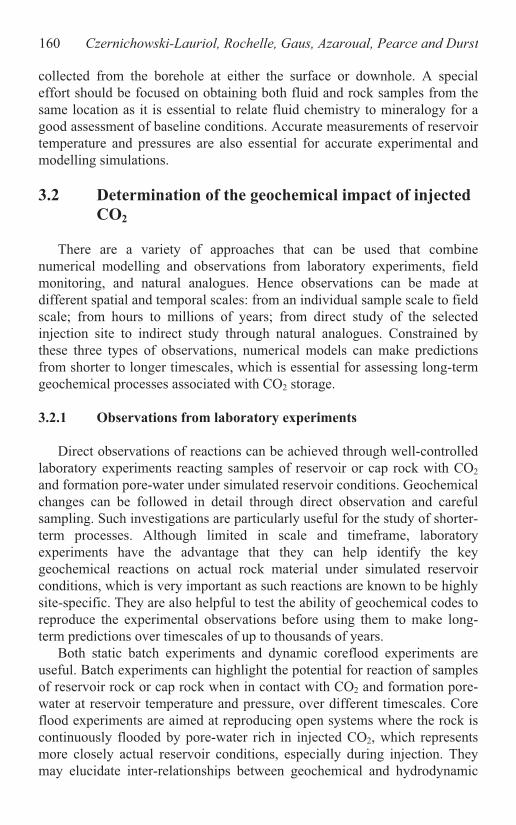
160 Czernichowski-Lauriol, Rochelle, Gaus, Azaroual, Pearce and Durst
collected from the borehole at either the surface or downhole. A special
effort should be focused on obtaining both fluid and rock samples from the
same location as it is essential to relate fluid chemistry to mineralogy for a
good assessment of baseline conditions. Accurate measurements of reservoir
temperature and pressures are also essential for accurate experimental and
modelling simulations.
3.2 Determination of the geochemical impact of injected
CO2
There are a variety of approaches that can be used that combine
numerical modelling and observations from laboratory experiments, field
monitoring, and natural analogues. Hence observations can be made at
different spatial and temporal scales: from an individual sample scale to field
scale; from hours to millions of years; from direct study of the selected
injection site to indirect study through natural analogues. Constrained by
these three types of observations, numerical models can make predictions
from shorter to longer timescales, which is essential for assessing long-term
geochemical processes associated with CO2 storage.
3.2.1 Observations from laboratory experiments
Direct observations of reactions can be achieved through well-controlled
laboratory experiments reacting samples of reservoir or cap rock with CO2
and formation pore-water under simulated reservoir conditions. Geochemical
changes can be followed in detail through direct observation and careful
sampling. Such investigations are particularly useful for the study of shorter-
term processes. Although limited in scale and timeframe, laboratory
experiments have the advantage that they can help identify the key
geochemical reactions on actual rock material under simulated reservoir
conditions, which is very important as such reactions are known to be highly
site-specific. They are also helpful to test the ability of geochemical codes to
reproduce the experimental observations before using them to make long-
term predictions over timescales of up to thousands of years.
Both static batch experiments and dynamic coreflood experiments are
useful. Batch experiments can highlight the potential for reaction of samples
of reservoir rock or cap rock when in contact with CO2 and formation pore-
water at reservoir temperature and pressure, over different timescales. Core
flood experiments are aimed at reproducing open systems where the rock is
continuously flooded by pore-water rich in injected CO2, which represents
more closely actual reservoir conditions, especially during injection. They
may elucidate inter-relationships between geochemical and hydrodynamic
Geochemical Interaction of CO2, Porewater and Reservoir Rock 161
processes, and overall geochemical impact may be higher than in batch
experiments.
3.2.2 Observations from field monitoring
The most obvious way to obtain direct geochemical information is by
direct sampling of a CO2 injection site. This approach requires observation
boreholes with repeat fluid sampling and permanent in-situ sensors to
monitor fluid chemical changes. Sidewall coring, or the drilling of boreholes
through the CO2 ‘bubble’ would be necessary to obtain samples of rock that
had been in contact with CO2 for a variety of timescales. Such an approach
is useful in providing highly relevant ‘real time’ information about a large-
scale system.
3.2.3 Observations from natural analogues
This approach utilises relevant information from large-scale sources
other than the selected injection site to generate a better understanding of the
CO2 injection system. Natural accumulations of CO2 exist in many parts of
the world and have many analogous features to a CO2 storage operation,
although these may not be directly comparable. As such, these ‘natural
analogues’ can provide much useful information, especially for long-term
processes as the CO2 can, in many cases, be shown to have been trapped for
thousands or millions of years. Study of natural accumulations of CO2 has
the advantage of similar physical size and timescale of reaction. This can
build confidence in models that predict likely responses of reservoirs to
geological storage.
3.2.4 Numerical modelling
Computer simulations are a very useful way to rapidly scope a range of
different scenarios. They can predict the effects of adding CO2 to formation
pore-waters, and the subsequent changes in fluid chemistry and reservoir
mineralogy. Some codes only deal with static (i.e. not flowing) systems,
whereas others couple geochemical reactions and solute transport to produce
simulations where mineral precipitation has a direct impact on fluid flow. A
wide variety of different geochemical models are available, but they are
generally based on the same underlying mathematical expressions. They do
differ however, in their emphasis, and the way they handle input and output
files. Many come with their own underlying thermodynamic data files,
though kinetic data usually have to be supplied by the user. An important
benefit of such codes is their ability to make predictions from shorter to

162 Czernichowski-Lauriol, Rochelle, Gaus, Azaroual, Pearce and Durst
longer timescales, which is essential for the long-term assessment of CO2
storage. However, their output is crucially dependent on the reactions
considered and the underlying data files, as well as on the reliability of the
conceptual model chosen (which requires a good expertise in geochemical
processes). Uncertainties resulting from this can be minimised by carrying
out a wide range of sensitivity runs and by comparing modelling results with
observations from laboratory experiments, field monitoring and natural
analogues, which serve as useful validation test cases.
4. CASE STUDIES FROM THREE EUROPEAN FP5
PROJECTS
A selection of lessons learned from three European projects (5th
Framework Research Programme) about the reactivity of CO2 with reservoir
rocks and cap rocks are presented for the following sites:
Sleipner, North Sea, Norway, where 1 Mt of CO2 per year has been
injected into a deep saline aquifer since 1996 (Research carried out as
part of the SACS and SACS2 projects).
2
injected into a depleted oil reservoir since 2000 (Research carried out as
part of the European contribution to the IEA Weyburn CO2 storage and
monitoring project).
Montmiral, Southeast basin, France, where a natural CO2 field (98%
CO2) has been exploited since 1990 for CO2 production for various
industrial uses (Research carried out as part of the NASCENT project).
The main characteristics of these sites are summarized in Table 2.
Depth (m) T°C Sal. (g/l) Reservoir Caprock
Sleipner 800 37 35-40 Sand Shale
Weyburn 1400 60 35-110 Carbonate Evaporite/shale
Montmiral 2400 100 >85 sandstone Clay/marl
4.1 Long term predictions of clay cap rock reactivity at
Sleipner
CO2 is being injected into the Utsira sand, which is overlain by the 250 m
thick Nordland shale acting as a cap rock. Due to buoyancy effects the
injected CO2 moves upward from the injection point and accumulates under
the overlying cap rock - under the current conditions CO2 is in a supercritical
Weyburn, Saskatchewan, Canada, where 1.8 Mt of CO per year has been
Table 2. Main characteristics of the Sleipner, Weyburn and Montmiral sites.
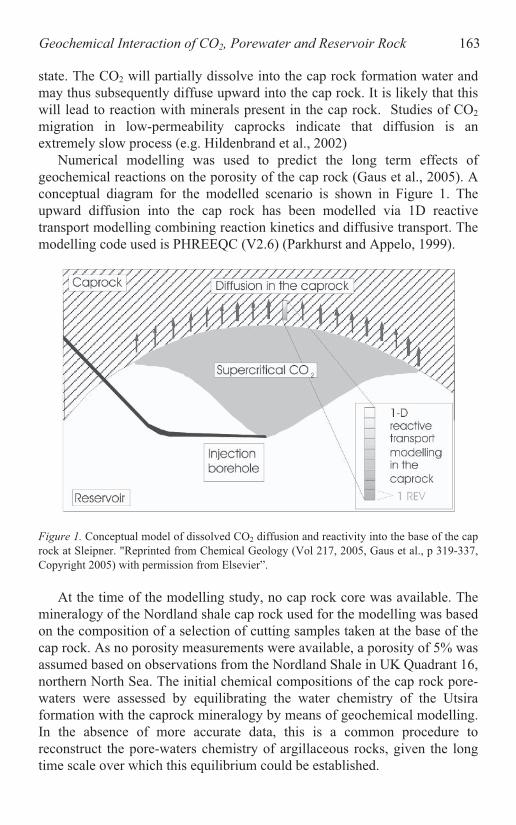
Geochemical Interaction of CO2, Porewater and Reservoir Rock 163
state. The CO2 will partially dissolve into the cap rock formation water and
may thus subsequently diffuse upward into the cap rock. It is likely that this
will lead to reaction with minerals present in the cap rock. Studies of CO2
migration in low-permeability caprocks indicate that diffusion is an
extremely slow process (e.g. Hildenbrand et al., 2002)
Numerical modelling was used to predict the long term effects of
geochemical reactions on the porosity of the cap rock (Gaus et al., 2005). A
conceptual diagram for the modelled scenario is shown in Figure 1. The
upward diffusion into the cap rock has been modelled via 1D reactive
transport modelling combining reaction kinetics and diffusive transport. The
modelling code used is PHREEQC (V2.6) (Parkhurst and Appelo, 1999).
Figure 1. Conceptual model of dissolved CO2 diffusion and reactivity into the base of the cap
rock at Sleipner. "Reprinted from Chemical Geology (Vol 217, 2005, Gaus et al., p 319-337,
Copyright 2005) with permission from Elsevier”.
At the time of the modelling study, no cap rock core was available. The
mineralogy of the Nordland shale cap rock used for the modelling was based
on the composition of a selection of cutting samples taken at the base of the
cap rock. As no porosity measurements were available, a porosity of 5% was
assumed based on observations from the Nordland Shale in UK Quadrant 16,
northern North Sea. The initial chemical compositions of the cap rock pore-
waters were assessed by equilibrating the water chemistry of the Utsira
formation with the caprock mineralogy by means of geochemical modelling.
In the absence of more accurate data, this is a common procedure to
reconstruct the pore-waters chemistry of argillaceous rocks, given the long
time scale over which this equilibrium could be established.

164 Czernichowski-Lauriol, Rochelle, Gaus, Azaroual, Pearce and Durst
0
2
4
6
8
10
-1.0 -0.5 0.0 0.5 1.0
Fig. 8B
moles per REV
De
pth
(m
)
Dawsonite
Albite
Calcite
Kaolinite
Chalcedony
0
2
4
6
8
10
-0.2 -0.1 0.0 0.1 0.2
g
Porosity decrease (%)
De
pth
(m
)
Porosity change
0
2
4
6
8
10
0.0 0.2 0.4 0.6 0.8 1.0 1.2
Dissolved CO2 (M)
Depth
(m
)
diffusion + reactions
diffusion only
Figure 2. Profiles of impact of dissolved CO2 in the cap rock after 3000 years at Sleipner. A)
diffusion of dissolved CO2 into the caprock. B) dissolution and precipitation of minerals. C)
porosity changes "Reprinted from Chemical Geology (Vol 217, 2005, Gaus et al., p 319-337,
Copyright 2005) with permission from Elsevier”.
The diffusion of dissolved CO2, the major mineralogical changes and the
porosity changes after 3000 years are shown in Figure 2. The main results
can be summarized as follows:
Diffusion of CO2 in the cap rock is predicted to be a slow process. After
3000 years, only the lower 10 meters of the 250 m thick cap rock have
elevated dissolved CO2 concentrations. Depending on the reactivity of

Geochemical Interaction of CO2, Porewater and Reservoir Rock 165
the cap rock, diffusion can be further retarded because the dissolved CO2
is consumed by feldspar alteration reactions.
The calculated porosity change is small and limited to the bottom few
metres of the cap rock. A decrease in porosity is predicted, with a
maximum of 3% for the most reactive cap rock composition modelled.
This will reduce the rate of diffusion and therefore improve the cap rock
sealing capacity.
At the very bottom of the cap rock some carbonate dissolution is
expected to occur, leading to a minor porosity increase. However, this is
predicted to not migrate further into the cap rock.
These conclusions are based on the assumption that the cap rock is a
homogeneous medium and that diffusion is the only mass transport
mechanism in the cap rock causing the displacement of dissolved CO2.
Further investigations should aim to reduce uncertainties and strengthen
confidence in the predictions. A core sample of the base of the cap rock is
needed to obtain an accurate mineralogical and chemical characterisation
and to initiate a series of laboratory experiments. The presence of any
fractures that might lead to preferential pathways has to be studied.
Information about the behaviour of similar clay cap rocks in natural CO2
fields has to be searched for. Once information from these studies has been
obtained, then numerical simulations need to be revised and a detailed
sensitivity analysis should be carried out. Part of this work is currently being
achieved through the CO2STORE European project (2003-2005) carried out
within the 5th Framework Programme.
4.2 Reactivity of carbonate reservoir rocks at Weyburn
CO2 is being injected into the Midale Formation carbonate reservoir as
part of an enhanced oil recovery project at the Weyburn oilfield,
Saskatchewan, Canada. As this is an active and mature oil field, a lot of
wells are present, core samples are available and fluid samples can be taken
at almost any time. A three-pronged approach has been used by the North
American and European teams as part of the IEA CO2 monitoring and
storage project (Wilson and Monea, 2004) to study the impact of CO2 upon
reservoir geochemistry: monitoring changes in actual reservoir fluids from
deep boreholes; laboratory experiments to simulate in-situ conditions within
the reservoir; and predictive modelling of evolving conditions within the
reservoir over the short to long term. A selection of results is presented
below.

166 Czernichowski-Lauriol, Rochelle, Gaus, Azaroual, Pearce and Durst
Figure 3. Batch thermo-kinetic modelling reacting a CO2-rich Weyburn brine (1 molal CO2)
with reservoir minerals at 50°C over 1000 years: Evolution of pH and total amount of carbon
in dissolved and mineral forms, expressed in mol/REV (Durst et al., 2003). A REV is a
Representative Elementary Volume of 3.85 l corresponding to 1 l of fluid and 2.85 l of rock.
The potential for long term mineral trapping in the Weyburn reservoir
has been assessed by numerical modelling. Figure 3 presents the results for
the case where a typical Weyburn brine (50°C, salinity 81 g/l) saturated with
1 mole of dissolved CO2 reacts with the reservoir minerals in a closed
system over 1000 years. Calculations were carried out using the PHREEQC
code. Key results from this modelling are as follows (Durst et al., 2003):
A rapid thermodynamic re-equilibration of the CO2-rich saline solution
with respect to carbonates, sulphate and sulphide is predicted. The
resulting quick dissolution of carbonates induces an increase in
dissolved carbon, whilst the amount of carbon in mineral form
decreases.
slow dissolution of alumino-silicates (Fe-chlorite, illite and K-feldspar),
allowing the precipitation of dawsonite and siderite which trap CO2 in
mineral form. After about 3 years of simulated time, the predicted
carbon concentration in solution continuously decreases while more and
more carbon is trapped in mineral form.

Geochemical Interaction of CO2, Porewater and Reservoir Rock 167
as the system is closed, the total amount of carbon in the system is
constant.
it is predicted that 50% of the CO2 initially dissolved in the brine will be
trapped in mineral phases (siderite, dawsonite) after 1000 years,
however, thermodynamic equilibrium is still not reached after 1000
years.
no significant variation of porosity was predicted as the system was
closed (batch calculations). However for open systems with significant
advective flow, carbonate reactions could lead to noticeable porosity
changes.
Extrapolation to the reservoir scale was attempted by Perkins et al.
(2004). Planned CO2 injection is on the order of 20-25 million tons. In the
long term, the Weyburn Midale reservoir has the potential to store all of the
injected CO2 through solubility and mineral trapping mechanisms, but
assuming that every part of the reservoir is in contact with dissolved CO2.
A series of laboratory experiments has been undertaken where samples of
well-characterised borehole material from the Midale Formation were
reacted with both CO2 and synthetic reservoir formation waters under
simulated in-situ conditions (60°C, 15-25 MPa). The duration of the
experiments ranged from 1 week to 6 months. Changes in fluid chemistry,
mineralogy, porosity and permeability were measured. The basic layout of
the batch experiments is reproduced in Figure 4. Core flooding experiments
with a fluid velocity of 15–29 cm/day were also carried out. Interpreted
results of these experiments, based on observed changes and numerical
modelling using the SCALE 2000 and PHREEQC codes, are described
below (Azaroual et al., 2004; Riding and Rochelle, 2005).
Magnetic stirer
CO2
inlet
Sample of powdered
rock
PTFElining
CO2
Wateror brine
H2Ooutlet
Filter
Sample tube
Figure 4. Layout of the batch experiments used to react rock samples with CO2-saturated
brines under reservoir temperature and pressure conditions. Vessel volume is 100-150 ml.

168 Czernichowski-Lauriol, Rochelle, Gaus, Azaroual, Pearce and Durst
In the closed system batch experiments the Midale lithologies
(limestones, dolostones and anhydrite) showed variable amounts of
carbonate mineral dissolution, some precipitation of gypsum incorporating
the Ca released from carbonate minerals (Figure 5), ‘inhibition’ of anhydrite
dissolution, and poor reactivity of alumino-silicate minerals over the
timescale of the experiments.
Figure 5. Gypsum crystals up to 2.5 mm long after 8 weeks reaction of Weyburn reservoir
rock with CO2 in batch experiments under reservoir conditions (60°C, 15 MPa) (Riding and
Rochelle, 2005).
In the CO2 flooding tests observed dissolution features were confined to
the inlet end, where CO2-saturated brine entered the sample (Figure 6).
Calcite and dolomite showed various states of corrosion. Porosity and matrix
gas permeability increased. No precipitating minerals were observed in the
CO2 flooding experiments.
The 1D PHREEQC reactive transport code was used to simulate the
long-term evolution of Midale material under CO2 injection conditions in the
Midale Formation of the Weyburn reservoir (150 bar and 54°C). The effect
of mineral dissolution / precipitation reaction kinetics coupled to advective /
diffusive / dispersive transport processes was predicted over a simulated
10,000 year time period. Varying flow rates were considered, from the
undisturbed natural aquifer flow (0.25 m/year) up to higher values close to
the injection zone (50 m/year). Simulations show that main reactions occur
close to the injection zone. Calcite dissolves at the very entrance of the
system whereas a calcium sulphate phase (anhydrite or gypsum) precipitates.
Feldspars dissolve over a long distance while dawsonite precipitates. Clays
show two reaction fronts, dissolving close to the injection zone but

Geochemical Interaction of CO2, Porewater and Reservoir Rock 169
precipitating further on. Chalcedony, a silica phase, has the opposite
behaviour. Finally, as a consequence of these dissolution / precipitation
reactions, the porosity is predicted to increase. In the case of a flow rate of
0.25 m/year, the initial 20% porosity is expected to increase in the first 10
meters of the 1D column by up to 20.3% after 1000 years, and by up to 25%
after 10,000 years.
Figure 6. Inlet end of the Weyburn reservoir rock sample after the CO2 flooding experiment
carried out at GEUS. Numerous small pits are present in the sample surface after the
experiment. They represent dissolved calcite grains. (Riding and Rochelle, 2005; photograph
Further investigations will be carried out in the Weyburn Phase II
project. More accurate estimates coupling the CO2 plume displacement, the
CO2 dissolution process as well as the geochemical interactions will be
necessary to investigate the ultimate fate of the injected CO2.
4.3 Long term reactivity of sandstone reservoir rocks at
Montmiral
At Montmiral, supercritical CO2 has accumulated in Triassic sandstones
below 2400m depth (Czernichowski-Lauriol et al., 2002; Pearce et al.,
2004). Based upon the tectonic setting and the results of petrographic
studies, this accumulation occurred in post-Pyrenean times about 15 million
years ago. The reservoir is sealed by Domerian and Callovian clay and marl.
The Montmiral CO2 field (98% CO2) was discovered during gas and oil
exploration in the 1960’s and is currently used for industrial CO2 production.
The availability of core material and access to reservoir fluids through the
reproduced with kind permission of GEUS).
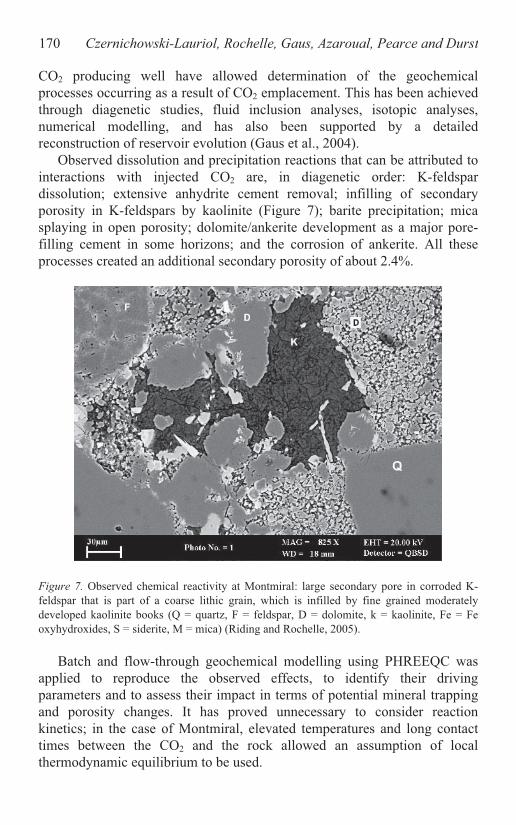
170 Czernichowski-Lauriol, Rochelle, Gaus, Azaroual, Pearce and Durst
CO2 producing well have allowed determination of the geochemical
processes occurring as a result of CO2 emplacement. This has been achieved
through diagenetic studies, fluid inclusion analyses, isotopic analyses,
numerical modelling, and has also been supported by a detailed
reconstruction of reservoir evolution (Gaus et al., 2004).
Observed dissolution and precipitation reactions that can be attributed to
interactions with injected CO2 are, in diagenetic order: K-feldspar
dissolution; extensive anhydrite cement removal; infilling of secondary
porosity in K-feldspars by kaolinite (Figure 7); barite precipitation; mica
splaying in open porosity; dolomite/ankerite development as a major pore-
filling cement in some horizons; and the corrosion of ankerite. All these
processes created an additional secondary porosity of about 2.4%.
Figure 7. Observed chemical reactivity at Montmiral: large secondary pore in corroded K-
feldspar that is part of a coarse lithic grain, which is infilled by fine grained moderately
developed kaolinite books (Q = quartz, F = feldspar, D = dolomite, k = kaolinite, Fe = Fe
oxyhydroxides, S = siderite, M = mica) (Riding and Rochelle, 2005).
Batch and flow-through geochemical modelling using PHREEQC was
applied to reproduce the observed effects, to identify their driving
parameters and to assess their impact in terms of potential mineral trapping
and porosity changes. It has proved unnecessary to consider reaction
kinetics; in the case of Montmiral, elevated temperatures and long contact
times between the CO2 and the rock allowed an assumption of local
thermodynamic equilibrium to be used.

Geochemical Interaction of CO2, Porewater and Reservoir Rock 171
The modelling reproduced most of the observed changes that can be
attributed to CO2 ingress. However, in the batch modelling the extent to
which these reactions occurred was not reproduced. The modelled reactions
do not have a large impact on the mineralogy of the reservoir and an
insignificant porosity increase was predicted (0.02 %). The observed
reactivity implies that the sediment has been flushed intensively with CO2-
rich pore waters (open system) and that a flow regime in the reservoir must
have been in place at a certain point in the reservoir’s geological history. 1D
reactive-transport modelling showed that an increase of secondary porosity
of 2.4% requires that the pore water of the reservoir must be renewed 6000
times with CO2-rich brine. This means that if we consider flow velocities
between 0.1 and 100 meters per year, this would require between 100 and
100,000 years of flushing.
Mineral trapping can therefore be insignificant when considering certain
closed systems. However, the presence of a flow regime can enhance
mineral trapping, and a mineral trapping capacity of 8 kg CO2 per m3 of
reservoir rock was modelled. In the case of Montmiral, the predicted
trapping phase is dolomite. However, the precipitation of tiny amounts of
dolomite is very difficult to confirm by observations. Dawsonite (another
potential secondary carbonate mineral) was neither observed nor modelled at
Montmiral.
5. CONCLUSIONS
Further knowledge on CO2 reactivity with reservoir rocks and cap rocks
has been gained through studies of three CO2 storage sites, Sleipner and
Weyburn (‘industrial’ sites), and Montmiral (a natural site).
Modelling of long timescale upward diffusion of dissolved CO2 through
the thick clay cap rock at Sleipner shows that diffusion is a very slow
process, and is potentially retarded further by geochemical reactions. The
overall net result is that only the bottom few meters of the cap rock adjacent
to the reservoir is exposed to chemical reactions. As a consequence, the
overall performance of the caprock seal is likely to be good. That said,
however, migration of CO2 may still be possible through pre-existing or
newly formed fractures, or via the well bore. Indeed, for the latter, there is
still a question regarding the chemical reactivity of CO2 with borehole
completions and the consequent impact on sealing.
Laboratory experiments, modelling and field monitoring at Weyburn
show that the carbonate reservoir undergoes mainly dissolution reactions and
an increase of porosity, especially close to the injection zone. However,
mineral trapping could play a significant role in the long term due to the
172 Czernichowski-Lauriol, Rochelle, Gaus, Azaroual, Pearce and Durst
predicted precipitation of dawsonite. A full 3D dynamic modelling study
still needs to be undertaken, where flow, transport and chemical processes
are coupled in order to quantify the temporal and spatial changes in CO2
solubility and mineral trapping, and consequent porosity changes.
Although CO2 has accumulated over millions of years in the Montmiral
sandstone reservoir, observed chemical reactivity is low. Detailed
mineralogical and fluid characterisation combined with numerical modelling
show that the dissolution of feldspars is the main reaction and that the
porosity has increased by less than 3%. Mineral trapping is very limited and
is restricted to minor precipitation of dolomite. Dawsonite was neither
observed nor modelled at Montmiral, although often referred to in the
literature as an important CO2-trapping mineral.
Overall, therefore, CO2 reactivity is highly site-specific and time
dependent. Investigations need to be based on a very precise characterisation
of minerals and fluids from the host formation. They also benefit from the
combined outputs of laboratory investigations, numerical modelling, field
monitoring and comparisons with natural analogues.
Reactivity can be minor for certain types of reservoirs or cap rocks, but
significant for others. It is worth noting that chemical reactions are
accelerated by high reservoir temperatures, and can be amplified in the
presence of a flow regime. The impact of reactivity, either minor or
significant, on the geomechanical properties of the reservoir and cap rock
needs to be assessed to investigate long term storage stability and security.
ACKNOWLEDGEMENTS
This paper highlights a selection of lessons learned from several
European research projects: ‘The underground disposal of carbon dioxide’
(Joule II project, 3rd
Framework Programme, 1993-1995), ‘SACS’ (4th
Framework Programme, 1998-1999), ‘SACS2’ (5th Framework Programme,
2000-2002), NASCENT and WEYBURN (5th Framework Programme,
2001-2004). We thank the European Commission and the industrial and
research consortia of the SACS, NASCENT and WEYBURN projects. We
thank also the whole consortium of the international ‘IEA Weyburn CO2
Monitoring and Storage Project’.
BGS staff published with permission of the Executive Director, BGS
(NERC).

Geochemical Interaction of CO2, Porewater and Reservoir Rock 173
REFERENCES
Azaroual, M., Kervévan, C., Durance, M.-V., and Durst, P., 2004, SCALE2000 (V3.1) User’s
Manual; Software for thermodynamic and kinetic calculations. BRGM Editions, ISBN2-
7159-0939-X, 70 p.
Azaroual, M., Durst, P., Czernichowski-Lauriol, I., D., Olsen, D. N,. Springer, N., Rochelle,
C. A., Pearce, J., Bateman, K., and Birchall, D., 2004, Geochemical reactions resulting
from CO2 injection into the Midale formation, Weyburn oilfield; a laboratory experimental
and modelling study. GHGT7- 7th International Conference on Greenhouse Gas Control
Technologies, Vancouver, Canada, 5-9 September 2004, 4 p.
Bachu, S., Gunter, W.D., and Perkins, E.H., 1994, Aquifer disposal of CO2: hydrodynamic
and mineral trapping. Energy Conversion and Management, 35:269-279.
Czernichowski-Lauriol, I., Pauwels, H., Vigouroux, P., and Le Nindre, Y.M., 2002, The
French carbogaseous province: an illustration of natural processes of CO2 generation,
migration, accumulation and leakage. Proceedings of the 6th
International Conference on
Greenhouse Gas Control Technologies (GHGT-6), Vol. I, J. Gale and Y. Kaya (Eds), p.
411-416, Kyoto, Japan, Oct. 1st-4th 2002. Elsevier Science Ltd.
Czernichowski-Lauriol, I., Sanjuan, B., Rochelle, C., Bateman, K., Pearce, J., Blackwell, P.,
1996a, Analysis of the geochemical aspects of the underground disposal of CO2: scientific
and engineering aspects. in: Deep Injection Disposal of Hazardous and Industrial Waste,
J.A. Apps and C.F. Tsang, ed. pp. 565-583, Academic Press.
Czernichowski-Lauriol, I, Sanjuan, B, Rochelle, C, Bateman, K, Pearce, JM, and Blackwell,
P., 1996b, Inorganic geochemistry. In: Final Report of the Joule II Project No. CT92-
0031: The Underground Disposal of Carbon Dioxide, S. Holloway, ed., pp. 183-276,
British Geological Survey, Keyworth, Nottingham, UK.
Durst, P., Azaroual, M., and Czernichowski-Lauriol, I., 2003, Weyburn database validation
problem for predictive geochemical modelling. Report BRGM/RP-52375-FR, 46 p.
Restricted.
Gaus, I., Le Guern, C., Pauwels, H., Girard, J.-P., Pearce, J., Shepherd, T., Hatziyannis, G.,
Metaxas, A., 2004, Comparison of long term geochemical interactions at two natural CO2-
analogues: Montmiral (Southeast Basin, France) and Messokampos (Florina Basin,
Greece) case studies. GHGT7 - 7th International Conference on Greenhouse Gas Control
Technologies, Vancouver, Canada, 5-9 September 2004, 9 p.
Gaus, I., Azaroual, M., and Czernichowski-Lauriol, I., 2005, Reactive transport modelling of
the impact of CO2 injection on the clayey cap rock at Sleipner (North Sea). Chemical
Geology, 217:319-337.
Gunter, W.D., Bachu, S., and Benson, S., 2004, The role of hydrological and geochemical
trapping in sedimentary basins for secure storage of CO2. in: Geological Storage of
Carbon Dioxide, S.J. Baines and R.H. Worden eds., Special Publication of the Geological
Society of London n°233, pp. 129-145.
Hildenbrand, A., Schloemer, S., and Krooss, B.M., 2002, N2 and CO2 gas breakthrough
experiments on fine-grained sediments. in: Poromechanics, Auriault et al. (eds). Swets &
Zeitlinger, Lisse, 445-450.
IEA-GHG, 2003, Saline Aquifer CO2 Storage project (SACS) Best Practice Manual. Report
Number PH4/21, 53 p.
IPCC, 2002, Proceedings of the IPCC Workshop on carbon dioxide capture and storage,
Regina, Canada, 18-21 November 2002.
OECD/IEA, 2004, Prospects for CO2 capture and storage. IEA Publications, ISBN 92-64-
10881-5, 249 p.

174 Czernichowski-Lauriol, Rochelle, Gaus, Azaroual, Pearce and Durst
Parkhurst, D.L., and Appelo, C.A.J., 1999, User's guide to PHREEQC (version 2) - A
computer program for speciation, batch-reaction, one-dimensional transport, and inverse
geochemical calculations: U.S. Geological Survey Water-Resources Investigations Report
99-4259, 312 p.
Pearce, J., Czernichowski-Lauriol, I., Lombardi, S., Brune, S., Nador, A., Baker, J., Pauwels,
H., Hatziyannis, G., Beaubien, S.E., Faber, E., 2003, A review of natural CO2
accumulations in Europe as analogues for geological sequestration. in: Geological Storage
of Carbon Dioxide, S.J. Baines and R.H. Worden eds., Special Publication of the
Geological Society of London n°233, pp. 29-41.
Perkins, E., Czernichowski-Lauriol, I., Azaroual, M., Durst, P., 2004, Long term predictions
of CO2 Storage by mineral and solubility trapping in the Weyburn Midale Reservoir.
GHGT7 - 7th International Conference on Greenhouse Gas Control Technologies,
Vancouver, Canada, 5-9 September 2004, 4 p.
Riding, J.B., and Rochelle, C.A., 2005, The IEA Weyburn CO2 Monitoring and Storage
project: Final report of the European research team. British Geological Survey, Research
Report RR/05/03, 54 p.
Rochelle, C.A., Czernichowski-Lauriol, I., and Milodowski, A.E., 2004, The impact of
chemical reactions on CO2 storage in geological formations: a brief review. in: Geological
Storage of Carbon Dioxide, S.J. Baines and R.H. Worden eds., Special Publication of the
Geological Society of London n°233, pp. 87-106.
Wilson, M., and Monea, M., 2004, IEA GHG Weyburn CO2 Monitoring & Storage Project
Summary Report 2000-2004. Proceedings of the 7th International Conference on
Greenhouse Gas Control Technologies, Vol.3, Vancouver, Canada, 5-9 September 2004,
273 p.

STUDY OF NATURAL CO2 EMISSIONS IN
DIFFERENT ITALIAN GEOLOGICAL
SCENARIOS
A refinement of natural hazard and risk assessment
Istituto Nazionale di Geofisica e Vulcanologia, Via di Vigna Murata n° 605, 00143 Rome,
Italy
Abstract: Natural gas emissions represent extremely attractive surrogates for the study
of CO2-effects both on the environment and human life. Three Italian case
histories demonstrate the possible co-existence of CO2 natural emissions and
people since Roman times. The Solfatara crater (Phlegraean fields caldera,
Southern Italy) is an ancient Roman spa. The area is characterized by intense
and diffuse fumarole and hydrothermal activity. Soil gas flux measurements
show that the entire area discharges between 1200 and 1500 tons of CO2 a day.
In proximity of Panarea island (Aeolian islands, Southern Italy), a huge
submarine volcanic-hydrothermal gas burst occurred in November, 2002. The
submarine gas emissions locally modified seawater pH (from 8.0 to 5.0) and
Eh (from +80 mV to -200 mV), causing a strong modification of the marine
ecosystem. Collected data suggest an intriguing correlation between the
gas/water vent location/evolution and the main local and regional faults. CO2
degassing also characterizes the Telese area (Southern Italy), one of the most
seismically active segments of the southern Apennine belt with the occurrence
of five large destructive earthquakes in the last 500 years. Geochemical
surveys in this area reveal the presence of high CO2 content in ground-water.
Carbon isotopic analysis of CO2 reveal its deep origin, probably caused by the
presence of a cooling magmatic intrusion inside the carbonate basement. All
the above mentioned areas are constantly monitored since they are densely
populated. Although natural phenomena are not always predictable, local
people have nevertheless learnt to manage and, in some case, exploit these
phenomena, suggesting significant human adaptability even in extreme
situations.
Key words: natural emissions; carbon dioxide; soil gas; dissolved gas; flux measurement.
175
S. Lombardi et al. (eds.),
Advances in the Geological Storage of Carbon Dioxide, 175–190.
© 2006 Springer. Printed in the Netherlands.
F. Quattrocchi
N. Voltattorni, G. Caramanna, D. Cinti, G. Galli, L. Pizzino and

176 Voltattorni, Caramanna, Cinti, Galli, Pizzino and Quattrocchi
1. INTRODUCTION
Natural degassing phenomena can be studied as “natural analogues” in
the frame of geological storage and sequestration of anthropogenic CO2
emissions, especially when the risk of possible leakage at surface is taken
into account with potential consequences in the biosphere.
Active and quiescent volcanic areas release high amounts of CO2 to the
atmosphere (Chiodini et al., 1998) from both active craters, as plumes and
fumaroles, and along the flanks of volcanic edifices as diffusive soil
emanations (Allard et al., 1991a; Baubron et al., 1990).
The two basic processes which are recognised to drive soil gas movement
through rocks and sediments are diffusion and advection.
If transport through a stationary medium take place by diffusion, the
steady state diffusive flux d is proportional to the concentration gradient,
dC/d , as expressed by Fick's first law:
d = - D(dC/d ) (1)
where and D represent soil porosity (i.e., the fraction of pore volume to
total soil volume) and the diffusion coefficient, respectively, and the minus
sign indicates that gas moves from points of high concentration towards
points of low concentration (or partial pressure). On the contrary, advection
involves the movement of matter due to the action of a force, i.e., a pressure
gradient dP/d . Advective flow a is described by the well-known Darcy's
law:
a = (k/ )(dP/d ) (2)
where k is the specific permeability and is the viscosity of the fluid.
Although equation 2 was experimentally derived for the steady flow of
liquids in porous media, it has also been extensively used to describe the
advective flow of compressible fluids in porous media (Gurrieri and
Valenza, 1988). For the sake of correctness, the steady advective flow of
compressible fluids is described by comparatively complex, well-known
equations (e.g. Scheidegger, 1974). Because of mathematical complexities
many workers have decided to study the steady flow of gases assuming that
they are incompressible. Although this assumption might seem
unreasonable, it is justified when the pressure gradient is comparatively
small.
Exhalation is the process that transfers gas from the soil to the
atmosphere via the already-described mechanisms of diffusion and
advection. Diffusive gas exhalation takes place due to the different
Natural CO2 Emissions in Different Italian Geological Scenarios 177
concentrations of that gas in the soil and atmosphere. Advective exhalation
exists when the gas in the soil has a higher total pressure than that in the
atmospheric (eg. barometric pumping). Exhalation can be measured in terms
of flux from the soil, i.e. the quantity of gas per unit area per unit time ( max
= Kg m-2
s-1
; volume = m3m
-2s
-1). Generally, mean values for CO2 exhalation
are 3.7 x 10⁻⁷
m3m
-2s
-1 (de Jong and Schappert, 1972) or 0.4 – 4 x 10
-7 m
3m
-
2s
-1 (Kanemasu et al., 1974).
2. SAMPLING AND ANALYSIS
Many techniques are used to sample soil-gases, waters for dissolved gas
determination and gas/water from submarine gas emission points. Samplings
were performed using well tested methods (Lombardi & Reimer; 1990;
Bertrami et al., 1990; Hutchinson and Livingston, 1993; Matthias et al.,
1980).
2.1 Soil-gases
Soil gas samples are collected from shallow point sources. The soil-gas
survey is generally carried out in the summer during a period of stable
meteorological conditions. A 1m hollow steel probe with a conic point at the
bottom and a sampling port on top is inserted to a depth of 0.5m below the
ground surface. Two 50 cc samples of soil gas are extracted with a syringe
for cleaning the probe, then a soil-gas sample is extracted and stored in an
evacuated 25 ml steel cylinder for laboratory analysis (He, H2, O2, N2, CO2,
CH4 and H2S) by means of a Perkin-Elmer AutoSystem XL gas
chromatograph.
Furthermore, soil-gas flux measurements have been performed in situ by
means of an accumulation chamber (volume: 50 litres) set on the ground in
such a way as to eliminate the input of atmospheric air. Every five minutes a
gas sample is extracted from an external septum located on the top of the
chamber and analysed in loco using a portable gas chromatograph. These
measurements result in an accumulation curve which can be used to
calculate soil gas flux.
2.2 Dissolved gases in water
The method used is based on the partitioning equilibrium of gases
between liquid and gas phases. It is possible to derive the initial
concentrations of the gases dissolved in the liquid phase from concentrations

178 Voltattorni, Caramanna, Cinti, Galli, Pizzino and Quattrocchi
in the gas phase, using the partitioning coefficients of the different species
(Capasso & Inguaggiato, 1998). Samples are collected in glass flasks sealed
with gas-tight rubber/teflon plugs. In the laboratory, 10 cc of pure argon are
injected into the flask drawing out the equivalent water volume through a
needle, thus leaving the apparatus at atmospheric pressure. Since dissolved
gases can be under or over saturated in natural water samples it is necessary
to restore atmospheric pressure inside the flask before extraction. This is
obtained by adding or removing a few ml of water by connecting the flask
upside down to a tube filled with water open to the atmosphere. After
restoring the sample to standard conditions (25°C, 1 atm) and shaking it for
5 min, a portion of gas is drawn for gas chromatography analysis by means
of a Perkin-Elmer AutoSystem XL gas chromatograph.
2.3 Submarine fluid sampling
To collect gas samples a plastic funnel (30 cm diameter) is placed (with a
12 kg ballast around the lower ring) on the gas vent. Then the funnel is
connected to a glass flask filled with air at a pressure which is greater than
the expected hydrostatic pressure to prevent sea water from entering the
sample. This system allows one to change flasks underwater in order to
collect multiple samples for each vent. The same device is also used to
collect gas samples in NaOH-filled flasks. In this case the external section of
the flask valve is filled with distilled water to avoid sea water contamination.
A traditional glass sampler, filled with water collected close to the vent, is
used for dissolved gas. In regards to hot water sampling from underwater
springs, the main difficulty is due to the low water flux. In order to avoid
seawater contamination, a evacuated glass flask connected to a steel hose is
used. Once the hose is fixed in the spring outlet, a 60 cl syringe connected
by a 3 way valve, is used to expel the seawater from the hose and then fill
the evacuated flask with only the geothermal water. In this case, seawater
contamination is as low as reasonably achievable.
3. GEOLOGICAL SETTINGS OF STUDIED AREAS
Three Italian sites are considered here to show different geological
scenarios with natural CO2 gas accumulations and emissions. Both the
Panarea (Aeolian islands, Southern Italy) and Solfatara (Phlegraean fields,
Southern Italy) areas are characterised by volcanic activity, whilst the Telese
area hosts one of the most seismically active segments of the southern
Apennine belt.
Natural CO2 Emissions in Different Italian Geological Scenarios 179
3.1 Panarea island (Aeolian islands, Southern Italy)
Panarea Island belongs to the Aeolian Arc, a volcanic structure extending
for about 200 km along the north-western side of the Calabro-Peloritano
block. This is a fragment of the Hercynian-Alpine orogenic belt (consisting
of various types of metamorphic, sedimentary and intrusive rocks) that
detached from the Corsica-Sardinia block and migrated south-eastward to its
present position during the opening of the Tyrrhenian Sea. The exposed
volcanic activity took place entirely during the Quaternary, from about 400
ka to the present (Gillot, 1987). The distribution of volcanoes is strongly
controlled by regional fault systems which are oriented E-W, NW-SE and
NE-SW. Seismic studies reveal a crust of about 20-25 km beneath the
Aeolian arc (Gasparini et al., 1982; Barca and Ventura, 1991, and references
therein) which indicates mantle upwelling.
The volcano of Panarea is a cone shaped edifice, rising from a depth of
1700-1200 m below sea level up to 421 m above sea level; its maximum
diameter is about 20 km (Gabbianelli et al., 1993). The emergent rocks form
the main island of Panarea and a number of islets. The submerged summit of
the volcano is characterised by a broad and almost flat surface covering about
50 km2 at an average depth of 100-150 m below sea level.
3.2 The Solfatara area (Phlegraean fields, Southern
Italy)
The ancient Romans were aware of the Solfatara of Pozzuoli (located
near the centre of the Phlegraean caldera) since Imperial times. Strabone (66
B.C. -24 A.C.) gives the most ancient written testimony, indicating it in his
work “Strabonis geographica” with the name “Forum Vulcani”, which
means dwelling of the god Vulcano, entrance to Hades. The Solfatara is a
sub-circular depression with a 12 km diameter. It originated about 35 ka BP
after the eruption of the Campanian Ignimbrite (Rosi et al., 1984). The
Phlegraean Fields magmatic system is still active, as the last eruption
occurred in 1538 A.D. at Monte Nuovo. Faults affecting the Phlegraean
Fields caldera follow two preferred strikes, NW-SE and NE-SW, that also
affect the Campanian Plain and the inner sectors of the Apennine belt
(Hyppolite et al., 1994; Orsi et al., 1996). The most impressive thermal
manifestations (including fumaroles, mud pools and vigorously boiling
pools) are located in the Solfatara area. The Bocca Grande (Large Mouth) is
the name of the main fumarole and it has water vapour temperatures
reaching approximately 160°C. Within the mouth, the vapour condensate
contains salts such as realgar (AsS), cinnabar (HgS) and arsenic sulphide
(As2S3) which give a yellow-reddish colour to the surrounding rocks. In the

180 Voltattorni, Caramanna, Cinti, Galli, Pizzino and Quattrocchi
middle of the Solfatara area a bubbling mud pit (called “La Fangaia”) is
made up of rainwater and vapour condensation.
3.2.1 Bradyseism phenomenon in the Solfatara area
From 1969-72 and 1982-84 the inhabitants of the Phlegraean area, and
Pozzuoli in particular, were witness to and victims of a phenomenon where
the earth's surface rose; within a few months the ground level rose by 3.5
metres. This phenomenon is called bradyseism, which is literally a slow
movement of the earth's surface as opposed to the fast movement due to an
earthquake. Deformation connected with bradyseism is due to chemical and
physical variations linked to the evolution of the volcanic system in the
Phlegraean Fields; this produces an increase in temperature and pressure in
the rock above the magma chamber. The increase in pressure translates into
a variation in stresses in the rock which leads to the characteristic lifting of
the ground surface. The place which shows the best evidence of Phlegraean
bradyseism over the centuries is the macellum (a market of Roman period,
better known as the Temple of Serapide) situated close to the port of
Pozzuoli (Fig. 1). On the columns of this building there are holes made by
lithodomes (sea molluscs living in coastal areas between high and low tide
line) which provide evidence of the variations in ground level relative to sea
level from the IV century A.D. onwards.
Figure 1. The “Macellum” (Temple of Serapide) within the Phlegrean Fields: at the left a
view during the 1960’s showing that the area was below sea level. At the right, the same site
today. Remains of the ancient buildings provide evidence of the ground level variations due to
bradyseism thanks to holes made by lithodomes, sea mollusks living between high and low
tide line.
3.3 The Telese area (Southern Italy)
The studied area belongs to the Sannio-Matese zone, one of the most
active seismic regions of the southern Apennines, where destructive
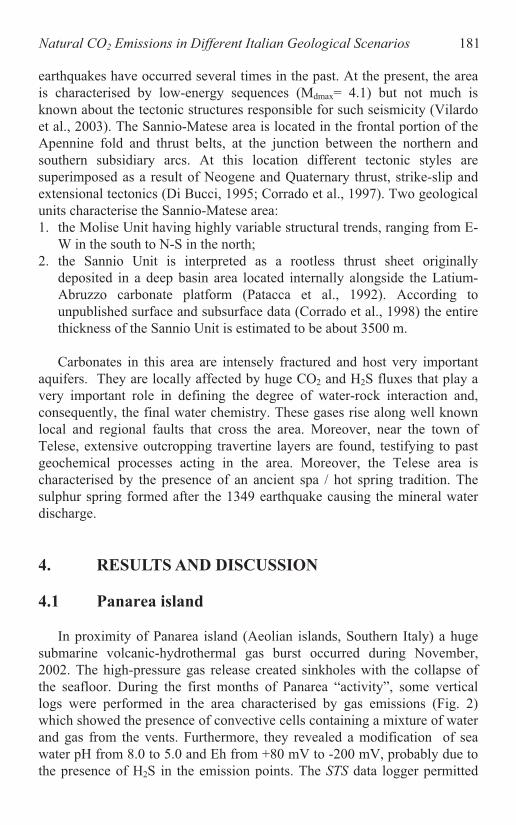
Natural CO2 Emissions in Different Italian Geological Scenarios 181
earthquakes have occurred several times in the past. At the present, the area
is characterised by low-energy sequences (Mdmax= 4.1) but not much is
known about the tectonic structures responsible for such seismicity (Vilardo
et al., 2003). The Sannio-Matese area is located in the frontal portion of the
Apennine fold and thrust belts, at the junction between the northern and
southern subsidiary arcs. At this location different tectonic styles are
superimposed as a result of Neogene and Quaternary thrust, strike-slip and
extensional tectonics (Di Bucci, 1995; Corrado et al., 1997). Two geological
units characterise the Sannio-Matese area:
1. the Molise Unit having highly variable structural trends, ranging from E-
W in the south to N-S in the north;
2. the Sannio Unit is interpreted as a rootless thrust sheet originally
deposited in a deep basin area located internally alongside the Latium-
Abruzzo carbonate platform (Patacca et al., 1992). According to
unpublished surface and subsurface data (Corrado et al., 1998) the entire
thickness of the Sannio Unit is estimated to be about 3500 m.
Carbonates in this area are intensely fractured and host very important
aquifers. They are locally affected by huge CO2 and H2S fluxes that play a
very important role in defining the degree of water-rock interaction and,
consequently, the final water chemistry. These gases rise along well known
local and regional faults that cross the area. Moreover, near the town of
Telese, extensive outcropping travertine layers are found, testifying to past
geochemical processes acting in the area. Moreover, the Telese area is
characterised by the presence of an ancient spa / hot spring tradition. The
sulphur spring formed after the 1349 earthquake causing the mineral water
discharge.
4. RESULTS AND DISCUSSION
4.1 Panarea island
In proximity of Panarea island (Aeolian islands, Southern Italy) a huge
submarine volcanic-hydrothermal gas burst occurred during November,
2002. The high-pressure gas release created sinkholes with the collapse of
the seafloor. During the first months of Panarea “activity”, some vertical
logs were performed in the area characterised by gas emissions (Fig. 2)
which showed the presence of convective cells containing a mixture of water
and gas from the vents. Furthermore, they revealed a modification of sea
water pH from 8.0 to 5.0 and Eh from +80 mV to -200 mV, probably due to
the presence of H2S in the emission points. The STS data logger permitted
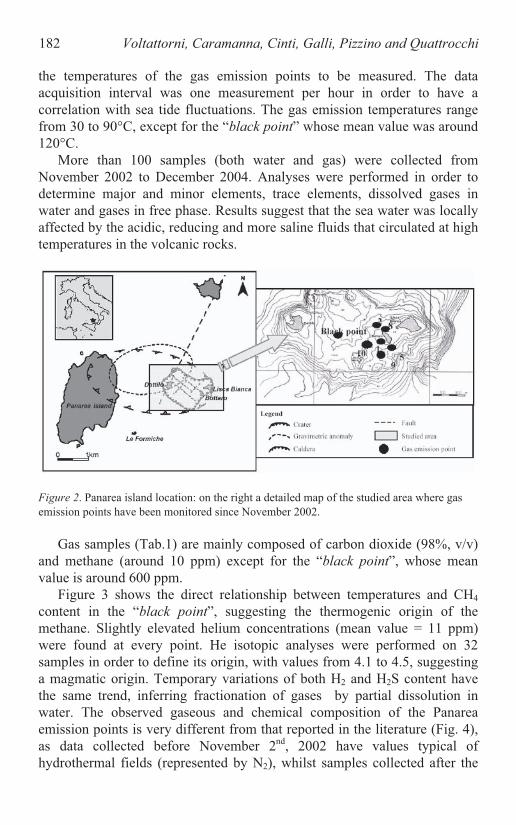
182 Voltattorni, Caramanna, Cinti, Galli, Pizzino and Quattrocchi
the temperatures of the gas emission points to be measured. The data
acquisition interval was one measurement per hour in order to have a
correlation with sea tide fluctuations. The gas emission temperatures range
from 30 to 90°C, except for the “black point” whose mean value was around
120°C.
More than 100 samples (both water and gas) were collected from
November 2002 to December 2004. Analyses were performed in order to
determine major and minor elements, trace elements, dissolved gases in
water and gases in free phase. Results suggest that the sea water was locally
affected by the acidic, reducing and more saline fluids that circulated at high
temperatures in the volcanic rocks.
Figure 2. Panarea island location: on the right a detailed map of the studied area where gas
emission points have been monitored since November 2002.
Gas samples (Tab.1) are mainly composed of carbon dioxide (98%, v/v)
and methane (around 10 ppm) except for the “black point”, whose mean
value is around 600 ppm.
Figure 3 shows the direct relationship between temperatures and CH4
content in the “black point”, suggesting the thermogenic origin of the
methane. Slightly elevated helium concentrations (mean value = 11 ppm)
were found at every point. He isotopic analyses were performed on 32
samples in order to define its origin, with values from 4.1 to 4.5, suggesting
a magmatic origin. Temporary variations of both H2 and H2S content have
the same trend, inferring fractionation of gases by partial dissolution in
water. The observed gaseous and chemical composition of the Panarea
emission points is very different from that reported in the literature (Fig. 4),
as data collected before November 2nd
, 2002 have values typical of
hydrothermal fields (represented by N2), whilst samples collected after the

Natural CO2 Emissions in Different Italian Geological Scenarios 183
recent gaseous emission have concentrations typical of volcanic fields (high
He concentrations). This data suggests an evolution of the system
controlling the Panarea emissions.
Table 1. Mean values of gases emitted at Panarea island.
Gas species Mean value
CO2 (vol., %) 98
CH4 (ppm) 10
N2 (vol. %) 0.4
He (ppm) 11
H2 (ppm) 1100
H2S (vol. %) 2.2
Figure 3. Comparison between methane (%, v/v) and temperature variations (°C) at the
“black point” (Panarea island). The observed direct relationship infers a thermogenic origin
of the methane gas.
4.2 The Solfatara area
The Solfatara area has been characterized by intense and diffuse
fumarolic and hydrothermal activity since Roman times. The area was
investigated by means of a detailed soil-gas survey in the inter crater sector,
during which 32 soil gas flux measurements (1 sample/100 m) were carried
out using an accumulation chamber and a portable gas-chromatograph. CO2
is typically 1127.32 gr/m2*d, although the highest flux values were found in
the “La fangaia” and near the “Bocca Grande” and ”Bocca Nuova”
fumaroles. These fumaroles have the highest outlet temperatures (145°-
165°C) amongst the several fumaroles present in the area (mean discharge
temperature = 100°C). Fumarole effluents have similar chemistry, with H2O
as the main component, followed by CO2 and H2S (Chiodini et al., 2001).

184 Voltattorni, Caramanna, Cinti, Galli, Pizzino and Quattrocchi
Figure 4. Ternary diagram (N2-He-CH4) for gas samples at Panarea island. Data from the
literature (white dots, Italiano & Nuccio, 1991) have values typical of hydrothermal fields,
whilst samples collected from November 2002 to December 2004 have concentrations typical
of volcanic field suggesting an evolution of the system controlling Panarea emissions.
Based on their stable isotopes, the fumarole fluids were interpreted as
magmatic fluids which are variably contaminated by metamorphic and
meteoric components (Panichi & Volpi, 1999; Allard et al., 1991b). On the
basis of outlet temperatures and the content of H2O, CO2 and of un-reactive
gases (i.e., Ar, N2 and He) from fumarole fluids it was possible to estimate
the flux of steam and thereby the heat flux involved in the diffusive
degassing process. Chiodini et al. (2001) calculated that the entire Solfatara
area releases 1500 t/d of hydrothermal CO2 through diffusive degassing. The
contour map (Fig. 5) shows an area of about 0.5 km2 of high CO2 values
representing an important diffuse degassing structure crossed by a NW-SE
band of low fluxes. The highest CO2 values overlap with faults and
fractures, confirming that the degassing process is strictly related to tectonic
structures. In fact, the area is characterised by a regional extensional tectonic
feature and by transverse structures considered as transfer faults along which
the main regional volcanoes are located (Acocella et al., 1999).
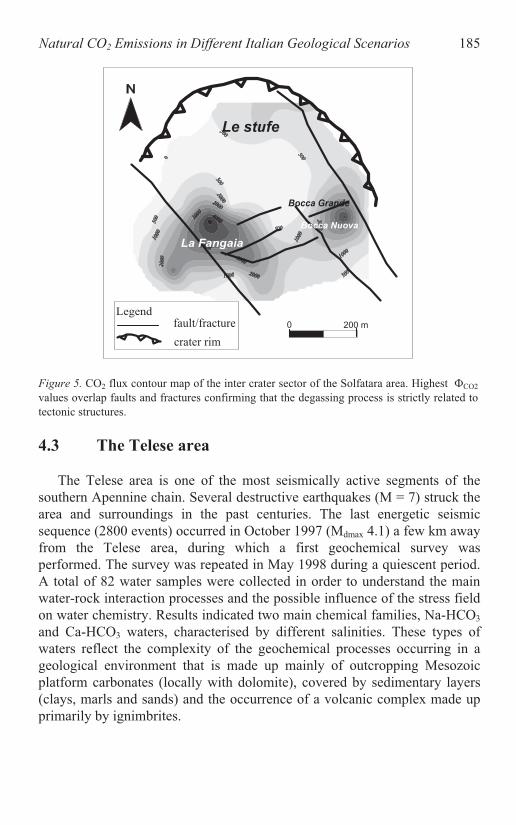
Natural CO2 Emissions in Different Italian Geological Scenarios 185
Le stufe
0 200 m
La Fangaia
Bocca Nuova
Bocca Grande
fault/fracture
crater rim
Legend
Figure 5. CO2 flux contour map of the inter crater sector of the Solfatara area. Highest CO2
values overlap faults and fractures confirming that the degassing process is strictly related to
tectonic structures.
4.3 The Telese area
The Telese area is one of the most seismically active segments of the
southern Apennine chain. Several destructive earthquakes (M = 7) struck the
area and surroundings in the past centuries. The last energetic seismic
sequence (2800 events) occurred in October 1997 (Mdmax 4.1) a few km away
from the Telese area, during which a first geochemical survey was
performed. The survey was repeated in May 1998 during a quiescent period.
A total of 82 water samples were collected in order to understand the main
water-rock interaction processes and the possible influence of the stress field
on water chemistry. Results indicated two main chemical families, Na-HCO3
and Ca-HCO3 waters, characterised by different salinities. These types of
waters reflect the complexity of the geochemical processes occurring in a
geological environment that is made up mainly of outcropping Mesozoic
platform carbonates (locally with dolomite), covered by sedimentary layers
(clays, marls and sands) and the occurrence of a volcanic complex made up
primarily by ignimbrites.
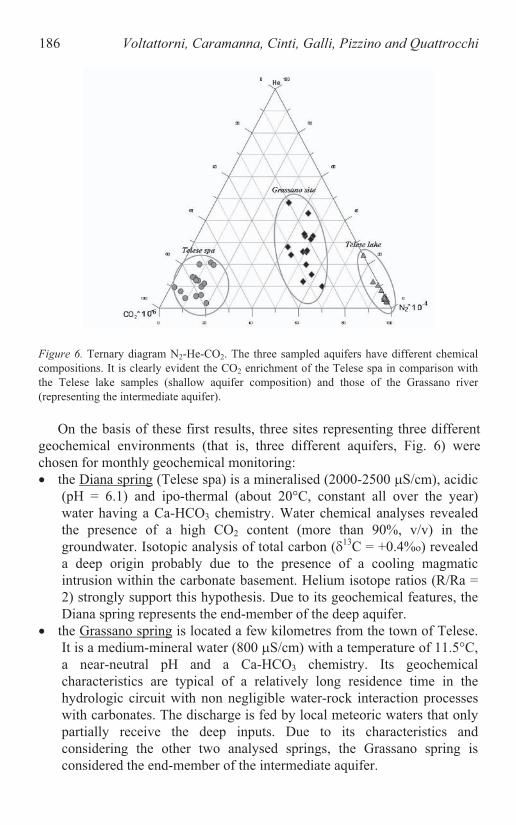
186 Voltattorni, Caramanna, Cinti, Galli, Pizzino and Quattrocchi
Figure 6. Ternary diagram N2-He-CO2. The three sampled aquifers have different chemical
compositions. It is clearly evident the CO2 enrichment of the Telese spa in comparison with
the Telese lake samples (shallow aquifer composition) and those of the Grassano river
(representing the intermediate aquifer).
On the basis of these first results, three sites representing three different
geochemical environments (that is, three different aquifers, Fig. 6) were
chosen for monthly geochemical monitoring:
the Diana spring (Telese spa) is a mineralised (2000-2500 S/cm), acidic
(pH = 6.1) and ipo-thermal (about 20°C, constant all over the year)
water having a Ca-HCO3 chemistry. Water chemical analyses revealed
the presence of a high CO2 content (more than 90%, v/v) in the
groundwater. Isotopic analysis of total carbon (13
C = +0.4%o) revealed
a deep origin probably due to the presence of a cooling magmatic
intrusion within the carbonate basement. Helium isotope ratios (R/Ra =
2) strongly support this hypothesis. Due to its geochemical features, the
Diana spring represents the end-member of the deep aquifer.
the Grassano spring is located a few kilometres from the town of Telese.
It is a medium-mineral water (800 S/cm) with a temperature of 11.5°C,
a near-neutral pH and a Ca-HCO3 chemistry. Its geochemical
characteristics are typical of a relatively long residence time in the
hydrologic circuit with non negligible water-rock interaction processes
with carbonates. The discharge is fed by local meteoric waters that only
partially receive the deep inputs. Due to its characteristics and
considering the other two analysed springs, the Grassano spring is
considered the end-member of the intermediate aquifer.

Natural CO2 Emissions in Different Italian Geological Scenarios 187
the Telese Lake is a small, 17 m deep lake located about 1 km away from
the town of Telese; the water has a medium-low value of salinity (TDS =
0.3 g/l), an alkaline pH (8.0-8.5) and a Ca-HCO3 chemistry. Water
temperature, at the surface, is linked to seasonal variations, ranging from
6°C in the winter up to 25°C or more during the summer. All reported
chemical features, together with a dissolved gas content very similar to
ASW (Air Saturated Water), define this water as a shallow one without
deep input. For these reason, this represents the shallowest hydrologic
circuit presently discharging in the studied area.
Several studies on the monitoring of gas content in waters for seismic
prediction suggest that during phases preceding or following seismic energy
release rocks undergo physical-structural variations which favour the
mobilization of deep fluids, such as CO2 and H2 (Wakita et al., 1985; Honda
et al., 1982; Lombardi, 1981). In view of these researches, monthly water
sampling in the Telese area and surroundings have the primary goal to detect
eventual relationships between seismic activity and chemical/geochemical
variations in the aquifers. In figure 7 results from the Diana spring (Telese
spa) monitoring (April 2003-October 2004) are reported. The graph clearly
highlights the different behaviour of dissolved CO2 in comparison with
dissolved H2 observed during the sampling.
Figure 7. H2 versus CO2 content at the Telese spa (Diana spring). It is interesting to note that
in correspondence with earthquakes (the two arrows) H2 and CO2 contents change. The shaded
rectangle indicates a three-month period of small earthquakes during which the H2 and CO2
contents undergo a slight increase.
The two arrows in the graph indicate the correspondence between
earthquakes and H2 and CO2 content trends. The June survey was performed
188 Voltattorni, Caramanna, Cinti, Galli, Pizzino and Quattrocchi
17 days after an earthquake (Md = 4.1) occurred in the adjacent Molise
region, at a distance of about 70 km from Telese. Another earthquake (Md =
4.2) occurred on December, 16th, 2003 in the same area. A geochemical
survey was performed 15 days before this earthquake. During June-
September 2004, a sequence of small earthquakes (Mmax = 4.1) in an area just
100 km away from the studied sites took place. During the same period an
increase of both dissolved H2 and CO2 content was observed (Fig. 7, shaded
rectangle). It is worth noting that in the period January-May 2004 no
earthquakes with M 4.0 occurred within 100 km from the Telese area
(INGV, 2004) and, in the same period, dissolved H2 has an almost constant
trend.
5. CONCLUSIONS
The main purpose of this paper is to show some results from areas
characterised by natural accumulations and emissions of CO2. These areas
represent interesting natural analogues for the study and prediction of the
possible consequences of leakage from geological sequestration sites of
anthropogenic CO2 (i.e., the return to surface, potentially causing localised
environmental problems).
Three Italian sites, representing different geological scenarios, were
described. All these sites are linked to migration towards the surface of
significant quantities of carbon dioxide. In particular, two of these sites are
densely populated but people have learned to live with CO2 gas emissions
since ancient Roman times and, for this reason, they have even tried to
exploit them. Nowadays the above mentioned areas are constantly monitored
in order to study the temporal evolution of different phenomena. In
particular, the aim of our research is to evaluate and mitigate risks for local
populations, taking into account several factors controlling CO2 emissions
and studying the gas behaviour in time and space. To date, the obtained
results suggest that gas uprising is generally well localised around restricted
areas, often controlled by local tectonics (faults and/or fractures). This
implies that, in the frame of geological CO2 sequestration, it is necessary to
carefully assess the presence of pathways (fault and/or fractures) that might
allow the migration of CO2 out of the reservoir.

Natural CO2 Emissions in Different Italian Geological Scenarios 189
REFERENCES
Acocella, V., Salvini, F., Funiciello, R., and Faccenna, C., 1999, The role of transfer
structures on volcanic activity at Campi Flegrei (Southern Italy), J. Volcan. Geotherm.
Res., 91:123-139.
Allard, P., Carbonelle, J., Dajlevic, D., Le Bronec, J., Morel, P., Robe, M. C., Maurenas J.M.,
Faivre-Pierret R., Martin D., Sabroux J.C., and Zettwoog P., 1991a, Eruptive and diffusive
emissions of CO2 from Mount Etna, Nature, 351:387-391.
Allard, P., Maiorani, A., Tedesco, D., Cortecci, G., and Turi, B., 1991b, Isotopic study of the
origin of sulphur and carbon in Solfatara fumaroles, Campi Flegrei caldera, J. Volcanol.
Geotherm. Res., 48:139-159.
Barca, D., and Ventura, G., 1991, Evoluzione vulcano-tettonica dell’isola di Salina
(Arcipelago delle Eolie), Mem. Soc. Geol. Ital., 47:401-415.
Baubron, J. C., Allard, P., and Toutain, J. P., 1990, Diffusive volcanic emissions of carbon
dioxide from Vulcano Island , Italy, Nature, 344:51-53.
Bertrami, R., Buonasorte, G., Ceccarelli, A., Lombardi, S., Pieri, S., and Scandiffio, G., 1990,
Soil Gases in Geothermal Prospecting: Two Case Histories (Sabatini Volcanoes and Alban
Hills, Latium, Central Italy), J. Geoph. Res., 9:21,475-21,481.
Capasso, G., and Inguaggiato, S., 1998, A simple method for the determination of dissolved
gases in natural waters: An application to thermal waters from Volcano Island, Applied
Geochemistry, 13(5):631-642.
Chiodini, G., Cioni, R., Guidi, M., Raco, B., and Marini, L., 1998, Soil CO2 flux
measurements in volcanic and geothermal areas, Applied Geochemistry, 13(5):543-552.
Chiodini, G., Frondini, F., Cardellini, C., Granirei, D., Marini, L., and Ventura, G., 2001, CO2
degassing and energy release at Solfatara volcano, Campi Flegrei, Italy. J. Geoph. Res.,
106(8):16216-16221.
Corrado, S., Di Bucci, D., Naso, G., and Butler, R. W. H., 1997, Thrusting and strike-slip
tectonics in the Alto Molise region (Italy): implications for the Neogene-Quaternary
evolution of the Central Apennine Orogenic System, J. Geol. Soc. London, 154:679-688.
Corrado, S., Di Bucci, D., Naso, G., Giampaolo, C., and Adatte, T., 1998, Application of the
organic matter and clay mineral studies to the tectonic history of the Abruzzo-Molise-
Sannio area, Central Apennines, Italy, Tectonophysics, 285:167-181.
de Jong, E., and Schappert, H. J. V., 1972, Calculation of soil respiration and activity from
CO2 profiles in the soil, Soil Science, pp. 328-333.
Di Bucci, D., 1995, Rapporti tra piattaforme carbonatiche e “Alloctono” lungo la media valle
del Sangro, Mem. Soc. Geol. Ital., 114:443-463.
Gabbianelli, G., Romagnoli, C., Rossi, P.L., and Calanchi, N., 1993, Marine geology of the
Panarea-Stromboli area (Aeolian Arcipelago, Southeastern Tyrrenhian Sea). Acta
Volcanol., 3:11-20.
Gasparini, P., Iannaccone, G., Scandone, P., and Scarpa, R., 1982, The seismotectonic of the
Calabrian Arc. Tectonophysics, 84:267-287.
Gillot, P. Y., 1987, Histoire volcanique des Iles Eoliennes:Arc insulaire ou complexe
orogenique anulaire ?, D. T. IGAL 11, 35-42.
Gurrieri, S., and Valenza, M., 1988, Gas transport in natural porous mediums: a method for
measuring CO2 flows from the ground in volcanic and geothermal areas, Rend. Soc. Ital.
Mineral. Petrologia, 43:1151-1158.
Honda, M., Kurita, K., Hamano, Y., and Ozima, M., 1982, Experimental studies of He and Ar
degassing during rock fracturing, Earth Planet. Sci. Lett., 51:206-214.

190 Voltattorni, Caramanna, Cinti, Galli, Pizzino and Quattrocchi
Hutchinson, G. L., and Livingston, G. P., 1993, Use of chamber systems to measure trace gas
fluxes, American Society of Agronomy, special publication, 55.
Hyppolite, J., Angelier, J., and Roure, F., 1994, A major change revealed by quaternary stress
patterns in the Southern Apennines, Tectonophysics, 230:199-210.
INGV (2004) – Seismological report
Italiano, F., and Nuccio, P. M., 1991, Geochemical investigations of submarine volcanic
exhalations to the east of Panarea, Aeolian Islands, Italy, J. Volcan. Geoth. Res., 46(1-
2):1-185.
Kanemasu, E. T., Powers, W. L., and Sij, J. W., 1974, Field chamber measurements of CO2
flux from soil surface, Soil Science, 118(4):233-237.
Lombardi, S., 1981, Variazione del tenore in elio in alcune manifestazioni sorgive e gassose
della valle del Sele nel periodi immediatamente successivo all’evento sismico del
23/11/1980, Rend. Soc. Geol. Ital., 4.
Lombardi, S., and Reimer, G. M., 1990, Radon and Helium in soil gases in the Phlegrean
fields, central Italy, Geoph. Res. Let., 17(6):849-852.
Matthias, A. D., Blackmer, A. M., and Bremner, J. M., 1980, A simple chamber technique
for field measurements of emissions of nitrous oxide from soils, J. Envir. Qual., 9(2): 251-
256.
Orsi, G., De Vita, S., and Di Vito, M., 1996, The restless, resurgent Campi Flegrei nested
caldera (Italy): constrains on its evolution and configuration, J. Volcanol. Geotherm. Res.,
74:179-214.
Panichi, C., and Volpi, G., 1999, Hydrogen, oxygen and carbon isotope ratios of Solfatara
fumaroles (Phlegrean Fields, Italy): further insight into source processes, J. Volcanol.
Geotherm. Res., 91:321-328.
Patacca, E., Scandone, P., Bellatalla, M., Perilli, N., and Santini, U., 1992, The Numidian-
sand event in the Southern Apennines, Mem. Soc. Geol. Padova, 43:297-337.
Rosi, M., and Santacroce, R., 1984, Volcanic hazard assessment in the Phlegrean Fields: a
contribution based on stratigraphic and hystorical data, Bull. Volcanol., 47:359-370.
Scheidegger, A. E., 1974, The physics of flow through porous media, University of Toronto
Press, Toronto, 353p.
Vilardo, G., Nappi, R., Petti, P., and Ventura, G., 2003, Fault geometries from the space
distribution of the 1990-1997 Sannio-Benevento earthquakes: interferences on the active
deformation in Southern Apennines, Tectonophysics, 363:259-271.
Wakita, H., Nakamura, Y., and Sano, Y., 1985, Groundwater radon variations reflecting
changes in regional stress field, Earthq. Predict. Res., 3:545-557.
NATURAL LEAKAGE OF HELIUM FROM
ITALIAN SEDIMENTARY BASINS OF THE
ADRIATIC STRUCTURAL MARGIN
Perspectives for geological sequestration of carbon dioxide
G. Ciotoli1, S. Lombardi
1 and F. Zarlenga
2
1Earth Sciences Department, University of Rome “La Sapienza”, Rome, Italy;
2ENEA-Cr-
Casaccia- Prot/Prev, Italy
Abstract: Soil gas surveys were performed along the Adriatic foredeep (Vasto,
Ferrandina, Pisticci basins), in order to evaluate the relationship between
neotectonics and gas leakage from hydrocarbon reservoirs. More than 4000
soil gas samples were collected in the area and analyzed for helium, which is a
good fracture tracer due to its chemical inertness and high mobility.
Furthermore, helium is enriched in more than 90% of known reservoirs, and
displays many characteristics of the ideal geochemical tracer for buried faults
and gas and oil reservoirs (abiogenic, non-reactive, and mobile). Statistical
analysis shows an average helium concentration of 5.7 ppm in the foredeep
basin areas (atmospheric value is 5.2 ppm). This value is higher than that
calculated using over 30,000 soil gas samples collected throughout Italy in
different geological scenarios (about 5.4 ppm). Results obtained using a
geostatistical approach are consistent with the presence of high helium
concentrations as linear or spot anomalies due to irregular, channelled flow
along faults above hydrocarbon accumulations. Considering the Plio-Miocene
age of the Adriatic foredeep reservoirs, the magnitude of these diffuse gas
microseepages highlights that losses from hydrocarbon reservoirs should be
low. Results indicate that despite the fact that the area is heavily faulted and
that gas seepage has occurred from the reservoir over geological periods of
time, no environmental effects are observed at surface. This fact lends support
to the idea that geological sequestration of CO2 within a less structurally-
active area would result in the safe, long-term isolation of this green-house
gas.
Key words: soil gas geochemistry, tracer, helium, safety and monitoring of CO2 geological
sequestration sites
191
S. Lombardi et al. (eds.),
Advances in the Geological Storage of Carbon Dioxide, 191–202.
© 2006 Springer. Printed in the Netherlands.
192 Ciotoli, Lombardi and Zarlenga
1. INTRODUCTION
In this research helium soil gas concentrations have been considered as a
tracer of gas microseepage through thousands of meters of fractured and/or
faulted overburden . Helium is a good fracture tracer because it is chemically
inert, physically stable, highly insoluble in water, and as such it is highly
mobile (Pogorski and Quirt, 1981; Oliver et al., 1984). Helium migration, as
well as other gases, occurs primarily by advection or diffusion from deep
accumulations (geothermal fluids, uraniferous ore and in 90% of known
hydrocarbon reservoirs) towards the surface along permeable fault and
fracture systems (Eremeev et al., 1973; Lombardi and Reimer, 1990;
Duddridge et al., 1991; Ciotoli et al., 1998). Its distribution in soil gas
depends on the permeability of the rocks, depth of origin, the presence of
intersecting structures, and the influence of near-surface conditions such as
groundwater flow, weathering, etc. The concentration of helium in the
atmosphere is constant (5220+/-15 ppb; Holland & Emerson, 1990) as the
result of the dynamic budget between degassing helium and helium diffusion
into space.
Extensive experience in soil-gas prospecting by the authors indicates that
helium soil-gas anomalies generally occur as linear, fault-linked anomalies,
irregularly-shaped diffuse or “halo” anomalies and irregularly-spaced
plumes or “spot anomalies” (Lombardi et al., 1996; Ciotoli, 1997; Ciotoli et
al., 1997, 1999). These features reflect gas migration dominated by brittle
deformation, both at the macro and/or micro scale. Linear anomalies longer
than several hundreds of meters are often taken as strong evidence of
tectonic control of gas migration along gas-bearing faults, (Ciotoli et al.,
1998). It is important to realize that most faulted areas consist of fault
intersections and extensive microfractures that allow gases to escape
laterally and vertically, producing “halo” or diffuse anomaly. Furthermore,
recent research has demonstrated how the gas-bearing properties of faults are
not necessarily continuous along a tectonic structure (Ciotoli et al., 1998). In
these cases isolated points with high concentration values (“spotty
anomalies”) are frequently observed in soil gas distributions. When multiple
“spot” anomalies occur along a linear trend, one can infer that they lie along
a structural feature which has spatially discontinuous gas-transport
properties (Lombardi et al., 1996; Ciotoli et al., 1998) (Fig.2).
Since helium is more soluble in oil than in water, oil-water mixing will
result in the preferential partitioning of helium into oil, thus the surface
distribution of helium (similarly to those for hydrocarbon gases) can indicate
the presence of underground helium reservoirs in which petroleum may also
be found (Zartman et al., 1961; Cunningham, 1988). For example, the
helium distribution above the Eldingen oil field in Germany is thought to be
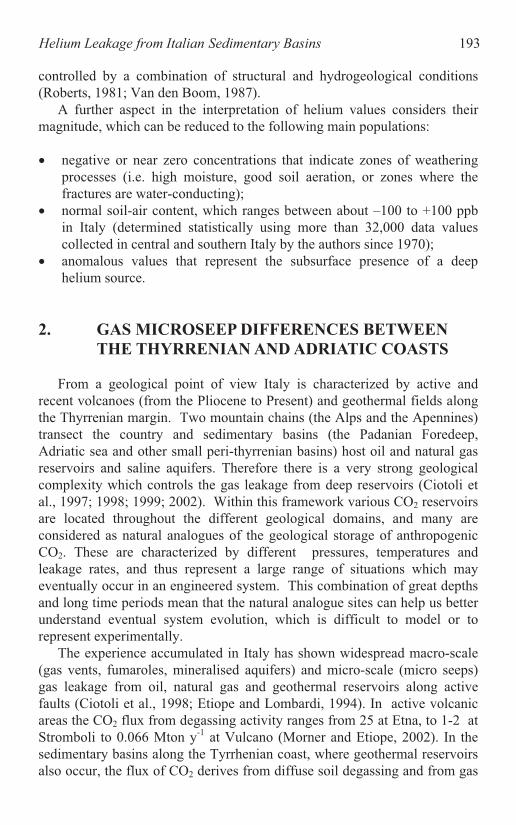
193
controlled by a combination of structural and hydrogeological conditions
(Roberts, 1981; Van den Boom, 1987).
A further aspect in the interpretation of helium values considers their
magnitude, which can be reduced to the following main populations:
negative or near zero concentrations that indicate zones of weathering
processes (i.e. high moisture, good soil aeration, or zones where the
fractures are water-conducting);
normal soil-air content, which ranges between about –100 to +100 ppb
in Italy (determined statistically using more than 32,000 data values
collected in central and southern Italy by the authors since 1970);
anomalous values that represent the subsurface presence of a deep
helium source.
2. GAS MICROSEEP DIFFERENCES BETWEEN
THE THYRRENIAN AND ADRIATIC COASTS
From a geological point of view Italy is characterized by active and
recent volcanoes (from the Pliocene to Present) and geothermal fields along
the Thyrrenian margin. Two mountain chains (the Alps and the Apennines)
transect the country and sedimentary basins (the Padanian Foredeep,
Adriatic sea and other small peri-thyrrenian basins) host oil and natural gas
reservoirs and saline aquifers. Therefore there is a very strong geological
complexity which controls the gas leakage from deep reservoirs (Ciotoli et
al., 1997; 1998; 1999; 2002). Within this framework various CO2 reservoirs
are located throughout the different geological domains, and many are
considered as natural analogues of the geological storage of anthropogenic
CO2. These are characterized by different pressures, temperatures and
leakage rates, and thus represent a large range of situations which may
eventually occur in an engineered system. This combination of great depths
and long time periods mean that the natural analogue sites can help us better
understand eventual system evolution, which is difficult to model or to
represent experimentally.
The experience accumulated in Italy has shown widespread macro-scale
(gas vents, fumaroles, mineralised aquifers) and micro-scale (micro seeps)
gas leakage from oil, natural gas and geothermal reservoirs along active
faults (Ciotoli et al., 1998; Etiope and Lombardi, 1994). In active volcanic
areas the CO2 flux from degassing activity ranges from 25 at Etna, to 1-2 at
Stromboli to 0.066 Mton y-1
at Vulcano (Morner and Etiope, 2002). In the
sedimentary basins along the Tyrrhenian coast, where geothermal reservoirs
also occur, the flux of CO2 derives from diffuse soil degassing and from gas
Helium Leakage from Italian Sedimentary Basins

194 Ciotoli, Lombardi and Zarlenga
vents. The output of diffuse degassing ranges from 7300 ton y-1
km-2
(Cava
deSelci, Alban Hills Volcanic District), to > 73,000 ton y-1
km-2
(Latera,
Sabatinian Volcanic District), to 0.83-1,123 kg m-2
y-1
(in the sedimentary
basins of the Siena Graben). In the case of gas vents the measured output
ranges from 1,800 ton y-1
(at Massa Martana and Montecastello Vibio) to
310,000 ton y-1
(Mefite d’Ansanto). The regionally evaluated output of the
central Apennine chain is 4.4-13.2 x10⁶ ton y
-1 (over 12,564 km
2) (Chiodini
et al., 2000).
3. SOIL GAS DATA FROM THE SEDIMENTARY
BASINS OF THE ADRIATIC FOREDEEP
Soil gas surveys were carried out in different sedimentary basins located
along the Adriatic foredeep (Vasto, Ferrandina, Pisticci basins) in order to
evaluate the relationship between neotectonics and gas leakage from
hydrocarbon reservoirs. In these areas about 5,000 soil gas samples were
collected and analysed. Statistical analysis of soil gas data collected in the
foredeep basins (FB) shows a mean helium concentration of 5.7 ppm
(atmospheric value is 5.2 ppm; Holland and Emerson, 1990). This value is
higher than the mean value (about 5.4 ppm) calculated using over 30000
samples collected throughout Italy in different geological settings (Tab. 1).
Furthermore, it is worth noting that intermontane basins (IB) show the
highest maximum value (315.22 ppm) and have a higher mean value (5.55
ppm) than that of volcanic areas (VA) and neogenic basins (NB) (Tyrrhenian
sedimentary basins). This characteristic is probably linked to the presence in
these zones of active tectonics and seismogenic faults that provide a vertical
pathway for gas migration towards the surface.
Elevated outlier values shift the data distribution toward higher
concentrations, as suggested by the high skewness values (FB, VA and IB).
In contrast, NB shows a more symmetrical data distribution, as suggested by
the low values of standard deviation (0.31) and skewness (0.52), and by the
similar values of the mean (5.39 ppm) and the median (5.37 ppm). The lower
quartile values indicate atmospheric content, and the upper quartile values
generally correspond to the anomaly threshold. Considering the similar
values of the interquartile range (IQR) (50% of data) it is possible to
conclude that in Italy He concentrations higher than about 0.25 -0.30 ppm
can be considered as anomalies.
Figure 1 compares helium concentrations in the Italian peri-Adriatic
basins (Vasto, Pisticci, Agri, Pescara and Ferrandina basins) with data from
the NB and VA. The box plot highlights that the high helium values
observed in the investigated areas are probably linked to deep hydrocarbon

195
reservoirs, as suggested by the similar mean helium values for the various
Vasto and Agri basin sectors. It is worth noting that high helium
concentrations were measured in the Agri basin before the discovery of the
oil field in 1986.
Table 1. Main statistical parameters of helium concentrations in soil gas from different
investigated geological scenarios.
Foredeep Basins
(FB)
Volcanic areas
(VA)
Neogenic Basins
(NB)
Intermontane
Basins (IB)
N 4893 13255 6597 4338
Mean 5.74 5.42 5.39 5.55
Median 5.31 5.34 5.37 5.26
Min 3.82 2.12 1.76 1.2
Max 146.81 127.52 8.82 315.22
LQ 5.22 5.22 5.22 5.15
UQ 5.48 5.5 5.51 5.45
IQR 0.26 0.28 0.29 0.29
Std Dev 5.13 1.51 0.31 5.8
Skewness 20.05 50.83 0.52 42.29
Figure 1. The figure to the right makes a statistical comparison of helium data from different
surveys conducted in Italy by the authors since the 1970’s; survey locations are shown to the
left (modified after Ciotoli et al., 2004). The high helium concentrations detected in the Vasto
basin are comparable to those measured in the Agri basin, in which hydrocarbon
accumulations occur. Note that the mean helium values at Vasto are higher than those
measured in volcanic areas where helium migration and high concentrations are well known
in the literature.
Finally, a comparison of helium anomaly magnitudes with the different
thicknesses of the sedimentary covers occurring in the central and southern
Helium Leakage from Italian Sedimentary Basins
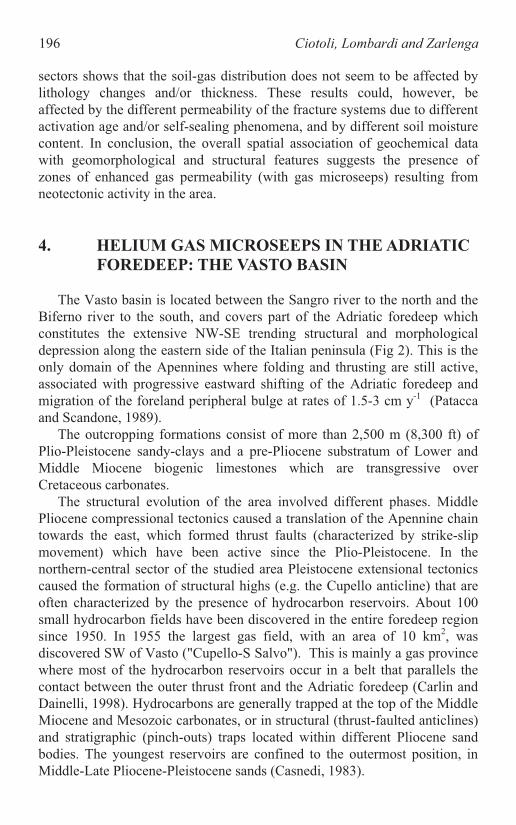
196 Ciotoli, Lombardi and Zarlenga
sectors shows that the soil-gas distribution does not seem to be affected by
lithology changes and/or thickness. These results could, however, be
affected by the different permeability of the fracture systems due to different
activation age and/or self-sealing phenomena, and by different soil moisture
content. In conclusion, the overall spatial association of geochemical data
with geomorphological and structural features suggests the presence of
zones of enhanced gas permeability (with gas microseeps) resulting from
neotectonic activity in the area.
4. HELIUM GAS MICROSEEPS IN THE ADRIATIC
FOREDEEP: THE VASTO BASIN
The Vasto basin is located between the Sangro river to the north and the
Biferno river to the south, and covers part of the Adriatic foredeep which
constitutes the extensive NW-SE trending structural and morphological
depression along the eastern side of the Italian peninsula (Fig 2). This is the
only domain of the Apennines where folding and thrusting are still active,
associated with progressive eastward shifting of the Adriatic foredeep and
migration of the foreland peripheral bulge at rates of 1.5-3 cm y-1
(Patacca
and Scandone, 1989).
The outcropping formations consist of more than 2,500 m (8,300 ft) of
Plio-Pleistocene sandy-clays and a pre-Pliocene substratum of Lower and
Middle Miocene biogenic limestones which are transgressive over
Cretaceous carbonates.
The structural evolution of the area involved different phases. Middle
Pliocene compressional tectonics caused a translation of the Apennine chain
towards the east, which formed thrust faults (characterized by strike-slip
movement) which have been active since the Plio-Pleistocene. In the
northern-central sector of the studied area Pleistocene extensional tectonics
caused the formation of structural highs (e.g. the Cupello anticline) that are
often characterized by the presence of hydrocarbon reservoirs. About 100
small hydrocarbon fields have been discovered in the entire foredeep region
since 1950. In 1955 the largest gas field, with an area of 10 km2, was
discovered SW of Vasto ("Cupello-S Salvo"). This is mainly a gas province
where most of the hydrocarbon reservoirs occur in a belt that parallels the
contact between the outer thrust front and the Adriatic foredeep (Carlin and
Dainelli, 1998). Hydrocarbons are generally trapped at the top of the Middle
Miocene and Mesozoic carbonates, or in structural (thrust-faulted anticlines)
and stratigraphic (pinch-outs) traps located within different Pliocene sand
bodies. The youngest reservoirs are confined to the outermost position, in
Middle-Late Pliocene-Pleistocene sands (Casnedi, 1983).

197
Figure 2. Geological map of the investigated area. Figure also shows the boundaries of the
three sectors (zone 1 - northern sector; zone 2 - central sector; zone 3 - southern sector)
defined to better interpret the helium distribution.
Drilling in the hydrocarbon fields indicates the occurrence of
overpressures up to lithostatic in compartmentalized domains, which are
laterally bounded by thrust faults and vertically trapped by low-permeability
beds. This closed circulation in low-permeability domains is indicative of
thrust faults acting as barriers to meteoric and deep fluids (and to
hydrocarbons) (Ghisetti et al., 2000; Ghisetti and Vezzani, 2002).
Progressive eastward fluid expulsion, connected with the eastward migration
of shortening, is suggested by the west to east migration of gas reservoirs,
and by geochemical indicators like helium.
5. RELATIONSHIPS BETWEEN TECTONICS AND
REGIONAL HELIUM DISTRIBUTION
Helium trend surfaces were calculated (using a 2nd
-degree polynomial
regression) in order to highlight large-scale trends and patterns related to
regional tectonics, such as basins and/or structural highs (Fig 3). The map
shows a clear anisotropic helium distribution, consisting of:
Helium Leakage from Italian Sedimentary Basins
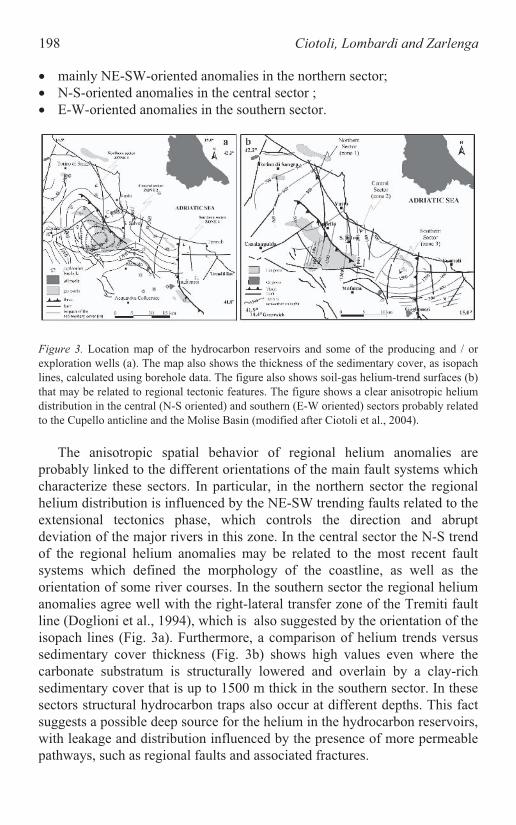
198 Ciotoli, Lombardi and Zarlenga
mainly NE-SW-oriented anomalies in the northern sector;
N-S-oriented anomalies in the central sector ;
E-W-oriented anomalies in the southern sector.
Figure 3. Location map of the hydrocarbon reservoirs and some of the producing and / or
exploration wells (a). The map also shows the thickness of the sedimentary cover, as isopach
lines, calculated using borehole data. The figure also shows soil-gas helium-trend surfaces (b)
that may be related to regional tectonic features. The figure shows a clear anisotropic helium
distribution in the central (N-S oriented) and southern (E-W oriented) sectors probably related
to the Cupello anticline and the Molise Basin (modified after Ciotoli et al., 2004).
The anisotropic spatial behavior of regional helium anomalies are
probably linked to the different orientations of the main fault systems which
characterize these sectors. In particular, in the northern sector the regional
helium distribution is influenced by the NE-SW trending faults related to the
extensional tectonics phase, which controls the direction and abrupt
deviation of the major rivers in this zone. In the central sector the N-S trend
of the regional helium anomalies may be related to the most recent fault
systems which defined the morphology of the coastline, as well as the
orientation of some river courses. In the southern sector the regional helium
anomalies agree well with the right-lateral transfer zone of the Tremiti fault
line (Doglioni et al., 1994), which is also suggested by the orientation of the
isopach lines (Fig. 3a). Furthermore, a comparison of helium trends versus
sedimentary cover thickness (Fig. 3b) shows high values even where the
carbonate substratum is structurally lowered and overlain by a clay-rich
sedimentary cover that is up to 1500 m thick in the southern sector. In these
sectors structural hydrocarbon traps also occur at different depths. This fact
suggests a possible deep source for the helium in the hydrocarbon reservoirs,
with leakage and distribution influenced by the presence of more permeable
pathways, such as regional faults and associated fractures.
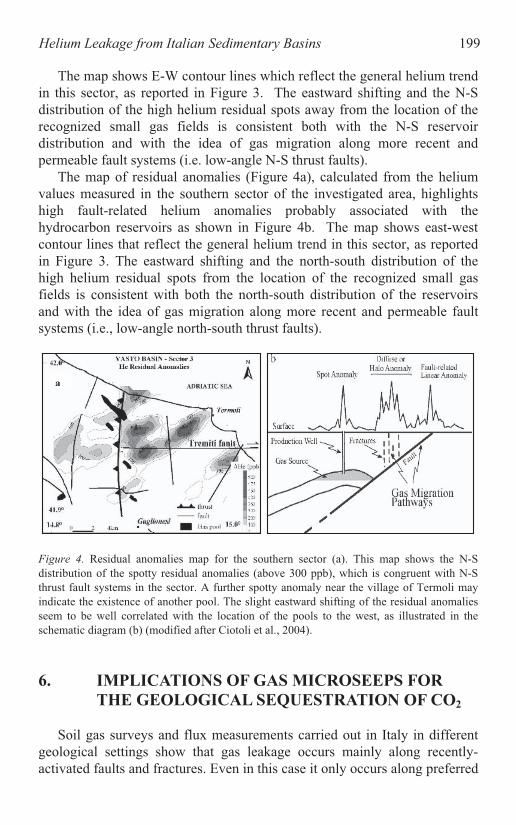
199
The map shows E-W contour lines which reflect the general helium trend
in this sector, as reported in Figure 3. The eastward shifting and the N-S
distribution of the high helium residual spots away from the location of the
recognized small gas fields is consistent both with the N-S reservoir
distribution and with the idea of gas migration along more recent and
permeable fault systems (i.e. low-angle N-S thrust faults).
The map of residual anomalies (Figure 4a), calculated from the helium
values measured in the southern sector of the investigated area, highlights
high fault-related helium anomalies probably associated with the
hydrocarbon reservoirs as shown in Figure 4b. The map shows east-west
contour lines that reflect the general helium trend in this sector, as reported
in Figure 3. The eastward shifting and the north-south distribution of the
high helium residual spots from the location of the recognized small gas
fields is consistent with both the north-south distribution of the reservoirs
and with the idea of gas migration along more recent and permeable fault
systems (i.e., low-angle north-south thrust faults).
a
Figure 4. Residual anomalies map for the southern sector (a). This map shows the N-S
distribution of the spotty residual anomalies (above 300 ppb), which is congruent with N-S
thrust fault systems in the sector. A further spotty anomaly near the village of Termoli may
indicate the existence of another pool. The slight eastward shifting of the residual anomalies
seem to be well correlated with the location of the pools to the west, as illustrated in the
schematic diagram (b) (modified after Ciotoli et al., 2004).
6. IMPLICATIONS OF GAS MICROSEEPS FOR
THE GEOLOGICAL SEQUESTRATION OF CO2
Soil gas surveys and flux measurements carried out in Italy in different
geological settings show that gas leakage occurs mainly along recently-
activated faults and fractures. Even in this case it only occurs along preferred
Helium Leakage from Italian Sedimentary Basins
200 Ciotoli, Lombardi and Zarlenga
pathways and is strongly localized (channelling effects) (Ciotoli et al., 1997,
2002; Lombardi et al., 1996; Lombardi et al., 1993). Even if the quantitative
study of flux across faults is not complete, research performed in clayey
basins, characterized by both extensional and compressive tectonics,
suggests only minor gas escape along the above-mentioned channels. This
hypothesis is also supported by a limited number of gas injection tests
carried out in shallow, faulted and unfaulted clayey sequences (Etiope et al.,
1995; Lombardi et al., 1996; Ciotoli et al., 2003). Considering these results
discussed above the following work is needed to better apply this method for
the geological sequestration of CO2:
define background values of the natural soil gas emissions, in case the
area is eventually used for CO2 storage;
develop new monitoring systems to detect in real time increases in CO2
escaping along vertical migration pathways
7. CONCLUSIONS
Results outlined in the present work show how the integration of near-
surface gas geochemistry with lithology, structural geology and
geomorphology data can be used to better understand the subsurface
distribution of oil and gas reservoirs, even in areas where thick sedimentary
sequences cover and isolate them. However the very fact that gas anomalies
originating from great depths are observed in the shallow soil horizon
implies that, although the structural and stratigraphic traps have resulted in
hydrocarbon accumulation, small scale leakage does occur along the
numerous faults and fractures in this tectonically active and complex area.
That said, these leaks have been found to be spatially restricted and to result
in relatively low levels of gas release to the atmosphere. In regards to the
field of CO2 geological storage these results have three very important
implications. First, leakage is slow and isolated even in a highly faulted
area, giving confidence to the idea that sequestration within un-faulted areas
will be even more safe. Second the soil gas method has been shown to be
well adapted to the twin tasks of site-assessment prior to installation of a
CO2 sequestration site (to look for gas permeable structures) and for
eventual monitoring of the site once injection begins (for carbon credit
auditing and public assurance). Finally although the Italian foredeep region
is clearly not ideal, these results indicate that CO2 sequestration in the aging
hydrocarbon reservoirs of this region (due to various economic and logistical
advantages) may still be feasible if eventual small leakage rates are
acceptable. This conclusion does not, however, take into account the
potential for an earthquake in this region which might result in a larger

201
release, although the long term isolation of the hydrocarbons does not
support this idea.
REFERENCES
Carlin, S., and Dainelli, J., 1998, Pressure regimes and pressure systems in the Adriatic
foredeep (Italy), AAPG Memoire 70: 145-160.
Casnedi, R., 1983, Hydrocarbon-bearing submarine fan-system of Cellino formation, central
Italy: AAPG Bulletin, 67:359-370.
Chiodini, G., Frondini, F., Cardellini, C., Parello, F., Peruzzi, L., 2000, Rate of diffuse carbon
dioxide Earth degassing estimated from carbon balance of regional aquifers: the case of
central Apennine, Italy. J. Geophys. Res. 105(B4): 8423–8434.
Ciotoli, G., 1997, Introduzione di metodi geostatistici nell'interpretazione della distribuzione
dei gas endogeni nei suoli quale contributo alle indagini strutturali: la Piana del Fucino:
Tesi di dottorato, Dipartimento di Scienze della Terra, Università di Roma "La Sapienza",
Roma, Italy, 226 p.
Ciotoli, G., Lombardi, S., Serafini, S., and Zarlenga, F., 1997, The refinement of
geomorphological and geochemical statistical techniques in the study of clay-basin
tectonics: the Era basin (Central Italy): Italian Journal of Quaternary Sciences, 10(2):231-
246.
Ciotoli, G., Guerra, M., Lombardi, S., and Vittori, E., 1998, Soil gas survey for tracing
seismogenic faults: a case-study the Fucino basin (central Italy): Journal of Geophysical
Research, 103(B10):23,781-23,794.
Ciotoli, G., Etiope, G., Guerra, M., and Lombardi, S., 1999, The detection of concealed faults
in the Ofanto basin using the correlation between soil-gas fracture surveys:
Tectonophysics, 299(3-4):321-332.
Ciotoli G., Lombardi S., Morandi S., and Zarlenga F.(2004) – A Multidisciplinary Statistical
Approach to Study the Relationships between Helium Leakage and Neo-tectonic Activity
in a Gas Province: The Vasto Basin, Abruzzo-Molise (Central Italy). AAPG Bull., 88/3,
355-372.
Doglioni, C., Mongelli, F., and Piero, P., 1994, The Puglia uplift (SE Italy): an anomaly in the
foreland of the Apenninic subduction due to buckling of a thick continental lithosphere:
Tectonics, 13(5):1309-1321.
Duddridge, G. A., Grainger, P., and Durrance, E. M., 1991, Fault detection using soil gas
geochemistry: Quatern. Journal of Engineering Geology, 24:427-435.
Etiope, G., and Klusman, R. W., 2002, Geologic emission of methane to the atmosphere:
Chemosphere, 49:777-789.
Etiope, G, and Martinelli, G., 2002, Migration of carrier and trace gases in the geosphere: an
overview: Physics Earth Planetary Interior, 129:185-204.
Eremeev, A. N., Sokolov, V. A., and Solovov, A. P., 1973, Application of helium surveying
to structural mapping and ore deposit forecasting: London Symposium Volume, p. 183-192
Ghisetti, F., and Vezzani, L., 2002, Normal faulting, transcrustal permeability and
seismogenesis in the Apennines (Italy), Tectonophysics, 348:155-168.
Ghisetti, F., Kirschner, D., and Vezzani, L., 2000, Tectonic controls on large scale fluid
circulation in the Apennines (Italy): Journal Geochemical Exploration, 69/70:533-537.
Lombardi, S., and Reimer, G. M., 1990, Radon and helium in soil gases in the Phlaegrean
Fields, central Italy: Geophysical Research Letters, 17:849-852.
Helium Leakage from Italian Sedimentary Basins

202 Ciotoli, Lombardi and Zarlenga
Lombardi, S., Etiope, G., Guerra, M., Ciotoli, G., Grainger, P., Duddridge, G. A., Gera, F.,
Chiantore, V., Pensieri, R., Grindrod, P., and Impey, M., 1996, The refinement of soil gas
analysis as a geological investigative technique: Final Report. CEC, Programme on
Radioactive Waste Management (1990-1994) Part A, Task 4, Eur 16929 En, 194 p.
Oliver, B. M., Bradley, J. G., and Farrar IV, H., 1984, Helium concentration in the Earth's
lower atmosphere: Geochimica et Cosmochimica Acta, 48:1759-1469.
Patacca, E., and Scandone, P., 1989, Post-Tortonian mountain building in the Apennines. The
role of the passive sinking of a relic lithospheric slab: In The Lithosphere in Italy, eds. A.
Boriani, M. Bonafede, G.B. Piccardo, and G.B. Vai, Accademia Nazionale dei Lincei, v.
80, p. 157-176.
Pogorsky, L. A., and Quirt, G. S., 1981, Helium emanometry in exploring for hydrocarbons:
Part I. In: Unconventional Methods in Exploration for Petroleum and Natural Gas II.
Southern Methodist University Press, p. 124-135.
Roberts, A.A., 1981, Helium emanometry in exploring for hydrocarbons: Part II. In:
Unconventional Methods in Exploration for Petroleum and Natural Gas II. Southern
Methodist University Press, p. 135-149.
Van Den Boom, G.P., 1987, Helium distribution pattern of measured and corrected data
around the “Eldingen” Oil Field, Nw Germany. J. Geophys.Res., 92b:12547-12555.

TECTONICALLY CONTROLLED METHANE
ESCAPE IN LAKE BAIKAL
J. Klerkx1, M. De Batist
2, J. Poort2, R. Hus2, P. Van Rensbergen
2,
O. Khlystov3 and N. Granin
3
1International Bureau for Environmental Studies, Brussels, Belgium;
2Renard Centre of
Marine Geology, University of Ghent, Belgium; 3Limnological Instute, Siberian Branch of the
Russian Academy of Sciences, Irkutsk, Russia
Abstract: Methane, which is at least partly stored in the bottom sediments of Lake
Baikal as gas hydrates, is released on the lake floor in the deeper parts of the
basin along major faults, forming venting structures similar to small mud
volcanoes. The CH4 venting structures are considered to be the surface
expression of escape pathways for excess CH4 generated by the dissociation of
pre-existing hydrates. The existence of a local heat flow anomaly associated
with the seep area is most likely due to a heat pulse causing the dissociation of
the underlying gas hydrates. The heat pulse may be caused by upward flow of
geothermal fluids along segments of active faults, possibly accelerated by
seismic pumping. It is assumed that this fluid flow is tectonically triggered,
considering that left-lateral strike-slip movements along the border faults act
as a major factor in fluid accumulation: even a reduced lateral displacement is
able to generate fluid flow in the compressional direction, resulting in fluid
escape along faults directed along the main direction of extension. The
tectonic effect may be coupled to the sediment compaction due to a high
sedimentation rate in the area of mud volcanism. Both processes may generate
a large-scale convective fluid loop within the basin-fill sediments which
advects deeper gases and fluids to the shallow sub-surface. Even in the
extensional tectonic environment of Lake Baikal, local compressional forces
related to a strike-slip component, may play a role in fluid flow, accumulation
and gas escape along active faults. The mechanisms that result in the expulsion
of the CH4 in the Lake Baikal sediments are considered as an analogue of what
could happen during CO2 sequestration in a similar tectonic environment.
Key words: Methane escape, mud volcanism, gas hydrates dissociation.
203
S. Lombardi et al. (eds.),
Advances in the Geological Storage of Carbon Dioxide, 203–219.
© 2006 Springer. Printed in the Netherlands.

204 Klerkx, De Batist, Poort, Hus, Van Rensbergen, Khlystov, Granin
1. INTRODUCTION
The Baikal rift basin is commonly associated with active extensional
tectonics (Logatchev, 1993; Zonenshain et al., 1992; Mats, 1993). The
present-day tectonic activity is confirmed by GPS-measurements: the basin
undergoes active extension along a WNW-ESE direction with a velocity of
up to 4-5 mm/year (Calais et al., 1998; Petit et al., 1997, 1998). Active
subsidence is testified by the three large water-filled sedimentary basins
comprised by Lake Baikal. Within these basins, active fluid flow results in
local heat-flow anomalies (Poort and Klerkx, 2004) and fluid escape at the
lake floor (Granin and Granina, 2002; De Batist et al., 2002; Van
Rensbergen et al., 2002; 2003). Gas venting has been shown during recent
years to be a common phenomenon (Fig. 1).
Methane gas, which has accumulated in the sedimentary infill due to
microbial decomposition of organic matter and which is -at least partly-
stored as gas hydrates, is released on the lake floor along major fault zones.
Reflection seismic profiles have also revealed that the bottom-simulating
reflector (i.e. BSR; commonly considered to represent the base of the gas-
hydrate stability zone (GHSZ), or -more precisely- the transition between
gas-hydrate bearing sediments above and free-gas containing sediments
below) has an irregular behaviour, instead of displaying a regular pattern and
mimicking the lake floor as it is usually the case. Locally, the BSR is
disrupted along faults and vertical fluid-migration conduits that develop
along these faults propagate into the GHSZ and extend up to the lake floor.
Morphological evidence of fluid escape at the lake floor is given by venting
structures, similar to small mud volcanoes. These mud volcanoes appear to
be sourced from the base of the GHSZ in areas where the BSR displays an
irregular behaviour (De Batist et al., 2002; Van Rensbergen et al., 2002;
2003). Such venting structures occur in several places throughout the lake
and their present activity is testified by hydroacoustically observed “plumes”
above several of them and an increased concentration of dissolved methane
in the bottom water in their vicinity.
Fluid flow in the sediments of Lake Baikal is thus believed to result in
the local accumulation of gas (i.e. at the base of the GHSZ) and its
subsequent release along zones of weakness. This fluid flow is assumed to
result -at least partly- from the tectonic processes that act within the basin.
But what are exactly the processes responsible for the destabilisation of gas
hydrates and the generation of free methane? What is the tectonic control on
methane escape from the lake floor in a tectonic basin under extension? The
mechanisms that result in the expulsion of methane present in the Lake
Baikal sediments are considered as a natural analogue of what could happen
during CO2 geological sequestration in a similar tectonic environment.

Tectonically Controlled Methane Escape In Lake Baikal 205
Figure 1. Overview map of Lake Baikal, with indication of the extent of the hydrate province
and of the location of mud volcanoes, and of active deep-water and shallow-water seeps.
206
2. STRUCTURAL OUTLINE OF LAKE BAIKAL
AND THE VENTING STRUCTURES
Lake Baikal consists of three distinct bathymetric basins: the South
Baikal (SBB), Central Baikal (CBB) and North Baikal basins (NBB). Each
of these also corresponds to a well-defined sedimentary basin, bounded by
steep border faults, which are best expressed along the northwestern side of
the rift. The three basins are at least moderately asymmetric and tend to
adopt a half-graben shape (Zonenshain et al., 1992 ; Hutchinson et al., 1992 ;
Scholz et al., 1993). They are separated by active high-relief
morphostructural ridges, or accomodation zones s.l.. The Selenga Delta
Accomodation Zone consists of a broad bathymetric saddle between the
SBB and CBB. Although the saddle is largely obliterated by the Selenga
delta sediments, it is underlain by several elevated basement blocks
(Hutchinson et al., 1992 ; Zonenshain et al., 1992 ; Colman et al., 1993 ;
Scholz et al., 1993) (Fig. 1).
The area south of the Selenga delta is complicated in its central part by
the Posolsky Bank, a morphological ridge, striking SW-NE, transverse to the
basin shape (Fig. 2). It is assumed to be a large back-tilted fault block,
belonging to the Selenga Delta Accomodation Zone (Scholz and Hutchinson,
2000) and separated at its south-eastern side from the SBB by a relatively
narrow fault zone with a vertical displacement of about 900 m. The south-
eastern limit of the Posolsky Bank is delimited by a steep slope
corresponding to the Posolsky fault transiting abruptly to the deep-water
SBB at depths of about 1100 m. The basin floor gradually deepens to about
1300 m when reaching the steep slope of the main eastern border fault. The
sediments of this deep basin are not affected by major faults (Logatchev,
1993 ; Zonenshain et al., 1992 ; Mats, 1993).
The venting area is located immediately south of the structural high of
Posolsky Bank. It is delimited at its northern side by a small, secondary
fault, antithetic to the Posolsky fault (Fig. 3) (Van Rensbergen et al., 2002).
The venting structures are aligned almost parallel to the small antithetic fault
(Fig. 2), which offsets the lake floor by about 20 m. Some of the venting
structures themselves are also faulted.
The present or recent activity of the venting structures is testified by the
freshness of their morphology as observed on side-scan sonar mosaics (Fig.
2), and by the presence of 10-25 m high acoustically non-transparent plumes
in the water column above them or along their rims. The venting structures
coincide with "gas chimneys"-or fluid-flow conduits- (Figs. 3 and 4) in the
sub-surface that are observed on several seismic profiles (e.g. Van
Rensbergen et al., 2002; 2003).
Klerkx, De Batist, Poort, Hus, Van Rensbergen, Khlystov, Granin
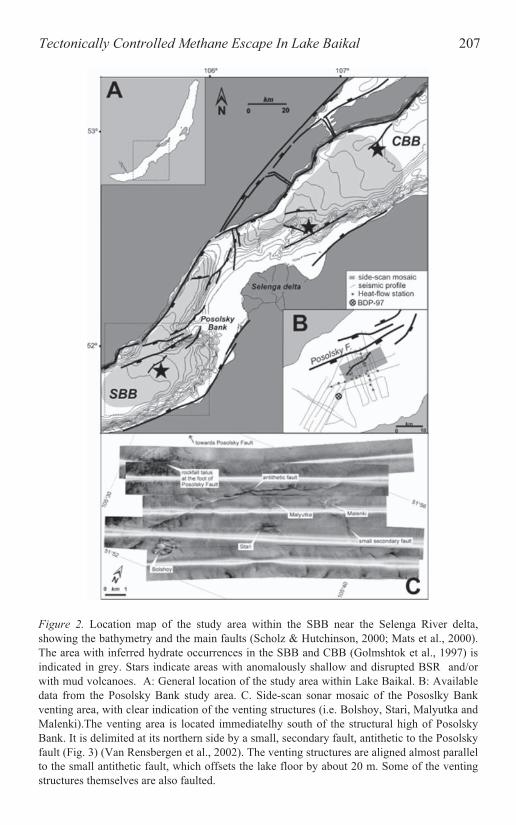
Tectonically Controlled Methane Escape In Lake Baikal 207
Figure 2. Location map of the study area within the SBB near the Selenga River delta,
showing the bathymetry and the main faults (Scholz & Hutchinson, 2000; Mats et al., 2000).
The area with inferred hydrate occurrences in the SBB and CBB (Golmshtok et al., 1997) is
indicated in grey. Stars indicate areas with anomalously shallow and disrupted BSR and/or
with mud volcanoes. A: General location of the study area within Lake Baikal. B: Available
data from the Posolsky Bank study area. C. Side-scan sonar mosaic of the Pososlky Bank
venting area, with clear indication of the venting structures (i.e. Bolshoy, Stari, Malyutka and
Malenki).The venting area is located immediatelhy south of the structural high of Posolsky
Bank. It is delimited at its northern side by a small, secondary fault, antithetic to the Posolsky
fault (Fig. 3) (Van Rensbergen et al., 2002). The venting structures are aligned almost parallel
to the small antithetic fault, which offsets the lake floor by about 20 m. Some of the venting
structures themselves are also faulted.

208
Figure 3. Seismic profile GAHY088 crossing the Stari and Malyutka venting structures,
showing the irregular behaviour of the “BSR” and the presence of fluid-flow conduits
adjacent to the small fault.
3. METHANE ESCAPE AND ITS RELATION TO
BSR AND HEAT FLOW ANOMALIES
A distinct BSR is evidenced in the area south of the Selenga delta on
single-channel high-resolution seismic reflection profiles (Vanneste et al.,
2000; De Batist et al., 2002). Outside the venting area, the BSR runs
regularly and smoothly at a predictable sub-bottom depth, in agreement with
the gradually deepening lake floor. In the venting area, the BSR no longer
mimics the lake floor, but it becomes highly disrupted and rises to a very
shallow sub-bottom depth (figs. 3 and 4) (De Batist et al., 2002).
Intra-basin faults in Lake Baikal generally do not affect the continuity of
the BSR or the thickness of the hydrate-bearing layer: the BSR simply cuts
across the folded and faulted stratigraphic reflections (Golmshtok et al.,
1997). The irregular pattern of the BSR and its disruption suggest the
presence of very localized, drastic variations in one or more of the variables
controlling the depth of the hydrate phase boundary: i.e. temperature (higher
Klerkx, De Batist, Poort, Hus, Van Rensbergen, Khlystov, Granin

Tectonically Controlled Methane Escape In Lake Baikal 209
than average), pressure (lower than average) or gas composition. Pressure as
a controlling factor can be ruled out as it is difficult to invoke a mechanism
by which sub-bottom pressures would be generated that are lower than the
background hydrostatic pressure. Heat-flow values in the studied area,
determined using marine thermoprobe measurements of the temperature
gradient and conductivity in surface sediments, are generally slightly higher
(between 55 and 90 mW/m2, locally up to 165 mW/m
2) than the average
heat-flow values for the Baikal Basin which are about 50-70 mW/m2
(Duchkov et al., 1999). This indicates that the irregular morphology of the
BHSZ is predominantly temperature-controlled and directly related to the
existence of a local anomaly of high heat flow.
Figure 4. Seismic profile GAHY030 across the small antithetic fault and the adjacent Malenki
mud venting structure, showing the strongly disrupted "BSR" and the acoustically chaotic
zone extending to the lake floor and affecting the lake-floor morphology.
As the lake-floor venting structures in the deeper parts of Lake Baikal
only occur in areas of anomalously shallow and disrupted BSR,
characterised by an anomaly of high heat flow, it is concluded that they are
the surface expression of escape pathways for excess methane generated by
the dissociation of pre-existing hydrates. Moreover, as the gas-venting
structures are spatially associated with active faults, it is postulated that gas
escape is favoured by the presence of these faults. The fact that the gas-
venting structures appear to be confined to particular segments of active
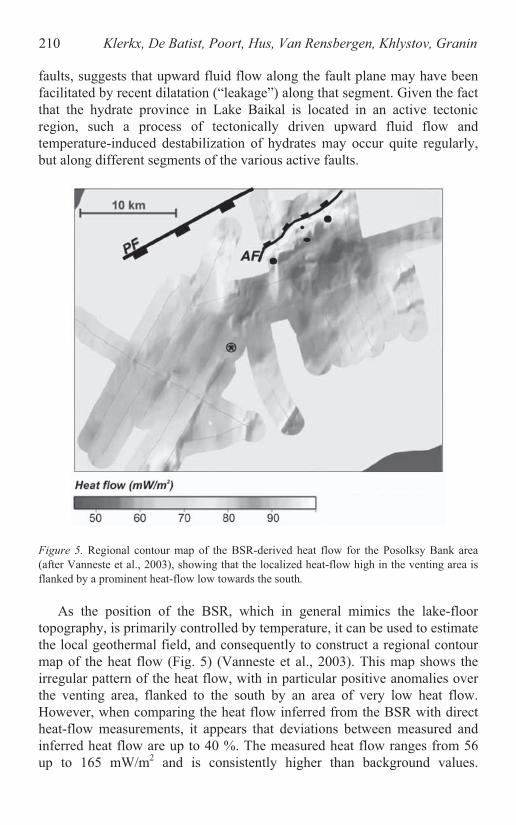
210
faults, suggests that upward fluid flow along the fault plane may have been
facilitated by recent dilatation (“leakage”) along that segment. Given the fact
that the hydrate province in Lake Baikal is located in an active tectonic
region, such a process of tectonically driven upward fluid flow and
temperature-induced destabilization of hydrates may occur quite regularly,
but along different segments of the various active faults.
Figure 5. Regional contour map of the BSR-derived heat flow for the Posolksy Bank area
(after Vanneste et al., 2003), showing that the localized heat-flow high in the venting area is
flanked by a prominent heat-flow low towards the south.
As the position of the BSR, which in general mimics the lake-floor
topography, is primarily controlled by temperature, it can be used to estimate
the local geothermal field, and consequently to construct a regional contour
map of the heat flow (Fig. 5) (Vanneste et al., 2003). This map shows the
irregular pattern of the heat flow, with in particular positive anomalies over
the venting area, flanked to the south by an area of very low heat flow.
However, when comparing the heat flow inferred from the BSR with direct
heat-flow measurements, it appears that deviations between measured and
inferred heat flow are up to 40 %. The measured heat flow ranges from 56
up to 165 mW/m2 and is consistently higher than background values.
Klerkx, De Batist, Poort, Hus, Van Rensbergen, Khlystov, Granin
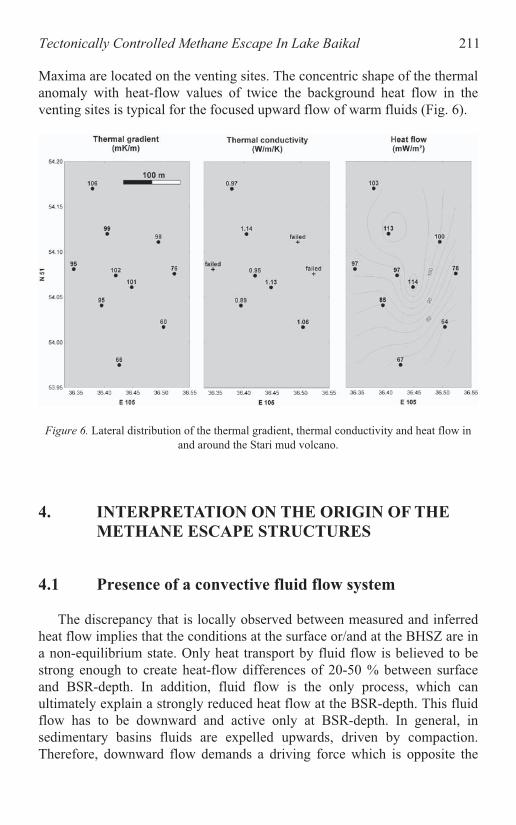
Tectonically Controlled Methane Escape In Lake Baikal 211
Maxima are located on the venting sites. The concentric shape of the thermal
anomaly with heat-flow values of twice the background heat flow in the
venting sites is typical for the focused upward flow of warm fluids (Fig. 6).
Figure 6. Lateral distribution of the thermal gradient, thermal conductivity and heat flow in
and around the Stari mud volcano.
4. INTERPRETATION ON THE ORIGIN OF THE
METHANE ESCAPE STRUCTURES
4.1 Presence of a convective fluid flow system
The discrepancy that is locally observed between measured and inferred
heat flow implies that the conditions at the surface or/and at the BHSZ are in
a non-equilibrium state. Only heat transport by fluid flow is believed to be
strong enough to create heat-flow differences of 20-50 % between surface
and BSR-depth. In addition, fluid flow is the only process, which can
ultimately explain a strongly reduced heat flow at the BSR-depth. This fluid
flow has to be downward and active only at BSR-depth. In general, in
sedimentary basins fluids are expelled upwards, driven by compaction.
Therefore, downward flow demands a driving force which is opposite the

212
compaction and stronger. This force can be delivered by density differences
in the fluids and will result in local convection loops.
A conceptual model for a convective fluid loop that accounts for both the
positive heat-flow anomalies near the venting sites and the negative heat-
flow anomalies zone south of the venting sites, has been proposed (Fig. 7)
(Vanneste et al., 2003). The density differences necessary for such a loop
can be generated by gas-driven pumping or by lateral density differences by
isothermal sea-floor bathymetry.
Figure 7. Conceptual fluid-loop model for explaining the characteristic heat-flow signature in
the Posolsky Bank study area (after Vanneste et al., 2003).
4.2 Destabilisation of gas hydrates
The cold methane seeps in Lake Baikal are associated with expulsion of
sediment which is the result of increase of pore-fluid pressure in the sub-
surface to lithostatic values, initiating hydraulic fracturing of the overburden
and fluid expulsion. The origin of gas and pore-fluid overpressure appears to
be the rapid increase of pore-fluid volume caused by the disintegration of
gas hydrates.
Methane seeps are often interpreted to result from gas- and fluid-release
by gas-hydrate destabilization in response to various processes. However,
gas-hydrate dissociation alone is usually not sufficient to explain methane
seepage, as has been shown for example, at the Blake Ridge gas-hydrate area
(Paull et al., 1995): gradual decomposition of hydrates at the base of the
hydrate layer is insufficient to account for the estimated upward fluid flow
(Egeberg, 2000) and, consequently, for the methane released at the sea floor.
Klerkx, De Batist, Poort, Hus, Van Rensbergen, Khlystov, Granin

Tectonically Controlled Methane Escape In Lake Baikal 213
In Lake Baikal, the existence of a local anomaly of high heat flow
associated with the seep area is most likely due to a heat pulse causing the
dissociation of the underlying gas hydrates. The heat pulse can be caused by
upward flow of geothermal fluids along active segments of the Posolsky
fault, maybe accelerated by seismic pumping. The elevated heat flow is
probably transient as it is related to fault activity that may jump to other
segments of the fault, possibly causing destabilization of hydrates, seeps,
and mud volcanoes elsewhere in the basin (Van Rensbergen et al., 2002).
Figure 8. Schematic model explaining the localised destabilisation of gas hydrates in
response to a structurally guided upward flow of fluids advecting heat to the BHSZ, creating
an overpressure compartment and leading to the expulsion of remobilised sediment and fluids
at the lake floor as gas seeps and mud volcanoes (after Van Rensbergen et al., 2003).
214
4.3 A tectonic driving force
Among the processes that may be involved in the shallowing of the base
of the GHSZ, the destabilization of the gas hydrates and the upward
channeling of fluids (Dillon et al., 1998; Henriet and Mienert, 1998; Tréhu et
al., 1999), only two are relevant to the specific sedimentary and tectonic
environment of Lake Baikal: compaction-driven fluid flow and tectonically
driven fluid flow.
Compaction-driven fluid flow may indeed play a role, as the area south of
Selenga delta is the site of major sediment input in the lake. On the
Selenga delta the sedimentation rate for the last 30,000 years is between
15 and 19 cm/kyr (Colman et al., 1996). When the sedimentary section
is rapidly thickening by sedimentation, the GHSZ shifts upward
continuously destabilizing gas hydrates at its base. Free gas
consequently accumulates from the dissociation of the gas hydrates (von
Huene and Pecher, 1999). When a fault reaching the base of the GHSZ
is reactivated, this fault can tap the area of fluid accumulation
underneath the BSR allowing the fluids to discharge along the fault and
to reach the lake floor. Fluids ascending from below the BSR are
warmer than the surrounding sediments, which results in destabilization
of gas hydrates and upward migration of the BSR. Such a process has
been proposed for the Cascadia convergent margin (Suess et al., 1999).
The presence of mud volcanoes in the Black Sea (Limonov et al., 1997),
under an extensional regime, also is interpreted by fast subsidence and
burial of mobile source beds resulting in overpressure. But the high
rapid sediment accumulation doesn’t account for the irregular behavior
(i.e. the combined occurrence of areas with shallower-than-background
and deeper-than-background BSR) of the BSR.
Tectonically driven fluid flow, by fluid flow along fault conduits, has
been sufficiently documented for playing a role in the destabilization of
gas hydrates in the compressional environment of active continental
margins (a.o. Booth et al., 1998; von Huene and Pecher, 1999; Suess et
al., 1999).
Even in the extensional tectonic environment of Lake Baikal, local
compressional structures have been observed. Levi et al. (1997) emphasizes
folding structures affecting the sedimentary section in the western part of the
SBB, consisting of NW-SE trending folds with up to 1 km amplitude and 7-8
km wavelength. The folded structures are attributed either to a phase of
horizontal principal compression in a NE-SW direction, parallel to the
longitudinal axis of the basin, or -more probably- to strike-slip movements.
Folding of the sedimentary section also has been evidenced on many seismic
Klerkx, De Batist, Poort, Hus, Van Rensbergen, Khlystov, Granin

Tectonically Controlled Methane Escape In Lake Baikal 215
sections obtained in the SBB and CBB by Golmshstok et al. (2000), who
relate these folding structures to movements along strike-slip faults. Their
axes are considered to be almost orthogonal to the axis of the basin. Also a
prominent roll-over structure is evidenced in the eastern part of the central
basin (Moore et al., 1997). This roll-over structure is considered to have
developed at the western side of a strike-slip fault zone which extends over
more than 50 km in the CBB.It is interesting to note that the fold axes have a
WNW trend. On the contrary, the axes of depocentres for several
depositional stages trend NNE, oblique to the main fault structures.
Evidences for a left-lateral strike-slip component in the main extensional
kinematics of the Baikal basin consequently exist, the axes of compression
varying between WNW in the CBB and NW in the extreme south of the
SBB. Although the significance of the strike-slip movement for the tectonic
evolution of the Baikal basin is not fully understood, it is evident that it
plays a role in the deformational pattern of the sedimentary fill.
Figure 9. Schematic diagram showing the fluid flow that is generated along the NW-SE
trending compression related to NE trending strike-slip movement. Fluids accumulate against
Posolskii Bank, resulting in updoming of the BSR and CH4 escape along NE trending
extensional faults.
The left-lateral strike-slip movement that has been evidenced results in
shortening of the sedimentary layers and dewatering of the sediments, and
consequently generates a fluid displacement. The direction of fluid transport
should be NW, orthogonal to the direction of principal compression which is

216
NE-SW. As this direction corresponds to the progressive shallowing of the
BSR, we propose that fluids are moving northwestwards along the
sedimentary layering in the fluid-enriched zone underneath the base of the
GHSZ. The basement block of Posolsky Bank forms a barrier for the moving
fluids. When approaching this barrier, the amount of fluids progressively
increases and their heat supply results in upward movement of the BSR.
Close to Posolsky Bank, fluids will consequently concentrate, creating
overpressure that results in thermal up-doming and finally disruption and
destabilisation of the gas-hydrate layer. When a fault oriented along the NE-
SW major direction of extension will be activated, the BSR is disrupted and
fluids erupt along this fault. Also in the other areas of known mud volcanism
in Lake Baikal, the mud volcanoes and methane escape occur along major
extensional intra-basin faults trending NE-SW.
Although the rapid sediment accumulation in the area of the Selenga
delta may play a role in the process of fluid accumulation, it is assumed that
fluid flow induced by left-lateral strike-slip movements along the border
faults is a major factor for the fluid accumulation, which is responsible for
up-doming and destabilization of the base of the GHSZ, and consequently
generation of methane and its escape on the lake floor.
5. DISCUSSION AND CONCLUSIONS
Active escape of methane and/or other fluids - i.e. cold seeps – occurs at
several locations on the lake floor of Lake Baikal, forming mud volcanoes
which involve not only methane/fluid seepage into the lake water, but also
mobilize and expulse sub-surface sediment. In all cases, methane venting
occurs along well-constrained segments of active, first-order rift-basin faults.
Moreover, the areas of mud volcanism are always underlain by gas hydrates
in the sub-bottom sediments.
A tentative model is proposed which relates the methane released at the
lake floor in the seep areas, as well as the associated expulsion of re-
mobilized sub-surface sediments, to the destabilization of gas hydrates at the
base of the hydrate-bearing sediment section. This destabilization - involving
the disruption of the BSR, a localized shallowing of the BHSZ, and the
generation of an overpressure compartment - must have occurred in response
to an upward flow of geothermal fluids, advecting heat to the BHSZ. It is
assumed that this fluid flow is tectonically triggered, considering that even in
an extensive tectonic environment, a reduced lateral displacement
component is able to generate a fluid flow in the compressional direction,
resulting in fluid escape along faults directed along the main direction of
extension. The tectonic effect may be coupled to the sediment compaction
Klerkx, De Batist, Poort, Hus, Van Rensbergen, Khlystov, Granin

Tectonically Controlled Methane Escape In Lake Baikal 217
due to a high sedimentation rate. Both processes may generate a large-scale
convective fluid loop within the basin-fill sediments which advects gases
and fluids of deeper origin to the shallow sub-surface within the upward-
flowing limb of this fluid loop.
Is methane escape on the lake floor of Lake Baikal presenting analogies
with gas release in the process of CO2 sequestration? There are major
differences between the natural occurrence of methane venting in Lake
Baikal, related to destabilisation of gas hydrates, and the processes involved
in CO2 sequestration: in Lake Baikal, only methane is released on the lake
floor, and moreover, strong overpressure is created when huge amounts of
methane are liberated when gas hydrates dissociate. Nevertheless, the
tectonic processes resulting from local compression that are supposed to play
a role in fluid-flow generation in Lake Baikal, as well as the role of sediment
compaction due to a high sedimentation rates, may also be effective in the
processes of CO2 sequestration.
Heat flow anomalies may be an indicator of such processes. It is clearly
evidenced in the area of mud volcanism in Lake Baikal that the gases
ascending from depths are accompanied by fluids that are warmer than the
environment where they escape, and that they create local heat flow
anomalies. These heat flow anomalies are consequently an indicator of
intensive, even cold gas and fluid seepages when the fluids generate at a
sufficient depth.
References
Booth, J.S., Winters, W.J., Dillon, W.P., Clennell, M.B. and Rowe, M.M., 1998, Major
occurrences and reservoir concept of marine clathrate hydrates : implications of field
evidence. In: Gas Hydrates: Relevance to World Margin Stability and Climate Change,
J.P. Henriet and J. Mienert, eds, Geological Society, London, Special Publications, 137:
113-127.
Brown, K.M., 1990, The nature and hydrological significance of mud diapirs and diatremes
for accretionary systems, Journal of Geophysical Research, 95:8969-8982.
Calais, E., Lesne, O., Deverchere, J., San'kov, V., Lukhnev, A., Miroshnitchenko, A., Buddo,
V., Levi, K., Zalutzky, V., Bashkuev, Y., 1998, Crustal deformation in the Baikal rift from
GPS measurements, Geophysical Research Letters, 25: 4003-4006.
Colman, S.M., Jones, G.A., Rubin, M., King, J.W., Peck, J.A, and Orem, W.H., 1996, AMS
radiocarbon analyses from Lake Baikal, Siberia: Challenges of dating sediments from a
large, oligotrophic lake, Quaternary Geochronology, 15:669-684.
De Batist, M., Klerkx, J., Van Rensbergen, P., Vanneste, M., Poort, J., Golmshtok, A.,
Kremlev, A., Khlystov, O., and Krinitsky, P., 2002, Active Hydrate Destabilization in
Lake Baikal, Siberia ? Terra Nova, 14(6):436-442.
Dillon, W.P., Danforth, W.W., Hutchinson, D.R., Drury, R.M., Taylor, M.H., and Booth, J.S.,
1998, Evidence for faulting related to dissociation of gas hydrate and release of methane
off the southeastern United States, In: Gas Hydrates: Relevance to World Margin Stability
218
and Climate Change, J.P. Henriet and J. Mienert, eds,. Geological Society, London,
Special Publications, 137, pp. 293-302.
Duchkov, A.D., Lysak, S.V., Golubev, V.A., Dorofeeva, R.P., and Sokolova, L.S., 1999, Heat
flow and geothermal field of the Baikal region, Geologiya i Geofizika, 40:287-303.
Ginsburg, G.D., 1998. Gas hydrate accumulation in deep-water marine sediments. In: Gas
Hydrates : Relevance to World Margin Stability and Climate Change, J.P. Henriet and J.
Mienert, eds. Geological Society, London, Special Publications, 137, pp. 51-62.
Ginsburg, G.D. and Soloviev, V.A., 1997, Methane migration within the submarine gas-
hydrate stability zone under deep-water conditions, Marine Geology, 137:49-57.
Golmshstok, A.Y., Duchkov, A.D., Hutchinson, D.R., Khanukaev, S.B., and El’nikov, A.I.,
1997, Estimations of heat flow in Lake Baikal by seismic data on the lower boundary of
gas hydrate layer, Russian Geology and Geophysics, 38(10):1714-1727.
Golmshstok, A.Ya., Duchkov, A.D., Hutchinson, D.R., and Khanukaev, S.B., Heat flow and
gas hydrates of Baikal Riftt Zone, Geol. Rundschau, in press.
Granin, N.G. and Granina, L.Z., 2002, Gas hydrates and gas venting in Lake Baikal. Russian
Geology and Geophysics, 43(7):589-597.
Henriet, J.P. and Mienert, J. (eds), 1998. Gas Hydrates: Relevance to world margin stability
and climatic change. Geological Society, London, Special Publications, 137.
Hutchinson, D.H., Golmshtok, A.J., Zonenshain, L.P., Moore, T.C., Scholz, C.A., and
Klitgord, K.D., 1992, Depositional and tectonic framework of the rift basins of Lake
Baikal from multichannel seismic data, Geology, 20:589-592.
Hyndman, R.D. and Davis, E.E., 1992, A mechanism for the formation of methane hydrate
and seafloor bottom-simulating reflectors by vertical fluid expulsion, J. Geophys. Res.,
97(5B):7025-7041.
Kennett, J.P. and Fackler-Adams, B.N., 2000, Relationship of clathrate instability to sediment
deformation in the upper Neogene of California, Geology, 28(3):215-218.
Kuzmin, M.I., Kalmychkov, G.V., Geletii, V.F., 1998, First find of gas hydrates in sediments
of Lake Baikal. Doklady Akademii Nauk, 362(4):541-543 (in Russian).
Kuzmin, M.I., Kalmychkov, G.V., Duchkov, A.D., Getetii,V.F., Golmshstok, A.Y.,
Karabanov, E.B., Khakhaev, B.N., Pevzner, L.A., Ioshida, H., Bazhin, N.M., Dyadin,
Y.A., Larionov, E.G., Manakov, A.Y., Mandel’baum, M.M., and Vashchenko, I.F., 2000,
Methane hydrates in sediments of Lake Baikal. Geology of Ore Deposits, 42 (1):25-37 (in
Russian).
Kvenvolden, K.A., 1988, Methane hydrate - a major reservoir of carbon in the shallow
geosphere ? Chemical Geology, 71:41-51.
Kvenvolden, K.A., 1993, Gas hydrates – Geological perspective and global change, Reviews
of Geophysics, 31:173-187.
Levi, K.G., Miroshnichenko, A.I., Sankov, V.A., Babushkin, S.M., Larkin, G.V., Badardinov,
A.A., Wong, H.K., Colman, S., and Delvaux, D., 1997, Active faults of the Baikal
depression, Bull. Centre Rech. Elf Explor.-Prod., 21(2):399-434.
Limonov, A.F., Van Weering, Tj.C.F., Kenyon, N.H., Ivanov, M.K., and Meisner, L.B.,
1997, Seabed morphology and gas venting in the Black Sea mudvolcano area :
Observations with the MAK-1 deep-tow sidescan sonar and bottom profiler, Marine
Geology, 137:121-136.
Logatchev, N.A., 1993, History and geodynamics of the Lake Baikal rift in the context of the
Eastern Siberia rift system: a review, Bull. Centres Rech. Explor-Prod. Elf Aquitaine,
17(2):353-370.
Mats, V.D., 1993, The structure and development of the Baikal rift depression, Earth Science
Reviews, 34:81-118.
Klerkx, De Batist, Poort, Hus, Van Rensbergen, Khlystov, Granin

Tectonically Controlled Methane Escape In Lake Baikal 219
Mats, V.D., Khlystov, O.M., De Batist, M., Ceramicola, S., Lomonosova, T.K., and
Klimansky, A., 2000, Evolution of the Academician Ridge Accommodation Zone in the
central part of the Baikal Rift, from high-resolution reflection seismic profiling and
geological field investigations, International Journal of Earth Sciences, 89(2):229-250.
Moore, T.C., Klitgord, K.D., Golmshstok, A.J., and Weber, E., 1997, Sedimentation and
subsidence patterns in the central and north basins of Lake Baikal from seismic
stratigraphy, Geol. Soc. America Bull., 109(6):746-766.
Paull, C.K., Ussler, W., Borowski, W.S., and Spiess, F.N., 1995, Methane-rich plumes on the
Carolina continental rise - associations with gas hydrates, Geology, 23(1):89-92.
Petit, C., Burov, E., Deverchere, J., 1997, On the structure and mechanical behaviour of the
extending lithosphere in the Baikal rift from gravity modeling, Earth and Planetary
Science Letters, 149 (1-4): 29-42.
Petit, C., Koulakov, I., Deverchere, J., 1998, Velocity structure around the Baikal rift zone
from teleseismic and local earthquake traveltimes and geodynamic implications,
Scholz, C.A.,and Hutchinson, D.R., 2000, Stratigraphic and structural evolution of the
Selenga Delta Accommodation Zone, Lake Baikal Rift, Siberia, International Journal of
Earth Sciences, 89:212-228.
Soloviev, V.A., and Ginsburg, G.D., 1997, Water segregation in the course of gas hydrate
formation and accumulation in submarine gas-seepage fields, Marine Geology, 137:59-68.
Suess, E., Torres, M.E., Bohrmann, G., Collier, R.W., Greinert, J., Linke, P., Rehder, G.,
Trehu, A., Wallmann, K., Winckler,G., and Zuleger, E., 1999, Gas hydrate destabilization:
enhanced dewatering, benthic material turnover and large methane plumes at the Cascadia
convergent margin, Earth and Planetary Science Letters, 170:1-15.
Trehu, A.M., Torres, M.E., Moore, G.F., Suess, E., and Bohrmann, G., 1999, Temporal and
spatial evolution of a gas hydrate-bearing accretionary ridge on the Oregon continental
margin, Geology, 27(10):939-942.
Vanneste, M., Poort, J., De Batist, M., and Klerkx, J., 2003, Atypical heat flow near gas
hydrate irregularities and cold seeps in the Baikal Rift Zone, Marine and Petroleum
Geology, 19:1257-1274.
Van Rensbergen, P., De Batist, M., Klerkx, J., Hus, R., Poort, J., Vanneste, M., Granin, N.,
Khlystov, O., and Krinitsky, P., 2002, Sublacustrine mud volcanoes and methane seeps
caused by dissociation of gas hydrates in Lake Baikal, Geology, 30(7):631-634.
Van Rensbergen, P., Poort, J., Kipfer, R., De Batist, M., Vanneste, M., Klerkx, J., Granin, N.,
Khlystov, O., and Krinitsky, P., 2003, Evidence of near-surface sediment mobilization and
methane venting in relation to hydrate dissociation in Southern Lake Baikal, Siberia. In:
Subsurface sediment mobilization. P. Van Rensbergen, R.R.Hillis, A.J. Maltman and C.K.
Morley, eds., Geological Society Special Publication, 216:207-221.
Von Huene, R., and Pecher, I.A., 1999, Vertical tectonics and the origin of BSRs along the
Peru margin, Earth and Planetary Science Letters, 166:47-55.
Von Rad, U., Berner, U., Delisle, G., Doose-Rolinski, H., Fechner, N., Linke, P., Lückge, A.,
Roeser, H.A., Schmaljohann, R., and Wiedicke, M., 2000, Gas and fluid venting at the
Makran accretionary wedge off Pakistan, Geo-Marine Letters, 20:10-19.
Zonenshain, L.P., 1992, Baikal rift structure, Geotectonics, 26(5):396-407.
Tectonophysics, 296 (1-2): 125-144.

PART IV
ACTIVE CO2 INJECTION SITES
Monitoring Strategies and System Evolution of
Active, Man-Made Carbon Dioxide Storage Sites
THE IEA WEYBURN CO2 MONITORING AND
STORAGE PROJECT
Integrated results from Europe
J.B. Riding
British Geological Survey, Keyworth, Nottingham NG12 5GG, UK
Abstract: The IEA Weyburn CO2 Monitoring and Storage Project has analysed the
effects of a miscible CO2 flood into a carbonate reservoir rock at an onshore
Canadian oilfield. Anthropogenic CO2 is being injected as part of an enhanced
oil recovery operation. The European research was aimed at analysing long-
term migration pathways of CO2 and the effects of CO2 on the hydrochemical
and mineralogical properties of the reservoir rock. The long term safety and
performance of CO2 storage was assessed by the construction of a Features,
Events and Processes (FEP) database which provides a comprehensive
knowledge base for the geological storage of CO2. The pre-CO2 injection
hydrogeological, hydrochemical and petrographical conditions in the reservoir
were investigated in order to recognise changes caused by the CO2 flood and
to assess the fate of the CO2. The Mississippian aquifer has a salinity gradient
in the Weyburn area, where flows are oriented SW-NE. The baseline gas
fluxes and CO2 concentrations in groundwater and soil were also studied. The
dissolved gas in the reservoir waters has allowed potential transport pathways
to be identified. Experimental studies of CO2-porewater-rock interactions in
the Midale Marly unit have indicated slight dissolution of carbonate and
silicate minerals, but relatively rapid saturation with respect to carbonate
minerals. Equivalent studies on the overlying and underlying units show
similar reaction processes, but secondary gypsum precipitation was also
observed. Carbon dioxide flooding experiments on samples of the Midale
Marly unit demonstrated that porosity and gas permeability increased
significantly and calcite and dolomite were shown to have undergone
corrosion. Hydrogeological modelling indicates that if any dissolved CO2
entered the main aquifers, it would be moved away from Weyburn in an E-NE
direction at a rate of c. 0.2 metres per year due to regional groundwater flow.
Analysis of reservoir fluids proved that dissolved CO2 and CH4 increased
significantly in the injection area between 2002 and 2003 and that solubility
trapping accounts for the majority of the injected CO2, with little apparent
mineral trapping. Twelve microseismic events were recorded and these are
223
S. Lombardi et al. (eds.),
Advances in the Geological Storage of Carbon Dioxide, 223–230.
© 2006 Springer. Printed in the Netherlands.
224 Riding
provisionally interpreted as possibly being related to small fractures formed by
injection-driven fluid migration within the reservoir. Pre- and post-injection
soil gas data are consistent with a shallow biological origin for the measured
CO2. Isotopic (13
C) data values are higher than in the injected CO2, and
confirm this interpretation. No evidence for leakage of the injected CO2 to
ground level has so far been detected.
Key words: CO2 injection; geological storage of greenhouse gases; enhanced oil recovery;
geoscientific monitoring; safety assessment studies
1. INTRODUCTION
The IEA Weyburn CO2 Monitoring and Storage Project was a
collaborative initiative involving workers from North America and Europe
and was co-ordinated by the Petroleum Technology Research Centre
(PTRC) in Regina, Canada. The project has studied the geological
sequestration of CO2 during a commercial enhanced oil recovery (EOR)
operation at the Weyburn oilfield, Saskatchewan, Western Canada. EnCana
Resources (formerly PanCanadian Resources) began injecting a 95% pure
CO2 stream into the oil reservoir, the Midale Beds, at Weyburn during
September 2000. At the conclusion of this EOR operation, it is anticipated
that over 20 million tonnes of anthropogenic CO2 will have been
permanently and safely sequestered in these Mississippian strata, which are
c. 1.4 km underground. Hence, greenhouse gas emissions will have been
significantly reduced as part of a cost-effective industrial operation. The
principal objective of the monitoring project was to enhance scientific
knowledge pertaining to the underground sequestration of CO2 associated
with EOR using several different techniques in geoscientific monitoring.
Another major strand to this work has been the promotion of international
collaboration on carbon management research between scientists in Canada,
the USA and Europe. The results from this project will help guide policy
makers on carbon management issues. The European project team comprises
nine organisations and was co-funded by the European Commission (EC).
2. THE GEOLOGY OF THE WEYBURN OILFIELD
AND THE CO2-EOR OPERATION
The Weyburn oilfield is in south-east Saskatchewan, Canada (Figure 1a)
and lies in the north-eastern part of the Williston Basin. It was discovered in
1954, is now operated by EnCana Resources and covers some 180 square
kilometres of prairie. Medium gravity sour crude oil (25 to 34 degree API) is
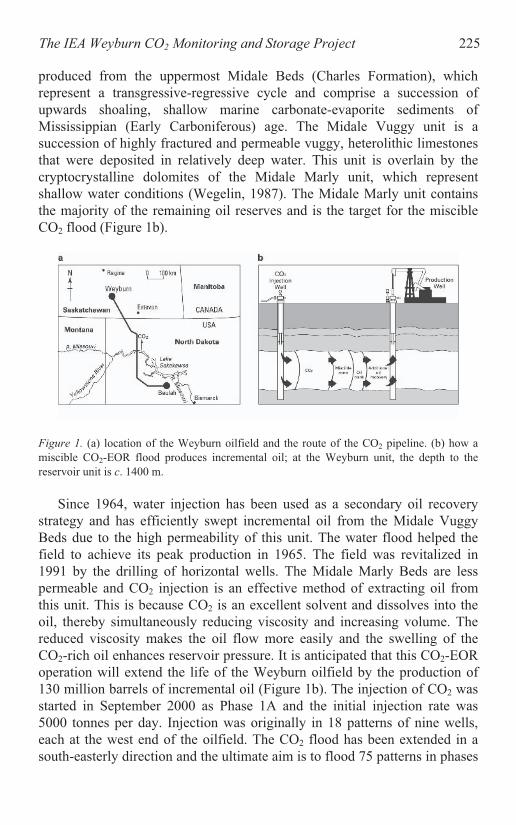
The IEA Weyburn CO2 Monitoring and Storage Project 225
produced from the uppermost Midale Beds (Charles Formation), which
represent a transgressive-regressive cycle and comprise a succession of
upwards shoaling, shallow marine carbonate-evaporite sediments of
Mississippian (Early Carboniferous) age. The Midale Vuggy unit is a
succession of highly fractured and permeable vuggy, heterolithic limestones
that were deposited in relatively deep water. This unit is overlain by the
cryptocrystalline dolomites of the Midale Marly unit, which represent
shallow water conditions (Wegelin, 1987). The Midale Marly unit contains
the majority of the remaining oil reserves and is the target for the miscible
CO2 flood (Figure 1b).
Figure 1. (a) location of the Weyburn oilfield and the route of the CO2 pipeline. (b) how a
miscible CO2-EOR flood produces incremental oil; at the Weyburn unit, the depth to the
reservoir unit is c. 1400 m.
Since 1964, water injection has been used as a secondary oil recovery
strategy and has efficiently swept incremental oil from the Midale Vuggy
Beds due to the high permeability of this unit. The water flood helped the
field to achieve its peak production in 1965. The field was revitalized in
1991 by the drilling of horizontal wells. The Midale Marly Beds are less
permeable and CO2 injection is an effective method of extracting oil from
this unit. This is because CO2 is an excellent solvent and dissolves into the
oil, thereby simultaneously reducing viscosity and increasing volume. The
reduced viscosity makes the oil flow more easily and the swelling of the
CO2-rich oil enhances reservoir pressure. It is anticipated that this CO2-EOR
operation will extend the life of the Weyburn oilfield by the production of
130 million barrels of incremental oil (Figure 1b). The injection of CO2 was
started in September 2000 as Phase 1A and the initial injection rate was
5000 tonnes per day. Injection was originally in 18 patterns of nine wells,
each at the west end of the oilfield. The CO2 flood has been extended in a
south-easterly direction and the ultimate aim is to flood 75 patterns in phases

226 Riding
over the next 15 years. The CO2 used is a purchased by-product of coal
gasification and supplied to Weyburn through a 320 km long pipeline from
the Great Plains Synfuels Plant in Beulah, North Dakota, USA that is
operated by the Dakota Gasification Company (Figure 1a) (Stelter, 2001).
3. THE EUROPEAN PART OF THE IEA WEYBURN
CO2 MONITORING AND STORAGE PROJECT
The scientific tasks of the European research on the Weyburn oilfield are
divided into three Work Packages (Riding et al., 2003). The scope and
principal conclusions of each of these Work Packages are given in this
section. This research was aimed principally at studying the potential long-
term migration pathways of CO2, and the effects of CO2 on the
hydrochemical and mineralogical properties of the reservoir rock at
Weyburn. These are largely controlled by the regional geology,
hydrodynamics and hydrochemistry of the aquifer systems.
3.1 Work Package 1 – Long-Term Safety and
Performance of CO2 Storage
The aim of this Work Package was to use systems analysis to provide a
framework into which data can be integrated to give an assessment of the
safety and reservoir integrity of CO2 injection at the Weyburn oilfield.
Features, events and processes (FEPs) describing the behaviour of CO2 in the
subsurface were used to describe and evaluate the storage concept and as a
method of assessing all potentially significant factors. A generic FEP
database for the geological storage of CO2 has been developed. Natural
analogue data obtained through the EC co-funded NASCENT project were
also incorporated. The selected FEPs were included for their relevance to the
long-term safety and performance of the reservoir, after the injection of CO2
has been completed and the injection wells have been sealed. However,
some FEPs pertaining to the injection phase have been included. The
database contains some 200 FEPs arranged in a hierarchical structure that
has eight categories. Each has a text description with references to the
literature and discussion of its relevance to long-term performance and
safety. The database is internet-enabled and incorporates hyperlinks to many
other relevant information sources and is fully searchable. The generic (i.e.
non Weyburn-specific) FEP database is available at http://www.quintessa-
online.com/CO2/. It is therefore a comprehensive knowledge base for the
geological storage of CO2. Potentially important scenarios for the future

The IEA Weyburn CO2 Monitoring and Storage Project 227
evolution of a geological storage system were also considered. These
scenarios need to be addressed in system-level models for the assessment of
performance and safety. The use of the FEP database as an audit tool to
evaluate the completeness of such models has been demonstrated.
Deterministic and probabilistic performance assessment methodologies have
been investigated to determine the long-term fate of CO2 in the geosphere
and biosphere.
3.2 Work Package 2 – Definition of Baseline
Hydrogeological, Hydrochemical and Petrographical
Conditions
The aim of this Work Package was to define the pre-CO2 injection
hydrogeological, hydrochemical and petrographical conditions in the
Weyburn reservoir at both local and regional scales (Riding et al., 2003). A
full understanding of these baseline conditions has allowed the recognition
of changes resulting from the CO2 flood and assessing the fate of the
injected CO2. To place the Weyburn oilfield in its regional context, the
geological structure, hydrogeology and water chemistry were first compiled
at the basin scale. The study then focused on a smaller area, centred on
Weyburn. The geological structure of the area is a southward/south-
westward-trending monocline. The Mississippian aquifer has a steep salinity
gradient in the Weyburn area, where brines are concentrated in the south and
are associated with Devonian evaporites. Salinity values in the north reflect
previous dissolution of Devonian evaporites. The overall up-dip flows are
dominantly oriented south-west to north-east. This is an important factor
when investigating potential upward CO2 migration and chemistry of water
mixing by flooding.
The baseline chemistry of the aquifer systems was assessed at a regional
scale and included analytical data from the Weyburn oilfield. Geochemical
modelling has indicated the main in-situ chemical characteristics of the
Mississippian reservoir fluids at Weyburn. Dissolved organic acid anions do
not have a significant effect on the alkalinity; by contrast, sulphide
concentrations may represent >60% of the total alkalinity. The reservoir
waters are largely in thermodynamic equilibrium with respect to anhydrite,
barite, calcite, dolomite and a silica phase. Dissolved aluminium may be
controlled by clay minerals and/or K-feldspar.
Baseline mineralogical data have also been analysed to assess the initial
chemical environment and to identify core material within the CO2 flood
area for use in hydrothermal experiments. Experimental geochemical studies
on core samples from the first CO2 flooding area have been carried out to

228 Riding
ascertain key fluid properties. A further aspect of the baseline studies was to
determine the pre-injection regional gas fluxes and concentrations in both
groundwater and soil. The former has improved understanding of fluid-flow
pathways throughout the Weyburn oilfield. A variety of dissolved and free
gases and elements have been analysed. These help to determine the baseline
water-rock interactions and allow potential rapid transport pathways to be
identified.
Part of this task was to investigate whether soil gases and groundwater
analyses can be used to identify the position of near surface features that
may connect with the reservoir at depth. Seismic profiles were examined for
faults, which may conduct gases and liquids above the reservoir, however
none, which outcrop, were found. Consistent with this, the soil gas
anomalies measured at Weyburn do not follow linear trends. The CO2
distributions reflect both the origins and natural reactions that typify modern
biogenic CO2. The majority of the minor CO2 anomalies may therefore be
explained by anthropogenic or near surface phenomena. There is no
correlation between these CO2 anomalies with the injection wells or CO2
pipelines. Furthermore, the expected seasonal variations in CO2 flux data
have been discerned. For example, measurements taken in September 2001
proved lower than those measured in July 2001 due to seasonal variations in
soil humidity, vegetation and agricultural activity.
3.3 Work Package 3 – Define Changes to Baseline
Hydrochemical, Hydrogeological and Petrographical
Conditions Resulting from CO2 Injection
Work Package 3 sought to assess the impact of injected CO2 on the
baseline conditions, especially reservoir geochemistry, mineralogy, fracture
generation and fluid flow pathways (Riding et al., 2003). Experimental
geochemical studies of CO2-porewater-rock interactions investigated
dissolution/precipitation reactions between CO2, Midale reservoir rocks, the
caprock, borehole cement and porewaters under reservoir conditions. The
data were used in the geochemical modelling to show how mineral
saturation changes when CO2 is injected into the Midale Marly unit. It was
found that the effects of CO2 injection into Midale beds gave rapid reactions
with variable amounts of carbonate mineral dissolution, some precipitation
of gypsum and slow reactivity of aluminosilicate minerals. The Midale
Vuggy samples proved the most reactive with etching of surfaces giving
minor secondary porosity and secondary gypsum. By contrast, few
observable mineralogical changes were observed in the Midale Marly
samples. The Midale Evaporite caprock samples were altered slightly more

The IEA Weyburn CO2 Monitoring and Storage Project 229
than the Midale Marly lithologies and include some gypsum precipitation.
The injection of CO2 appears to have had little impact on the strength of the
two cement types tested. Three CO2 flooding experiments were completed
on Midale Marly samples. Sample porosity and gas permeability increased
significantly. Calcite and dolomite both underwent significant corrosion and
some disintegration was observed. Anhydrite and gypsum were also
corroded, whereas alkali feldspar, celestine and fluorite appeared to be
unaffected. Mass balance calculations indicate a consistency between sample
weight loss and the amounts of dissolved Ca2+
and Mg2+
.
The geochemical evolution of the Weyburn site has been achieved in an
integrated study comprising field sampling, experimental studies and
predictive geochemical modelling. It was determined that dissolved CO2 in
reservoir fluids increased 10-fold in the phase A1 injection area between
2002 and 2003; dissolved methane (CH4) also increased significantly.
Solubility trapping accounts for the majority of the injected CO2, with little
apparent mineral trapping. Regional scale hydrogeological modelling
indicates that subsurface water flow is oriented south-west to north-east.
Some contrasts in density and aquifer dips in the Weyburn area however,
cause modifications to this principal direction. Should CO2-charged
groundwaters migrate from the reservoir succession, and the material were
incorporated into the main aquifers, it is predicted that dissolved gas would
only be moved 25 kilometres away from Weyburn in an east to north-east
direction after 100,000 years.
Microseismic monitoring was undertaken to map hydraulic-induced
fractures that have been stimulated by injection/EOR activities. Twelve
microseismic events with magnitudes of -2.3 to -1.7 were recorded at 300 to
400 m from the observation well. Operations in a nearby well were shut
down during ten of these events, hence this microseismicity is interpreted as
possibly being related to the formation of small fractures produced by
injection-driven fluid migration within the reservoir. The results of
comprehensive soil gas surveys between 2001 and 2003 indicate shallow
biological origins for the measured CO2. Seasonal variability in the soil gas
values and limited 13
C isotopic data support this interpretation. There is no
evidence so far of any leaks of injected CO2 at the surface.
4. CONCLUSION
The Weyburn oilfield has proven to be an outstanding natural laboratory
for the study of CO2 storage; this is based on its comprehensive well/field
data, the extensive core material and the accessibility of the site. The
European part of the IEA Weyburn CO2 Monitoring and Storage Project has

230 Riding
derived significant scientific knowledge related to a commercial miscible
CO2-EOR operation. The structure of the research is intended to serve as a
model, which can be applied to other CO2 storage operations. Furthermore,
the results from this project should help guide policy development on the
abatement of greenhouse emissions from energy generation using
underground storage. This project has also been notable for the many
successful international collaborations which have taken place within the
large project team. These have been both intra-European and transatlantic
collaborations.
ACKNOWLEDGEMENTS
This contribution is published with the permission of the Executive
Director, British Geological Survey (NERC). The European Commission is
gratefully acknowledged for its generous funding of this work, which is EC
project number NNE5-2000-00096 (contract ENK5-CT-2000-00304). The
European research was undertaken by a collaboration of five partners; these
are the British Geological Survey (BGS), the Bureau de Recherches
Géologiques et Minières (BRGM), the Geological Survey of Denmark and
Greenland (GEUS), the Istituto Nazionale di Geofisica e Vulcanologia
(INGV) and Quintessa Limited. The Università di Roma ‘La Sapienza’
(URS) and the Institut Français du Pétrole (IFP) were research
subcontractors to INGV and BRGM, respectively. The British Geological
Survey co-ordinated the European project and the International Energy
Agency Greenhouse Gas R&D Programme and the Petroleum Technology
Research Centre Inc. (PTRC) facilitated linkages and integration.
REFERENCES
Riding, J. B., Czernichowski-Lauriol, I., Lombardi, S., Quattrocchi, F., Rochelle, C. A.,
Savage, D. and Springer, N., 2003, The IEA Weyburn CO2 Monitoring and Storage
Project - the European dimension. In: Gale, J. and Kaya, Y. (eds) Greenhouse Gas Control
Technologies, Volume II. Oxford: Elsevier Science Limited, 1629-1632.
Stelter, S., 2001, The New Synfuels Energy Pioneers. Bismarck, North Dakota: Dakota
Gasification Company.
Wegelin, A., 1987, Reservoir characteristics of the Weyburn Field, southeastern
Saskatchewan. Journal of Canadian Petroleum Technology, 26(4):60-66.

ASSESSMENT OF THE LONG-TERM FATE OF
CO2 INJECTED INTO THE WEYBURN FIELD
System-Level Modeling of CO2 Migration and Potential Impacts
M.J. Stenhouse, W. Zhou and R. Arthur
Monitor Scientific LLC, Suite #555, 3900 S. Wadsworth Blvd., Denver CO 80235, U.S.A.
Abstract: CO2 is being injected into a 1450-m deep oil reservoir located in Weyburn,
Saskatchewan, Canada, for enhanced oil recovery. To complement this
commercial activity, a major research project to study geological sequestration
and storage of CO2, known as the International Energy Agency (IEA)
Weyburn CO2 Monitoring and Storage Project, was launched in July 2000.
Phase 1 of this project was completed in 2004. This paper discusses the long-
term assessment of the fate of CO2 in the IEA Weyburn Project, describing the
underlying methodology as well as the modeling approach and the results
obtained. The conclusion from the modeling predictions is that if the Weyburn
CO2 storage system evolves as expected, long-term geological storage of
greenhouse gas CO2 will be achieved.
Key words: Greenhouse gas mitigation, geological storage of CO2, CO2 migration, system-
level modeling, long-term assessment, risk assessment, abandoned wells,
environmental impacts.
1. INTRODUCTION
CO2 from the North Dakota Gasification plant is being transported and
injected into a 1450-m deep oil reservoir located in Weyburn, south
Saskatchewan, Canada (Figure 1) for enhanced oil recovery (EOR). The
operator, EnCana Resources of Calgary, Alberta, designed a total of 75
patterns (each pattern is ~1 km2) for this operation that is intended to last for
approximately 34 years. To complement this commercial activity, a major
research project to study geological sequestration and storage of CO2, known
as the International Energy Agency (IEA) Weyburn CO2 Monitoring and
Storage Project (henceforth called the IEA Weyburn Project), was launched
231
S. Lombardi et al. (eds.),
Advances in the Geological Storage of Carbon Dioxide, 231–242.
© 2006 Springer. Printed in the Netherlands.

232 Stenhouse, Zhou and Arthur
in July 2000. The first phase of this project (2000-2004) was sponsored by a
number of governments and industrial sponsors from North America, Europe
and Japan, including Natural Resources Canada (NRCan) and the U.S.
Department of Energy. Planning for Phase 2 is already underway.
Regina
Bismarck
U.S.A.
CANADA
ManitobaWeyburn
Saskatchewan
Montana
North Dakota
Beulah
Dakota
Gasification
Company
CO2
pipeline
Estevan
Mis
sour
i
Lake
Sakakawea
Figure 1. Location of the Weyburn field and the CO2 pipeline from Beulah, North Dakota.
One of the objectives of the IEA Weyburn Project was to determine the
long-term fate of CO2 injected into the reservoir. Such a determination
involves an evaluation of the potential for CO2 to migrate to the environment
via both natural and man-made (wellbore) pathways.
CO2 storage projects are relatively few and so assessments associated
with CO2 storage are in their infancy. In the particular case of the IEA
Weyburn Project, long-term (geological) storage of CO2 is an additional
benefit of EOR. However, safety studies for such storage of CO2 are unusual
in that they need to consider the evolution of natural systems over
timeframes considerably in excess of those considered in industrial or
engineering projects - typically several decades and rarely hundreds of years.
Many of the advances made in the last twenty years in the field of safety
assessments for the geological disposal of radioactive wastes can also be
applied to CO2 storage (Savage, 1995). Similar to CO2 sequestration, the
final storage of nuclear waste requires an understanding of complex coupled
physical-chemical-mechanical processes occurring over hundreds to tens of
thousands of years. The spatial scales of both types of project are also
similar.
This paper discusses the methodology applied to the long-term
assessment of the fate of CO2 in the IEA Weyburn Project, the modeling
approach and the results obtained. A preliminary evaluation of the potential
environmental impacts from releases of CO2 to the biosphere is also
described.

Long-term fate of CO2 injected into the Weyburn Field 233
2. METHODOLOGY – SYSTEMS ANALYSIS
FRAMEWORK
The Systems Analysis framework that was applied to the long-term
assessment for the IEA Weyburn Project is based on the well-established
methodology that has been, and still is, used widely and successfully in the
field of radioactive waste management and disposal (Cranwell et al., 1982;
Goodwin, 1991; Stenhouse et al., 2001). The basis of this approach is to
develop a transparent and systematic treatment of the ‘system’ being
assessed, as well as generating documentation that is auditable, should the
need arise.
One of the first steps in the methodology is to define what is meant by
the ‘System’ to be assessed. Figure 2 provides a schematic diagram of the
basic components of a CO2 storage system, viz:
The CO2 storage reservoir situated at depth, in this case the Weyburn
field, within the
Geosphere, which consists of a number of geological and
hydrogeological units above and below the reservoir (units are not
shown explicitly in Figure 2); and the
Biosphere, the name given to the surface, or near-surface environment,
where potential environmental impacts are normally evaluated.
The arrows shown in Figure 2 represent potential CO2 migration
pathways away from the reservoir. Two abandoned wells are also shown in
this diagram, representing wellbores as potential (fast) pathways for
reservoir CO2 to migrate to the surface or near-surface. One of the major
tasks of the IEA Weyburn Project was the detailed geological and
hydrogeological characterization of the region around the Weyburn field, so
that the main features of the geosphere, principally those representing
potential pathways or sinks for CO2, could be identified and incorporated in
the migration modeling (see Section 3).
Having defined the ‘System’, the next stage of the process involved the
identification of scenarios. Scenarios are defined as plausible and credible
ways in which the Weyburn CO2 storage system might evolve over decades
to hundreds to thousands of years. One scenario was central to the modeling
effort in Phase 1 - the Base Scenario, defined as “the expected evolution of
the Weyburn CO2 storage system”. Table 1 provides a description of the
elements that constitute the Base Scenario. Other (alternative) scenarios
were also identified, though not discussed here. The documentation of
scenarios occurs primarily through the listing of relevant features, events and
processes (FEPs) - those factors that can affect the CO2 storage system.

234 Stenhouse, Zhou and Arthur
? ?
?? ?
? ??
CO2 Storage Reservoir
GEOSPHERE
BIOSPHERE
?
?
?? ?
Surface / Near-surfaceEnvironment
Potable Water Aquifer
?
? ?
Figure 2. Schematic diagram of CO2 storage system (cf. the more realistic representation
shown in Figure 3).
Table 1. Key elements of the Base Scenario for the Weyburn CO2 storage system.
Base Scenario
Modeling domain: the Weyburn field (75
patterns) and the surrounding 10-km zone.
Time frame: From the end of CO2 injection to
5,000 years, or at which time 50% of the CO2
in-place has migrated from the reservoir.
Caprock: Based on existing information, the
caprock integrity is not impaired; any
fractures or discontinuities that exist are all
isolated or sealed (see also abandoned wells).
Geosphere: A series of aquitards/aquifers exist
above and below the reservoir horizon; these
formations may contain fractures and fissures.
The System Model takes into account physical
trapping features that have contained the
oil/gas in the reservoir.
Geochemical processes - e.g., water chemistry
changes, CO2 removal (by solubility and ionic
trapping), precipitation of carbonate minerals
- occur in the aqueous phase of all aquifers.
The Biosphere exists from the deepest potable
aquifer, i.e., extends to ~ 300 m below
surface. It includes soil, surface water and the
atmosphere as well as the flora and fauna that
are found within these areas.
Abandoned wells: All wells within the
modeling domain are included and are
assumed to have been abandoned
according to current field abandonment
procedures. This assumption includes
wells that may have been abandoned
previously according to different
abandonment practices.
Well seals will slowly degrade after
abandonment. These seals consist
primarily of the cement used to fill the
annulus between casing and borehole,
cement and metal plugs used to fill the
casing bore, and the cap welded onto the
casing ~ 4 m below ground surface.
The metal casing will also degrade with
time.
FEPs that address storage and migration of
CO2 include hydrodynamics, buoyancy,
geochemistry (precipitation / dissolution
of minerals) and density-driven flow,
dissolution of CO2 in water and residual
oil, and pressure-temperature changes
occurring in the geological formations.

Long-term fate of CO2 injected into the Weyburn Field 235
3. MODELING OF CO2 MIGRATION FROM THE
WEYBURN RESERVOIR
The modeling of CO2 migration away from the storage reservoir was
carried out in two stages, each of which is discussed separately below:
Modeling of CO2 migration away from the reservoir via natural
pathways, i.e., through the geosphere; and
Modeling of CO2 migration through abandoned wells.
3.1 Modeling of CO2 Migration Through the Geosphere
Figure 3 shows the model used as the basis for the long-term assessment
of CO2 migration in the geosphere. This geosphere model comprises a series
of formations classified as either aquifers (exhibiting relatively high
permeability) or aquitards (low permeability), and extends to ~10 km
beyond the EOR region. The various ‘compartments’ of the model were
identified as part of the detailed site characterization program. The
geosphere also includes the reservoir (Midale Marly and Vuggy formations
identified in Figure 3) beyond the EOR region.
ECLIPSE 300 (E300), a compositional simulator developed by
GeoQuest/Schlumberger, was used as the modeling tool. Although not
developed to specifically model CO2 geological sequestration, one of the
routines of the code is to simulate EOR employing a CO2 flood. Key features
of the code that are relevant to the modeling of CO2 migration include
equation-of-state capability to track the thermodynamic state of CO2, which
has low critical pressure and temperature, as well as the effect of the density
gradient due to CO2 dissolved in water.
The starting point for the long-term assessment modeling was the
projected end of EOR activities, i.e., at 2034. Thus, results obtained from the
reservoir simulation predictions for the end of the EOR period - in particular,
the CO2 in place, and pressure and fluid/component distributions within the
field - were used as starting conditions for modeling CO2 migration away
from the storage reservoir. In order to avoid up-scaling problems between
the reservoir simulation and long-term assessment models, the central area
(75 patterns) of the Weyburn field had the same resolution in both models.
Furthermore, pore volumes for the migration model were made identical to
those of the reservoir simulation model. In the central area of the geosphere
model (EOR region), the properties were replaced with the history-matched
reservoir properties used in the reservoir simulation model.
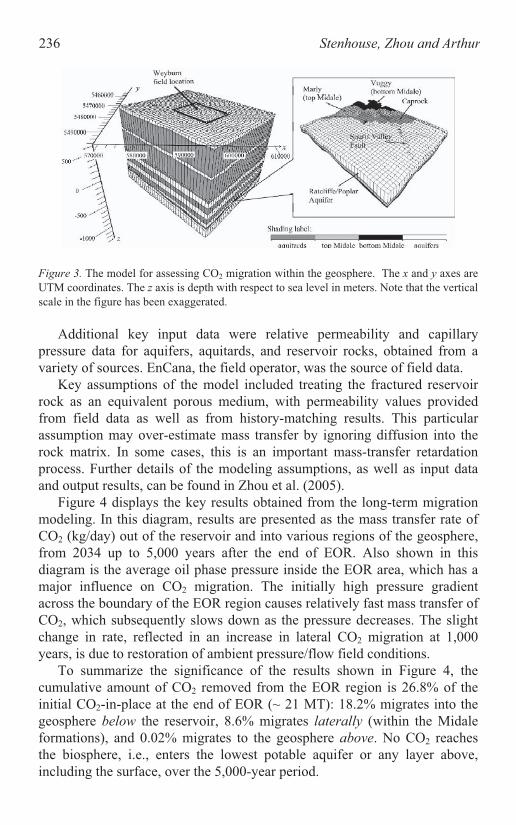
236 Stenhouse, Zhou and Arthur
Figure 3. The model for assessing CO2 migration within the geosphere. The x and y axes are
UTM coordinates. The z axis is depth with respect to sea level in meters. Note that the vertical
scale in the figure has been exaggerated.
Additional key input data were relative permeability and capillary
pressure data for aquifers, aquitards, and reservoir rocks, obtained from a
variety of sources. EnCana, the field operator, was the source of field data.
Key assumptions of the model included treating the fractured reservoir
rock as an equivalent porous medium, with permeability values provided
from field data as well as from history-matching results. This particular
assumption may over-estimate mass transfer by ignoring diffusion into the
rock matrix. In some cases, this is an important mass-transfer retardation
process. Further details of the modeling assumptions, as well as input data
and output results, can be found in Zhou et al. (2005).
Figure 4 displays the key results obtained from the long-term migration
modeling. In this diagram, results are presented as the mass transfer rate of
CO2 (kg/day) out of the reservoir and into various regions of the geosphere,
from 2034 up to 5,000 years after the end of EOR. Also shown in this
diagram is the average oil phase pressure inside the EOR area, which has a
major influence on CO2 migration. The initially high pressure gradient
across the boundary of the EOR region causes relatively fast mass transfer of
CO2, which subsequently slows down as the pressure decreases. The slight
change in rate, reflected in an increase in lateral CO2 migration at 1,000
years, is due to restoration of ambient pressure/flow field conditions.
To summarize the significance of the results shown in Figure 4, the
cumulative amount of CO2 removed from the EOR region is 26.8% of the
initial CO2-in-place at the end of EOR (~ 21 MT): 18.2% migrates into the
geosphere below the reservoir, 8.6% migrates laterally (within the Midale
formations), and 0.02% migrates to the geosphere above. No CO2 reaches
the biosphere, i.e., enters the lowest potable aquifer or any layer above,
including the surface, over the 5,000-year period.

Long-term fate of CO2 injected into the Weyburn Field 237
Figure 4. Time variation of CO2 mass transfer rates (kg/day) into the geosphere, and oil phase
pressure inside the EOR region (75 patterns) averaged over hydrocarbon pore volumes.
The substantial thickness of aquitards immediately above the reservoir
(see Figure 3) is largely responsible for restricting the vertical movement of
CO2. In addition, sensitivity studies have demonstrated that key parameters
affecting CO2 movement include the caprock permeability and the ‘entry
pressure’ (for entry of fluid into the caprock).
3.2 CO2 Leakage Through Abandoned Wells
Thousands of wells exist within the study area, i.e., within the lateral
extent of the system model. Thus, while CO2 migration through the
geosphere was treated deterministically, modeling of CO2 leakage through
abandoned wells was treated stochastically in order to address the substantial
variability of these wells. This variability is reflected primarily in the
heterogeneity of both the CO2 distribution and the rock properties within the
reservoir.
Stochastic treatment of CO2 leakage through wells was achieved using a
‘Unit-Cell’ model (Figure 5). Using this model, the key assumptions were:
Cement seal degradation corresponding to an increase in permeability
from 0.001 mD initially to 1 mD at 100 years (cf. predictions from a
supporting sub-task indicating such an increase in permeability but over
a time period of 1,000 years rather than 100 years);

238 Stenhouse, Zhou and Arthur
No loss of CO2 to fluid flow within the reservoir as well as within the
formations surrounding the wellbore;
Fast transport of CO2 once it enters the open borehole, i.e., rapid ascent
of CO2 to the surface as gas bubbles.
Given the variability and uncertainty of key parameters used in the ‘Unit-
Cell’ model, the above assumptions were considered to result in a
conservative treatment, i.e., over-estimating CO2 leakage.
Existing data (Yu, 1993) for fresh concrete used in low-level radioactive
waste disposal systems show that this material is extremely restrictive to
flow (the water phase becomes mobile at near unity saturation). The
exceedingly high capillary pressure (>20 MPa at near unity water saturation)
effectively blocks intrusion of non-aqueous phase fluids. While these
properties are valuable to sealing performance, they may not be realistic for
aged cement materials in wells. In the absence of corresponding data for
aged cement, we used an estimated capillary pressure obtained by estimating
the capillary pressure drop due to a permeability increase using existing data
for fresh cement together with the permeability-porosity relationship found
in Scheidegger (1974).
The 75-pattern EOR region was represented by 6,075 grids in the
geosphere model (Figure 3). Of these grids, 287 were selected with a bias
towards existing well locations, high CO2-in-place, and high permeability
values. Together, these selections correspond to a conservative treatment.
The ‘Unit-Cell’ model was activated for 287 simulations in which
saturation, component concentrations, and permeability values in each of the
287 grids were used as input for individual runs. The results show a large
range in leakage rates with the maximum leakage rate ranging from 0 to
0.016 kg/day. The time at which this maximum leakage rate occurred also
varied significantly. Figure 6 shows the mean, 95%, and maximum leakage
rates as a function of time obtained from these (287) runs, along with
leakage rates vs. time from selected runs.
The variability in well leakage is also shown in Figure 7, which displays
cumulative leakage of CO2 via abandoned wells as a function of time. In
general, the stochastic nature of reservoir conditions dictates stochastic
behavior of leakage through abandoned wells across the study area.
However, when the cement permeability is low ( 1 mD), the ultimate
control of leakage lies in cement permeability. When the permeability of
cement is higher (e.g., > 10 mD), reservoir properties govern the rate and
amount of CO2 leakage. To confirm this conclusion, a few ‘Unit Cell’ runs
were carried out using an increased cement permeability (10 mD) (Milli-
darcy: approximately equal to 10-8
m/s). In these cases, the results indicated
an increase in both the leakage rates and cumulative leakage, but only by a
factor of about two.
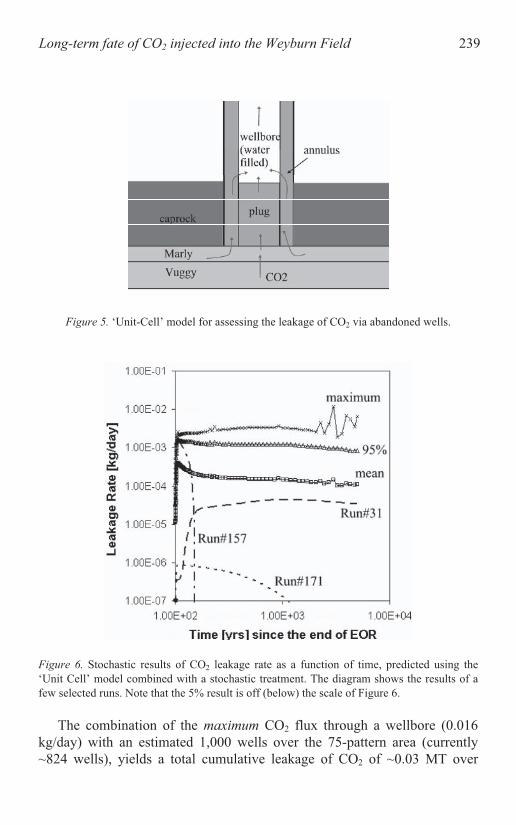
Long-term fate of CO2 injected into the Weyburn Field 239
Figure 5. ‘Unit-Cell’ model for assessing the leakage of CO2 via abandoned wells.
Figure 6. Stochastic results of CO2 leakage rate as a function of time, predicted using the
‘Unit Cell’ model combined with a stochastic treatment. The diagram shows the results of a
few selected runs. Note that the 5% result is off (below) the scale of Figure 6.
The combination of the maximum CO2 flux through a wellbore (0.016
kg/day) with an estimated 1,000 wells over the 75-pattern area (currently
~824 wells), yields a total cumulative leakage of CO2 of ~0.03 MT over

240 Stenhouse, Zhou and Arthur
5,000 years. This total amount represents ~0.14% of the total CO2-in-place
(21 MT) at the end of EOR. This value is a highly conservative upper
estimate, however, as it assumes that the maximum flux is maintained
throughout the 5,000-year period for all wells, which is not supported by the
observed results. Thus, a more representative value is the mean cumulative
leakage, corresponding to less than 0.001% of the CO2-in-place at the end of
EOR.
4. POTENTIAL ENVIRONMENTAL IMPACTS
FROM CO2 LEAKAGE TO THE BIOSPHERE
In order to put the results obtained from well leakage modeling in some
perspective, scoping calculations were carried out to address two potential
environmental impacts:
Indoor air CO2 concentration: CO2 leakage from an abandoned well
(point source) directly into the basement or lower floor of a dwelling
through cracks in the foundation. The maximum acceptable CO2 flux
from the wellbore was determined by the limiting CO2 concentration in
air (Health Canada, 1989).
Mobilization of trace metals into drinking water: CO2 leakage from an
abandoned well directly into a potable groundwater, changing the water
chemistry, which in turn promotes the release of a toxic trace metal
(lead) into the water supply. The maximum acceptable CO2 flux in this
case was determined via geochemical modeling, taking into account an
interim drinking water standard for dissolved lead (Langmuir, 1997).
Evaluation of the above cases indicated that the more restrictive example
is CO2 leakage into a potable aquifer, yielding a limiting CO2 leakage rate of
similar magnitude to the mean cumulative leakage described in the previous
section.
Given that only scoping calculations were carried out, more detailed
treatments of these environmental impacts are required, particularly in the
case of trace metal release into drinking water, before making a definitive
statement on an acceptable CO2 leakage rate to the biosphere.

Long-term fate of CO2 injected into the Weyburn Field 241
Figure 7. Stochastic results of cumulative leakages of CO2 via abandoned wells.
5. SUMMARY
For the Base Scenario identified for the IEA Weyburn Project, modeling
of CO2 migration within the geosphere indicated that up to 75% of the initial
CO2-in-place (at the end of EOR) remained within, and in the vicinity of, the
EOR region. No CO2 enters the biosphere within the simulation period of
5,000 years.
Modeling of leakage via abandoned wells focused on the performance of
degraded cement sealing combined with the variability of properties and
CO2 distribution in the reservoir. The conservative treatments incorporated
in stochastic modeling provided upper bounding results indicating that the
maximum possible leakage after 5,000 years is approximately 0.14% of the
initial CO2-in-place. However, the likely cumulative leakage after 5,000
years, however, is less than 0.001% of the initial CO2-in-place.
These results mean that if the Weyburn CO2 storage system evolves as
expected, the goal of storing greenhouse gas CO2 will be achieved. Future
assessments should focus on alternative scenarios, including seismic activity,
open wellbores, and human intrusions.

242 Stenhouse, Zhou and Arthur
ACKNOWLEDGEMENTS
The modeling work described here could not have been accomplished
without the technical input from project sub-tasks involving many
disciplines, including geology and hydrogeology, geochemistry,
geomechanics, reservoir simulation, seismic and wellbore technology.
Without naming individual participants, we gratefully acknowledge their
contributions as well as their willingness to discuss and review results.
REFERENCES
Cranwell, R.M., Guzowski, R.V., Campbell, J.E., and Ortiz, N.R., 1982, Risk methodology
for geologic disposal of radioactive waste: scenario selection procedure, Sandia National
Laboratory Report SAND80-1429, NUREG/CR-1667, Albuquerque, New Mexico.
Goodwin, B.W., Editor, 1991, Scenario analysis for the post-closure assessment of the
Canadian concept for nuclear fuel waste disposal, AECL Report AECL-10717, COG-93-
7, Pinawa, Canada.
Health Canada, 1989, Exposure Guidelines for Residential Indoor Air Quality, Report of the
Federal-Provincial Advisory Committee on Environmental and Occupational Health.
Report first published April 1987, revised July 1989. Ministry of Supply and Services,
Canada.
Savage, D., Editor, 1995, The Scientific and Regulatory Basis for the Geological Disposal of
Radioactive Waste, John Wiley & Sons, Chichester, UK, 437 pp.
Scheidegger, A. E., 1974, The Physics of Flow through Porous Media, University of Toronto
Press, Toronto, Canada.
Stenhouse, M.J., Miller, W.M., and Chapman, N.A., 2001, System studies in PA:
Development of Process Influence Diagram (PID) for SFR-1 Repository: near-field + far-
field, SKI Report 01:30. Swedish Nuclear Power Inspectorate, Stockholm, Sweden.
Yu, A.D., Langton, C.A., and Serrgato, M.G., 1993, Physical Properties Measurement,
Savannah River Company Report WSRC-RP-93-894, Westinghouse, Savannah River
Company.
Zhou, W., Stenhouse, M.J., Arthur, R., Whittaker, S., Law, D.H.-S., Chalaturnyk, R., and
Jazrawi, W., 2005, The IEA Weyburn CO2 Monitoring and Storage Project – Modeling of
the long-term migration of CO2 from Weyburn, accepted for publication in the
Proceedings of the GHGT7 Conference (2005). Prior to publication, this paper can be
accessed at: <http://uregina.ca/ghgt7/PDF/papers/peer/582.pdf>.
Langmuir, D., 1997, Aqueous Environmental Chemistry (Prentice Hall, Upper Saddle River,
New Jersey), 600 pp.

STRONTIUM ISOTOPE (87
SR/86
SR) CHEMISTRY
IN PRODUCED OIL FIELD WATERS: THE IEA
CO2 MONITORING AND STORAGE PROJECT
F. Quattrocchi1, M. Barbieri
2, R. Bencini
1, D. Cinti
1, K. Durocher
4, G. Galli
1,
L. Pizzino1, M. Shevalier
3 and N. Voltattorni
1
1INGV Section Roma, Fluid Geoch. Lab., Via di Vigna Murata 605, 00143, Rome, Italy
2IGAG-CNR, c/o University “La Sapienza”, P.le Aldo Moro 5, 00185, Rome, Italy;
3Dept. of
Geology & Geophysics, 2500 University Dr. NW, Calgary, AB, T2N 1N4 Canada; 4Alberta
Research Council, 3608-33rd Street, NW, Calgary, AB, T2L 2A6, Canada. (E-mail:
Abstract: EnCana’s CO2 injection EOR project at Weyburn Saskatchewan (Canada) is
the focal point of a multi-faceted research program, sponsored by the IEA
GHG R&D and numerous international industrial and government partners.
More than yearly strontium isotope, trace element and dissolved gas surveys
were conducted by INGV in conjunction with the thrice yearly borehole fluid
sampling trips performed by the Canadian partners. This paper focuses on the
Sr isotope monitoring. Approximately 25 samples were collected over three
years for 87
Sr/86
Sr analyses. At Weyburn, a water-alternating-gas (WAG) EOR
technique is used to inject water and CO2 into the Mississippian Midale
reservoir. 87
Sr/86
Sr ratios for produced fluids fall between 0.7077 and 0.7082,
consistent with published values for Mississippian fluids and carbonate
minerals. A small 87
Sr/86
Sr component of this produced fluid is derived from
waters of the Cretaceous Mannville aquifer, which has been used for water-
flooding EOR since 1959. The progressively more positive Sr isotope trend
from 2001 to 2003 may be due to: 1) a smaller Mannville aquifer component
in the water flooding process; and/or 2) the dissolution of Mississippian host
rocks during the ongoing CO2 injection. Evidence that 87
Sr/86
Sr values are
approaching those of Mississippian host-rock values may point towards zones
of carbonate dissolution as a result of continuing CO2 injection. This
hypothesis is strengthened by i) 13
C data; ii) preliminary “gross composition”
of dissolved gases (H2S, CO2, CH4, He, H2) and iii) by trace elements data.
Key words: CO2 geological storage monitoring, EOR Weyburn oil field brines, Sr
isotopes.
243
S. Lombardi et al. (eds.),
Advances in the Geological Storage of Carbon Dioxide, 243–259.
© 2006 Springer. Printed in the Netherlands.
244 Quattrocchi et al.
1. INTRODUCTION
The Weyburn oil field, presently owned and operated by EnCana
Resources, is located approximately 120 km SE of Regina (Canada). After
the discovery of the field in 1954 and its primary depletion in middle 1964,
other tools were exploited, such as horizontal wells and water flooding.
Since August 2000, CO2-Enhanced Oil Recovery (EOR) has also been
performed, with around 5000 tons/day of CO2 being injected within the
Mississippian Midale Beds oil reservoir at a depth of 1300-1500 m. The
“Phase A1” early injection area currently comprises around 90 oil producers,
30 water injectors and 30 CO2 injection wells (Wilson & Monea, 2004; Tian
et al., 2004). Recent studies (Tian et al., 2004) stated that after 3 years of
CO2 injection oil production increases have been relatively slow, with
responses only in 30 wells and increases in the average oil production per
well from around 6 to 11 m3/day and an increase in the Gas/Oil Ratio of the
Phase A1 area from around 20 to 33 m3/m
3. The CO2-storage efficiency
decreases with an increase in the amount of CO2 produced together with oil
and water. Apart from industrial exploitation, the EnCana CO2 injection
EOR project at Weyburn is the focal point of a multi-faceted research
program to “co-optimise” CO2-EOR production and CO2-geological storage
within the framework of the Kyoto Protocol. This work is sponsored by the
IEA GHG R&D and numerous international industrial and government
partners, including the European Community (Riding & Rochelle, 2005).
Together with reflection seismic monitoring of the evolution of CO2
distribution at depth (recent papers on http://www.uregina.ca/ghgt7/), the
geochemical monitoring tools are mainly: i) soil gas geochemistry, to
discover and monitor possible CO2 surface leakage (Jones et al., 2005) - this
tool is particularly important in geo-dynamic areas where the risk assessment
of CO2 geological storage sites must be very accurate (Quattrocchi, 2003,
2004); and ii) deep-reservoir fluid geochemistry (Gunter et al., 2000;
Quattrocchi et al., 2004; Perkins et al., 2004, Shevelier et al. 2004). In the
Weyburn case, we are dealing with a 3-phase reservoir (water-gas-oil)
requiring complex chemical equilibria, diffusion and thermodynamic models
(Nitao, 1996; Czernichowski-Lauriol et al., 2001; Quattrocchi et al., 2003;
Chapoy et al., 2004; Tian et al., 2004, Le Nidre and Gaus, 2004).
INGV has conducted geochemical monitoring experiments from pre-
injection (“Baseline”, B0, August 2000) to the present day (September,
2004, see Appendix). The purpose of produced fluid and gas monitoring was
to identify and ultimately quantify water-gas-rock reactions in the reservoir;
in this paper we are focusing on the Sr isotope results. These data may help
in reconstructing the evolution of the fluid reservoir prior to and during the
injections stages (after Sunwall and Pushkar, 1979; Smalley et al., 1988). At
245
Weyburn, the situation of the reservoir composition is complicated by the
water-alternating-gas (WAG) EOR technique, which has been used to inject
water into the Midale beds over a forty year period. Unfortunately strontium
isotopic compositions of the produced reservoir oil brines prior to upper-
water flooding (i.e. prior to 1959) are not available, therefore we may only
record the evolution of the oil waters since the beginning of CO2-injection.
Clearly, therefore, the isotopic signature of the Mississippian Midale
reservoir waters had already been modified by previous mixing with waters
from the overlying, hydraulically-separated, Cretaceous, Mannville aquifer.
CO2 geological storage is mainly limited within the oil reservoir stratum
(around 20-30 m thick), considering that diffusion within, and reactivity of,
the cap-rock is limited, with extremely low migration rates even in the
highest impact scenario of CO2 diffusivity / advection to the surface
(Czernichowski-Lauriol et al., 2001; Le Nidre & Gaus, 2004).
In mature reservoirs, Sr isotopes can be used to differentiate original
formation water from injected water for water-flood surveillance (Smalley et
al., 1988; Bernaby et al., 2004 and references herein). In the present work Sr
isotope data (partially discussed in Quattrocchi et al., 2003) are also
supported by: i) major, minor and trace element chemistry; ii) the
preliminary “gross composition” of dissolved gases; and iii) carbon isotopic
ratios (after Hutcheon et al., 2003).
The use of Sr isotopic ratios for this application is possible by modeling
two-component mixing in the framework of Sr isotope time-tuning curves
(Veizel and Compston, 1974; Burke et al., 1982; Popp et al., 1986; McNutt
et al., 1990; Jones et al., 1994; Denison et al., 1994; Bruckschen et al., 1995;
Romer et al., 2003; Barnaby et al., 2004). The Sr isotopic composition of
formation waters could yield a significant contribution for the
characterization of reservoir properties, such as connectivity between strata
and reservoir heterogeneity, and thus to evaluate regional fluid flow and to
interpret the evolution of fresh and saline groundwaters. Data on the Sr
isotopic compositions of oil field waters from a variety of reservoir rocks are
abundant in a number of recent publications (Starinsky et al., 1983; Stueber
et al. 1987; Russel et al., 1988; Franklyn et al., 1991; Chaudhuri and Clauer,
1993; Russell et al., 1988; Notsu et al., 1988; Nakano et al., 1989).
Strontium isotopes thus provide a potential tracer for both static (fluid
flow on geological scale) and dynamic (fluid flow on production timescale)
reservoir characterization in conjunction with conventional studies using
seismic, log, core, well test and production data. Strontium isotopes are
especially sound to better understand formation waters patterns because the
Sr isotope composition of water samples collected at the well head is known
to be identical to that of the subsurface fluid (Quattrocchi et al., 2003;
Bernaby et al., 2004). By using a geochemical, multi-component approach to
Strontium Isotope Chemistry in the Weyburn Oil Field Waters

246 Quattrocchi et al.
better understand the ongoing formation oil/brine-related processes (Fisher
et al., 1987; McNutt et al., 1987; Connolly et al., 1990), we may fully and
better predict the long-term storage of CO2 in the subsurface at the Weyburn
oil-field, the most studied and multi-faced CO2-EOR project in the world at
present (Wilson & Monea, 2004).
2. METHODS
The Appendix summarises the INGV geochemical surveys during the
Weyburn IEA-EC Project, from August 2000 to September 2004, for
strontium isotope, major, minor and trace element and dissolved gas
analyses. The laboratory analytical methods, applied to the liquid phase,
were used after sampling the oil waters at the oil or gas well-head within
collapsible, approx. 1-gal LDPE containers and allowing them to sit for a 1-2
minutes to achieve gravity separation of water and hydrocarbons. 87
Sr/86
Sr isotopic ratios were analysed from Sr dissolved in oil-water
using standard mass spectrometry methods coupled with the following
sample preparation technique (modified after Jones et al., 1994;
Quattrocchi et al., 2003): 100 mL of sample is added to 50 mg of
Na2CO3 to transform the sulphates (SrSO4, BaSO4) into carbonates. The
final product of this reaction is filtered and washed to completely
eliminate the sulphate ions. The residual on the filter was dissolved with
2.5 N HCl and the obtained solution was evaporated. The dry residue
was dissolved with 2.5 N HCl and the strontium was separated from the
other elements using a cation exchange resin (DOWEX resin type). This
element is placed (as Sr(NO3)2) on a tantalium filament and the 87
Sr/86
Sr
ratio is measured by a VG 54E mass spectrometer (University of Rome).
The87
Sr/86
Sr values were then normalised to the standard ratio of
0.1194. The analytical measurements are affected by an error expressed
as 2 times the standard deviation (± 0,00002).
The dissolved gas analytical method is based upon the partitioning of
gases between the liquid and gas phase in the head-space of the sampler
(Capasso & Inguaggiato, 1998). A Chrompack™ CP2002 portable gas-
chromatograph is used in the laboratory to analyse CO2, CH4, H2S, H2,
N2, O2, and light hydrocarbons (C2-C4), while He is also analysed with
an ALCATEL mass spectrometer. As the dissolved gases were not
sampled at borehole P,T,[X] conditions, it is necessary to correct the
analytical data to the reservoir pressure of 16 MPa (1300-1500 m),
considering also kinetic effects. The degassing during the rise of fluids
from 16.5 MPa (reservoir pressure) to 0.1 MPa (atmospheric pressure)
can be calculated following certain principles (Chapoy et al., 2004; Tian
247
et al., 2004; Renè Perez, personnel communication, work in progress).
This can be done for each dissolved species, assuming a constant pump
rate, sampling time and stripping effects before the immediate sampling
of the oil waters at surface. At present we will only discuss the data
gathered by sampling at 0.1 MPa pressure, as the “gross composition” of
the reservoir evolution.
Alkalinity is measured (U of C partner) by an ORION 960 titrometer
(with 0.16M H2SO4) soon after the oil water sampling, considering
HCO3 + CO3 and oily alkali.
trace elements (partially discussed in this paper) were analysed by multi-
component ELAN™ 6000 ICP for the following elements:, Be, B, Al,
Si, Fe, Ni, Pb, Mn, Rb, Sr, Ag, Ba, Br, Cd, Cs, Cr, Cu, As, and Zn.
Measurements are affected by an error expressed as 2 times the standard
deviation.
Major elements (partially discussed in this paper) are analysed by
DIONEX HPLC; a charge imbalance of less than ± 5-10 % is
considered acceptable.
Geochemical Modeling, partially discussed in this paper (Cantucci B,
PhD thesis in progress, INGV-University of Florence Italy 2004-2006),
is accomplished by PHREEQC version 2.10 (Parkhurst and Appelo,
1999). The oil water composition is imposed both during kinetic
evolution and in final equilibrium with the Vuggy and Marly rock
compositions.
Contour maps are created with the kriging technique within the program
Surfer, while the “gross composition” of dissolved gases are discussed
using normal probability plots (Sinclair, 1991).
3. RESULTS AND DISCUSSION
Approximately 25 samples were collected during the M 1 (March 2001),
M 5 (July 2002), M 7 (March 2003), and M 9 (September 2003 partially
analysed, not discussed) surveys for 87
Sr/86
Sr analyses. 87
Sr/86
Sr ratios found
in the produced fluids from the Mississippian Midale beds fall between
0.7077 and 0.7082, consistent with published values for Mississippian fluids
and carbonate minerals (approximately from 0.7076 - corresponding to 330
Ma ago - to 0.7082 corresponding to 360 Ma ago - Bruckschen et al., 1995;
see Fig.1, Table 1).
Most of the sedimentary formation waters migrated over long distances
prior to entrapment in the reservoir rocks from which the waters are
sampled. Nearly two-thirds of the formation brines have higher 87
Sr/86
Sr
Strontium Isotope Chemistry in the Weyburn Oil Field Waters

248 Quattrocchi et al.
ratios than marine Phanerozoic seawaters, whose values range between
0.7068 and 0.7062 (Veizer and Compston, 1974; Notsu et al., 1988).
Monitor 1 Monitor 5 Monitor 7 87
Sr/86
Sr Min 0.70775 0.70800 0.70797
Max 0.70825 0.70818 0.70818
Mean 0.70798 0.70804 0.70807
87Sr Min -0.63 -0.28 -0.32
Max 0.08 -0.03 -0.03
Mean -0.31 -0.23 -0.19
Manville Mississipian 1st survey 3
rd survey
87Sr/
86Sr 0.7073 0.7082 0.70798 0.70807
Figure 1. Williston Basin hydro-stratigraphy and nomenclature (modified from Bachu and
Hicheon, 1996). Arrow (I) indicates that water from the Mannville Aquifer System is used for
water-flooding. The symbols (?) are added to leave in question the use of upper aquifers for
water-flooding. Arrow (II) indicates that water produced with oil is continuously re-injected.
Table 1. Sr isotope data for the M1, M5, M7 Weyburn oil-waters.

249
The Pennsylvanian seawater (over the Mississippian ones) has 87
Sr/86
Sr
values around 0.7083 (normalised to NBS 987 = 0.710255; Popp et al.,
1986; Denison et al., 1994; Bernaby et al., 2004).
The Mannville aquifer, used since 1959 for water flooding of the
Weyburn oil-field, is a Cretaceous arenite, with 87
Sr/86
Sr values between
0.7072 and 0.7073 which corresponds to an age of 140 Ma BP (Jones et al.,
1994). A small component of the recycled fluid is derived from the
Mannville aquifer and is re-injected into the Midale beds via a water-
alternating-gas (WAG) EOR technique, as mentioned. Strontium isotopic
compositions of the produced water prior to water flooding (i.e., prior to
1959) are not available. Other case histories describe the use of Sr isotopes
to discriminate water-flooding injection components from the formation
water (i.e., Smalley et al., 1988), mostly when the injected water has a Sr
content and 87
Sr/86
Sr ratio which is different from the in-situ formation
water. The lowest values of the Sr isotopic ratio found in the oil waters could
represent a higher degree of mixing between the two aquifers (Fig. 2). We
started to analyse the oil water Sr isotopes in 2001, around 40 years after the
beginning of water flooding. Despite this fact we found Sr values of the oil
water in the range of the Mississippian host rock (Midale reservoir),
although a certain percentage of the Sr isotopic ratio could be referable to
the Mannville component. Average Sr ratios and mass balance calculations
suggest that as much as 25% of the produced fluid in 2001 was derived from
the Mannville aquifer, decreasing to 15% in 2003.
The progressively more positive (i.e. higher) trend in the Sr isotopes from
2001 to 2003 may be due to: i) a smaller Mannville aquifer component in the
water flood over the last three years and/or ii) the enhanced dissolution of
Mississippian host rock during progressive CO2 injection.
If the leaching of Mississippian host rocks is increased (as a consequence
of CO2 injection) it could shift the values towards the pre-water-flooding Sr
isotopic “baseline” values, affected by 40 years of water-flooding which
added a 25% Mannville component. In general terms, the lowest Sr isotopic
ratio values found thus far may represent a higher “contamination” of
Mississippian Midale fluids by re-injected Mannville flooding water. It may
involve progressively lower Sr isotopic values which may coincide with the
highest injection volumes of Cretaceous waters, as there is no natural
communication or mixing between the two aquifers (no fluid pathways have
yet been found in the highly impermeable Jurassic-Triassic Watrous
Formation). Considering this general process, we observed instead a
progressive decrease of the Mannville “contamination” from 2001 to 2003.
Therefore, the more probable scenario is that the 87
Sr/86
Sr values are
progressively approaching the Mississippian host-rock values and may point
towards zones of carbonate dissolution resulting from continued CO2
Strontium Isotope Chemistry in the Weyburn Oil Field Waters

250 Quattrocchi et al.
injection. Carbonate minerals within the Midale beds, which were
precipitated from waters during the Mississippian, would have Sr ratios
consistent with what would be considered a “baseline” isotopic composition.
The leaching of strontium during dissolution of these minerals would drive
the Sr composition of the produced waters to heavier values, thereby
masking the Mannville aquifer contribution.
In summary, the sectors (Fig. 2) characterised by the lowest Sr isotopic
ratio values represent “contamination zones” of Mississippian Midale fluids
by re-injected Mannville flood water. These zones exhibit lower Sr isotopic
values that may coincide with the highest injection volumes of Cretaceous
water. Concurrently, the average field-wide 87
Sr/86
Sr values are approaching
Mississippian host-rock values and may point towards sectors of the field
(Fig. 2) characterised by higher carbonate dissolution, as a result of
continued CO2 injection.
This hypothesis is strengthened by the 13
C data available up to
September 2004, as well as by other chemical data of previous surveys
(Hutcheon et al., 2003 and papers in http://www.uregina.ca/ghgt7/). Using 13
C values of produced bicarbonates and CO2, the University of Calgary has
outlined both injected CO2 and carbonate mineral dissolution in the
reservoir.
The available Sr-C isotopic ratios in the produced fluids (up to
September 2004) corroborate the hypothesis of chemical and isotopic input
from dissolved carbonates, although further surveys could modify this
statement relative to early stages of the water-rock interactions in the oil
reservoir. Initially, the injected CO2 had a distinctive 13
C signature of –
35‰., however since 2002 CO2 recycling and re-injection has changed this
signature to between –20 to –25‰. Therefore the second strontium isotope
scenario outlined above fits well with the 13
C data. The Sr isotopic ratio in
produced fluids tends to increase with time, suggesting input from dissolved
strontium bearing carbonates.
Sr isotopic ratios of minerals (anhydrite, dolomite, calcite of the Midale
and Vuggy Formations) from the Weyburn reservoir Phase A1 area are
available from Queen’s University. These data are consistent with the
produced Mississippian brine because they range from 0.70567 to 0.708995,
with an average value of 0.708134 ± 0.0001563. It is possible to assume
that the dissolution of these minerals would push the Sr isotopic ratio of the
oil waters from values closer to 0.7073 (Cretaceous Mannville aquifer)
towards the reservoir values of 0.7076-0.7082 (Mississippian Midale-
Vuggy), again strengthening the second Sr isotope theory mentioned above.
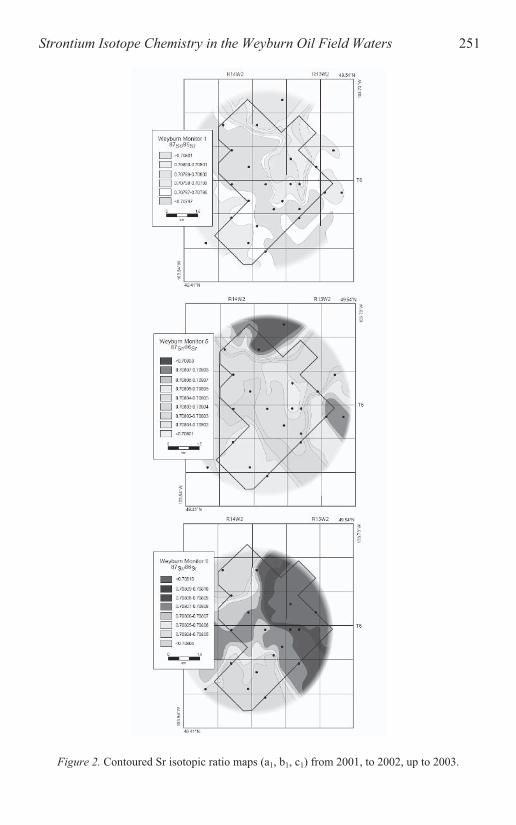
251
Figure 2. Contoured Sr isotopic ratio maps (a1, b1, c1) from 2001, to 2002, up to 2003.
Strontium Isotope Chemistry in the Weyburn Oil Field Waters

252 Quattrocchi et al.
If a number of sources exist, evolving from varied mixed compositions, it
could be represented by binary diagrams as 1/Sr versus 87
Sr/86
Sr (Fig. 3 a),
where coexistent linear trends are often found (Chaudhuri and Clauer, 1993).
An isotopic trend with a very high positive slope could be explained in terms
of the mixing of Sr derived from two sources which are markedly different
in both their isotopic composition and Sr contents. On the other hand a low
positive slope in the isotopic trend could be explained by either mixing
between two sources of Sr or dilution of a single source of Sr. In the
Weyburn case, considering only the first two analysed surveys (Sr available
only for M1-2001 and M5-2002; see Fig. 3 a), it is clear that a unique
“gross” population effectively changed in terms of mixing from 2001 (lower 87
Sr/86
Sr ratios and higher Sr concentrations closer to the Mannville
component) to 2002 (higher 87
Sr/86
Sr ratios and lower Sr concentrations
closer to the Mississippian component). A small group forms an anomaly of
relatively low Sr values (WEY 35, 42 and 45 - wells corresponding to the
vertical EnCana wells 12-25 (6-14), 14-23 (6-14), and 12-19 (6-13),
respectively), which may have been caused by dilution, considering also the
slightly lower salinities as a whole. Alternatively a local differential
immobilization by sulphates-carbonates could be possible (“short term”
geochemical modelling considering kinetic parameters is in progress, while
“long term” modelling has been partially completed; Perkins et al., 2004).
The WEY 5 well (corresponding to the vertical EnCana well 1-11 (6-14))
seems to be pertinent to slightly deeper strata.
Figure 3. Binary diagrams of (a) 87
Sr/86
Sr versus 1/Sr; (b) 87
Sr/86
Sr versus Na/Cl of the
Weyburn oil-brines (M1 and M5 surveys).
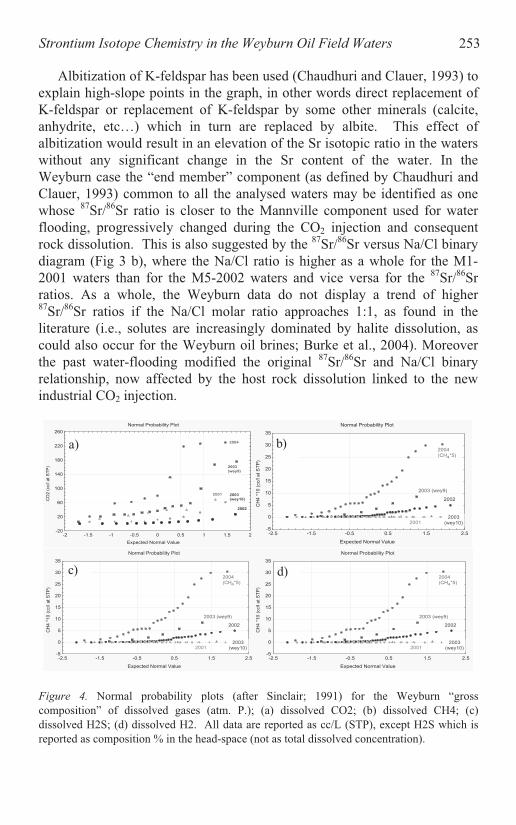
253
Albitization of K-feldspar has been used (Chaudhuri and Clauer, 1993) to
explain high-slope points in the graph, in other words direct replacement of
K-feldspar or replacement of K-feldspar by some other minerals (calcite,
anhydrite, etc…) which in turn are replaced by albite. This effect of
albitization would result in an elevation of the Sr isotopic ratio in the waters
without any significant change in the Sr content of the water. In the
Weyburn case the “end member” component (as defined by Chaudhuri and
Clauer, 1993) common to all the analysed waters may be identified as one
whose 87
Sr/86
Sr ratio is closer to the Mannville component used for water
flooding, progressively changed during the CO2 injection and consequent
rock dissolution. This is also suggested by the 87
Sr/86
Sr versus Na/Cl binary
diagram (Fig 3 b), where the Na/Cl ratio is higher as a whole for the M1-
2001 waters than for the M5-2002 waters and vice versa for the 87
Sr/86
Sr
ratios. As a whole, the Weyburn data do not display a trend of higher 87
Sr/86
Sr ratios if the Na/Cl molar ratio approaches 1:1, as found in the
literature (i.e., solutes are increasingly dominated by halite dissolution, as
could also occur for the Weyburn oil brines; Burke et al., 2004). Moreover
the past water-flooding modified the original 87
Sr/86
Sr and Na/Cl binary
relationship, now affected by the host rock dissolution linked to the new
industrial CO2 injection.
Normal Probability Plot
Expected Normal Value
CO
2 (
cc/l a
t S
TP
)
-20
20
60
100
140
180
220
260
-2 -1.5 -1 -0.5 0 0.5 1 1.5 2
2004
2003
(wey9)
2003
(wey10)
2001
2002
Normal Probability Plot
Expected Normal Value
CH
4 *
10
(cc/l a
t S
TP
)
-5
0
5
10
15
20
25
30
35
-2.5 -1.5 -0.5 0.5 1.5 2.5
2003 (wey9)
2001
2002
2004
(CH4*5)
2003
(wey10)
Normal Probability Plot
Expected Normal Value
CH
4 *
10
(cc/l a
t S
TP
)
-5
0
5
10
15
20
25
30
35
-2.5 -1.5 -0.5 0.5 1.5 2.5
2003 (wey9)
2001
2002
2004
(CH4*5)
2003
(wey10)
Normal Probability Plot
Expected Normal Value
CH
4 *
10
(cc/l a
t S
TP
)
-5
0
5
10
15
20
25
30
35
-2.5 -1.5 -0.5 0.5 1.5 2.5
2003 (wey9)
2001
2002
2004
(CH4*5)
2003
(wey10)
a)
d)c)
b)
Figure 4. Normal probability plots (after Sinclair; 1991) for the Weyburn “gross
composition” of dissolved gases (atm. P.); (a) dissolved CO2; (b) dissolved CH4; (c)
dissolved H2S; (d) dissolved H2. All data are reported as cc/L (STP), except H2S which is
reported as composition % in the head-space (not as total dissolved concentration).
Strontium Isotope Chemistry in the Weyburn Oil Field Waters

254 Quattrocchi et al.
Also the available “gross composition” of the dissolved gases (see the
limitations in the methods paragraph detailed in Quattrocchi et al., 2003 and
in Riding & Rochelle, 2005) are helpful in jointly interpreting the Sr isotopic
data. Available dissolved gas data strengthens the second hypothesis, i.e.
enhanced Mississippian rock dissolution. In oil brines CO2 solubility is
dependent on T, P, fugacity coefficient, salinity (eq. NaCl), and detailed
chemical composition. Theoretically, from chemical equilibria calculations
(Czernichowski-Lauriol et al., 2001; Perkins et al., 2004), more than 1 mole
of CO2 can dissolve into 1 kg of water for typical Weyburn reservoir brines
(50°C, 14 MPa, salinity range from 35 to 110 g/l).
The steep salinity gradient in the Weyburn area will greatly affect CO2
solubility, migration and reactivity as demonstrated by the regional 2D
modelling of natural fluids in the Mississippian aquifer (BRGM deliverables
within the EC Weyburn Project, Riding & Rochelle, 2005). Normal
probability plots (Sinclair, 1991) of the 2001-2004 dissolved gases in the
Weyburn oil-waters (Fig. 4) exhibit, as mentioned, the “gross composition”
evolution, before the “degassing correction”. We found a general increase of
the main dissolved gases (CO2, CH4, H2S) for the different surveys (2001-
2004), parallel to the increase of the Sr isotopic ratio increases. In particular
progressive increases of dissolved CO2, CH4 and H2S were observed, while
H2 initially increased then it decreased after 2002. Dissolved He, after an
abrupt early increase, decreased after 2003; the initial increasing stage was
very probably due to the release of accumulated crustal He from the rock-
matrix during CO2-driven dissolution (Torgersen & Clarke, 1987).
Our dissolved CO2 data are essentially consistent with the Tian et al.
(2004) calculations, performed following the Material Balance Equation
method (MBE). These authors stated that approximately 86% of injected
CO2 can be dissolved into reservoir oil, 7% into water and 7% will occur as
free gas. This occurs mainly in the early stages of CO2 injection (Gunter et
al., 2000). Moreover with the increase of CO2 injection time, the percentage
of CO2 dissolved in oil decreased by a small degree and the percentage of
CO2 dissolved in reservoir water and as free CO2 increased slightly. This is
because progressive oil recovery will result in a decrease in the average oil
saturation and increase in the average water saturation. As a result, for the
authors, the injected CO2 had more chance to contact (dissolve in) the water
phase than the oil phase, even though under reservoir conditions the
solubility of CO2 in oil is larger than that in water (b factor).
The increase of both dissolved gases and selected trace metals
(Quattrocchi et al., 2003, reported in Riding & Rochelle, 2005) during the
Phase 1 A is consistent with the second Sr isotope scenario outlined above,
which highlights host-rock dissolution as the main process during the B0-
M1-M9 (i.e. injection) period. During the first year of CO2 injection

255
preliminary trace element data in the Weyburn oil waters showed an initial
increase of Al, Be, Ba, Fe, Cr and a decrease of Ni, Cu, Zn. This different
behaviour among trace metals depends mainly on redox/acidic geochemical
barriers (Perel’man, 1986) developing within the reservoir and mainly
around the injection wells during CO2 injection.
Our available trace metals data for the Weyburn oil-field could be
interpreted within the framework of the Basinal Brine Theory (Kharaka et
al., 1987), such that high dissolved metal concentrations in the presence of
aqueous sulphide species require acidic solutions with pH values lower than
those generally obtained in basinal brines. Very acidic solutions in some
sectors of the reservoir are assured by CO2 injection. From the mixture it
will lead to non-equilibrium in the reaction: H2S (gas) > H2S (aqu) and will
result in the transfer of gas to the water phase (Kharaka et al., 1987) in
agreement to our dissolved H2S data. This process will continue until
essentially all the metals are precipitated as sulphides, as suggested by early
PHREEQC chemical equilibria calculations (in progress and outlined in
Quattrocchi et al., 2003). We suggest, in the frame of future Weyburn field
monitoring, to merge more strictly the periodically measured parameters
pertaining to different phases, i.e., dissolved H2S together with the H2S
“free gas phase” (U of C data), as well as with the trace metal contents, to
also study the sulphide precipitation/dissolution equilibria. Both chemical
dissolution of the Mississippian Midale-(Marly)-Vuggy oil host-rocks and
CO2 dissolution as part of “solubility trapping” (Gunter et al., 1993; 1997,
2000) are clearly outlined by merging the Sr isotopic ratio evolution with
other isotopic and chemical data collected for Weyburn oil waters (Hutcheon
et al., 2003; Perkins et al., 2004; Shevelier et al., 2004).
4. CONCLUSIONS
From the Sr isotopic data of the Weyburn oil brines collected during the
CO2 EOR early injection period spanning from March 2001 to September,
2003 we found an evolution of the water-rock interaction processes. The
progressively more positive (i.e., higher) trend in the Sr isotope ratios from
2001 to 2003 is suggested to be due to the dissolution of the Mississippian
host rock. Carbonate minerals within the Midale beds precipitated from
waters during the Mississippian, and therefore would have Sr ratios
consistent with what would be considered a “baseline” isotopic composition.
The leaching of strontium from the dissolution of these minerals would drive
the Sr composition of the produced waters to heavier values, thereby
masking the Mannville aquifer contribution. This hypothesis is strengthened
by the 13
C data, by the Sr isotopes of the reservoir rocks as well as by the
Strontium Isotope Chemistry in the Weyburn Oil Field Waters

256 Quattrocchi et al.
evolution of other chemical data (dissolved gases, trace metals, major
element chemistry).
In summary the Sr isotopic ratio in produced fluids corroborates the
hypothesis of chemical and isotopic input from dissolved carbonates,
strengthening the foreseen prevalent solubility trapping of CO2 during the
2001-2004 Weyburn early CO2 injection phase.
Results of this work suggest the usefulness of the Sr geo-chronological
curves for the study of evolving CO2 geological storage studies. The
comparison between newly produced oil brine data and the data of
Bruckschen et al., 1995, relative to the Dinatian Sr isotope record, show the
potential of the Sr isotope geo-chronological curve, together with all the
literature data.
ACKNOWLEDGEMENTS
We are grateful to the European Community which funded the Weyburn
Project (Contract N. ENK5-2000-00304). A particular thank you is extended
to Ken Ferguson and Dan Fradette working at the Weyburn EnCana oil field.
REFERENCES
Bachu, S., and Hitchon, B., 1996, Regional-scale flow of formation waters in the Williston
Basin, AAPG Bulletin 80(2): pp. 248-264.
Barnaby, R., Oetting, G.C. and Gao, G., 2004, Strontium isotopic signatures of oil-field
waters: applications for reservoir characterization, AAPG Bullettin 88 (12): 1677-1704.
Bruckschen, P., Bruhn, F., Veizer, J. and Buhl, D., 1995, 87
Sr/86
Sr isotopic evolution of
Lower Carboniferous seawater: Dinatian of Western Europe, Sedimentary Geology 100:
63-81.
Burke, W.H., Denison, R.E., Hetherington, E.A., Koepnick, R.B., Nelson, H.F. and Otto, J.B.,
1982, Variation of seawater 87
Sr/86
Sr through Phanerozoic time, Geology, 16: 516-519.
Capasso, G. and Inguaggiato, S., 1998, A simple method for the determination of dissolved
gases in natural water. An application to thermal water from Vulcano Island, Applied
Geochem. 13: 631-642.
Chaudhuri, S. and Clauer, N., 1993, Strontium isotopic compositions and potassium and
rubidium contents of formation waters in sedimentary basins: clues to the origin of the
solutes, Geochemica Cosmoch. Acta 57: 429-437.
Chapoy, A., Mohammadi, A.H., Tohidi, B., Richon, D., 2004, Gas solubility measurement
and modeling for the Nitrogen + Water System from 274.18 to 363.02 K, J., Chem. Eng.
Data 49: 1110-1115.
Connolly, C.A., Walter, L.M., Baadsgard, H. and Longstaffe, F.J., 1990, Origin and evolution
of formation waters, Alberta Basin, Western Canada sedimentary basin: II. Isotopic
systematics and water mixing, Applied Grochemistry. 5: 397-413.
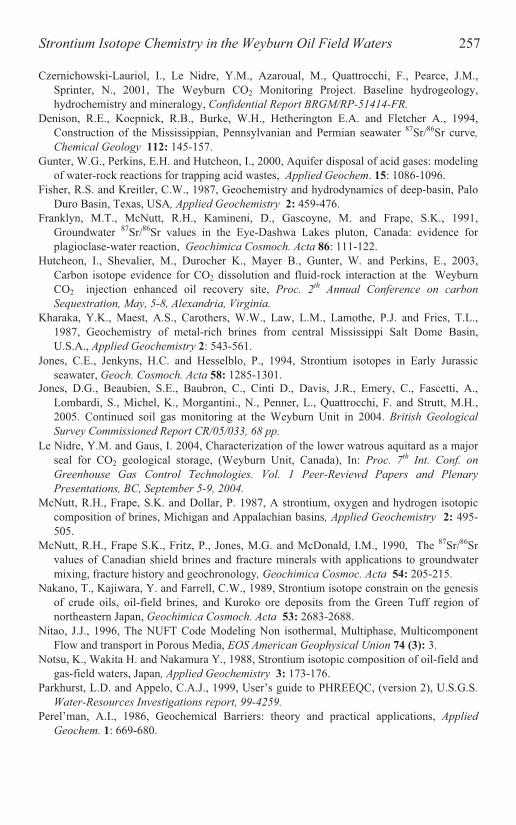
257
Czernichowski-Lauriol, I., Le Nidre, Y.M., Azaroual, M., Quattrocchi, F., Pearce, J.M.,
Sprinter, N., 2001, The Weyburn CO2 Monitoring Project. Baseline hydrogeology,
hydrochemistry and mineralogy, Confidential Report BRGM/RP-51414-FR.
Denison, R.E., Koepnick, R.B., Burke, W.H., Hetherington E.A. and Fletcher A., 1994,
Construction of the Mississippian, Pennsylvanian and Permian seawater 87
Sr/86
Sr curve,
Chemical Geology 112: 145-157.
Gunter, W.G., Perkins, E.H. and Hutcheon, I., 2000, Aquifer disposal of acid gases: modeling
of water-rock reactions for trapping acid wastes, Applied Geochem. 15: 1086-1096.
Fisher, R.S. and Kreitler, C.W., 1987, Geochemistry and hydrodynamics of deep-basin, Palo
Duro Basin, Texas, USA, Applied Geochemistry 2: 459-476.
Franklyn, M.T., McNutt, R.H., Kamineni, D., Gascoyne, M. and Frape, S.K., 1991,
Groundwater87
Sr/86
Sr values in the Eye-Dashwa Lakes pluton, Canada: evidence for
plagioclase-water reaction, Geochimica Cosmoch. Acta 86: 111-122.
Hutcheon, I., Shevalier, M., Durocher K., Mayer B., Gunter, W. and Perkins, E., 2003,
Carbon isotope evidence for CO2 dissolution and fluid-rock interaction at the Weyburn
CO2 injection enhanced oil recovery site, Proc. 2th
Annual Conference on carbon
Sequestration, May, 5-8, Alexandria, Virginia.
Kharaka, Y.K., Maest, A.S., Carothers, W.W., Law, L.M., Lamothe, P.J. and Fries, T.L.,
1987, Geochemistry of metal-rich brines from central Mississippi Salt Dome Basin,
U.S.A., Applied Geochemistry 2: 543-561.
Jones, D.G., Beaubien, S.E., Baubron, C., Cinti D., Davis, J.R., Emery, C., Fascetti, A.,
Lombardi, S., Michel, K., Morgantini., N., Penner, L., Quattrocchi, F. and Strutt, M.H.,
2005. Continued soil gas monitoring at the Weyburn Unit in 2004. British Geological
Survey Commissioned Report CR/05/033, 68 pp.
Jones, C.E., Jenkyns, H.C. and Hesselblo, P., 1994, Strontium isotopes in Early Jurassic
seawater, Geoch. Cosmoch. Acta 58: 1285-1301.
Le Nidre, Y.M. and Gaus, I. 2004, Characterization of the lower watrous aquitard as a major
seal for CO2 geological storage, (Weyburn Unit, Canada), In: Proc. 7th
Int. Conf. on
Greenhouse Gas Control Technologies. Vol. 1 Peer-Reviewd Papers and Plenary
Presentations, BC, September 5-9, 2004.
McNutt, R.H., Frape, S.K. and Dollar, P. 1987, A strontium, oxygen and hydrogen isotopic
composition of brines, Michigan and Appalachian basins, Applied Geochemistry 2: 495-
505.
McNutt, R.H., Frape S.K., Fritz, P., Jones, M.G. and McDonald, I.M., 1990, The 87
Sr/86
Sr
values of Canadian shield brines and fracture minerals with applications to groundwater
mixing, fracture history and geochronology, Geochimica Cosmoc. Acta 54: 205-215.
Nakano, T., Kajiwara, Y. and Farrell, C.W., 1989, Strontium isotope constrain on the genesis
of crude oils, oil-field brines, and Kuroko ore deposits from the Green Tuff region of
northeastern Japan, Geochimica Cosmoch. Acta 53: 2683-2688.
Nitao, J.J., 1996, The NUFT Code Modeling Non isothermal, Multiphase, Multicomponent
Flow and transport in Porous Media, EOS American Geophysical Union 74 (3): 3.
Notsu, K., Wakita H. and Nakamura Y., 1988, Strontium isotopic composition of oil-field and
gas-field waters, Japan, Applied Geochemistry 3: 173-176.
Parkhurst, L.D. and Appelo, C.A.J., 1999, User’s guide to PHREEQC, (version 2), U.S.G.S.
Water-Resources Investigations report, 99-4259.
Perel’man, A.I., 1986, Geochemical Barriers: theory and practical applications, Applied
Geochem. 1: 669-680.
Strontium Isotope Chemistry in the Weyburn Oil Field Waters
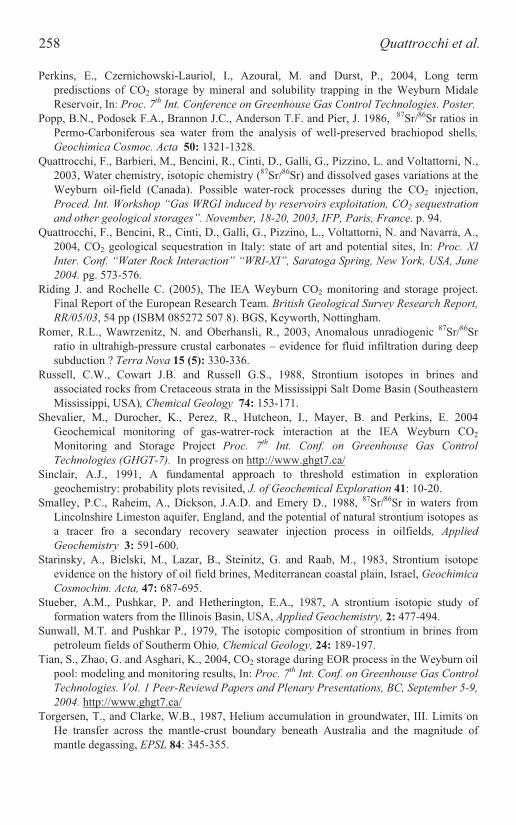
258 Quattrocchi et al.
Perkins, E., Czernichowski-Lauriol, I., Azoural, M. and Durst, P., 2004, Long term
predisctions of CO2 storage by mineral and solubility trapping in the Weyburn Midale
Reservoir, In: Proc. 7th
Int. Conference on Greenhouse Gas Control Technologies. Poster.
Popp, B.N., Podosek F.A., Brannon J.C., Anderson T.F. and Pier, J. 1986,87
Sr/86
Sr ratios in
Permo-Carboniferous sea water from the analysis of well-preserved brachiopod shells,
Geochimica Cosmoc. Acta 50: 1321-1328.
Quattrocchi, F., Barbieri, M., Bencini, R., Cinti, D., Galli, G., Pizzino, L. and Voltattorni, N.,
2003, Water chemistry, isotopic chemistry (87
Sr/86
Sr) and dissolved gases variations at the
Weyburn oil-field (Canada). Possible water-rock processes during the CO2 injection,
Proced. Int. Workshop “Gas WRGI induced by reservoirs exploitation, CO2 sequestration
and other geological storages”. November, 18-20, 2003, IFP, Paris, France. p. 94.
Quattrocchi, F., Bencini, R., Cinti, D., Galli, G., Pizzino, L., Voltattorni, N. and Navarra, A.,
2004, CO2 geological sequestration in Italy: state of art and potential sites, In: Proc. XI
Inter. Conf. “Water Rock Interaction” “WRI-XI”, Saratoga Spring, New York, USA, June
Riding J. and Rochelle C. (2005), The IEA Weyburn CO2 monitoring and storage project.
Final Report of the European Research Team. British Geological Survey Research Report,
RR/05/03, 54 pp (ISBM 085272 507 8). BGS, Keyworth, Nottingham.
Romer, R.L., Wawrzenitz, N. and Oberhansli, R., 2003, Anomalous unradiogenic 87
Sr/86
Sr
ratio in ultrahigh-pressure crustal carbonates – evidence for fluid infiltration during deep
subduction ? Terra Nova 15 (5): 330-336.
Russell, C.W., Cowart J.B. and Russell G.S., 1988, Strontium isotopes in brines and
associated rocks from Cretaceous strata in the Mississippi Salt Dome Basin (Southeastern
Mississippi, USA), Chemical Geology 74: 153-171.
Shevalier, M., Durocher, K., Perez, R., Hutcheon, I., Mayer, B. and Perkins, E. 2004
Geochemical monitoring of gas-watrer-rock interaction at the IEA Weyburn CO2
Monitoring and Storage Project Proc. 7th
Int. Conf. on Greenhouse Gas Control
Technologies (GHGT-7). In progress on http://www.ghgt7.ca/
Sinclair, A.J., 1991, A fundamental approach to threshold estimation in exploration
geochemistry: probability plots revisited, J. of Geochemical Exploration 41: 10-20.
Smalley, P.C., Raheim, A., Dickson, J.A.D. and Emery D., 1988, 87
Sr/86
Sr in waters from
Lincolnshire Limeston aquifer, England, and the potential of natural strontium isotopes as
a tracer fro a secondary recovery seawater injection process in oilfields, Applied
Geochemistry 3: 591-600.
Starinsky, A., Bielski, M., Lazar, B., Steinitz, G. and Raab, M., 1983, Strontium isotope
evidence on the history of oil field brines, Mediterranean coastal plain, Israel, Geochimica
Cosmochim. Acta, 47: 687-695.
Stueber, A.M., Pushkar, P. and Hetherington, E.A., 1987, A strontium isotopic study of
formation waters from the Illinois Basin, USA, Applied Geochemistry, 2: 477-494.
Sunwall, M.T. and Pushkar P., 1979, The isotopic composition of strontium in brines from
petroleum fields of Southerm Ohio, Chemical Geology, 24: 189-197.
Tian, S., Zhao, G. and Asghari, K., 2004, CO2 storage during EOR process in the Weyburn oil
pool: modeling and monitoring results, In: Proc. 7th
Int. Conf. on Greenhouse Gas Control
Technologies. Vol. 1 Peer-Reviewd Papers and Plenary Presentations, BC, September 5-9,
2004. http://www.ghgt7.ca/
Torgersen, T., and Clarke, W.B., 1987, Helium accumulation in groundwater, III. Limits on
He transfer across the mantle-crust boundary beneath Australia and the magnitude of
mantle degassing, EPSL 84: 345-355.
2004. pg. 573-576.

259
Wilson, M. and Monea, M. (Eds.), 2004, IEA-GHG Weyburn CO2 Monitoring and Storage
Summary Report 2000-2004. In: Proc. 7th
International Conference on Greenhouse Gas
Control Technologies. Vol. III, Petroleum Technology Research Center (PTRC Eds.), 243
pp.
Veizel, J. and Compston, W., 2004, 87
Sr/86
Sr composition of seawater during the Phanerozoic,
Geochimica Cosmoc. Acta 38: 1461-1484.
APPENDIX
Table 2. INGV geochemical surveying in the frame of the Weyburn IEA-EC Project, from
August 2000 to September 2004. At the end of the M 8 survey the injected CO2 amount since
the beginning of the Phase A1 was around 1.7 Ml m3 CO2.
Survey Dissolved gases Chemical analyses 87
Sr/86
Sr ratio
Baseline (B 0), Aug. 2000 no no partially
Monitor 1 (M 1), March 2001 yes (few) yes yes
Monitor 2 (M 2), July 2001 no no no
Monitor 3 (M 3), Sept. 2001 no no no
Monitor 4 (M 4), March 2002 no no no
Monitor 5 (M 5), June 2002 yes yes yes
Monitor 6 (M 6), Sept. 2002 no no no
Monitor 7 (M 7), April 2003 no no yes
Monitor 8 (M 8), June 2003 yes no no
Monitor 9 (M 9), Sept. 2003 yes partially partially
Monitor 10 (M 10), March 2004 yes partially partially
Monitor 11 (M 11), Sept. 2004 yes partially partially
Strontium Isotope Chemistry in the Produced Oil Field Waters

OPTIMIZATION OF CO2 INJECTION FOR
SEQUESTRATION / ENHANCED OIL
RECOVERY AND CURRENT STATUS IN
CANADA
T. Babadagli
University of Alberta, Civil and Environmental Eng., School of Petroleum and Mining,
3-112 Markin/CNRL - NREF, Edmonton, Alberta, T6G 2W2, Canada
Abstract: In today’s industrialized world, the generation (and emission) of greenhouse
gases (GHG) is likely to continue. The reduction of greenhouse gas emissions
through public outreach programs is one approach to mitigate this problem
however, in practice, it has not yet been received well by the public due to
economic costs. Therefore, permanent storage of these gases in underground
reservoirs is believed to be one of the most suitable solutions for the mitigation
of greenhouse gases. Sequestration of GHG is not cheap, however, and thus
the injection of greenhouse gases into oil or gas reservoirs to enhance
production may offset some of these associated costs. The use of CO2 for
purely EOR purposes versus injection of CO2 primarily for sequestration are
technically two different problems. Proper design practices and technology
need to be developed and applied in order to inject CO2 into oil reservoirs not
only for the purpose of tertiary oil recovery but also for permanent
sequestration. In conventional CO2 injection projects the main purpose is to
increase the amount of oil produced per amount of CO2 injected. In contrast
optimization of CO2 injection for sequestration purposes requires “maximum
oil production with the highest amount of CO2 storage”. Breakthrough time is
a critical parameter in this exercise as recycling CO2 is undesirable due to
economic and environmental constraints. This paper summarizes on-going
research into the conditions that will maximize oil recovery while maximizing
the underground sequestration of CO2. Results obtained from numerical
modeling of the injection process are discussed. Current efforts on CO2
injection in Canada are also presented.
Key words: CO2 sequestration, enhanced oil recovery, optimisation, miscible/immiscible
CO2 injection, flue gas injection, numerical modeling
261
S. Lombardi et al. (eds.),
Advances in the Geological Storage of Carbon Dioxide, 261–270.
© 2006 Springer. Printed in the Netherlands.
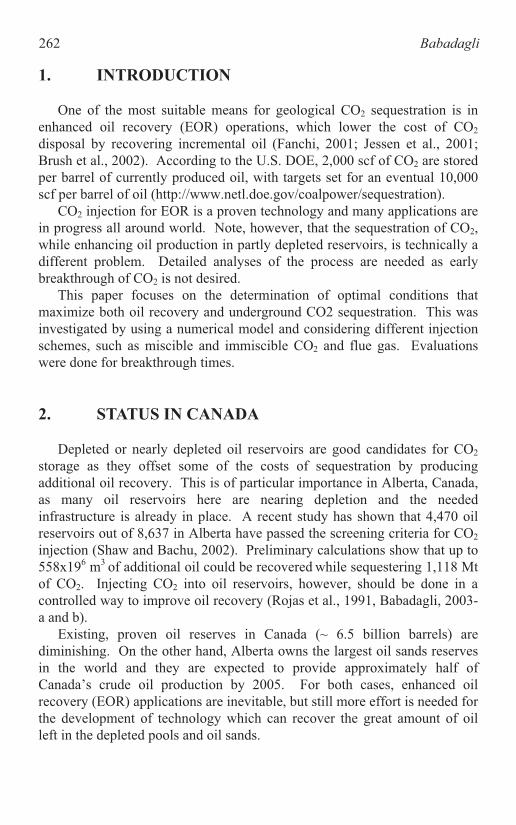
262 Babadagli
1. INTRODUCTION
One of the most suitable means for geological CO2 sequestration is in
enhanced oil recovery (EOR) operations, which lower the cost of CO2
disposal by recovering incremental oil (Fanchi, 2001; Jessen et al., 2001;
Brush et al., 2002). According to the U.S. DOE, 2,000 scf of CO2 are stored
per barrel of currently produced oil, with targets set for an eventual 10,000
scf per barrel of oil (http://www.netl.doe.gov/coalpower/sequestration).
CO2 injection for EOR is a proven technology and many applications are
in progress all around world. Note, however, that the sequestration of CO2,
while enhancing oil production in partly depleted reservoirs, is technically a
different problem. Detailed analyses of the process are needed as early
breakthrough of CO2 is not desired.
This paper focuses on the determination of optimal conditions that
maximize both oil recovery and underground CO2 sequestration. This was
investigated by using a numerical model and considering different injection
schemes, such as miscible and immiscible CO2 and flue gas. Evaluations
were done for breakthrough times.
2. STATUS IN CANADA
Depleted or nearly depleted oil reservoirs are good candidates for CO2
storage as they offset some of the costs of sequestration by producing
additional oil recovery. This is of particular importance in Alberta, Canada,
as many oil reservoirs here are nearing depletion and the needed
infrastructure is already in place. A recent study has shown that 4,470 oil
reservoirs out of 8,637 in Alberta have passed the screening criteria for CO2
injection (Shaw and Bachu, 2002). Preliminary calculations show that up to
558x196 m
3of additional oil could be recovered while sequestering 1,118 Mt
of CO2. Injecting CO2 into oil reservoirs, however, should be done in a
controlled way to improve oil recovery (Rojas et al., 1991, Babadagli, 2003-
a and b).
Existing, proven oil reserves in Canada (~ 6.5 billion barrels) are
diminishing. On the other hand, Alberta owns the largest oil sands reserves
in the world and they are expected to provide approximately half of
Canada’s crude oil production by 2005. For both cases, enhanced oil
recovery (EOR) applications are inevitable, but still more effort is needed for
the development of technology which can recover the great amount of oil
left in the depleted pools and oil sands.
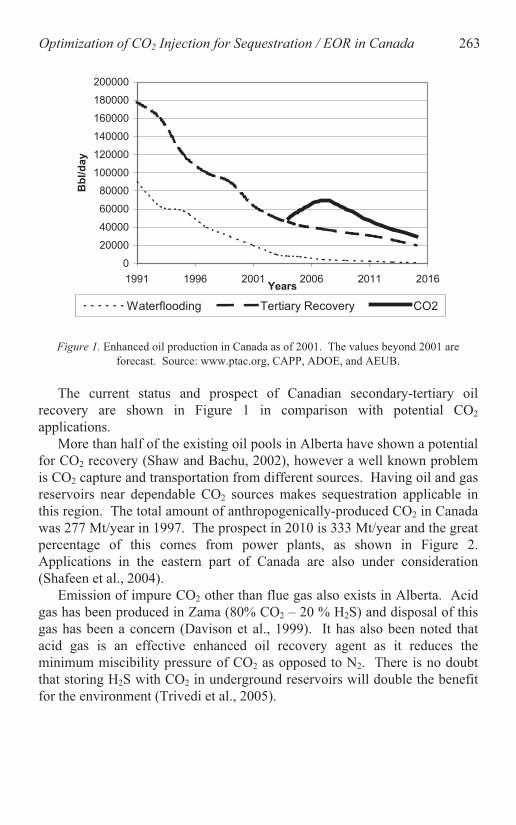
263
0
20000
40000
60000
80000
100000
120000
140000
160000
180000
200000
1991 1996 2001 2006 2011 2016Years
Bb
l/d
ay
Waterflooding Tertiary Recovery CO2
Figure 1. Enhanced oil production in Canada as of 2001. The values beyond 2001 are
forecast. Source: www.ptac.org, CAPP, ADOE, and AEUB.
The current status and prospect of Canadian secondary-tertiary oil
recovery are shown in Figure 1 in comparison with potential CO2
applications.
More than half of the existing oil pools in Alberta have shown a potential
for CO2 recovery (Shaw and Bachu, 2002), however a well known problem
is CO2 capture and transportation from different sources. Having oil and gas
reservoirs near dependable CO2 sources makes sequestration applicable in
this region. The total amount of anthropogenically-produced CO2 in Canada
was 277 Mt/year in 1997. The prospect in 2010 is 333 Mt/year and the great
percentage of this comes from power plants, as shown in Figure 2.
Applications in the eastern part of Canada are also under consideration
(Shafeen et al., 2004).
Emission of impure CO2 other than flue gas also exists in Alberta. Acid
gas has been produced in Zama (80% CO2 – 20 % H2S) and disposal of this
gas has been a concern (Davison et al., 1999). It has also been noted that
acid gas is an effective enhanced oil recovery agent as it reduces the
minimum miscibility pressure of CO2 as opposed to N2. There is no doubt
that storing H2S with CO2 in underground reservoirs will double the benefit
for the environment (Trivedi et al., 2005).
2Optimization of CO Injection for Sequestration / EOR in Canada

264 Babadagli
Fossil
Fuel
Industry
21 %
Industrial
39%
Power
40%
Fossil
Fuel
Industry
25%Power
36%
Industrial
39%
Figure 2. CO2 emissions in Canada (source:
www.nrcan.gc.ca/es/etb/cetc/combustion/co2network).
Early breakthrough is a serious problem in naturally fractured reservoirs
since the fractures serve as a high permeability pathway which results in the
faster movement of injected fluids (Beliveau et al., 1993 and Babadagli,
2003-a and b). Beliveau et al. (1993) observed that water injected into a
fractured carbonate reservoir (Midale, Canada) yielded very early
breakthrough (order of hours) whereas CO2 breakthrough took a month.
This indicates the viability of EOR (due to diffusive matrix-fracture
interaction) during the sequestration of CO2. Oil recovery and sequestration
potential should be identified in such weakly-water-wet fractured systems,
and the Weyburn field in Canada is a good example of this type of reservoir.
3. OBJECTIVES AND METHODOLOGY
The objective of this study is to test numerous different injection schemes
and to determine the conditions which yield the highest oil recovery while
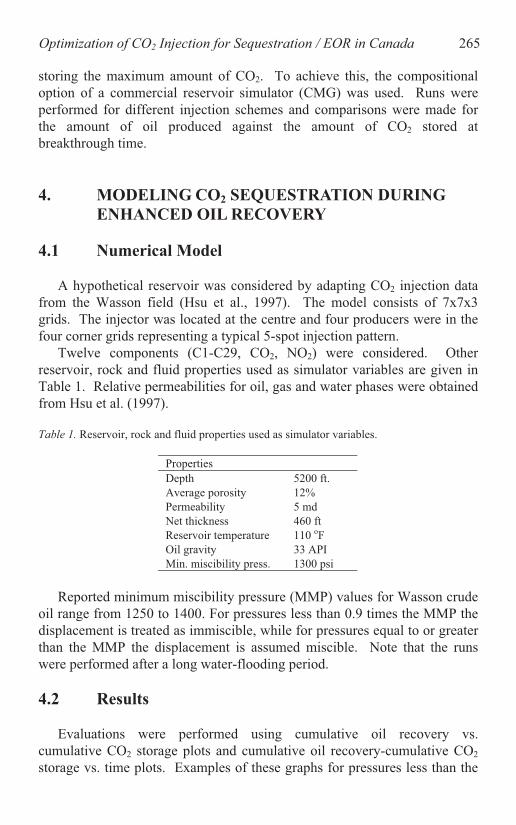
265
storing the maximum amount of CO2. To achieve this, the compositional
option of a commercial reservoir simulator (CMG) was used. Runs were
performed for different injection schemes and comparisons were made for
the amount of oil produced against the amount of CO2 stored at
breakthrough time.
4. MODELING CO2 SEQUESTRATION DURING
ENHANCED OIL RECOVERY
4.1 Numerical Model
A hypothetical reservoir was considered by adapting CO2 injection data
from the Wasson field (Hsu et al., 1997). The model consists of 7x7x3
grids. The injector was located at the centre and four producers were in the
four corner grids representing a typical 5-spot injection pattern.
Twelve components (C1-C29, CO2, NO2) were considered. Other
reservoir, rock and fluid properties used as simulator variables are given in
Table 1. Relative permeabilities for oil, gas and water phases were obtained
from Hsu et al. (1997).
Table 1. Reservoir, rock and fluid properties used as simulator variables.
Properties
Depth 5200 ft.
Average porosity 12%
Permeability 5 md
Net thickness 460 ft
Reservoir temperature 110 oF
Oil gravity 33 API
Min. miscibility press. 1300 psi
Reported minimum miscibility pressure (MMP) values for Wasson crude
oil range from 1250 to 1400. For pressures less than 0.9 times the MMP the
displacement is treated as immiscible, while for pressures equal to or greater
than the MMP the displacement is assumed miscible. Note that the runs
were performed after a long water-flooding period.
4.2 Results
Evaluations were performed using cumulative oil recovery vs.
cumulative CO2 storage plots and cumulative oil recovery-cumulative CO2
storage vs. time plots. Examples of these graphs for pressures less than the
2Optimization of CO Injection for Sequestration / EOR in Canada
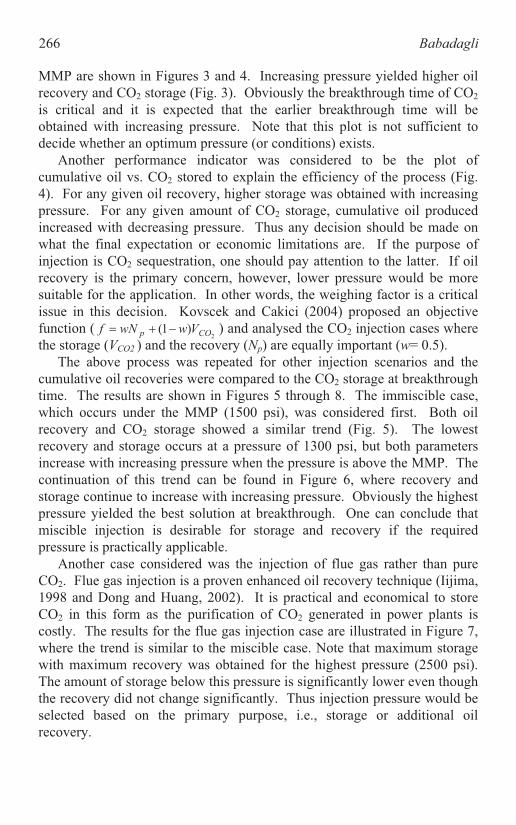
266 Babadagli
MMP are shown in Figures 3 and 4. Increasing pressure yielded higher oil
recovery and CO2 storage (Fig. 3). Obviously the breakthrough time of CO2
is critical and it is expected that the earlier breakthrough time will be
obtained with increasing pressure. Note that this plot is not sufficient to
decide whether an optimum pressure (or conditions) exists.
Another performance indicator was considered to be the plot of
cumulative oil vs. CO2 stored to explain the efficiency of the process (Fig.
4). For any given oil recovery, higher storage was obtained with increasing
pressure. For any given amount of CO2 storage, cumulative oil produced
increased with decreasing pressure. Thus any decision should be made on
what the final expectation or economic limitations are. If the purpose of
injection is CO2 sequestration, one should pay attention to the latter. If oil
recovery is the primary concern, however, lower pressure would be more
suitable for the application. In other words, the weighing factor is a critical
issue in this decision. Kovscek and Cakici (2004) proposed an objective
function (2
)1(COp
VwwNf ) and analysed the CO2 injection cases where
the storage (VCO2 ) and the recovery (Np) are equally important (w= 0.5).
The above process was repeated for other injection scenarios and the
cumulative oil recoveries were compared to the CO2 storage at breakthrough
time. The results are shown in Figures 5 through 8. The immiscible case,
which occurs under the MMP (1500 psi), was considered first. Both oil
recovery and CO2 storage showed a similar trend (Fig. 5). The lowest
recovery and storage occurs at a pressure of 1300 psi, but both parameters
increase with increasing pressure when the pressure is above the MMP. The
continuation of this trend can be found in Figure 6, where recovery and
storage continue to increase with increasing pressure. Obviously the highest
pressure yielded the best solution at breakthrough. One can conclude that
miscible injection is desirable for storage and recovery if the required
pressure is practically applicable.
Another case considered was the injection of flue gas rather than pure
CO2. Flue gas injection is a proven enhanced oil recovery technique (Iijima,
1998 and Dong and Huang, 2002). It is practical and economical to store
CO2 in this form as the purification of CO2 generated in power plants is
costly. The results for the flue gas injection case are illustrated in Figure 7,
where the trend is similar to the miscible case. Note that maximum storage
with maximum recovery was obtained for the highest pressure (2500 psi).
The amount of storage below this pressure is significantly lower even though
the recovery did not change significantly. Thus injection pressure would be
selected based on the primary purpose, i.e., storage or additional oil
recovery.
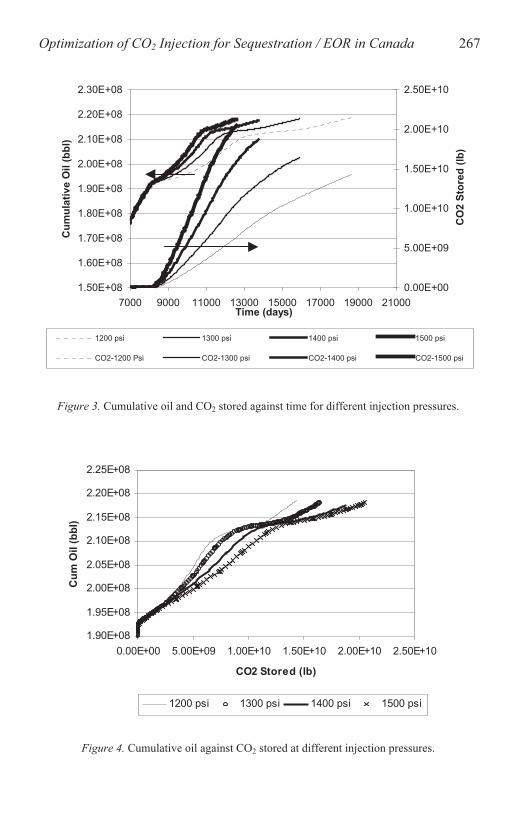
267
1.50E+08
1.60E+08
1.70E+08
1.80E+08
1.90E+08
2.00E+08
2.10E+08
2.20E+08
2.30E+08
7000 9000 11000 13000 15000 17000 19000 21000
Time (days)
Cu
mu
lati
ve
Oil
(b
bl)
0.00E+00
5.00E+09
1.00E+10
1.50E+10
2.00E+10
2.50E+10
CO
2 S
tore
d (
lb)
1200 psi 1300 psi 1400 psi 1500 psi
CO2-1200 Psi CO2-1300 psi CO2-1400 psi CO2-1500 psi
Figure 3. Cumulative oil and CO2 stored against time for different injection pressures.
1.90E+08
1.95E+08
2.00E+08
2.05E+08
2.10E+08
2.15E+08
2.20E+08
2.25E+08
0.00E+00 5.00E+09 1.00E+10 1.50E+10 2.00E+10 2.50E+10
CO2 Stored (lb)
Cu
m O
il (
bb
l)
1200 psi 1300 psi 1400 psi 1500 psi
Figure 4. Cumulative oil against CO2 stored at different injection pressures.
2Optimization of CO Injection for Sequestration / EOR in Canada
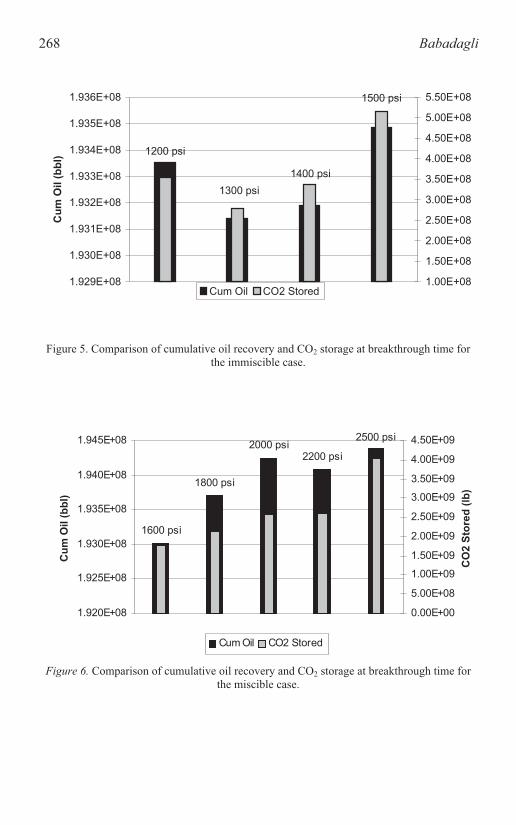
268 Babadagli
1500 psi
1400 psi
1300 psi
1200 psi
1.929E+08
1.930E+08
1.931E+08
1.932E+08
1.933E+08
1.934E+08
1.935E+08
1.936E+08
Cu
m O
il (
bb
l)
1.00E+08
1.50E+08
2.00E+08
2.50E+08
3.00E+08
3.50E+08
4.00E+08
4.50E+08
5.00E+08
5.50E+08
Cum Oil CO2 Stored
Figure 5. Comparison of cumulative oil recovery and CO2 storage at breakthrough time for
the immiscible case.
2500 psi
2200 psi
2000 psi
1800 psi
1600 psi
1.920E+08
1.925E+08
1.930E+08
1.935E+08
1.940E+08
1.945E+08
Cu
m O
il (
bb
l)
0.00E+00
5.00E+08
1.00E+09
1.50E+09
2.00E+09
2.50E+09
3.00E+09
3.50E+09
4.00E+09
4.50E+09
CO
2 S
tored
(lb
)
Cum Oil CO2 Stored
Figure 6. Comparison of cumulative oil recovery and CO2 storage at breakthrough time for
the miscible case.

269
2500 psi
2200 psi
2000 psi
1800 psi
1600 psi
1500 psi
1.85E+08
1.86E+08
1.87E+08
1.88E+08
1.89E+08
1.90E+08
1.91E+08
1.92E+08
Cu
m O
il (
bb
l)
2.00E+08
4.00E+08
6.00E+08
8.00E+08
1.00E+09
1.20E+09
1.40E+09
1.60E+09
Gas S
tored
(lb
)
Cum Oil CO2 Stored
Figure 7. Comparison of cumulative oil recovery and CO2 storage at breakthrough time for
flue – gas injection.
5. CONCLUDING REMARKS
This paper reports the preliminary results of a numerical study on the
optimization of CO2 storage during enhanced oil recovery. It was observed
that the immiscible and miscible cases exhibit different recovery/storage
behavior. Although the miscible case showed better recovery performance
and storage capacity with pressure increases, it is difficult to reach MMP due
to technical difficulties and/or regulatory restrictions in many circumstances.
One should select the injection pressure depending on the priorities, i.e.,
more additional oil or more or CO2 storage.
Identification of the causes of CO2 entrapment is critical but it varies
reservoir by reservoir. Answering what really causes CO2 to get trapped in
the reservoir needs special studies for any particular reservoir, with focus
being given to the effects of pore types, fractures and chemical interactions
with the reservoir rock. The need for investigations into the long-term
behavior of injected and trapped gas are also obvious (Ennis-King and
Paterson, 2003).
ACKNOWLEDGEMENTS
The author would like to thank the Computer Modeling Group (CMG)
for providing the simulator used in this research. Mr. Japan Trivedi is
gratefully acknowledged for his help during simulation runs.
2Optimization of CO Injection for Sequestration / EOR in Canada

270 Babadagli
REFERENCES
Babadagli, T., 2003a, Evaluation of EOR methods for heavy-oil recovery in
naturally fractured reservoirs, J. of Petroleum Sci. and Eng., 37 (1-2): 25-37.
Babadagli, T., 2003b, Viability of EOR during CO2 sequestration,” PTAC, CO2
from Industrial Sources to Commercial Enhanced Oil & Gas Rec. Workshop and
Forum, Calgary, AB, Canada, Oct. 1-2.
Beliveau, D., Payne, D.A. and Mundry, M., 1993, Waterflood and CO2 flood of the
fractured Midale field, JPT, Sept. 1993, 881-887.
Brush, R. M. et al., 2000, Immiscible CO2 flooding for increased oil recovery and
reduced emission, SPE 59328, SPE Imp. Oil Rec. Sym., Tulsa, OK, 3-5 April.
Davison, R.I., Mayder, A., Hladiuk, D.W. and Jarrell, J, 1999, Zama acid gas
disposal/miscible flood implementation and results, JCPT, vol. 38, no 2 (Feb.).
Dong, M. and Huang, S., 2002, Flue gas injection for heavy oil recovery, JCPT, 41
(9): 44-50.
Ennis-King, J. and Paterson, L., 2003, Role of convective mixing in the long-term
storage of carbon dioxide in deep saline formations, SPE 84344, SPE Annual
Tech. Conf. and Exh., Denver, CO, 5-8 Oct.
Fanchi J. R., 2001, Feasibility of monitoring CO2 sequestration in a mature oil field
using time-lapse seismic analysis, SPE 66569, SPE/EPA/DOE Exp. and Prod.
Env. Conf., San Antonio, TX, 26-28 Feb.
Hsu, C.-F, Morell, J.J. and Falls, A.H., 1997, Field-scale CO2-flood simulations and
their impact on the performance of the Wasson Denver unit, SPE RE, Feb., 4-11.
Iijima, M., 1998, A feasible new flue gas CO2 recovery technology for enhanced oil
recovery, SPE 39686, SPE/DOE Imp. Oil Rec. Symp., Tulsa, OK, 19-22 April.
Jessen, K., Kovscek, A.R. and Orr, F., 2005, Increasing CO2 storage in oil recovery,
Energy Conversion and Management, 46: 293-311.
Kovscek, A.R. and Cakici, M.D., 2004, Geological storage of carbon dioxide and
enhanced oil recovery: II Cooptimization of storage and recovery, Energy
Conversion and Management, to appear.
Rojas, G.A., Zhu, T., Dyer, S.B., Thomas, S. and Farouq Ali, S.M., 1991, Scaled
model studies of CO2 floods, SPE Res. Eval. & Eng., May, 169-178.
Shafeen, A., Croiset, E., Douglas, P.L. and Chatzis, I, 2004, CO2 sequestration in
Ontario, Canada: Part I: Storage evaluation of potential reservoirs, Energy
Conversion and Management, 45: 2645-2659.
Shaw, J. and Bachu, S., 2002, Screening, evaluation, and ranking of oil reservoirs
suitable for CO2 flood EOR and carbon dioxide sequestration, JCPT, 41(9):51-61.
Trivedi, J., Babadagli, T., Lavoie, R., and Nimchuk, D., 2005, Acid Gas
Sequestration During Tertiary Oil Recovery: Optimal Injection Strategies and
Importance of Operational Parameters,” 56th
Canadian Int. Annual Tech. Meet.,
Calgary, 7-9 June.

THE USE OF CO2 AND COMBUSTION GASES
FOR ENHANCED OIL RECOVERY IN RUSSIA
V.A. Kuvshinov
Institute of Petroleum Chemistry SB RAS, Tomsk, Russia
Abstract: The use of carbon dioxide and combustion gases in EOR technologies is of
interest from the point of view of CO2 geological sequestration. During the
period of 1980-1990 large-scale pilot tests were carried out in Russia to utilize
carbon dioxide and combustion gases, formed at different petrochemical
production plants, to enhance oil recovery in different hydrocarbon fields. The
analysis of field data indicates that the greater part of CO2 injected into oil
reservoirs was recovered from production wells during the 1-1.5 years of the
experiment. The total amount of CO2 which was irreversibly stored in the
reservoir was not measured. To reveal mechanisms of CO2 geological
sequestration it is recommended to study in detail carbon dioxide interactions
with oil, formation water and with the reservoir rocks under the conditions of
miscible and immiscible oil displacement with carbon dioxide.
Key words: EOR in Russia; sequestration; carbon dioxide
1. INTRODUCTION
The use of carbon dioxide and combustion gases in EOR technologies is
of great interest from the point of view of CO2 geological sequestration, as
there is the potential for both decreased disposal costs while increasing
resource recovery.
During the period from 1980-1990 large-scale pilot tests were performed
in Russia to inject carbon dioxide and combustion gases, formed at different
petrochemical plants, into petroleum hydrocarbon reservoirs in order to
enhance oil recovery (Table 1). This paper summaries some of the results
obtained during this project from one site.
271
S. Lombardi et al. (eds.),
Advances in the Geological Storage of Carbon Dioxide, 271–275.
© 2006 Springer. Printed in the Netherlands.
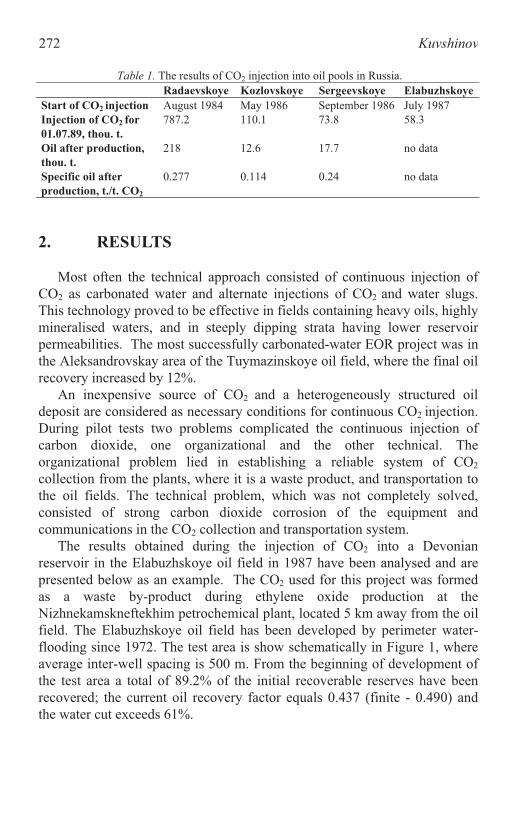
272 Kuvshinov
2
Radaevskoye Kozlovskoye Sergeevskoye Elabuzhskoye
Start of 2 injection August 1984 May 1986 September 1986 July 1987
Injection of 2 for
01.07.89, thou. t.
787.2 110.1 73.8 58.3
Oil after production,
thou. t.
218 12.6 17.7 no data
Specific oil after
production, t./t. 2
0.277 0.114 0.24 no data
2. RESULTS
Most often the technical approach consisted of continuous injection of
CO2 as carbonated water and alternate injections of CO2 and water slugs.
This technology proved to be effective in fields containing heavy oils, highly
mineralised waters, and in steeply dipping strata having lower reservoir
permeabilities. The most successfully carbonated-water EOR project was in
the Aleksandrovskay area of the Tuymazinskoye oil field, where the final oil
recovery increased by 12%.
An inexpensive source of 2 and a heterogeneously structured oil
deposit are considered as necessary conditions for continuous 2 injection.
During pilot tests two problems complicated the continuous injection of
carbon dioxide, one organizational and the other technical. The
organizational problem lied in establishing a reliable system of CO2
collection from the plants, where it is a waste product, and transportation to
the oil fields. The technical problem, which was not completely solved,
consisted of strong carbon dioxide corrosion of the equipment and
communications in the CO2 collection and transportation system.
The results obtained during the injection of CO2 into a Devonian
reservoir in the Elabuzhskoye oil field in 1987 have been analysed and are
presented below as an example. The CO2 used for this project was formed
as a waste by-product during ethylene oxide production at the
Nizhnekamskneftekhim petrochemical plant, located 5 km away from the oil
field. The Elabuzhskoye oil field has been developed by perimeter water-
flooding since 1972. The test area is show schematically in Figure 1, where
average inter-well spacing is 500 m. From the beginning of development of
the test area a total of 89.2% of the initial recoverable reserves have been
recovered; the current oil recovery factor equals 0.437 (finite - 0.490) and
the water cut exceeds 61%.
Table 1. The results of injection into oil pools in Russia.

2 273
2 was injected into four injection wells (numbers 542, 544, 545 and
546) located along the test area perimeter. Monthly dynamics of the 2
injection are presented in Figure 2.
1987 1988 1989
6 7 8 9 10 1112 1 2 3 4 5 6 7 8 9 10 1112 1 2 3 4 5 6 7 8 9 10 1112
0
1000
2000
3000
4000
5000
0
1000
2000
3000
4000
5000
0
1000
2000
3000
4000
5000
Q CO2 m3
a)
b)
c)
Figure 2. Dynamics of 2 injection into injection wells 542 (a), 545 (b) and 544 (c).
Figure 1. Scheme of well spacing in the test area.
The Use of CO and Combustion Gases for EOR in Russia

274 Kuvshinov
Production wells in the test area were divided into 4 groups based on
their response to the 2 injection (Fig.3):
1. appearance of 2 in a well without any change in water cut (wells 842,
932 and 824)
2. appearance of 2 in a well and decrease in water cut (wells 250 and
135);
3. absence of 2 in a well, decrease in water cut (wells 826, 836, 837, 931,
935, 949 and 823) and increase in water cut (wells 822 and 933);
4. no changes were observed in well operations (wells 820, 821, 828, 848,
938, 949, 951).
The analysis of the field data indicates that the greater part of CO2
injected into the oil pool was recovered from production wells during the 1-
1.5 years of the test. The total amount of CO2 which was irreversibly trapped
within the pool was not estimated.
1987 1988 1989
6 7 8 9 10 1112 1 2 3 4 5 6 7 8 9 10 1112 1 2 3 4 5 6 7 8 9 101112
25
50
75
100
0
25
50
75
100
0
25
50
75
100
0
25
50
75
100
0
25
50
75
100
Water
cut (%)
0
25
50
75
100
CO2 (%)
a)
b)
c)
2Figure 3. Dynamics of water cut and content in wells 932 (a), 250 (b) and 836 (c).
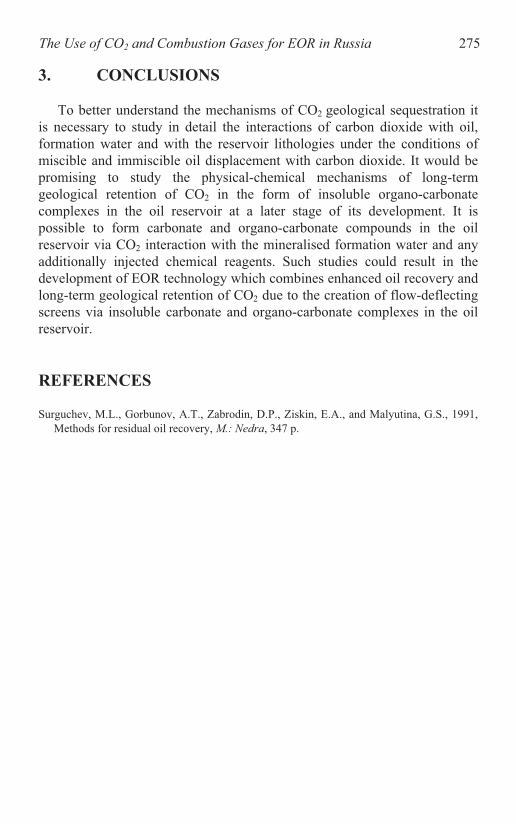
275
3. CONCLUSIONS
To better understand the mechanisms of CO2 geological sequestration it
is necessary to study in detail the interactions of carbon dioxide with oil,
formation water and with the reservoir lithologies under the conditions of
miscible and immiscible oil displacement with carbon dioxide. It would be
promising to study the physical-chemical mechanisms of long-term
geological retention of CO2 in the form of insoluble organo-carbonate
complexes in the oil reservoir at a later stage of its development. It is
possible to form carbonate and organo-carbonate compounds in the oil
reservoir via CO2 interaction with the mineralised formation water and any
additionally injected chemical reagents. Such studies could result in the
development of EOR technology which combines enhanced oil recovery and
long-term geological retention of CO2 due to the creation of flow-deflecting
screens via insoluble carbonate and organo-carbonate complexes in the oil
reservoir.
REFERENCES
Surguchev, M.L., Gorbunov, A.T., Zabrodin, D.P., Ziskin, E.A., and Malyutina, G.S., 1991,
Methods for residual oil recovery, M.: Nedra, 347 p.
2The Use of CO and Combustion Gases for EOR in Russia
CONTROLS OF CO2 FILTRATION IN
HETEROGENEOUS RESERVOIRS WITH FOAM-
EMULSION SYSTEMS
A.G. Telin
The Institute of Mechanics of Ufa Research Center of Russia450078, Ufa, Revolutionary Str.,
96/2 (E-mail: [email protected])
Abstract: Pumping CO2 into oil reservoirs is one of the most promising methods to
increase oil recovery. A significant drawback of the method is channelled flow
of CO2 through the most permeable intervals in heterogeneous reservoirs. To
control flow we used foam-emulsion systems generated both before pumping
into the reservoir model and directly in the reservoir. This allows us to double
the driving medium from high- to low-permeability reservoirs and presents a
likely mechanism of flow redirection. Studying the regulating effect of foam-
emulsion systems using a transparent micro-model of the reservoir and the
Hele-Shaw cell revealed a previously unknown effect of dynamic blocking of
porous mediums and fractured structures during transformation of emulsions
filtering through it.
Key words: channelled flow during CO2 flooding; heterogeneous reservoir; porous
structure; foam-emulsion system; driving medium; redirection of flow;
interchanged injection; dynamic blocking
1. INTRODUCTION
Pumping carbon dioxide into oil reservoirs is one of the most promising
and quickly developing methods to increase oil recovery. A large-scale
introduction of the method in the USA showed its effectiveness for oilfields
during different stages of development and in reservoirs having a wide range
of geology, structure and oil properties.
Data published in the international press and results of trial CO2 injection
into Russian oilfields shows that the main technological factor that limits the
277
S. Lombardi et al. (eds.),
Advances in the Geological Storage of Carbon Dioxide, 277–287.
© 2006 Springer. Printed in the Netherlands.

278 Telin
development of the method is the quick inrush or channelling of CO2 into
producing wells along strata or structures with high permeability. The main
instrument to control the process of oil extraction is sequential injection of
CO2 and water slugs. Recently, surfactant-water solutions have been used to
2
2. RESULTS AND DISCUSSION
Trial pumping of CO2 in the Radayevskoye and Sergeyevskoye oilfields
has shown the technical effectiveness of this method. Injection of CO2 has
also been conducted in the Kozlovskoye (PO Kuybyshevneft) and
Yelabuzhskoye (PO Tatneft) oilfields, while preliminary studies are being
performed on the Olkhovskoye oilfield (PO Permneft). Technical indices are
listed in table 1.
Oilfield
Parameters Radayevs-
koye
Kozlovs -
koye
Sergeevs-
koye
Yelabuzh-
skoye
Olkhovs-
koye
Predicted oil
output
increase, %
12.80 10.40 10.40 8.00 12.40
Additional
output,
million tons
6.90 3.21 0.89 0.40 3.10
Yearly
injection of
CO2, thous.
tons
430.0 400.0 165.0 140.0 400.0
Actual
injection by
01/07/89,
thous. tons
787.2 110.1 73.8 58.3 -
Injection
started
August
1984
May
1986
September
1986
July
1987-
The largest quantity of CO2 was injected into the reservoir within the
Radayevskoye oilfield. Results of a four year trial indicate the effectiveness
of the method, with the injection of 787.2 thousand tons of CO2 during this
period. Despite the fact that this was 2.6 times less than the planned amount
for this time period an additional 218 thousand tons of oil were produced
due to CO2 injection by 01/07/89, which amounts to 0.28 tons per 1 ton of
Table 1. Technical indices of carbon dioxide injection.
push CO to increase the effectiveness of the technology.
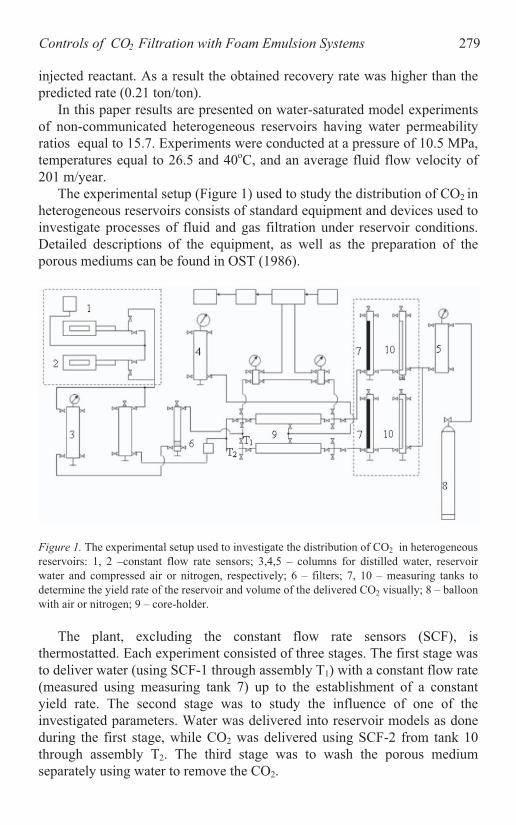
2 279
injected reactant. As a result the obtained recovery rate was higher than the
predicted rate (0.21 ton/ton).
In this paper results are presented on water-saturated model experiments
of non-communicated heterogeneous reservoirs having water permeability
ratios equal to 15.7. Experiments were conducted at a pressure of 10.5 MPa,
temperatures equal to 26.5 and 40 , and an average fluid flow velocity of
201 m/year.
The experimental setup (Figure 1) used to study the distribution of CO2 in
heterogeneous reservoirs consists of standard equipment and devices used to
investigate processes of fluid and gas filtration under reservoir conditions.
Detailed descriptions of the equipment, as well as the preparation of the
porous mediums can be found in OST (1986).
Figure 1. The experimental setup used to investigate the distribution of CO2 in heterogeneous
reservoirs: 1, 2 –constant flow rate sensors; 3,4,5 – columns for distilled water, reservoir
water and compressed air or nitrogen, respectively; 6 – filters; 7, 10 – measuring tanks to
determine the yield rate of the reservoir and volume of the delivered CO2 visually; 8 – balloon
The plant, excluding the constant flow rate sensors (SCF), is
thermostatted. Each experiment consisted of three stages. The first stage was
to deliver water (using SCF-1 through assembly T1) with a constant flow rate
(measured using measuring tank 7) up to the establishment of a constant
yield rate. The second stage was to study the influence of one of the
investigated parameters. Water was delivered into reservoir models as done
during the first stage, while CO2 was delivered using SCF-2 from tank 10
through assembly T2. The third stage was to wash the porous medium
separately using water to remove the CO2.
with air or nitrogen; 9 – core-holder.
Controls of CO Filtration with Foam Emulsion Systems

280 Telin
Length, cm Permeability, mcm2
Model
number HPR LPR
Permeability
ratios, 0
1 58 54.8 0.144 0.018 7.8
2 52 54.8 0.158 0.026 6.0
3 54.8 54.8 0.133 0.039 3.41
4 101.8 54.8 5.001 0.039 128.2
All the presented dependencies were produced via no fewer than 5
experiments. A total of 4 porous medium models were used in the
experiments (Table 2). A conditional value was introduced and used to
simplify the calculation and plotting of the graphs; this consists of the CO2
(RCO2) and water (RB) distribution parameters, which are equal to the ratio of
yield rates for high- (QB) and low-permeability (QH) reservoirs.
The obtained results (Figure 2) show that using the non-ionic surfactants
sufficiently increases the reservoir coverage of both carbon dioxide and
water, via alternating injection of the two reactants. The supply of liquid
CO2 into the low-permeability reservoir increased from 16.67% and 17.01%
(after injection of mineralised (140 g/l) and distilled water, respectively) to
36-38% when using the solution of Neonol AF9-12 in concentrations of
0.25-2.00%. The injection of gaseous carbon dioxide (10.0 MPa, 40 C) also
increases into low-permeability reservoirs from 15.4% (water) to 36.5-
37.7% (0.25-1.00% solution of F9-12). Coverage of the reservoir in the
case of alternating injection of CO2 slugs and surfactant water solutions
increases due to the formation of water-carbon dioxide emulsions and foams
at the water/CO2 interfaces within the porous medium. Because of the
different mobilities of carbon dioxide and water, the volume of emulsion
formed in pores will be maximal in intervals with higher permeabilities.
Accumulation of specific volumes of emulsion (foam) in these intervals will
cause partial (temporary) blocking of the pores, which allows for the
redistribution of flow from high- to low-permeability intervals.
The influence of gas mixture composition on its reservoir distribution
was studied in two models (1 and 2). The characteristics of the porous
mediums (represented by natural sandstones) are listed in Table 3.
Experiments were conducted at 26.5 and 10.5 MPa.
Table 2. Characteristics of reservoir models.
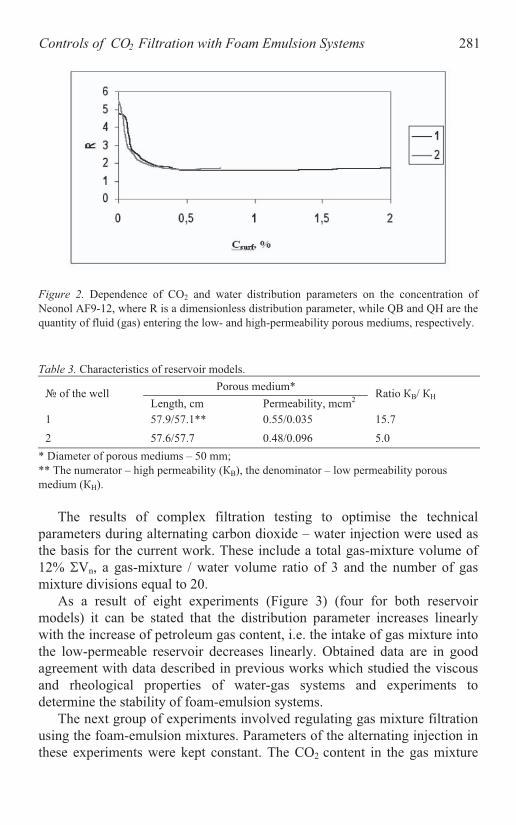
281
Figure 2. Dependence of CO2 and water distribution parameters on the concentration of
Neonol AF9-12, where R is a dimensionless distribution parameter, while QB and QH are the
quantity of fluid (gas) entering the low- and high-permeability porous mediums, respectively.
Table 3. Characteristics of reservoir models.
Porous medium* of the well
Length, cm Permeability, mcm2
Ratio /
1 57.9/57.1** 0.55/0.035 15.7
2 57.6/57.7 0.48/0.096 5.0
* Diameter of porous mediums – 50 mm;
** The numerator – high permeability ( ), the denominator – low permeability porous
medium ( ).
The results of complex filtration testing to optimise the technical
parameters during alternating carbon dioxide – water injection were used as
the basis for the current work. These include a total gas-mixture volume of
12% Vn, a gas-mixture / water volume ratio of 3 and the number of gas
mixture divisions equal to 20.
As a result of eight experiments (Figure 3) (four for both reservoir
models) it can be stated that the distribution parameter increases linearly
with the increase of petroleum gas content, i.e. the intake of gas mixture into
the low-permeable reservoir decreases linearly. Obtained data are in good
agreement with data described in previous works which studied the viscous
and rheological properties of water-gas systems and experiments to
determine the stability of foam-emulsion systems.
The next group of experiments involved regulating gas mixture filtration
using the foam-emulsion mixtures. Parameters of the alternating injection in
these experiments were kept constant. The CO2 content in the gas mixture
2Controls of CO Filtration with Foam Emulsion Systems

282 Telin
was 50%, while a mixture of Neonol AF9-12 and KOBS was used for the
surfactant (the mass ratio of each component in water was 0.125%).
It was found that the alternating injection of the gas mixture and water
solution of the indicated composition into model 2 caused the distribution
parameter R to decrease from 3.30 to 2.91, which corresponds to an increase
of reactant ingress into the low-permeable reservoir from 23.26 to 25.58%
(Figure 3). If one compares the obtained redistribution of gas mixture
filtration in the heterogeneous reservoirs with the distribution of the clear
carbon dioxide in model 1, it can be seen that regulation of the gas
mixture filtration has limited effectiveness. For clear CO2 the distribution
parameter R decreased from 5.50 to 2.06 with the injection of the AF9-12 /
KOBS solution in water instead of simple water slugs.
Figure 3. Distribution of CO2 and gas mixtures during alternating water and surfactant water
solutions injection and combined injection, respectively.

283
The increase of AF9-12 concentration to 0.25% did not lead to a
sufficient improvement of the gas mixture filtration alternating with the
surfactant solution. The distribution parameter in this case was 2.88, which
corresponds to 25.77% ingress of reactant into the low-permeable reservoir.
The increased division of the gas mixture into 40 portions also did not
bring about sufficient increases in the coverage of the reservoir model. The
distribution parameter in this case decreased to only a value of 2.82
(Q =26.18%).
Thus earlier results that allowed the increase of reservoir coverage by
CO2 with the alternating injection of surfactant water solution slugs was not
repeated for the mixture of CO2 and petroleum gas. As gases have a low
solubility in water foam-emulsion systems form on the interface of the slugs
of the filtering phases. Evidently in this case the decrease of the foam-
emulsion system stability, consisting of gas mixture and water compared to
the dispersion of CO2 and water, has a decisive impact on the regulation of
the filtration process.
The following experiments on the technology of water-gas mixture
combined-injection were conducted to increase the contact surface of gas
mixture and surfactant water solution. The content of CO2 in the gas mixture
was in all cases 50%, the gas mixture slug volume was 12% Vpore while the
detergent was a 0.25% Neonol AF9-12 water solution. The investigated
parameter in these experiments was the ratio of water solution to gas mixture
volumes.
The increase of the gas mixture ratio from 25 to 50% at the combined
injection with 0.25% surfactant solution decreased the distribution parameter
from 2.26 to 0.89 and increased the intake of the reactant into the low-
permeable reservoir from 30.67% to 52.91%, respectively. This result
clearly supports the previous assumption regarding the primary influence of
foam-emulsion system stability on the surfactant solution regulating
properties. In this case the combined injection of the gas mixture and the
surfactant water solution results in direct foam filtration, and the pore cells
work as the centers of foam formation.
An additional increase in the foam’s aeration extent (ratios of water and
gas mixture volumes 1:2.3; 1:3) causes the sudden decrease of reactant
intake into the low-permeable reservoir – 25.32 and 8.05% respectively. The
dependence of the distribution parameter on the water and gas mixture
volumes ratio has a strongly pronounced maximum. Its presence can be
explained by the increase of the foam-emulsion system’s stability which
causes the decrease of R from 2.26 to 0.89 with the increase of the gas
mixture ratio during injected dispersion. Appearance of a free gas phase
during the continued increase of the gas ratio in the injected mixture to 75%
causes the temporary blocking of small pores and the growth of the
2Controls of CO Filtration with Foam Emulsion Systems
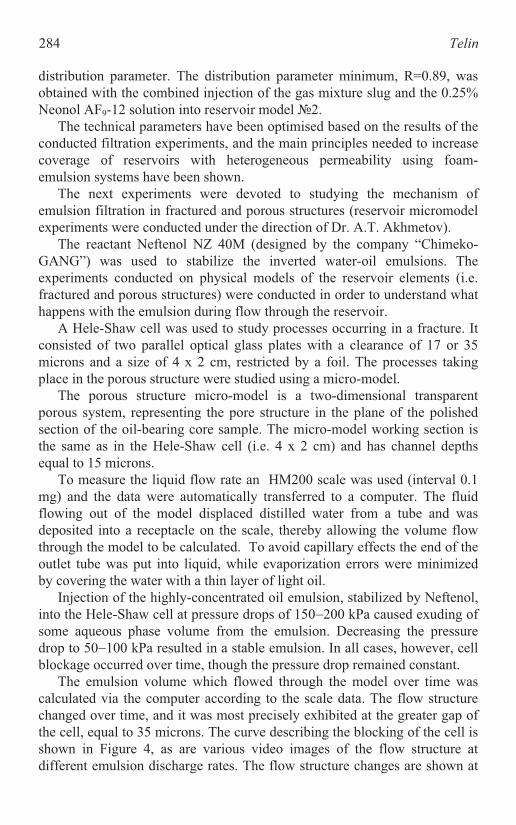
284 Telin
distribution parameter. The distribution parameter minimum, R=0.89, was
obtained with the combined injection of the gas mixture slug and the 0.25%
Neonol AF9-12 solution into reservoir model 2.
The technical parameters have been optimised based on the results of the
conducted filtration experiments, and the main principles needed to increase
coverage of reservoirs with heterogeneous permeability using foam-
emulsion systems have been shown.
The next experiments were devoted to studying the mechanism of
emulsion filtration in fractured and porous structures (reservoir micromodel
experiments were conducted under the direction of Dr. A.T. Akhmetov).
The reactant Neftenol NZ 40M (designed by the company “Chimeko-
GANG”) was used to stabilize the inverted water-oil emulsions. The
experiments conducted on physical models of the reservoir elements (i.e.
fractured and porous structures) were conducted in order to understand what
happens with the emulsion during flow through the reservoir.
A Hele-Shaw cell was used to study processes occurring in a fracture. It
consisted of two parallel optical glass plates with a clearance of 17 or 35
microns and a size of 4 2 cm, restricted by a foil. The processes taking
place in the porous structure were studied using a micro-model.
The porous structure micro-model is a two-dimensional transparent
porous system, representing the pore structure in the plane of the polished
section of the oil-bearing core sample. The micro-model working section is
the same as in the Hele-Shaw cell (i.e. 4 2 cm) and has channel depths
equal to 15 microns.
To measure the liquid flow rate an HM200 scale was used (interval 0.1
mg) and the data were automatically transferred to a computer. The fluid
flowing out of the model displaced distilled water from a tube and was
deposited into a receptacle on the scale, thereby allowing the volume flow
through the model to be calculated. To avoid capillary effects the end of the
outlet tube was put into liquid, while evaporization errors were minimized
by covering the water with a thin layer of light oil.
Injection of the highly-concentrated oil emulsion, stabilized by Neftenol,
into the Hele-Shaw cell at pressure drops of 150 200 kPa caused exuding of
some aqueous phase volume from the emulsion. Decreasing the pressure
drop to 50 100 kPa resulted in a stable emulsion. In all cases, however, cell
blockage occurred over time, though the pressure drop remained constant.
The emulsion volume which flowed through the model over time was
calculated via the computer according to the scale data. The flow structure
changed over time, and it was most precisely exhibited at the greater gap of
the cell, equal to 35 microns. The curve describing the blocking of the cell is
shown in Figure 4, as are various video images of the flow structure at
different emulsion discharge rates. The flow structure changes are shown at

285
a greater scale in Figure 5. Complete blockage, discovered using the scale
data and verified with careful microscopic study, has shown the presence of
small fluid flow at the inlet and outlet (Figure 6.).
The flow rate value is four orders of magnitude lower than the initial
flow rate and does not increase with time, although the emulsion structure in
the cell and in the micro-model change considerably after a long period of
time (a day and more) and resemble the composite emulsion, formed during
flow of the non-stabilized emulsion. As emulsion micro-flow is always
present, the observed “blocking” effect has been termed “the dynamic
blocking effect”.
The same dynamic blocking effect was found in the study of stabilized
emulsion flow in the porous structure micro-model. In this case the
consumption of the emulsion is much less, but the relationship between
emulsion volume flow and time have the same nature and blocking as in the
case of the Hele-Shaw cell, which happens within about one hour. Under
dynamic blocking the emulsion has the property of “the fluid nipple”, i.e. at
the pressure build-up in the reverse direction the motion of the emulsion is
restored (curve 4 in Figure 7). In the case of both the micro-model and the
Hele-Shaw cell there is micro-flow at the inlet and outlet of the model.
Figure 4. Stabilized emulsion volume passed through the fracture model versus time at a
constant pressure drop. The video images of flow structure are shown at different moments
of time.
2Controls of CO Filtration with Foam Emulsion Systems

286 Telin
Figure 5. The modification of the flow structure due to the dynamic blocking of the Hele-
Show cell (pressure drop is 100 kPa, on the right lower video image the rectangle at the outlet
Figure 6. Micro video image of the single site, at the outlet, on which the motion is observed,
the flow parameters are indicated by arrows. Screen width 700 microns, flow 200 microns,
movement 80 microns per 12 seconds.
corresponds to the field observed under a microscope).
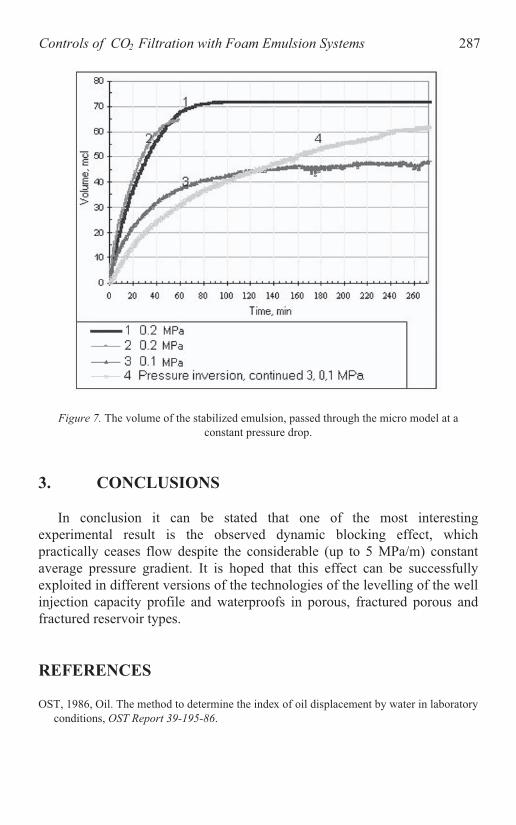
287
Figure 7. The volume of the stabilized emulsion, passed through the micro model at a
constant pressure drop.
3. CONCLUSIONS
In conclusion it can be stated that one of the most interesting
experimental result is the observed dynamic blocking effect, which
practically ceases flow despite the considerable (up to 5 MPa/m) constant
average pressure gradient. It is hoped that this effect can be successfully
exploited in different versions of the technologies of the levelling of the well
injection capacity profile and waterproofs in porous, fractured porous and
fractured reservoir types.
REFERENCES
OST, 1986, Oil. The method to determine the index of oil displacement by water in laboratory
conditions, OST Report 39-195-86.
2Controls of CO Filtration with Foam Emulsion Systems
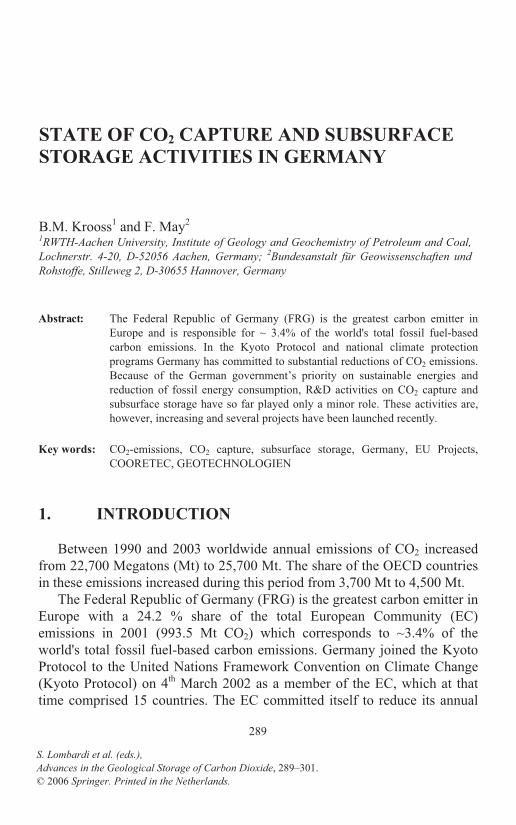
STATE OF CO2 CAPTURE AND SUBSURFACE
STORAGE ACTIVITIES IN GERMANY
B.M. Krooss1 and F. May
2
1RWTH-Aachen University, Institute of Geology and Geochemistry of Petroleum and Coal,
Lochnerstr. 4-20, D-52056 Aachen, Germany; 2Bundesanstalt für Geowissenschaften und
Rohstoffe, Stilleweg 2, D-30655 Hannover, Germany
Abstract: The Federal Republic of Germany (FRG) is the greatest carbon emitter in
Europe and is responsible for ~ 3.4% of the world's total fossil fuel-based
carbon emissions. In the Kyoto Protocol and national climate protection
programs Germany has committed to substantial reductions of CO2 emissions.
Because of the German government’s priority on sustainable energies and
reduction of fossil energy consumption, R&D activities on CO2 capture and
subsurface storage have so far played only a minor role. These activities are,
however, increasing and several projects have been launched recently.
Key words: CO2-emissions, CO2 capture, subsurface storage, Germany, EU Projects,
COORETEC, GEOTECHNOLOGIEN
1. INTRODUCTION
Between 1990 and 2003 worldwide annual emissions of CO2 increased
from 22,700 Megatons (Mt) to 25,700 Mt. The share of the OECD countries
in these emissions increased during this period from 3,700 Mt to 4,500 Mt.
The Federal Republic of Germany (FRG) is the greatest carbon emitter in
Europe with a 24.2 % share of the total European Community (EC)
emissions in 2001 (993.5 Mt CO2) which corresponds to ~3.4% of the
world's total fossil fuel-based carbon emissions. Germany joined the Kyoto
Protocol to the United Nations Framework Convention on Climate Change
(Kyoto Protocol) on 4th March 2002 as a member of the EC, which at that
time comprised 15 countries. The EC committed itself to reduce its annual
289
S. Lombardi et al. (eds.),
Advances in the Geological Storage of Carbon Dioxide, 289–301.
© 2006 Springer. Printed in the Netherlands.

290 Krooss and May
average greenhouse gas emissions by the time period 2008 – 2012 by eight
percent with respect to the base 1990 level (4204 Mt). Reduction targets
were allocated to the individual member countries in the “Burden Sharing
Agreement” of June 1998 (Figure 1). According to this Agreement,
Germany has to reduce emissions by 21% with respect to the 1990 level
(1216.2 Mt CO2 equivalent emissions). In the national FRG climate
protection program of 18th October 2000 the target was set to a reduction of
CO2 emissions by 25% with respect to 1990 by 2005. By 2001 annual CO2
in emissions Germany had decreased by 18.3 % to 993.5 Mt putting the
country ahead of the reduction target and in line with the United Kingdom,
Sweden and Luxembourg.
Spain 15.0%
Greece 25.0%
Portugal 27.0%
Ireland 13.0%
Sweden 4.0%
France 0.0%
Finland 0.0%
Luxembourg -28.0%
Austria -13.0%
Belgium -7.5%
Netherlands -6.0%
Denmark -21.0%
Italy -6.5%
United Kingdom -12.5%
Germany -21.0%
-300 -250 -200 -150 -100 -50 0 50 100
GHG emissions (Mt CO2 equivalents)
Figure 1. Greenhouse gas emission targets of EU Member States for 2008-2012 under the EU
Burden-Sharing Agreement.
The decision of the German government to phase out the use of nuclear
power by 2020 will have serious implications on the energy supply and
requires alternative solutions. For a transition period fossil fuels will remain
an indispensable source of energy.
To further reduce greenhouse gas emissions, the climate policy of the
German government focuses on sustainable energies and the reduction of
fossil energy consumption. R&D activities on CO2 sequestration and
subsurface storage have played a comparatively minor role. Activities have,
however, increased recently both on the capture and storage fields, in view
of the start of trading of CO2 Emission certificates in 2005.

State of CO2 Capture and Subsurface Storage Activities in Germany 291
2. GERMAN R&D ACTIVITIES ON CO2 CAPTURE
AND STORAGE
German research institutes have successfully participated in various
international research projects at the European Union (EU) level. These
comprise Joule II (1993-1995; RWE-AG), GESTCO (1999-2003; BGR),
NASCENT (2000-2004; BGR, RWTH-Aachen), RECOPOL (2001-2005;
DBI-GUT, RWTH-Aachen), CASTOR (2004-2006; BGR, University of
Stuttgart), and CO2GeoNet (BGR). The EU project CO2SINK, which started
in 2004, was the first major EC project of this kind initiated by a German
institution (GFZ-Potsdam). A worldwide overview of former and ongoing
projects on CO2 capture and underground storage can be found at the IEG
GHG website (http://www.co2captureandstorage.info/).
More recently three major national R&D programs have been launched
to promote CO2 capture from coal-fired power plants (COORETEC), to
support research on greenhouse gas emission reduction and adaptation to
climate change (Forschung für den Klimaschutz und Schutz vor
Klimawirkungen), and to explore methods and facilities for underground
storage of CO2. The latter activity is embedded in the
GEOTECHNOLOGIEN Program of the Federal Ministry of Education and
Research (BMBF) and The German Research Foundation (DFG).
2.1 German involvement in international projects
2.1.1 Joule II
The Joule II Project “Underground Disposal of Carbon Dioxide” was the
first European research project examining issues associated with
underground CO2 disposal. Its goal was to assess quality and quantity of CO2
available from fossil fuel power plants, to examine pipeline transport of CO2
and to examine various options for underground disposal. Furthermore it
addressed safety and stability issues, investigated the geochemistry
associated with underground disposal and carried out techno-economic
modeling.
The Joule II consortium comprised the Geological Surveys of the UK
(BGS), France (BRGM) and The Netherlands (TNO-NITG), the IKU
Petroleum Research Institute of Norway and the University of Sunderland
(UK). The German energy industry was represented in this project by the
company RWE AG.

292 Krooss and May
2.1.2 GESTCO
The GESTCO (GEological STorage of CO2) project started in 2000. It
was initiated to assess the European potential for geological storage of CO2
from fossil fuel combustion. Participants were the Geological Surveys of
eight European countries (Belgium, Denmark, France, Germany, Greece,
Norway, Netherlands, UK, and the research institute ECOFYS).
Figure 2. Sedimentary basins in Germany > 1 km depth, hosting natural gas fields and aquifer
structures that could provide storage capacity. Case study sites and regional storage capacity
investigations (1-4) (BGR, GESTCO).

State of CO2 Capture and Subsurface Storage Activities in Germany 293
The German Federal Institute for Geosciences and Natural Resources
(BGR) calculated CO2-emissions for large industrial point sources and
mapped the extent of potential storage areas in aquifers and deep unminable
coal seams. Storage capacities were estimated for the various underground
storage options: aquifers, deep unminable coal fields, oil/gas fields and
abandoned coal and salt mines in Germany (cf. Figure 2). Finally, a
descriptive geologic overview was compiled of potential CO2 storage
formations in Northern Germany (Permian and Mesozoic) and an overview
of the regional distribution of seals.
The data compiled were incorporated into a common CO2 Storage
Geographic Information System (GIS) for Europe, established within the
GESTCO project and covering the territory of the participating countries and
their off-shore areas as well. This GIS comprises the first systematic
compilation of CO2 point sources and potential storage facilities in
Germany.
Two case studies, the abandoned natural gas field Alfeld-Elze and the
Buntsandstein aquifer close to the planned power plant Lubmin have been
selected for numerical simulations of CO2 injection into the reservoirs and
long-term migration, thermodynamic modeling of potential reactions
between formation water, CO2, and reservoir rocks, and for cost calculations
with a decision support system developed by TNO- NITG.
BGR and the British Geological Survey (BGS) jointly prepared a report
on CO2 storage safety and conflicts of use.
2.1.3 NASCENT
Two German institutions, BGR and RWTH-Aachen University, were
project partners in the EU project NASCENT (Natural Analogues for the
Storage of CO2 in the Geological Environment) from 2001 to 2004. Various
locations with natural occurrences and different intensities of CO2 emission
were selected in France, Germany, Greece, Hungary and Italy and studied in
great detail to analyse the conditions, effects and processes related to long-
term underground storage of CO2.
In the Vorderrhön area in central Germany natural CO2 occurs below and
locally within Permian Zechstein salts and was produced commercially until
the 1980s. Here BGR conducted detailed geological studies, analyses of
fluid obtained from wells and sampled in salt mines in the overburden of the
CO2 reservoir Oechsen (Fig. 2). Soil gas surveys were performed to identify
potential leakage pathways of CO2 to the surface. In addition, BGR operated
automatic soil gas monitoring systems and provided expertise for surveys at
the other NASCENT sites.
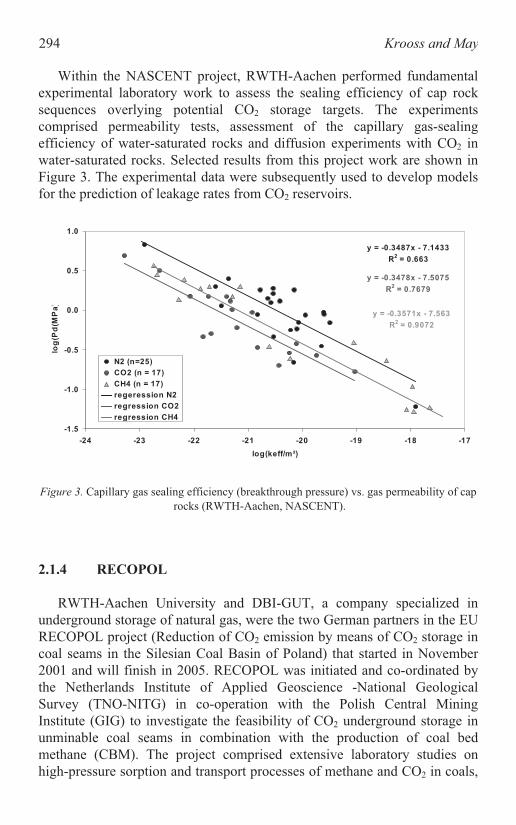
294 Krooss and May
Within the NASCENT project, RWTH-Aachen performed fundamental
experimental laboratory work to assess the sealing efficiency of cap rock
sequences overlying potential CO2 storage targets. The experiments
comprised permeability tests, assessment of the capillary gas-sealing
efficiency of water-saturated rocks and diffusion experiments with CO2 in
water-saturated rocks. Selected results from this project work are shown in
Figure 3. The experimental data were subsequently used to develop models
for the prediction of leakage rates from CO2 reservoirs.
y = -0.3487x - 7.1433
R2 = 0.663
y = -0.3478x - 7.5075
R2 = 0.7679
y = -0.3571x - 7.563
R2 = 0.9072
-1.5
-1.0
-0.5
0.0
0.5
1.0
-24 -23 -22 -21 -20 -19 -18 -17
log(keff/m²)
log
(Pd
(MP
a)
N2 (n=25)
CO2 (n = 17)
CH4 (n = 17)
regeression N2
regression CO2
regression CH4
Figure 3. Capillary gas sealing efficiency (breakthrough pressure) vs. gas permeability of cap
2.1.4 RECOPOL
RWTH-Aachen University and DBI-GUT, a company specialized in
underground storage of natural gas, were the two German partners in the EU
RECOPOL project (Reduction of CO2 emission by means of CO2 storage in
coal seams in the Silesian Coal Basin of Poland) that started in November
2001 and will finish in 2005. RECOPOL was initiated and co-ordinated by
the Netherlands Institute of Applied Geoscience -National Geological
Survey (TNO-NITG) in co-operation with the Polish Central Mining
Institute (GIG) to investigate the feasibility of CO2 underground storage in
unminable coal seams in combination with the production of coal bed
methane (CBM). The project comprised extensive laboratory studies on
high-pressure sorption and transport processes of methane and CO2 in coals,
rocks (RWTH-Aachen, NASCENT).
State of CO2 Capture and Subsurface Storage Activities in Germany 295
performed mainly at the Technical Universities of Delft (The Netherlands)
and RWTH-Aachen, in close co-operation with the Institut Français du
Pétrole (IFP). The main achievement of RECOPOL was the first European
field test on CO2 storage in deep coal seams in the Silesian Coal Basin of
Poland near the city of Katowice.
RWTH-Aachen contributed extensive experimental data sets on single
gas and mixed gas sorption capacity, selectivity and kinetics which were
incorporated into reservoir simulation software in close collaboration with
the Australian partner CSIRO Petroleum.
DBI-GUT was in charge of planning, preparation and supervision of the
engineering activities at the RECOPOL CO2 injection site.
Figure 4 shows the scheme of the RECOPOL field test with CBM
production from an existing well (MS-4) and CO2 injection into the newly
drilled MS-3 well. Liquid CO2 is delivered by trucks and stored on-site in
two 30 t storage tanks.
2.1.5 CASTOR
The CASTOR (CO2 from Capture to Storage) project started in 2004 and
aims at the development of new technologies for the separation of CO2 from
flue gases and its geological storage. The development of tools and methods
to quantify and minimize the uncertainties and risks linked to the storage of
Figure 4. The RECOPOL field test.

296 Krooss and May
CO2 is another aim of this project. Thirty parties from industry, research
organisations and universities participate in this integrated project. Three
off-shore and one on-shore hydrocarbon reservoirs have been selected as
case study sites. On the CO2 storage side, BGR is the only German project
partner but has subcontracted experimental work on the characterisation of
seal efficiency to RWTH-Aachen University. At the Atzbach-Schwanenstadt
natural gas field in Austria, BGR conducts soil gas investigations, including
flux measurements, monitoring and isotopic and geochemical analyses of
gases. Furthermore, BGR coordinates the studies on preventive and
corrective action technologies for leaking wells and faults. RWTH-Aachen
investigates CO2 transport processes in core samples from the cap rock
sequences above the gas reservoirs. In the context of the demonstration of
subsurface storage of CO2 in a nearly depleted gas reservoir and enhanced
gas recovery, RWTH will perform further experiments on cap rock
sequences of an offshore hydrocarbon reservoir in the Netherlands (K12-B).
On the capture side, the University of Stuttgart provides a mini power
plant for the development of efficient methods for CO2 extraction from flue
gas. German companies involved in the project are Siemens AG and RWE
Power, participating in the evaluation, optimisation and integration of post-
combustion capture processes in power plants and the process validation of a
pilot capture plant. BASF contributes to the developing and improving of
solvents for CO2 separation.
2.1.6 CO2SINK
CO2SINK is the first EU project on CO2 emission reduction initiated and
co-ordinated by a German research institute. It was proposed by
GeoForschungsZentrum (GFZ, National Research Centre for Geosciences)
Potsdam as an in-situ R&D laboratory for geological storage of CO2.
The target reservoir is located near the town of Ketzin (Fig. 2) west of
Berlin and Potsdam at a depth of ~700m and represents a sandstone aquifer
of several tens of metres of thickness. The scope of the project comprises a
baseline geologic survey with a detailed risk assessment to ensure safe
injection and storage of CO2. Detection and monitoring of the injected CO2
is another focus in this project.
A total of 14 organisations from 8 European countries, including
universities, research institutes and industrial companies are presently
participating in this project. Its aim is to integrate CO2 injection into a
framework of CO2 capture facilities including a biomass power plant.

State of CO2 Capture and Subsurface Storage Activities in Germany 297
2.1.7 CO2STORE
CO2STORE is a European integrated project with the aim of transferring
the experience gained in the scientific projects SACS I+II from Statoil`s
offshore CO2 injection to other potential storage sites with different
geological conditions. One of the four additional cases proposed is the
lignite fired power plant Schwarze Pumpe in East Germany. For this power
plant BGR had to find potential storage sites capable of taking in 400 Mt of
CO2. The only gas field with a storage capacity of this magnitude is located
in the Altmark (Fig. 2). Numerical modelling to simulate CO2 injection and
enhanced gas recovery have been performed for this reservoir. One of the
identified aquifer structures, Schweinrich (Fig. 2), has been selected for
further characterisation of the reservoir structure and caprock properties.
Risk assessments are carried out together with BRGM (the simulation of
geochemical reactions), NITG-TNO (long-term CO2 migration simulation)
and Vattenfall/NITG-TNO.
2.1.8 CO2GeoNet
The EU has initiated a Network of Excellence for CO2 capture and
storage, intending to facilitate a better co-ordination of research activities in
this field. The network comprises 12 institutes from 8 European Countries
was formed in 2004. BGR is the sole German participant. After initial
activities to create inventories of relevant research infrastructure and to
identify gaps in knowledge and future research needs, longer term joint
research begins in 2005.
2.2 National research programmes and initiatives
Germany has recently initiated national research activities for the
reduction of CO2 emissions from fossil fuel utilization. One of these, the
COORETEC initiative, is aiming at improved power-plant technologies
while the GEOTECHNOLOGIEN program investigates underground storage
options for CO2. Other individual research and development activities of
universities, industry and research institutes exist. Their description is,
however, beyond the scope of this paper.
2.2.1 COORETEC
The COORETEC initiative was launched in 2002 by the Federal Ministry
of Economics and Labour (BMWA) to promote CO2-reduction-technologies
for fossil fuel-fired power plants. Four working groups (WG) were
298 Krooss and May
established to address technical, scientific, socio-economic and legal aspects
of CO2 capture and storage:
WG1: Boundary conditions (legal framework, economic conditions)
WG2: CO2-capture, utilisation and storage
WG3: Short and mid term power plant technologies
WG4: Future technologies
In 2004 the report of these four COORETEC working groups was
published under the title: “Research and Development Concept for Zero-
Emission Fossil-Fuelled Power Plants”. This report can be downloaded from
the COORETEC website (http://www.cooretec.de).
As shown in Figure 6, the short-term priority target of the COORETEC
project is to increase the efficiency of steam (DKW) and gas & steam
(GuD)electric power stations and thus decrease the CO2 emissions per unit
of electric energy produced from fossil fuel combustion. Thus, R&D
activities of COORETEC projects focus on:
Measures to improve efficiency of combined cycles
Measures to improve efficiency of conventional steam power plants
Integrated Gasification Gas Combined Cycle (IGCC) power plant
development with and without CO2 capture
Novel technology developments with CO2 capture, especially oxyfuel
concepts
With the OXYCOAL-AC project, funded in the context of COORETEC,
the Institute of Heat and Mass Transfer (www.wuek.rwth-aachen.de) of
RWTH-Aachen is conducting front-end R&D work in this field.
CO2 capture and storage technologies are also in the scope of the
COORETEC program, but with lower priority and on an intermediate and
long-term R&D horizon. The compilation of a national storage inventory is
considered a prerequisite for near-zero-emission power generation.
2.2.2 GEOTECHNOLOGIEN
In November 2003 a call for project applications was launched by the
GEOTECHNOLOGIEN Programme with the research focus: “Exploration,
Usage and Protection of the Subsurface”. GEOTECHNOLOGIEN is a
geoscientific research and development programme funded jointly by the
Federal Ministry of Education and Research (BMBF) and the Deutsche
Forschungsgemeinschaft (DFG — German Research Council).
The call solicited project applications related to ”Utilisation of the
Subsurface for Global Climate Protection Purposes” with a specific focus on
the “appraisal of procedures for subsurface storage of the greenhouse gas
CO2 and the development of corresponding exploration and monitoring
technologies”.
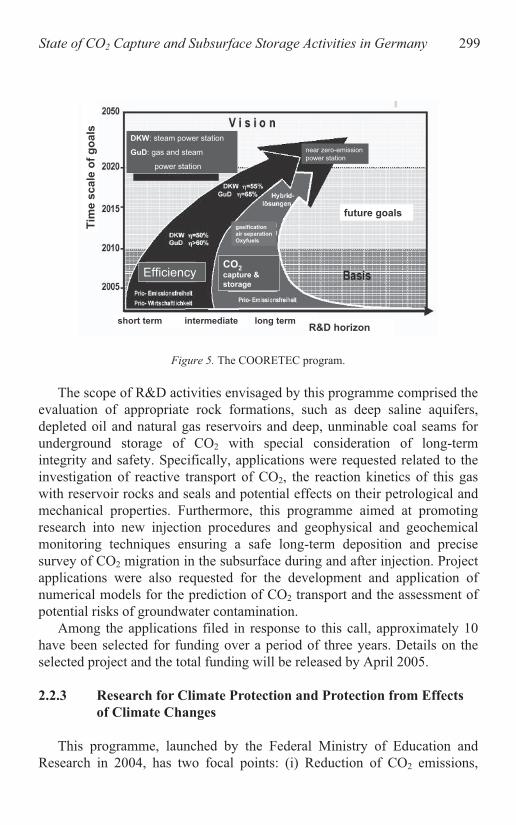
State of CO2 Capture and Subsurface Storage Activities in Germany 299
short term intermediate long termR&D horizon
future goals
EfficiencyCO
2
capture &
storage
DKW: steam power station
GuD: gas and steam
power station
near zero-emission
power station
Tim
e s
cale
of
go
als
gasification
air separation
Oxyfuels
short term intermediate long termR&D horizon
future goals
EfficiencyCO
2
capture &
storage
DKW: steam power station
GuD: gas and steam
power station
near zero-emission
power station
Tim
e s
cale
of
go
als
gasification
air separation
Oxyfuels
Figure 5. The COORETEC program.
The scope of R&D activities envisaged by this programme comprised the
evaluation of appropriate rock formations, such as deep saline aquifers,
depleted oil and natural gas reservoirs and deep, unminable coal seams for
underground storage of CO2 with special consideration of long-term
integrity and safety. Specifically, applications were requested related to the
investigation of reactive transport of CO2, the reaction kinetics of this gas
with reservoir rocks and seals and potential effects on their petrological and
mechanical properties. Furthermore, this programme aimed at promoting
research into new injection procedures and geophysical and geochemical
monitoring techniques ensuring a safe long-term deposition and precise
survey of CO2 migration in the subsurface during and after injection. Project
applications were also requested for the development and application of
numerical models for the prediction of CO2 transport and the assessment of
potential risks of groundwater contamination.
Among the applications filed in response to this call, approximately 10
have been selected for funding over a period of three years. Details on the
selected project and the total funding will be released by April 2005.
2.2.3 Research for Climate Protection and Protection from Effects
of Climate Changes
This programme, launched by the Federal Ministry of Education and
Research in 2004, has two focal points: (i) Reduction of CO2 emissions,
300 Krooss and May
especially in industrial applications (power generation is a focus of the
COORETEC Programme) and (ii) Adaptation to climate change and extreme
weather events. Projects probably will not commence before 2006.
3. CONCLUSION
Although the climate policy of the Federal Republic of Germany is
aiming at an increased use of renewable energy and reduction of energy
consumption, fossil fuels will remain an important energy source in the
foreseeable future, even more so because the production of nuclear energy
within Germany will be phased out over the next 20 years. In this context
one strategy, namely the reduction of CO2 emissions from fossil fuel power
plants is reflected in the COORETEC programme. Here the first priority is
the development of modern, highly efficient power plant technology. New
procedures for CO2 separation and zero-emission fossil power plants are also
considered within COORETEC but will invariably reduce power generation
efficiency and increase energy costs. Provided that this approach continues
to find public acceptance, the issue of long-term geological storage of large
quantities of CO2 arises as an immediate consequence of CO2 separation.
Experience gathered by several German research groups in European
projects is now integrated into the national GEOTECHNOLOGIEN R&D
programme which takes into account the specific geological, infrastructural,
socio-economic and legal situation in Germany. Involvement of German
research groups in previous (GESTCO, NASCENT, RECOPOL) and
ongoing EU projects (CASTOR, CO2SINK, CO2STORE, CO2GeoNet) will
ensure the continuity of exchange of expertise on the international level.
Additionally, according to the second call in the EU 6th Framework
Programme, joint research projects on CCS with the participation of German
research institutes involved in current EU projects are in preparation.
ACRONYMS AND PROJECT LINKS
CASTOR: CO2 from capture to storage
COORETEC: CO2 Reduction Technologies (http://www.cooretec.de)
CO2SINK: In-situ R&D laboratory for geological storage of CO2
(http://www.co2sink.org/)
GEOTECHNOLOGIEN: (http://www.geotechnologien.de/)
GESTCO: GEological STorage of CO2
(http://www.nitg.tno.nl/projects/eurogeosurveys/projects/GestcoWeb/)
State of CO2 Capture and Subsurface Storage Activities in Germany 301
JOULE II: Underground Disposal of Carbon Dioxide
(http://www.dti.gov.uk/energy/environment/eerp/reports/ps_001.pdf)
NASCENT: Natural Analogues for the Storage of CO2 in the Geological
Environment (http://www.bgs.ac.uk/nascent/home.html)
RECOPOL: Reduction of CO2 emission by means of CO2 storage in coal
seams in the Silesian Coal Basin of Poland (http://recopol.nitg.tno.nl/)
INSTITUTION NAMES AND CONTACT INFORMATION
BGR: Bundesanstalt für Geowissenschaften und Rohstoffe (Federal
Institute for Geosciences and Natural Resources); (http://www.bgr.de/)
BMBF Bundesministerium für Bildung und Forschung (Federal Ministry
of Education and Research); (http://www.bmbf.de/)
BMWA Bundesministerium für Wirtschaft und Arbeit (Federal Ministry
of Economics and Labour); (http://www.bmwa.bund.de/)
CSIRO Petroleum: Commonwealth Scientific and Industrial Research
Organisation – Petroleum Resources (http://www.dpr.csiro.au/)
DBI-GUT: DBI Gas- und Umwelttechnik GmbH (http://www.dbi-gut.de)
GFZ-Potsdam: GeoForschungsZentrum Potsdam (National Research
Centre for Geosciences); (http://www.gfz-potsdam.de/)
GIG: G ówny Instytut Górnictwa (Central Mining Institute), Katowice,
Poland (http://www.gig.katowice.pl/)
RWTH-Aachen University (http://www.rwth-aachen.de/)
TNO-NITG: Netherlands Institute of Applied Geoscience - National
Geological Survey (TNO-NITG) (http://www.nitg.tno.nl/eng/)
Universität Stuttgart (http://www.uni-stuttgart.de/)

GEOPHYSICAL MONITORING OF THE CO2
PLUME AT SLEIPNER, NORTH SEA
An outline review
A. Chadwick1, R. Arts
2 , O. Eiken
3 , P. Williamson
1 and G. Williams
1
1British Geological Survey, Kingsley Dunham Centre, Keyworth, Nottingham, NG12 5GG,
United Kingdom; 2Netherlands Institute of Applied Geoscience TNO - National Geological
Survey, Kriekenpitplein 18, PO Box 80015, 3508 TA Utrecht, The Netherlands; 3Statoil
Research Centre, Rotvoll, N-7005 Trondheim, Norway.
Abstract: CO2 produced at the Sleipner gas field is being injected into the Utsira Sand, a
major saline aquifer some 1000m beneath the North Sea. The injection plume
is being monitored by geophysical methods. 3D seismic data were acquired in
1994, prior to injection, and again in 1999, 2001 and 2002; seabed gravimetric
data were also acquired in 2002. The CO2 plume is imaged on the seismic data
as a number of bright sub-horizontal reflections, growing with time, underlain
by a prominent velocity pushdown. Quantitative modelling is based on plume
reflectivity largely comprising tuned responses from thin layers of CO2
trapped beneath thin intra-reservoir mudstones, with layer thicknesses being
mapped according to an amplitude-thickness tuning relationship. Between the
layers a lesser component of much lower-saturation, dispersed CO2 is required
to match the observed velocity pushdown. However, reservoir temperatures
are subject to significant uncertainty, and inverse models of CO2 distribution,
based on lower and higher temperature scenarios, can produce both the
observed plume reflectivity and the velocity pushdown. Higher temperature
models however require that the dispersed component of CO2 has a somewhat
patchy rather than uniform saturation. Analysis of the datasets suggests that
accumulations of CO2 as small as 500 tonnes may be detectable under
favourable conditions, providing a basis for setting leakage criteria. To date,
there is in fact no evidence of migration from the primary storage reservoir.
Key words: CO2 sequestration, Sleipner, geophysical methods, 4D seismic, gravity,
velocity pushdown, quantitative modeling, accumulation detection
303
S. Lombardi et al. (eds.),
Advances in the Geological Storage of Carbon Dioxide, 303–314.
© 2006 Springer. Printed in the Netherlands.
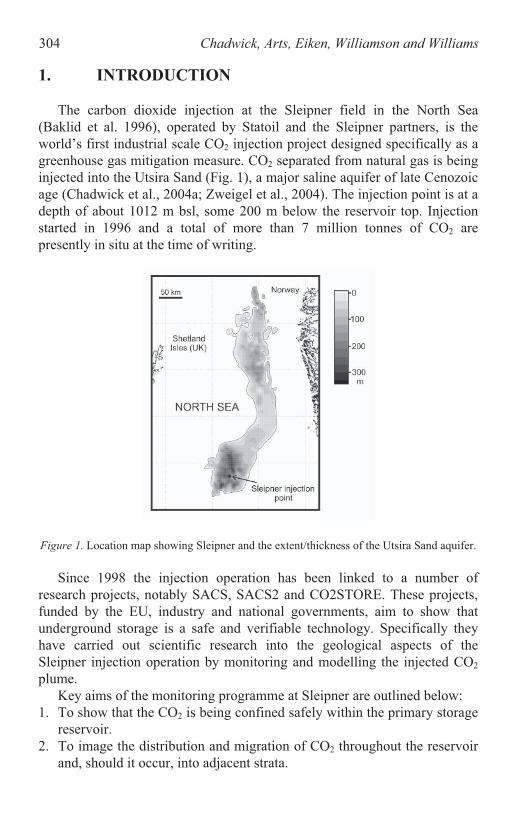
304 Chadwick, Arts, Eiken, Williamson and Williams
1. INTRODUCTION
The carbon dioxide injection at the Sleipner field in the North Sea
(Baklid et al. 1996), operated by Statoil and the Sleipner partners, is the
world’s first industrial scale CO2 injection project designed specifically as a
greenhouse gas mitigation measure. CO2 separated from natural gas is being
injected into the Utsira Sand (Fig. 1), a major saline aquifer of late Cenozoic
age (Chadwick et al., 2004a; Zweigel et al., 2004). The injection point is at a
depth of about 1012 m bsl, some 200 m below the reservoir top. Injection
started in 1996 and a total of more than 7 million tonnes of CO2 are
presently in situ at the time of writing.
Figure 1. Location map showing Sleipner and the extent/thickness of the Utsira Sand aquifer.
Since 1998 the injection operation has been linked to a number of
research projects, notably SACS, SACS2 and CO2STORE. These projects,
funded by the EU, industry and national governments, aim to show that
underground storage is a safe and verifiable technology. Specifically they
have carried out scientific research into the geological aspects of the
Sleipner injection operation by monitoring and modelling the injected CO2
plume.
Key aims of the monitoring programme at Sleipner are outlined below:
1. To show that the CO2 is being confined safely within the primary storage
reservoir.
2. To image the distribution and migration of CO2 throughout the reservoir
and, should it occur, into adjacent strata.

Geophysical Monitoring of the CO2 Plume at Sleipnir, North Sea 305
3. To provide early warning of any potentially hazardous migration towards
the seabed.
Baseline 3D seismic data were acquired in 1994, prior to injection, with
repeat surveys in 1999 (2.35 million tonnes of CO2 in the reservoir), 2001
(4.26 Mt) and 2002 (4.97Mt). In addition, to complement the information
available from the seismic datasets, a seabed gravimetric survey was
acquired in 2002.
2. TIME-LAPSE SEISMIC DATASETS
This paper provides a brief outline of current interpretive work on the
seismic datasets. Fuller details are given in Arts et al. (2004a, 2004b) and
Chadwick et al. (2004b, 2005).
Figure 2. Time-lapse seismic images of the CO2 plume: a) N-S inline through the 1994
dataset prior to injection and through the 1999, 2001 and 2002 datasets. b) Maps of integrated
absolute reflection amplitudes from the plume showing its elliptical form in plan view and
growth from 1999 to 2001. Black disc denotes injection point.

306 Chadwick, Arts, Eiken, Williamson and Williams
2.1 Time-lapse images
The CO2 plume is imaged as a number of bright sub-horizontal
reflections within the reservoir, growing with time (Figure 2a). The
reflections are interpreted as arising from thin (< 8 m thick) layers of CO2
trapped beneath thin intra-reservoir mudstones and the reservoir caprock.
The plume is roughly 200 m high and elliptical in plan, with a major axis
increasing from about 1500 m in 1999 to about 2000 m in 2001 (Figure 2b).
The plume is underlain by a prominent velocity pushdown (Figure 3) caused
by the seismic waves travelling much more slowly through CO2-saturated
rock than through the virgin aquifer.
Figure 3. Velocity pushdown. a) Inline through the reservoir in 1994 and 1999 showing
pushdown of the Base Utsira Sand beneath the plume. b) Cross-correlogram of a reflection
window beneath the central part of the 2001 plume. Pick follows the correlation peak and
defines pushdown. c) Pushdown maps in 1999 and 2001. Black disc denotes injection point.
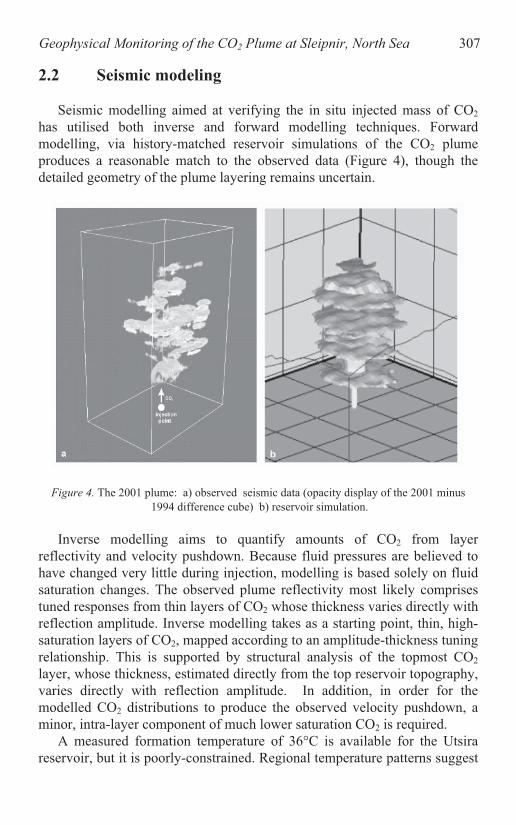
Geophysical Monitoring of the CO2 Plume at Sleipnir, North Sea 307
2.2 Seismic modeling
Seismic modelling aimed at verifying the in situ injected mass of CO2
has utilised both inverse and forward modelling techniques. Forward
modelling, via history-matched reservoir simulations of the CO2 plume
produces a reasonable match to the observed data (Figure 4), though the
detailed geometry of the plume layering remains uncertain.
Figure 4. The 2001 plume: a) observed seismic data (opacity display of the 2001 minus
Inverse modelling aims to quantify amounts of CO2 from layer
reflectivity and velocity pushdown. Because fluid pressures are believed to
have changed very little during injection, modelling is based solely on fluid
saturation changes. The observed plume reflectivity most likely comprises
tuned responses from thin layers of CO2 whose thickness varies directly with
reflection amplitude. Inverse modelling takes as a starting point, thin, high-
saturation layers of CO2, mapped according to an amplitude-thickness tuning
relationship. This is supported by structural analysis of the topmost CO2
layer, whose thickness, estimated directly from the top reservoir topography,
varies directly with reflection amplitude. In addition, in order for the
modelled CO2 distributions to produce the observed velocity pushdown, a
minor, intra-layer component of much lower saturation CO2 is required.
A measured formation temperature of 36°C is available for the Utsira
reservoir, but it is poorly-constrained. Regional temperature patterns suggest
1994 difference cube) b) reservoir simulation.

308 Chadwick, Arts, Eiken, Williamson and Williams
that the reservoir may be up to 10°C warmer. At the higher temperatures,
CO2 would have significantly different physical properties. In particular its
density would be significantly lower, giving a correspondingly larger in situ
volume. Inverse models of CO2 distribution in the 1999 plume have been
generated, based on both the measured and a possible higher temperature
scenario (Figure 5). The distribution of CO2 in both models is consistent
with the known injected mass (allowing for parameter uncertainty) and can
replicate the observed plume reflectivity and the velocity pushdown.
However, the higher temperature model requires that the dispersed
component of CO2 has a somewhat patchy, rather than uniform, mixing of
the CO2 and water phases (Sengupta & Mavko 2003). This highlights a key
uncertainty in verification estimates; the velocity behaviour of the CO2 –
water – rock system, which is heavily dependent on the (poorly constrained)
nature of small-scale mixing processes between the fluid phases.
Because of these uncertainties, a modelling solution which uniquely
verifies the injected volume has not yet been obtained. Work on reducing
uncertainty is ongoing.
Figure 5. Inverse modelling of the 1999 plume. Observed data compared with synthetic
seismograms based on inverse models for two plume scenarios: Injection point at 36°C with
fine-scale mixing throughout; Injection Point at 45° C with patchy mixing in the intra-layer
dispersed component of CO2.
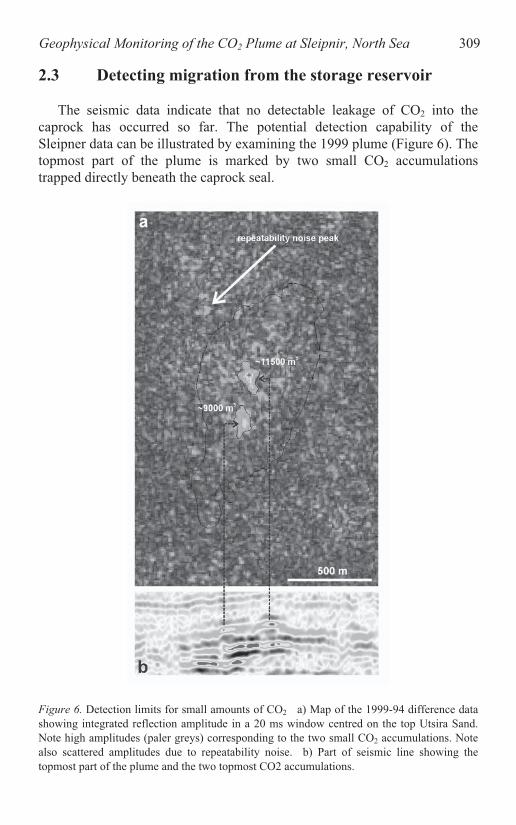
Geophysical Monitoring of the CO2 Plume at Sleipnir, North Sea 309
2.3 Detecting migration from the storage reservoir
The seismic data indicate that no detectable leakage of CO2 into the
caprock has occurred so far. The potential detection capability of the
Sleipner data can be illustrated by examining the 1999 plume (Figure 6). The
topmost part of the plume is marked by two small CO2 accumulations
trapped directly beneath the caprock seal.
Figure 6. Detection limits for small amounts of CO2 a) Map of the 1999-94 difference data
showing integrated reflection amplitude in a 20 ms window centred on the top Utsira Sand.
Note high amplitudes (paler greys) corresponding to the two small CO2 accumulations. Note
also scattered amplitudes due to repeatability noise. b) Part of seismic line showing the
topmost part of the plume and the two topmost CO2 accumulations.

310 Chadwick, Arts, Eiken, Williamson and Williams
From the reflection amplitudes, the volumes of the two accumulations
can be estimated at 9000 and 11500 m3, respectively. Other seismic features
on the timeslice can be attributed to repeatability noise, arising from slight
intrinsic mismatches between the 1999 and 1994 (baseline) surveys. It is
clear that the level of repeatability noise plays a key role in determining the
detectability threshold. Thus for a patch of CO2 to be identified on the data
it must be possible to discriminate between it and the largest noise peaks.
Preliminary analysis suggests that accumulations larger than about 4000 m3
should fulfill this criterion. This corresponds to about 2000 tonnes of CO2 at
the top of the reservoir (where CO2 has a density of about 500 kgm-3
), but
less than 600 tonnes at 500 m depth where the density is considerably lower.
Seismic detection depends crucially on the nature of the CO2 accumulation.
Small thick accumulations in porous strata would tend be readily detectable.
Conversely, distributed leakage fluxes through low permeability strata may
be difficult to detect with conventional seismic techniques. Similarly,
leakage along a fault within low permeability rocks would be difficult to
detect. Fluxes of CO2 such as these may well be associated with changes in
fluid pressure, in which case shear-wave seismic data is likely to prove
useful as a detection tool.
3. TIME-LAPSE SEABED GRAVIMETRY
Measurements of the gravitational acceleration due to mass distributions
within the earth may be used to detect variations in subsurface rock or fluid
density. Although of much lower spatial resolution than the seismic method,
gravimetry offers some important complementary adjuncts to time-lapse
seismic monitoring. Firstly, it can provide independent verification of the
change in subsurface mass during injection via Gauss’s Theorem. This
potentially important capability may enable estimates to be made of the
amount of CO2 going into dissolution, a significant source of uncertainty in
efforts to quantify free CO2 in the reservoir (dissolved CO2 is effectively
invisible on seismic data). Secondly, deployed periodically, gravimetry
could be used as an ‘early warning system’ to detect the accumulation of
CO2 in shallow overburden traps where it is likely to be in the low density
gaseous phase with a correspondingly strong gravity signature.
The possibility of monitoring injected CO2 with repeated gravity
measurements is strongly dependent on CO2 density and subsurface
distribution. A feasibility study of time-lapse gravimetry at Sleipner
(Williamson et al., 2001) modelled plume scenarios with CO2 densities
ranging from over 700 kgm-3
(corresponding to the lower reservoir
temperature scenario) to less than 350 kgm-3
(corresponding to possible

Geophysical Monitoring of the CO2 Plume at Sleipnir, North Sea 311
higher reservoir temperatures). The modelling indicated that future changes
in the CO2 plume could theoretically be detectable by seabed gravimetry.
For example it was shown that the addition of 2 million tonnes to the plume
would produce a change in peak gravity signal of between -8 and -33 mGal,
corresponding to CO2 densities of 700 kgm-3
and 350 kgm-3
, respectively
(Figure 7). Longer-term predictions suggest that the peak gravity signature
of the plume will gradually decrease as it thins by lateral migration at the
reservoir top. On the other hand, if CO2 leaked to shallower levels where it
would have a still lower density, gravity changes could well exceed -100
mGal.
Figure 7. Peak gravity anomaly as a function of CO2 density, predicted for the Sleipner CO2
plume in 1999 (2.3 MT in situ). Gravity changes computed for the sea surface (solid symbols)
and the seabed (open symbols).
A seabed gravity survey was acquired at Sleipner in 2002 (Eiken et al.
2003), with approximately 5 million tonnes of CO2 in the plume. The survey
was based around pre-positioned concrete benchmarks on the seafloor that
served as reference locations for the (repeated) gravity measurements.
Relative gravity and water pressure measurements were taken at each
benchmark by a customised gravimetry and pressure measurement module
mounted on a Remotely Operated Vehicle (Figure 8).
Thirty concrete benchmark survey stations were deployed in two
perpendicular lines, spanning an area some 7 km east-west and 3 km north-
south and overlapping the subsurface footprint of the CO2 plume. Each
survey station was visited at least three times to better constrain instrument
drift and other errors. Single station repeatability was estimated to be 4
mGal. For time-lapse measurements an additional uncertainty of 1 – 2 mGal
is associated with the reference null level. The final detection threshold for
Sleipner therefore is estimated at about 5 mGal.
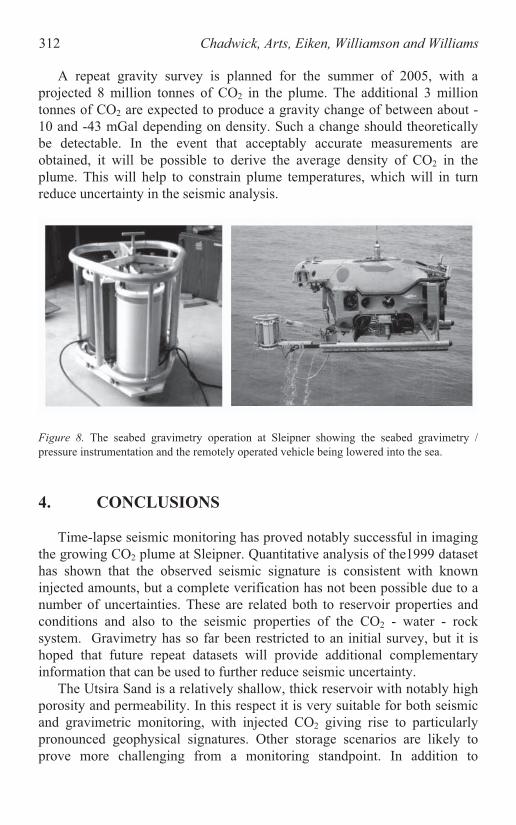
312 Chadwick, Arts, Eiken, Williamson and Williams
A repeat gravity survey is planned for the summer of 2005, with a
projected 8 million tonnes of CO2 in the plume. The additional 3 million
tonnes of CO2 are expected to produce a gravity change of between about -
10 and -43 mGal depending on density. Such a change should theoretically
be detectable. In the event that acceptably accurate measurements are
obtained, it will be possible to derive the average density of CO2 in the
plume. This will help to constrain plume temperatures, which will in turn
reduce uncertainty in the seismic analysis.
Figure 8. The seabed gravimetry operation at Sleipner showing the seabed gravimetry /
pressure instrumentation and the remotely operated vehicle being lowered into the sea.
4. CONCLUSIONS
Time-lapse seismic monitoring has proved notably successful in imaging
the growing CO2 plume at Sleipner. Quantitative analysis of the1999 dataset
has shown that the observed seismic signature is consistent with known
injected amounts, but a complete verification has not been possible due to a
number of uncertainties. These are related both to reservoir properties and
conditions and also to the seismic properties of the CO2 - water - rock
system. Gravimetry has so far been restricted to an initial survey, but it is
hoped that future repeat datasets will provide additional complementary
information that can be used to further reduce seismic uncertainty.
The Utsira Sand is a relatively shallow, thick reservoir with notably high
porosity and permeability. In this respect it is very suitable for both seismic
and gravimetric monitoring, with injected CO2 giving rise to particularly
pronounced geophysical signatures. Other storage scenarios are likely to
prove more challenging from a monitoring standpoint. In addition to

Geophysical Monitoring of the CO2 Plume at Sleipnir, North Sea 313
Sleipner, industrial-scale CO2 injection projects are ongoing at Weyburn in
Canada (Wilson and Monea, 2004), and at In Salah in Algeria, with another
planned for the Snohvit field in the Barents Sea. These will further test the
efficacy of geophysical monitoring methods in a range of storage situations.
Reservoir depths range from ~ 1500m to nearly 3000 m, with widely
different reservoir types, including carbonates. Major research projects are
linked to all of these projects and important new insights into monitoring
capabilities are anticipated in the coming years.
ACKNOWLEDGEMENTS
We thank the CO2STORE consortium for permission to publish this
work. SACS/SACS2 and CO2STORE have been funded by the EU Thermie
Programme, by industry partners Statoil, BP, ExxonMobil, Norsk Hydro,
TotalFinaElf, Vattenfall, Schlumberger and by national governments. R&D
partners are BGR (Bundesanstalt fur Geowissenschaften und Rohstoffe),
BGS (British Geological Survey), BRGM (Bureau de Recherches
(Institute Francais du Petrole), TNO-NITG (Netherlands Institute of Applied
Geoscience – National Geological Survey) and SINTEF Petroleum
Research. Andy Chadwick publishes with permission of the Executive
Director, British Geological Survey (NERC).
REFERENCES
Arts, R., Eiken, O., Chadwick, R.A., Zweigel, P., Van Der Meer, L., and Kirby, G.A., 2004,
Seismic monitoring at the Sleipner underground CO2 storage site (North Sea). in:
Geological Storage for CO2 emissions reduction, S. Baines, J. Gale and R.J. Worden, ed.,
Special Publication of the Geological Society, London, 233, pp. 181 - 191.
Arts, R., Eiken, O., Chadwick, R.A., Zweigel, P., Van Der Meer, L., and Zinszner, B., 2004b,
Monitoring of CO2 injected at Sleipner using time-lapse seismic data. Energy, 29:1383-
1393.
Baklid, A., Korbøl, R., and Owren, G., 1996, Sleipner Vest CO2 disposal, CO2 injection into a
shallow underground aquifer. SPE Annual Technical Conference and Exhibition, Denver,
Colorado, USA, SPE paper 36600, 1-9
Chadwick, R.A., Zweigel, P., Gregersen, U., Kirby, G.A., Johannessen, P.N., and Holloway,
S., 2004a, Characterisation of a CO2 storage site: The Utsira Sand, Sleipner, northern
North Sea.
CO2 sequestration in northern Europe, in: Geological Storage for CO2 emissions
reduction, S. Baines, J. Gale and R.J. Worden, ed., Special Publication of the Geological
Society, London, 233, pp. 17 - 28.
Chadwick, R.A., Holloway, S., Brook, M., and Kirby, G.A., 2004b, The case for underground
Geologiques et Minieres), GEUS (Geological Survey of Denmark), IFP
Energy, 29:1371-1381.

314 Chadwick, Arts, Eiken, Williamson and Williams
Chadwick, R.A., Arts, R., and Eiken, O., 2005, 4D seismic quantification of a growing CO2
plume at Sleipner, North Sea, in: Petroleum Geology: North West Europe and Global
Perspectives - Proceedings of the 6th Petroleum Geology Conference. A.G. Dore and B.
Vining, eds, Published by the Geological Society, London, pp. 1385 – 1399.
Eiken, O., Stenvold, T., Zumberge, M., and Nooner, S., 2003, Gravity monitoring at the
Sleipner CO2 injection site: Report on 2002 baseline survey. Statoil Technical Report,
22pp.
Sengupta, M., and Mavko, G., 2003, Impact of flow simulation parameters on saturation
scales and seismic velocity. Geophysics, 68(4):1267-1280.
Williamson, J.P., Chadwick, R.A., Rowley, W.J., and Eiken, O., 2001, Saline Aquifer
Storage: A Demonstration Project at the Sleipner Field. Work Area 5 (Geophysics) –
Gravity modelling of the CO2 bubble. BGS Commissioned report CR/01/063. 25pp.
Wilson, M. and Monea, M., 2004, (eds.) IEA GHG Weyburn CO2 Monitoring & Storage
project Summary Report 2000 – 2004. Petroleum Technology research Centre, Regina.
273pp.
Zweigel, P., Arts, R., Lothe, A. E., and Lindeberg, E., 2005, Reservoir geology of the Utsira
Formation at the first industrial-scale underground CO2 storage site (Sleipner area, North
Sea) in: Geological Storage for CO2 emissions reduction, S. Baines, J. Gale and R.J.
Worden, ed., Special Publication of the Geological Society, London, 233, pp. 165-180.

4-D SEISMICS, GAS-HYDRATE DETECTION
AND OVERPRESSURE PREDICTION AS A
COMBINED METHODOLOGY FOR
APPLICATION TO CO2 SEQUESTRATION
Combined seismic methods for CO2 monitoring
S. Persoglia, J.M. Carcione, G. Rossi And D. Gei
Istituto Nazionale di Oceanografia e di Geofisica – OGS-, Trieste, Italy
Abstract: Seismic surveys have proven to be useful for monitoring injected CO2 in the
subsurface. In this work, we show how rock physics, poro-elastic modeling
and 3D seismic tomography can be combined to detect the subtle changes in
seismic properties related to changes in pore-fill. 3D seismic tomography
yields the P- and S-wave velocity cubes, which are converted to petro-physical
properties by using rock-physics models of partial saturation under varying
temperature and pressure conditions, and seismic numerical modeling. The
methodology is illustrated with field examples of time-lapse analysis and gas-
hydrate detection.
Key words: Seismic properties, tomography, poro-elasticity.
1. INTRODUCTION
The underground storage of CO2 involves technologies developed and
widely used by the oil and gas industries for exploration, exploitation and
monitoring of hydrocarbon reservoirs. In CO2 sequestration, the type of
monitoring, its duration and frequency are key elements to verify the storage
efficiency and distribution of the injected carbon dioxide. Seismic surveys
have proven to be capable of monitoring CO2 in the subsurface (e.g. Arts et
al., 2004; Ghaderi and Landrø, 2004). To guarantee a similar success in less
favourable geological contexts, it is therefore important to apply the most
advanced methodologies to the specific case of CO2 monitoring. In
315
S. Lombardi et al. (eds.),
Advances in the Geological Storage of Carbon Dioxide, 315–323.
© 2006 Springer. Printed in the Netherlands.
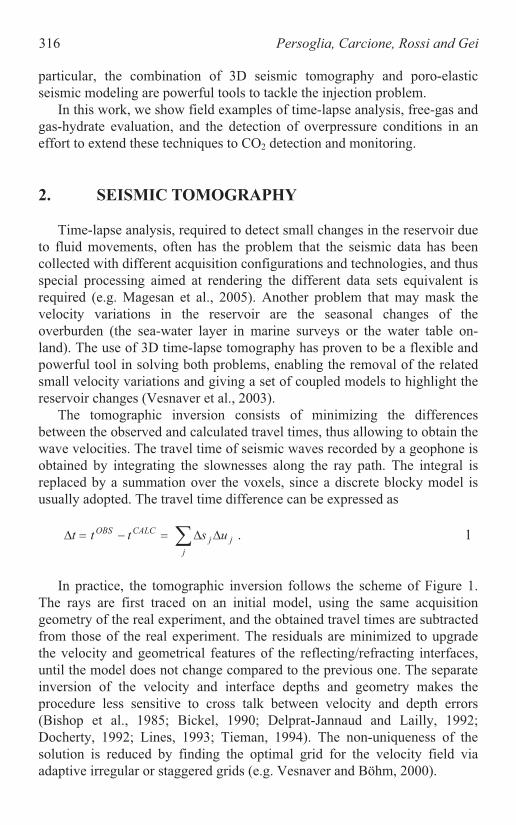
316 Persoglia, Carcione, Rossi and Gei
particular, the combination of 3D seismic tomography and poro-elastic
seismic modeling are powerful tools to tackle the injection problem.
In this work, we show field examples of time-lapse analysis, free-gas and
gas-hydrate evaluation, and the detection of overpressure conditions in an
effort to extend these techniques to CO2 detection and monitoring.
2. SEISMIC TOMOGRAPHY
Time-lapse analysis, required to detect small changes in the reservoir due
to fluid movements, often has the problem that the seismic data has been
collected with different acquisition configurations and technologies, and thus
special processing aimed at rendering the different data sets equivalent is
required (e.g. Magesan et al., 2005). Another problem that may mask the
velocity variations in the reservoir are the seasonal changes of the
overburden (the sea-water layer in marine surveys or the water table on-
land). The use of 3D time-lapse tomography has proven to be a flexible and
powerful tool in solving both problems, enabling the removal of the related
small velocity variations and giving a set of coupled models to highlight the
reservoir changes (Vesnaver et al., 2003).
The tomographic inversion consists of minimizing the differences
between the observed and calculated travel times, thus allowing to obtain the
wave velocities. The travel time of seismic waves recorded by a geophone is
obtained by integrating the slownesses along the ray path. The integral is
replaced by a summation over the voxels, since a discrete blocky model is
usually adopted. The travel time difference can be expressed as
j
jj
CALCOBSusttt . 1
In practice, the tomographic inversion follows the scheme of Figure 1.
The rays are first traced on an initial model, using the same acquisition
geometry of the real experiment, and the obtained travel times are subtracted
from those of the real experiment. The residuals are minimized to upgrade
the velocity and geometrical features of the reflecting/refracting interfaces,
until the model does not change compared to the previous one. The separate
inversion of the velocity and interface depths and geometry makes the
procedure less sensitive to cross talk between velocity and depth errors
(Bishop et al., 1985; Bickel, 1990; Delprat-Jannaud and Lailly, 1992;
Docherty, 1992; Lines, 1993; Tieman, 1994). The non-uniqueness of the
solution is reduced by finding the optimal grid for the velocity field via
adaptive irregular or staggered grids (e.g. Vesnaver and Böhm, 2000).
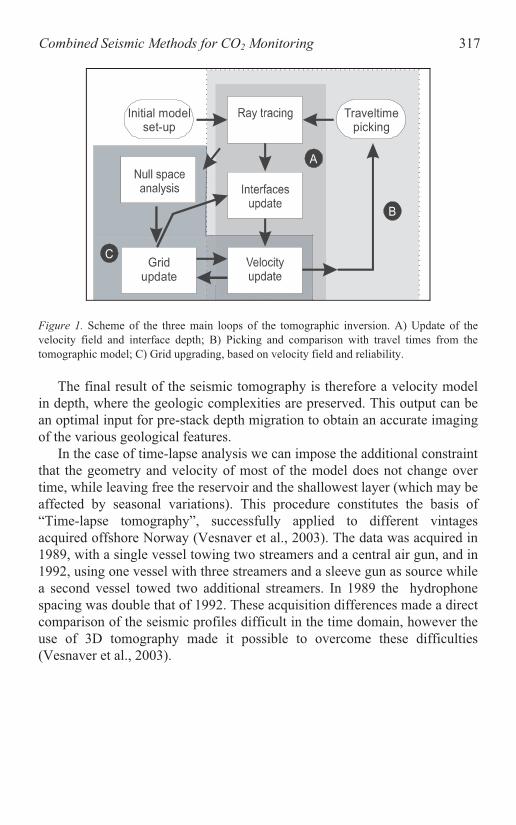
Combined Seismic Methods for CO2 Monitoring 317
Traveltime
picking
Initial model
set-up
Grid
update
A
B
C
Figure 1. Scheme of the three main loops of the tomographic inversion. A) Update of the
velocity field and interface depth; B) Picking and comparison with travel times from the
tomographic model; C) Grid upgrading, based on velocity field and reliability.
The final result of the seismic tomography is therefore a velocity model
in depth, where the geologic complexities are preserved. This output can be
an optimal input for pre-stack depth migration to obtain an accurate imaging
of the various geological features.
In the case of time-lapse analysis we can impose the additional constraint
that the geometry and velocity of most of the model does not change over
time, while leaving free the reservoir and the shallowest layer (which may be
affected by seasonal variations). This procedure constitutes the basis of
“Time-lapse tomography”, successfully applied to different vintages
acquired offshore Norway (Vesnaver et al., 2003). The data was acquired in
1989, with a single vessel towing two streamers and a central air gun, and in
1992, using one vessel with three streamers and a sleeve gun as source while
a second vessel towed two additional streamers. In 1989 the hydrophone
spacing was double that of 1992. These acquisition differences made a direct
comparison of the seismic profiles difficult in the time domain, however the
use of 3D tomography made it possible to overcome these difficulties
(Vesnaver et al., 2003).
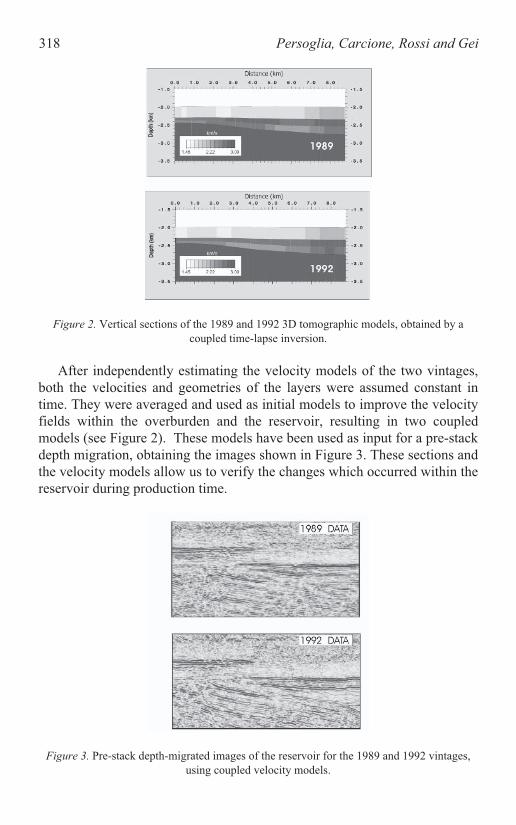
318 Persoglia, Carcione, Rossi and Gei
Figure 2. Vertical sections of the 1989 and 1992 3D tomographic models, obtained by a
coupled time-lapse inversion.
After independently estimating the velocity models of the two vintages,
both the velocities and geometries of the layers were assumed constant in
time. They were averaged and used as initial models to improve the velocity
fields within the overburden and the reservoir, resulting in two coupled
models (see Figure 2). These models have been used as input for a pre-stack
depth migration, obtaining the images shown in Figure 3. These sections and
the velocity models allow us to verify the changes which occurred within the
reservoir during production time.
Figure 3. Pre-stack depth-migrated images of the reservoir for the 1989 and 1992 vintages,
using coupled velocity models.
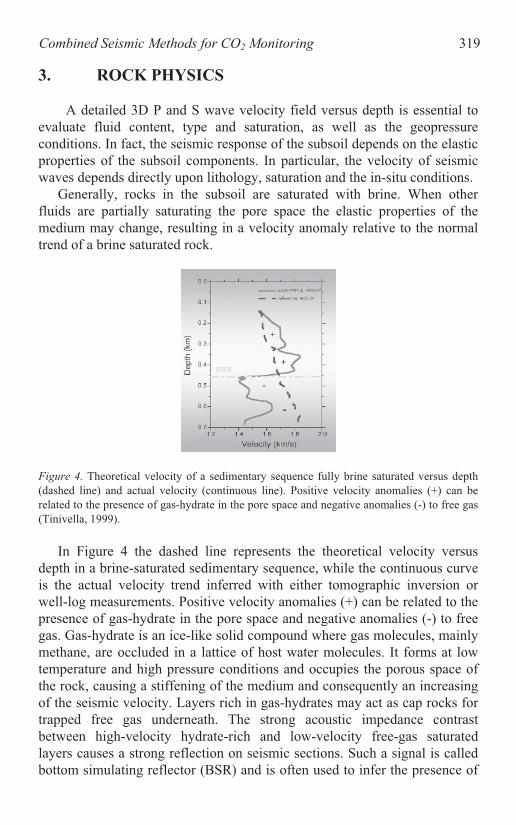
Combined Seismic Methods for CO2 Monitoring 319
3. ROCK PHYSICS
A detailed 3D P and S wave velocity field versus depth is essential to
evaluate fluid content, type and saturation, as well as the geopressure
conditions. In fact, the seismic response of the subsoil depends on the elastic
properties of the subsoil components. In particular, the velocity of seismic
waves depends directly upon lithology, saturation and the in-situ conditions.
Generally, rocks in the subsoil are saturated with brine. When other
fluids are partially saturating the pore space the elastic properties of the
medium may change, resulting in a velocity anomaly relative to the normal
trend of a brine saturated rock.
Figure 4. Theoretical velocity of a sedimentary sequence fully brine saturated versus depth
(dashed line) and actual velocity (continuous line). Positive velocity anomalies (+) can be
related to the presence of gas-hydrate in the pore space and negative anomalies (-) to free gas
(Tinivella, 1999).
In Figure 4 the dashed line represents the theoretical velocity versus
depth in a brine-saturated sedimentary sequence, while the continuous curve
is the actual velocity trend inferred with either tomographic inversion or
well-log measurements. Positive velocity anomalies (+) can be related to the
presence of gas-hydrate in the pore space and negative anomalies (-) to free
gas. Gas-hydrate is an ice-like solid compound where gas molecules, mainly
methane, are occluded in a lattice of host water molecules. It forms at low
temperature and high pressure conditions and occupies the porous space of
the rock, causing a stiffening of the medium and consequently an increasing
of the seismic velocity. Layers rich in gas-hydrates may act as cap rocks for
trapped free gas underneath. The strong acoustic impedance contrast
between high-velocity hydrate-rich and low-velocity free-gas saturated
layers causes a strong reflection on seismic sections. Such a signal is called
bottom simulating reflector (BSR) and is often used to infer the presence of

320 Persoglia, Carcione, Rossi and Gei
gas-hydrate within sediments. Above the BSR the pores of the rock are filled
with gas hydrate and water, whilst below the BSR the rocks are saturated
with free gas and water.
Rock physics is used to establish relationships between rock properties
and the observed seismic response. Rock-physics theories can be used to
compute theoretical seismic velocities in sediments saturated with fluids or
containing gas-hydrates. Rock compositions and fluid saturations can be
estimated by comparing the theoretical and observed velocities. There are
several theories predicting the elastic properties of composite media. Among
them the Biot theory is one of the most commonly used and tested by
comparison with laboratory measurements.
Figure 5. P- and S-wave velocities versus water saturation and different frequencies, using
Biot’s theory and White’s model. The other saturating fluid is free gas and the gas-hydrate
fraction is 0.3. Also shown is the P-wave velocity obtained using Hill’s equation (dashed line)
(Gei and Carcione, 2003).
Figure 5 shows the computed P and S-wave velocities as a function of
water saturation (Sw) and frequency of the seismic signal. The matrix is a
sandstone and the pore-saturating fluid is a mixture of water and methane
whose proportions range from pure gas (Sw=0) to pure water (Sw=1); 30% of
the pore space is occupied by gas hydrate. The S-wave velocity is slightly
affected by the fluids. The velocity decrease as water saturation increases is
due to variations in the density of the composite fluid.
Figure 6 shows the P-wave tomographic velocities of two seismic lines
acquired in an area located to the north of the Knipovich Ridge (western
Svalbard margin). The dashed line represents the BSR. These velocities have
been used to compute the free-gas (methane) saturation and gas-hydrate
concentration using a poro-elastic model based on a Biot-type approach (the
interaction of the rock frame, gas hydrate and fluid is modeled from first
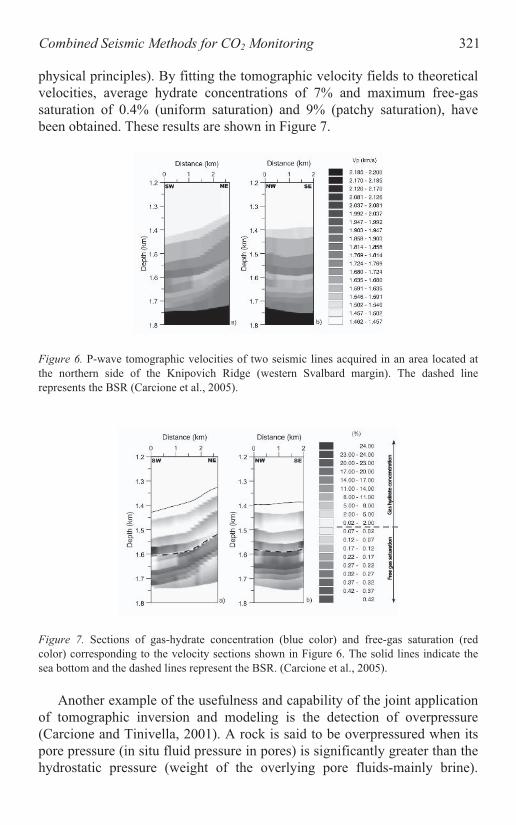
Combined Seismic Methods for CO2 Monitoring 321
physical principles). By fitting the tomographic velocity fields to theoretical
velocities, average hydrate concentrations of 7% and maximum free-gas
saturation of 0.4% (uniform saturation) and 9% (patchy saturation), have
been obtained. These results are shown in Figure 7.
Figure 6. P-wave tomographic velocities of two seismic lines acquired in an area located at
the northern side of the Knipovich Ridge (western Svalbard margin). The dashed line
represents the BSR (Carcione et al., 2005).
Figure 7. Sections of gas-hydrate concentration (blue color) and free-gas saturation (red
color) corresponding to the velocity sections shown in Figure 6. The solid lines indicate the
sea bottom and the dashed lines represent the BSR. (Carcione et al., 2005).
Another example of the usefulness and capability of the joint application
of tomographic inversion and modeling is the detection of overpressure
(Carcione and Tinivella, 2001). A rock is said to be overpressured when its
pore pressure (in situ fluid pressure in pores) is significantly greater than the
hydrostatic pressure (weight of the overlying pore fluids-mainly brine).

322 Persoglia, Carcione, Rossi and Gei
Acoustic and transport properties of rocks generally depend on effective
pressure, which is a linear combination of pore and confining pressures.
Using the Biot theory of poroelasticity (Biot, 1962; Carcione, 1998) it is
possible to calculate the seismic velocities for different combinations of the
pore and confining pressures. In particular, Carcione and Tinivella (2001)
analysed a site offshore Norway, calibrating a model of the various
formations on the basis of well data, tomographic inversion of seismic lines,
AVO analysis, and laboratory measurements. The modeling indicated a
substantial decrease in velocities with increasing pore-pressure, mainly
because of the opening of compliant cracks. The decrease in P-wave velocity
is higher for dry rocks than for brine-saturated rocks, while the S-wave
velocity is generally higher for the dry case than for the fully brine-saturated
case. The presence of gas does not have a major effect on velocities.
4. CONCLUSIONS
Two advanced seismic tools have been presented, namely 3D seismic
tomography and poro-elastic modeling. The analysis of the time-lapse
North-sea data sets demonstrates the flexibility of tomographic inversion,
due to changes in the acquisition geometry and overburden conditions.
Analogously, in the case of CO2 injection, time-lapse tomography can be
used to evaluate the subtle changes due to the bubble expansion and possible
leakage. The pre-stack depth-migrated sections in depth can be subtracted to
evaluate the differences in terms of pressure and saturation. Furthermore, the
detection of gas-hydrates and free gas offshore Svalbard has shown that
poro-elastic modeling is essential to interpret the velocity changes.
REFERENCES
Arts, R., Chadwick, A., and Eiken, O., 2004, Recent time-lapse seismic data show no
indication of leakage at the Sleipner CO2-injection site, 7th
Conference on Greenhouse
Gas control Technologies, Vancouver, Canada, 5-9 Sept. 2004.
Bickel, S. H., 1990, Velocity-depth ambiguity of reflection traveltimes, Geophysics, 55:266-
276.
Biot, M. A., 1962, Mechanics of deformation and acoustic propagation in porous media.
Journal of Applied Physics 33:1482-1498.
Bishop, T., Bube, K., Cutler, R., Langan, R., Love, P., Resinik, J., Shuey, R., Spindler, D.,
and Wyld, H., 1985, Tomographic determination of velocity and depth in laterally varying
media, Geophysics 50:903-923.
Böhm, G., Camerlenghi, A., Lodolo, E., and Vesnaver, A., 1995, Tomographic analysis and
geological context of a bottom simulating reflector on the South Shetland Margin
(Antarctic Peninsula), Boll. Geof. Teor. Appl., 37:3-23.
Combined Seismic Methods for CO2 Monitoring 323
Carcione, J. M., 1998, Viscoelastic effective rheologies for modelling wave propagation in
porous media, Geophysical Prospecting 46:249-270.
Carcione, J. M., and Tinivella, U., 2001, The seismic response to overpressure: a modelling
study based on laboratory, well and seismic data., Geophysical Prospecting 49:523-539.
Carcione, J. M., Gei, D., Rossi, G. and Madrussani, G., 2005, Estimation of gas hydrate
concentraion and free-gas saturation at the Norvegian-Svalbard continental margin.
Geophysical Prospecting, accepted.
Delprat-Jannaud, F., and Lailly, P., 1992, Ill-posed and well-posed formulations of the
reflection traveltime tomography problem, J. Geophys. Res., 97(B13):19827-19844.
Docherty, P., 1992, Solving for the thickness and velocity of the weathering layer using 2-D
refraction tomography, Geophysics 57:1307-1318.
Ghaderi, A., and Landrø, M., 2004, Pre-stack estimation of time-lapse seismic velocity
changes- an example from the Sleipner CO2-sequestration project, 7th
Conference on
Greenhouse Gas control Technologies, Vancouver, Canada, 5-9 Sept. 2004.
Gei, D., and Carcione, J. M., 2003, Acoustic properties of sediments saturated with gas
hydrate, free gas and water, Geophysical Prospecting, 51:141-157.
Lines, L., 1993, Ambiguity in analysis of velocity and depth, Geophysics, 58:596-597.
Magesan, M., Depagne S., Nixon, K., Regel, B., Opich, J., Rogers, G. and Hudson, T., 2005,
Seismic processing for time-lapse study: Genesis field, Gulf of Mexico, The Leading
Edge, 364-373.
Tieman, H. J., 1994, Investigating the velocity-depth ambiguity of reflection traveltimes,
Geophysics, 59:1763-1773.
Tinivella, U., 1999, A method for estimating gas hydrate and free gas concentrations in
marine sediments, Boll. Geof. Teor. Appl., 40:19-30.
Vesnaver A. and Böhm G., 2000, Staggered or adapted grids for seismic tomography? The
Leading Edge 19:944-950.
Vesnaver, A. L., Accaino, F., Böhm, G., Madrussani, G., Pajchel, J., Rossi, G., and Dal Moro,
G., 2003, Time-lapse tomography, Geophysics 68:815-823.

PART V
THE WAY FORWARD
Our Future Dependancy on Fossil Fuels and Possible Approaches to
Make the Geological Storage of Carbon Dioxide a Viable Tool to Mitigate
Anthropogenic Greenhouse Gas Loading to the Atmosphere

THE ROLE OF FOSSIL FUELS IN THE 21ST
CENTURY
Energy Scenario and Climate Aspects
I. Lakatos and J. Lakatos-Szabó
Research Institute of Applied Chemistry, University of Miskolc, 3515 Miskolc-Egyetemváros
POB 2, Hungary
Abstract: According to a widely accepted forecast the global energy consumption, which
is roughly 400 EJ today, will quadruple by the end of the century and the use
of fossil fuels will probably increase until the middle of the century. Hence,
the energy scenario definitely implies that the emission of greenhouse gases
will also increase by a minimum 30%, leveling off at that value for the coming
decades. Unfortunately, a simplified idea is that the use of fossil fuels is solely
responsible for global warming, and hence climatic changes. Although the
anthropogenic impact on climate is represented by only 15% of carbon dioxide
emissions, this is the area where science and engineering can focus all efforts
to influence its detrimental effects. The small anthropogenic effect on climate,
however, clearly proves that the earth is extremely vulnerable to even
marginal changes in the atmosphere, hydrosphere and lithosphere.
Key words: energy scenario, fossil fuels, emission of greenhouse gases, global warming,
climate, emission trading, sequestration
1. INTRODUCTION
Using fossil fuels for energy produces enormous quantities of CO2 which
is transferred to the atmosphere. The fossil fuels, particularly coal, have been
and still are the workhorse of energy production. Replacing coal and oil by
natural gas can substantially reduce CO2 emissions, however unfortunately it
cannot eliminate it completely. Although the “clean energy” concept forms a
very important strategy for all nations, we must always keep in mind that
this effort has serious limitations. The forecasted energy scenario predicts
that CO2 emissions will increase by a minimum of 30%, leveling off at that
S. Lombardi et al. (eds.),
© 2006 Springer. Printed in the Netherlands.
327
Advances in the Geological Storage of Carbon Dioxide, 327–344.
328 Lakatos and Lakatos-Szabó
value for two or three decades in the first half of the century. The main
question now is how this increased emission will influence the climatic state
of the earth? The popular, simplified answer is that the use of fossil energy is
alone responsible for the rise of average temperatures, and hence climatic
changes. The real scientific fact is that natural factors contribute 96% of
climatic changes, while the effect of anthropogenic factors are marginal. As
far as the natural factors are concerned, water-induced processes are
responsible for 65% of the changes and the influence of CO2 in the
atmosphere is estimated to be less than 30%. In contrast, man-made energy
production represents only 15% of the total CO2 emissions, however it is
within this area where science and engineering can and must focus all efforts
to decrease CO2 emissions. For a better understanding of natural and
anthropogenic factors this paper analyses various aspects and consequences
of energy production based on fossil fuels, its possible effect on climate and
the actions that science, society and individuals must take to address this
problem.
2. ENERGY SCENARIOS: PAST, PRESENT AND
FUTURE
"Energy demand is expected to grow in the 21st century. The energy
demand will be met by a global energy mix that is undergoing a transition
from the current dominance of fossil fuels to a more balanced distribution of
energy sources. Motivation of energy diversification includes population
growth, quality of life, clean energy, resources/reserves. An understanding
of the energy options available to us in the 21st century requires an
understanding of a range of scientific theories. The scientific revolution will
be based on fundamental changes of old paradigms" - John R. Fanchi in
"Energy in the 21st Century", Gulf Professional Publisher, Austin (in print).
This quote not only strongly demonstrates the conceivable energy scenario,
but also the well-based prediction of the future role of crude oil and natural
gas production/consumption. The world energy demand was about 400 EJ
(1018
J) at the end of the last century (OECD, 2002; US-DOE, 2004) and the
share of hydrocarbons was roughly 60% (Fig. 1). A major part of the energy,
however, came from utilization of crude oil, which in itself represented
about 50%. That fact clearly demonstrates that the western world and the
highly developed countries are oil and gas dependent, and it is known that
this dependency is steeply increasing today. Thus, Europe and North
America are net hydrocarbon importers, with imports representing more than
60% of their oil and gas consumption.

The Role of Fossil Fuels in the 21st Century 329
According to various UN reports (UN-ESC, 1996; 2003) the present
global energy demand will quadruple assuming that the world population, in
an optimistic prediction, will be 8 billion at the end of the century (Fig. 2).
Since there is a close correlation between the quality of life index (Fig. 3)
and energy consumption (UN-ESC, 1996; 1998; 2003), which will also
likely increase from the present average value of 60 to 200 MJ/y per capita,
the total global energy demand will probably be 1,600 EJ (1018
J) in 2100
(UN-ESC, 1998).
1940 1950 1960 1970 1980 1990 2000
0
100
200
300
400
500
En
erg
y,10
18
J
Nuclear
Hydro
Gas
Oil
Coal
Wood
1650 1750 1800 1850 1900 1950 2000 2050 2100 2150 2200 2250 2300
0
10
20
30
40
Po
pu
lati
on
,109
Actual
Optimistic
Realistic
Pessimistic
Figure 1. Absolute contribution of different sources to energy production (1940-2000).
Figure 2. The actual and anticipated growth of world population between 1650 and 2300.

330 Lakatos and Lakatos-Szabó
Converging data have been reported by various organizations (OECD,
2002; US-DOE, 2004; BP, 2005; WEC, 1995; Al-Fattah and Starzman,
2000; Skov, 2003; Arscott, 2003; Holditch, 2003; SPE Review, 2004;
ExxonMobil, 2004; Shell, 2001) detailing the most probable diversification
of energy sources in the future (Fig. 4). Although the relative importance of
fossil fuels will apparently decrease, the stunning fact is that a total of 250-
260 billion t of crude oil (on average 2.5 billion t per year through the whole
century) must be produced to meet the world demand.
0
0.2
0.4
0.6
0.8
1
0 100 200 300 400 500 600 700 800
Energy consumption, million J/y/capita
Lif
e q
ua
lity
in
de
x
2000 2020 2040 2060 2080 2100
0
200
400
600
800
1000
1200
1400
1600
1800
En
erg
y,
10
18
J
Waste
Geotherm
Bio
Solar
Wind
Nuclear
Hydro
Gas
Oil
Coal
Wood
Figure 4. Absolute contribution of different sources to energy production (2000-2100).
Figure 3. Correlation between the quality of life quality index and the energy consumption.

The Role of Fossil Fuels in the 21st Century 331
This task is enormous if we consider that less than 100 billion t of crude
oil has been produced since 1850 and that the average production rate was
less than 0.7 billion t/y. As far as the reliable hydrocarbon supply is
concerned the real challenge we are faced with is that the available oil
reserves (proven and to be explored) amount to only 360-370 billion t.
Consequently, the world demand can only be met by the supply if the
recovery factor can be increased, on average, from 35% to 67%. Competent
professionals and agencies say that the recovery factor can be increased up
to 50% by improving existing reservoir engineering technology. Logically,
the gap between 50% and 67% can only be surmounted by the extensive use
of chemical IOR/EOR methods. The other option is that “dwindling supplies
of oil and gas, obsolete power net-works and new environmental regulations
threaten the Western world with a new energy crisis. Consequently, mankind
is becoming again vulnerable to shortages in hydrocarbons, price shocks,
supply interruptions, and in the worst case, political and military blackmail”,
Emerson T.: Newsweek, April 2002. Taking the hydrocarbon reserves and
production rates into account, it is also obvious that these countries are
dependent on sources from the Middle East which implies a global economic
and political dependency which will remain for the coming decades.
3. CONTRIBUTION OF FOSSIL FUELS TO CO2
EMISSIONS
Based on the energy scenario forecast to the end of the 21st century the
probable and necessary demand of fossil fuels can be calculated (BP, 2005;
WEC, 1995; Skov, 2003; ExxonMobil, 2004; Shell, 2001; US-DOE, 2005).
The absolute and relative contribution of coal, oil and gas to energy
production, per decade, are shown in Figs 5 and 6. The data in these
diagrams suggest that the global role of fossil fuels, in contrast to various
information in the world media, will increase until the middle of the century
and then decrease monotonously until 2100.
The stacked columns in Fig. 5, however, indicate that utilization of these
energy-bearing materials will represent at least 60-70% of the present
amount. Analyzing the structure of the forecasted demand it is predicted that
the relative contribution of coal and gas will reach a maximum (and oil a
minimum) in the forties and fifties, while their share will stabilize through
the last decades at 40-40% (coal and oil) and 20% (gas) (Fig. 6).
Technological improvements in the energy sector had already started
well before the Kyoto accord. Significant efforts have been made to increase
the efficiency of power stations and to decrease their air pollution. As far as
the utilization of fossil fuels is concerned oil, and later natural gas, have

332 Lakatos and Lakatos-Szabó
replaced enormous amounts of coal. Thus, the extensive use of oil and gas,
as a side effect, has also resulted in a substantial reduction in CO2 emissions,
since the average CO2 emission depends fundamentally on the type of fuel
used, be it coal (225 kg/MWh), oil (190 kg/MWh) or gas (128 kg/MWh).
2000 2010 2020 2030 2040 2050 2060 2070 2080 2090 2100
0
100
200
300
400
500
En
erg
y,1018
J/y
Gas
Oil
Coal
2000 2010 2020 2030 2040 2050 2060 2070 2080 2090 2100
0
20
40
60
80
100
Sh
are
,%
Gas
Oil
Coal
Thus the hydrocarbons became attractive not only technologically, but
also from an environmental point of view. Using these data and the
anticipated use of fossil fuels in the future, predicted CO2 emission rates can
Figure 6. Relative contribution of fossil fuels to energy production (2000-2100).
Figure 5. Absolute contribution of fossil fuels to energy production (2000-2100).

The Role of Fossil Fuels in the 21st Century 333
be calculated. The breakdown and summarized values of relative emissions
are shown in Figs 7 and 8. As shown in Fig. 7 the CO2 emissions from the
use of oil and other liquid hydrocarbons will gradually decrease by about
50% until 2050, after which it will remain constant. A more extensive use of
natural gas and coal, however, will unfavourably influence the CO2 content
of the atmosphere. A decreasing trend in CO2 emissions can be expected
only in the second half of the century (Fig. 8). This fact contradicts
expectations of many environmental and “green” organizations that are
looking forward to a substantial reduction of CO2 emissions in the near
future.
2000 2010 2020 2030 2040 2050 2060 2070 2080 2090 2100
0
100
200
300
400
Re
lati
ve
ch
an
ge
,%
Oil
Coal
Gas
2
2000 2010 2020 2030 2040 2050 2060 2070 2080 2090 2100
0
30
60
90
120
150
Re
lati
ve
ch
an
ge,
%
Figure 8. Summarized relative CO2 emissions from fossil fuels used for energy production
Figure 7. Relative CO emissions of fossil fuels used for energy production (2000-2100).
(2000-2100).

334 Lakatos and Lakatos-Szabó
4. OVERVIEW OF GLOBAL CO2 EMISSIONS
CO2 emissions alone increased from 4 Gt/y to more than 10 Gt/y between
1970 and 2003 (ExxonMobil, 2004). The discrepancy in emissions of CO2
and greenhouse gases can be analysed from different points of view. The
Kyoto accord imposes limited or “capped” quotas on each country, taking
special circumstances into account. As the natural, economic, industrial and
even historical conditions of the nations are significantly different so are the
absolute and relative CO2 emissions. For instance, a surprising conclusion
can be drawn from the data in Fig. 9, where specific CO2 emissions are
shown for several regions and countries. According to these data the Gulf
countries are the biggest per-capita emitters, while the highly developed
countries, like the USA, Germany, etc., rank lower on the list. Obviously,
the sequence of countries can be explained by the fact that the energy
demand rapidly increases in the OPEC countries and the energy is solely
produced from hydrocarbons.
Qatar
Bahrein
UAE
Kuvait
USA
Canada
Saudi-A
Finland
Holland
Germany
Russia
Hungary
0
10
20
30
40
50
Em
iss
ion
,t/
y/c
ap
ita
2
In the media we may more frequently observe the data presented in Fig.
10. Since the absolute output of CO2 is population dependent, the USA is by
far the biggest emitter, having a share of roughly 30% of the global CO2
emissions annually (US-DOE, 2004; 2005). Although the government of the
USA defends its decision not to sign the Kyoto accord claiming a similar
CO2 absorption (i.e. zero release), this explanation is not widely accepted
yet. Consequently, environmental agencies are supporting efforts to find and
use alternative energy sources, instead of fossil fuels. In 2002 a remarkable
Figure 9. Absolute CO emission per capita in several countries.
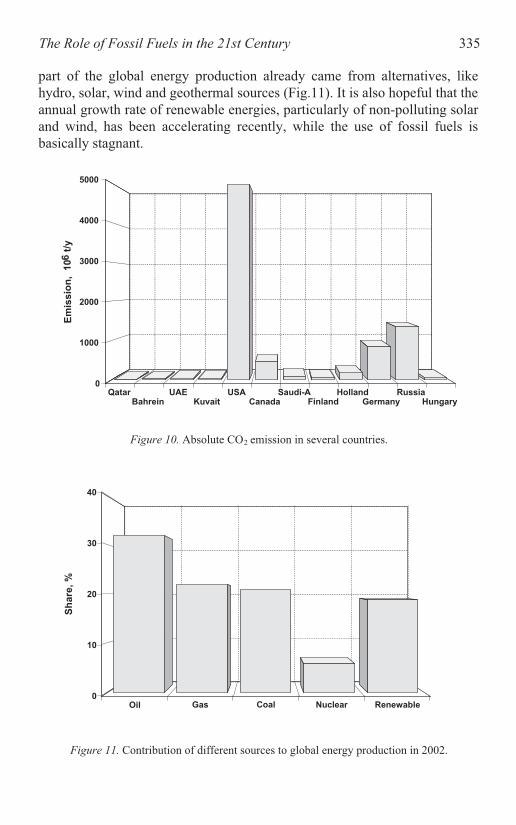
The Role of Fossil Fuels in the 21st Century 335
part of the global energy production already came from alternatives, like
hydro, solar, wind and geothermal sources (Fig.11). It is also hopeful that the
annual growth rate of renewable energies, particularly of non-polluting solar
and wind, has been accelerating recently, while the use of fossil fuels is
basically stagnant.
Qatar
Bahrein
UAE
Kuvait
USA
Canada
Saudi-A
Finland
Holland
Germany
Russia
Hungary
0
1000
2000
3000
4000
5000
Em
iss
ion
,1
06
t/y
2
Oil Gas Coal Nuclear Renewable
0
10
20
30
40
Sh
are,
%
Figure 10. Absolute CO emission in several countries.
Figure 11. Contribution of different sources to global energy production in 2002.
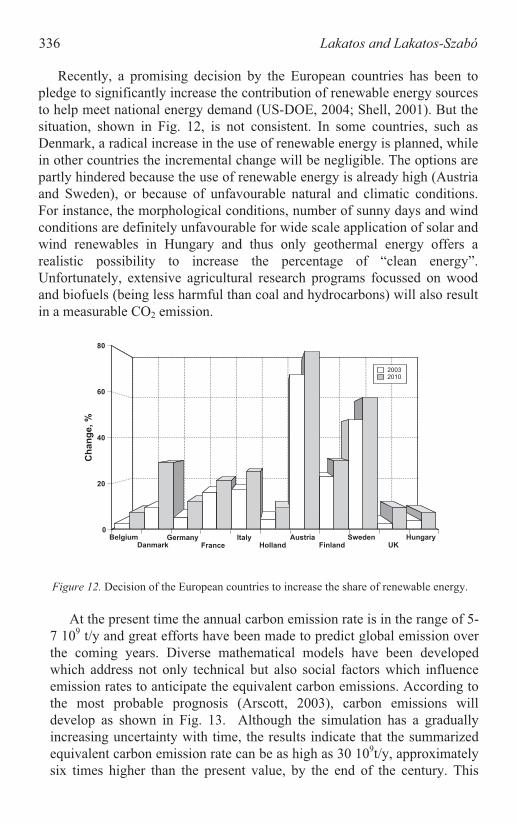
336 Lakatos and Lakatos-Szabó
Recently, a promising decision by the European countries has been to
pledge to significantly increase the contribution of renewable energy sources
to help meet national energy demand (US-DOE, 2004; Shell, 2001). But the
situation, shown in Fig. 12, is not consistent. In some countries, such as
Denmark, a radical increase in the use of renewable energy is planned, while
in other countries the incremental change will be negligible. The options are
partly hindered because the use of renewable energy is already high (Austria
and Sweden), or because of unfavourable natural and climatic conditions.
For instance, the morphological conditions, number of sunny days and wind
conditions are definitely unfavourable for wide scale application of solar and
wind renewables in Hungary and thus only geothermal energy offers a
realistic possibility to increase the percentage of “clean energy”.
Unfortunately, extensive agricultural research programs focussed on wood
and biofuels (being less harmful than coal and hydrocarbons) will also result
in a measurable CO2 emission.
Belgium
Danmark
Germany
France
Italy
Holland
Austria
Finland
Sweden
UK
Hungary
0
20
40
60
80
Ch
an
ge
,%
2003
2010
At the present time the annual carbon emission rate is in the range of 5-
7 109 t/y and great efforts have been made to predict global emission over
the coming years. Diverse mathematical models have been developed
which address not only technical but also social factors which influence
emission rates to anticipate the equivalent carbon emissions. According to
the most probable prognosis (Arscott, 2003), carbon emissions will
develop as shown in Fig. 13. Although the simulation has a gradually
increasing uncertainty with time, the results indicate that the summarized
equivalent carbon emission rate can be as high as 30 109t/y, approximately
six times higher than the present value, by the end of the century. This
Figure 12. Decision of the European countries to increase the share of renewable energy.
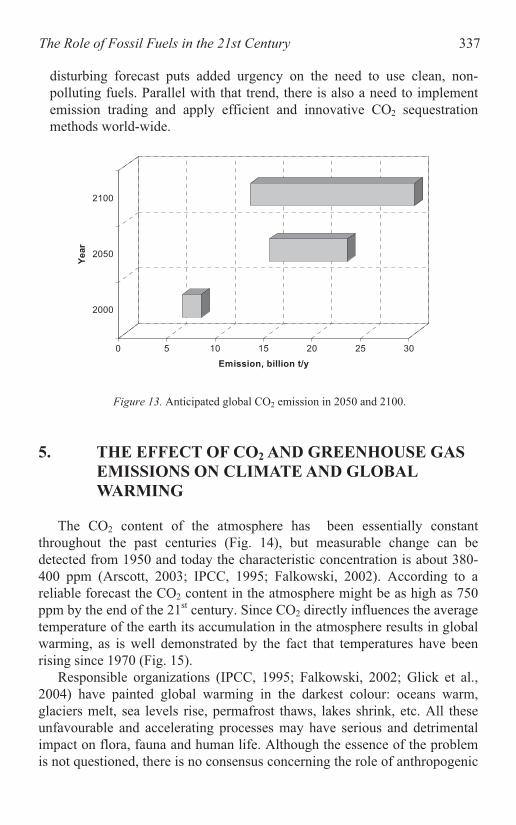
The Role of Fossil Fuels in the 21st Century 337
disturbing forecast puts added urgency on the need to use clean, non-
polluting fuels. Parallel with that trend, there is also a need to implement
emission trading and apply efficient and innovative CO2 sequestration
methods world-wide.
0 5 10 15 20 25 30
Emission, billion t/y
2000
2050
2100
Year
2
5. THE EFFECT OF CO2 AND GREENHOUSE GAS
EMISSIONS ON CLIMATE AND GLOBAL
WARMING
The CO2 content of the atmosphere has been essentially constant
throughout the past centuries (Fig. 14), but measurable change can be
detected from 1950 and today the characteristic concentration is about 380-
400 ppm (Arscott, 2003; IPCC, 1995; Falkowski, 2002). According to a
reliable forecast the CO2 content in the atmosphere might be as high as 750
ppm by the end of the 21st century. Since CO2 directly influences the average
temperature of the earth its accumulation in the atmosphere results in global
warming, as is well demonstrated by the fact that temperatures have been
rising since 1970 (Fig. 15).
Responsible organizations (IPCC, 1995; Falkowski, 2002; Glick et al.,
2004) have painted global warming in the darkest colour: oceans warm,
glaciers melt, sea levels rise, permafrost thaws, lakes shrink, etc. All these
unfavourable and accelerating processes may have serious and detrimental
impact on flora, fauna and human life. Although the essence of the problem
is not questioned, there is no consensus concerning the role of anthropogenic
Figure 13. Anticipated global CO emission in 2050 and 2100.

338 Lakatos and Lakatos-Szabó
factors. Opponents of the anthropogenic factors usually refer to the
distribution of CO2 on earth. It is a fact that only 2% of the total amount of
CO2 is found in the atmosphere, while the majority (93%) is absorbed in the
hydrosphere (particularly in the deep ocean water) (Ónodi, 2003). Hence, the
anthropogenic influence may have a negligible effect on CO2 equilibrium, or
in other words, any positive or negative man-made interference in water,
CO2 and other gases might have only limited impact on natural processes
and climate.
1400 1500 1600 1700 1800 1900 1950 2000 2100
0
200
400
600
800
Co
nc
en
tra
tio
n,
pp
m
1860 1870 1880 1890 1900 1910 1920 1930 1940 1950 1960 1970 1980 1990
-0.4
-0.2
0
0.2
0.4
Re
lati
ve
ch
an
ge
,o
C
Figure 14. Concentration of carbon dioxide in the atmosphere.
Figure 15. Deviation from average temperature on earth (basis: 1950-1970).
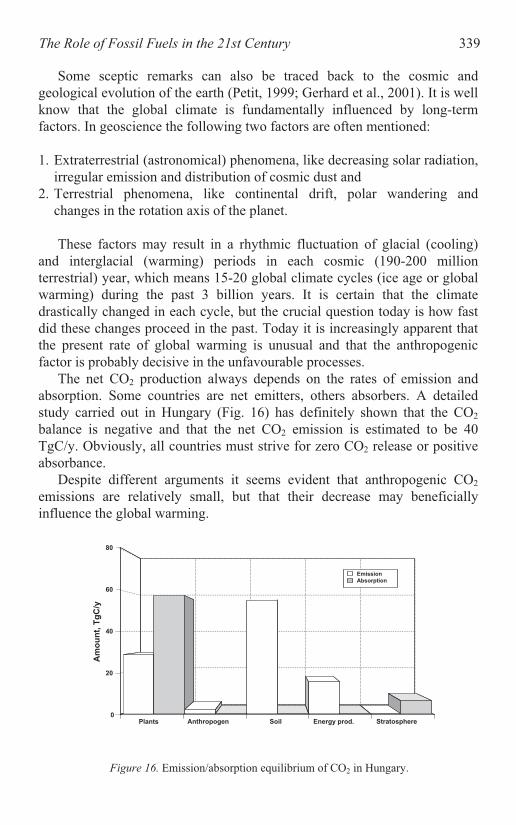
The Role of Fossil Fuels in the 21st Century 339
Some sceptic remarks can also be traced back to the cosmic and
geological evolution of the earth (Petit, 1999; Gerhard et al., 2001). It is well
know that the global climate is fundamentally influenced by long-term
factors. In geoscience the following two factors are often mentioned:
1. Extraterrestrial (astronomical) phenomena, like decreasing solar radiation,
irregular emission and distribution of cosmic dust and
2. Terrestrial phenomena, like continental drift, polar wandering and
changes in the rotation axis of the planet.
These factors may result in a rhythmic fluctuation of glacial (cooling)
and interglacial (warming) periods in each cosmic (190-200 million
terrestrial) year, which means 15-20 global climate cycles (ice age or global
warming) during the past 3 billion years. It is certain that the climate
drastically changed in each cycle, but the crucial question today is how fast
did these changes proceed in the past. Today it is increasingly apparent that
the present rate of global warming is unusual and that the anthropogenic
factor is probably decisive in the unfavourable processes.
The net CO2 production always depends on the rates of emission and
absorption. Some countries are net emitters, others absorbers. A detailed
study carried out in Hungary (Fig. 16) has definitely shown that the CO2
balance is negative and that the net CO2 emission is estimated to be 40
TgC/y. Obviously, all countries must strive for zero CO2 release or positive
absorbance.
Despite different arguments it seems evident that anthropogenic CO2
emissions are relatively small, but that their decrease may beneficially
influence the global warming.
Plants Anthropogen Soil Energy prod. Stratosphere
0
20
40
60
80
Am
ou
nt,
Tg
C/y
Emission
Absorption
2Figure 16. Emission/absorption equilibrium of CO in Hungary.

340 Lakatos and Lakatos-Szabó
6. TRADE OF GREENHOUSE GAS EMISSIONS
The Kyoto accord took effect in the last week of January, 2005, with new
obligations to reduce the emission of CO2 and other greenhouse gases
(OECD, 2002). The countries signing the accord have a firm commitment to
reduce emissions by 5.3%, on average, below those of 1990. Unfortunately,
the accord had not been signed by a number of countries, including the USA,
Australia and the majority of Middle Eastern and African countries. The
principle of the accord is that the total carbon emissions in the ratifying
countries are limited (capped) at a fixed level and those nations assign a
number of CO2 and greenhouse gas allowances (1 allowance = 106 t
equivalent carbon emission) to their major carbon emitting sectors. The
participating countries usually offered to reduce emissions by more than
5.3% (8% on average) until 2012. The present situation, however, is a little
controversial. In 2002 some countries seem to have significantly exceeded
the target, while others have not decreased rates, but rather have produced
much higher emissions than in 1990 (Fig. 17). Therefore, the accord makes
it possible to trade emissions between countries and companies. In other
words, the countries that have unused allowances may sell them, while those
that have excess carbon emissions must buy allowances.
Spain
Ireland
AUS
CAN
USA
Japan
Finland
Belgium
Switzer.
France
Sweden
Iceland
UK
GER
Czech
HU
Russia
Bulgaria
Litvania
-80
-60
-40
-20
0
20
40
Re
lati
ve
ch
an
ge
,o
C
Figure 17. Present greenhouse gas emissions of different countries compared to the level in
Emission trading is just getting under way and it might be very
significant in the future (Bird, 2005). Although only a short time has passed,
the financial conditions of emission trading have taken shape and the
following average data characterize the present situation:
1990.

The Role of Fossil Fuels in the 21st Century 341
Price : 7 €/ allowance
Selling unit : 5,000 allowances
Transaction : 10,000-20,000 allowances
Weekly volume : 10 million $
The recent trade volumes and the market are still small but they are
growing rapidly , and so is the price of an allowance, as the accord took
effect. Society has high hopes for emission trading and the Kyoto accord,
but some scepticism can also be met. Summarizing the pros and cons, the
following arguments can be listed:
Benefits:
1. the accord and emission trading imposes sanctions against the major CO2
emitting sectors,
2. it encourages the reduction of greenhouse gases emission and
3. it urges the building of clean energy facilities.
Drawbacks:
1. the sanctions do not stop greenhouse emissions,
2. positive discrimination does not encourage technological improvements in
those sectors that benefit from emission trading and
3. the new actions do not stop or decrease the concentration of CO2 and
greenhouse gas in the atmosphere.
Thus, parallel with the proposals of the Kyoto accord and emission
trading it is fundamental to search for efficient actions and technologies
which will provide economic and environmentally-friendly solutions to
increase CO2 and greenhouse-gas absorption and removal from the
atmosphere (Orr, 2004). Such options might include:
1. prohibition of clear-cutting and burning of rainforests,
2. planting of more coniferous and deciduous forests world-wide, and
3. sequestration of CO2 and other greenhouse gases in geological
formations, including injection into oil reservoirs, gas-tight underground
storage facilities, coal seams and permafrost formations as gas hydrates.
The present decision-makers and stake-holders (scientists, engineers,
politicians etc.) cannot shift the responsibility of safeguarding our blue
planet and the life of future generations onto somebody else. The apparent
anthropogenic effect on climate clearly proves that the earth is extremely
vulnerable to even marginal changes in the atmosphere, hydrosphere and
lithosphere. Therefore, all efforts to diminish man-made influence are of

342 Lakatos and Lakatos-Szabó
vital importance for future generations. The time is short, the task is
tremendous, but integrating efforts will allow the main goals to be fulfilled.
7. CONCLUSIONS
1. Fossil fuels will remain important elements of the energy scenario in the
21st century;
2. Emission of CO2 and other greenhouse gases will increase until the
middle of the century;
3. Diversification of energy sources using renewable energy is fundamental;
4. Replace fossil fuels with biomaterials, fusion and hydrogen energy;
5. Geological evidence shows that levels of CO2 and other greenhouse gases
have remained relatively stable on Earth for the past thousand years;
6. The natural and unnatural increase of greenhouse gases may cause global
warming on earth;
7. Climate fluctuates naturally between warm and cool periods. Some
researchers say that the 21st century has seen the greatest warming in at
least a thousand years, and natural forces can’t account for it all;
8. Solid evidence for greenhouse warming has not yet been found, but there
is an agreement that CO2 concentration in the atmosphere is increasing.
However, there is no real consensus yet that this is responsible alone for
global warming;
9. Despite different arguments it seems evident that anthropogenic CO2
emissions are relatively small, but their decrease may beneficially
influence global warming;
10.The apparent anthropogenic effect on climate clearly proves that the earth
is extremely vulnerable to even marginal changes in the atmosphere,
hydrosphere and lithosphere. Therefore, all efforts to diminish man-made
influences are of vital importance for future generations;
11.Emission trading and sequestration of CO2 and greenhouse gases have
priority in the coming decades.
12.International cooperation is necessary to develop efficient, economic and
environmentally-friendly methods, technologies and solutions to reduce
emissions of CO2 and other greenhouse gases and to diminish their
concentration in the atmosphere.

The Role of Fossil Fuels in the 21st Century 343
ACKNOWLEDGEMENTS
The authors wish to express their appreciation to the Hungarian Science
Foundation for their financial support within the framework of the OTKA
T034108 and OTKA T047342 projects.
REFERENCES
Al-Fattah, S. M., and Starzman, R. A., 2000 Forecasting World Natural Gas Supply, J. Pet.
Arscott, L., 2003, Sustainable Development in the Oil and Gas Industry, J. Pet. Eng., pp. 60,
Glick, D., Montaigne, F., and Morell, V. 2004, Signs from Earth, National Geographic
Ónodi, T., 2003, Doubts towards the effect of greenhouse gases”, (in Hungarian), K olaj és
Petit, J. R., 1999, Climate and atmospheric history of the past 420,00 years from the vostok
Shell, 2001, Energy Needs, Choices and Possibilities: Scenario to 2005, Shell International
SPE Review, 2004,
UN-ESC, 1996, Energy and Sustainable Developments: Developments of Energy Resources
UN-ESC, 1998, Concise Report on World Population Monitoring, 1999: Population Growth,
Structure and Distribution, Economic and Social Council, United Nations, Report
UN-ESC, 2003, Concise Report on World Population Monitoring, 2003: Population,
Education and Distribution, Economic and Social Council, United Nations, Report
US-DOE, 2004, International Energy Outlook, 2004, Energy Information Administration, US
Eng., pp. 62, May (2000).
August (2003).
Bird, M., 2005, Emission Impossible?, Time, 165:8, pp. 40 (2005).
BP, 2005, BP Statistical Review of Word Energy, 2005, British Petroleum, June (2005).
Gerhard, L. C., Harrison, W. E., and Hanson, B. M., 2001, Geological perspectives of global
ExxonMobil, 2004, The Outlook for Energy: A 2003 View, ExxonMobil Report (2004).
Holditch, S. A., 2003, The Increasing Role of Unconventional Reservoirs in the Future of the
Falkowski, P. G., 2002 Climate Regulators, Scientific American, 8:56 (2002).
climate change, AAPG Studies in Geology, Report 48 (2001).
Magazine, pp. 15, September (2004).
Oil and Gas Business, pp. 34, November (2003).
IPCC, 1995, Temperatures 1856-199. Climatic Research Unit, IPCC Report 95 (1995).
Orr, F. M., 2004, Storage of Carbon Dioxide in Geologic Formations, J. Pet. Eng., pp. 90,
OECD, 2002, World Energy Outlook, International Energy Agency, OECD, Paris.
Földgáz (Hungarian Oil and Gas Journal), 136:10, 119 (2003).
September (2004).
ice cCore in Antartica, Nature, June (1999).
Report (2001).
Skov, A. M., World Energy Beyond 2050, J. Pet. Eng., pp. 34, January (2003).
in the Developing Countries, Economic and Social Council, United Nations, Report
Rising to the Environmental Challenge, 176:6-8 (2004).
E/C.13/1996/3, January (1996).
E/CN.9/1999/2, December (1998).
E/CN.9/2003/2, January (2003).
Department of Energy, Report: DOE/EIA-0484 (2004).

344 Lakatos and Lakatos-Szabó
US-DOE, 2005, International Total Primary Energy and Related Information – Primary
Energy Production (Supply) and Carbon Dioxide Emissions, Energy Information
WEC, 1995, Global Energy Perspectives to 2050 and Beyond, World Energy Council (WEC),
Administration, US Department of Energy, June (2005).
International Institute of Applied System Analysis, London (1995).
STAKEHOLDER ACCEPTANCE AND
UNDERSTANDING OF CO2 GEOLOGICAL
STORAGE
S. Vercelli and R. Tambelli
Dipt. di Psicologia dinamica e clinica; Università di Roma “La Sapienza”, Rome, Italy
Abstract: CO2 geological storage constitutes a relatively recent scientific technology
which could play a major role for the solution of global warming. More
research is needed, however at the same time already-available scientific
knowledge has scarcely been disseminated. Thus researchers who work in this
area are faced with two main problems: 1) get their work to be known and its
relevance understood also outside research and academic circles 2) avoid
possible misconceptions in the understanding of their research, which could
result in negative reactions in public opinion and consequently to the refusal of
geological storage. This contribution addresses the need to spread knowledge
and make this technology better known for the exploitation of its potentialities.
Methodological questions about effective dissemination are dealt with. A
psycho-sociological approach is presented and discussed, focusing on: 1) how
to develop in the public a positive attitude and interest for learning about
geological storage; and 2) how to develop in the public a correct
understanding of what geological storage is. This kind of approach works on
both the cognitive and emotional levels, beginning with the scientists’
representations of their own work and followed by studying the interactions
people can develop when coming in contact with a new topic, what kind of
reactions are stimulated and how they can be understood depending on
specific social contexts, etc. Language study and image issues are explored
with specific reference to geological research. Based on Italian experiences for
geological research dissemination the role of cultural contexts and psycho-
social representations are illustrated. The importance of the analysis of
emotional processes is explained. The role of information, communication,
storage sites’ image and social context in relation to stakeholders decisions is
analysed. A possible proactive image strategy is outlined.
Key words: geological storage, climate change, carbon dioxide, scientific dissemination,
stakeholders, psychosocial representations, cultural models
345
S. Lombardi et al. (eds.),
Advances in the Geological Storage of Carbon Dioxide, 345–357.
© 2006 Springer. Printed in the Netherlands.

346 Vercelli and Tambelli
1. INTRODUCTION
The environment we live in keeps changing all the time. As human
beings we participate in this change, trying to understand it, sometimes
trying to influence it. We try to understand what happens in the air, on the
earth, inside the earth, in the universe. We try to create better environmental
conditions, modifying natural features, using our imagination to make the
earth a better place to live on. We have to adapt to environment changes, but
we are also agents of change.
Change, though, can take unpredictable directions, which sometimes
force us to recognise that our influence on natural environment, instead of
being beneficial, can become dangerous for our own species.
In 1963 there was a terrible disaster up in the mountains of Lavarone, in
the north of Italy. A large piece of the mountain detached itself, fell into the
waters of the Vajont dam reservoir, which was a piece of high engineering
skill. The water was displaced and flooded the villages in the valley below,
causing the death of thousands of people. It was a shock, and we didn’t
know that it was just one of many disasters still to come due to an unhappy
interaction between natural phenomena and man’s work. After so many
years the dam is still there, empty, useless, perfect in its technological
beauty, reminding us how delicate the environmental balance is and how
dependent we are, for our life and well being, on the maintenance of its
equilibrium.
But the impact of man’s work is not always so evident. It can be much
more difficult and complex to explain the controlling factors, in human-
nature interaction, that can produce negative effects on the environmental
balance. A lot of work is being done to precisely evaluate the consequences
of our decisions regarding development and the growing need for energy
production, but how much of this work comes to be known, how much of
this work is really understood outside academic circles?
When the issues are so complex, as is the case for climate change,
scientific communication and dissemination is a particularly delicate matter.
CO2 geological storage (CO2GC) is part of this conceptual context, a context
in which it is becoming more and more difficult for common people to
understand what’s going on and what we should do to avoid being ourselves
the cause of major natural catastrophes.
The present paper aims to contribute to the understanding of the issues
that have to be considered when communicating such complex subjects.

2 347
2. CO2GS: THEMES AND QUESTIONS
When introducing the subject of CO2 geological storage numerous other
complex and socially-important issues immediately come up.
First of all, CO2 excess is a world-wide problem and thus it needs to be
addressed globally. This is not easy, not only because it is a long and
difficult task to find an agreement among all countries, but also because we
are just beginning to learn how to face problems that involve a global
context. The number of factors which need to be taken into account is great
and local policies are no longer local, but rather they get their meaning in
relation to many other local policies. If we are dealing with a world problem,
how can a “world – scale way of thinking” be developed?
Another major and extremely complex theme is energy production: fossil
fuels, nuclear power, renewables, etc. (each with its different advantages and
disadvantages) have social, environmental, economic features and costs that
form the context within which CO2GS is going to be evaluated (Shackley et
al., 2004). How is CO2GS to be considered in relation to the general energy
situation? What kind of solutions can it offer? How can it help? From the
economic point of view, what are the costs to implement this technology and
how do they compare to those of other technologies?
People, and especially stakeholders, need to learn about CO2GS, to be
able to decide on its potential and because public collaboration is needed for
its implementation. In this respect there are a number of concepts that are
crucial for a correct understanding. They need to be studied not only to find
scientific information, but also to outline the kind of relationship we feel
with them. For example, what is CO2, what has it come to mean, what is
geological storage, how does one imagine it, and how is the effect on the
earth (or with a particular territory) felt and characterized?
With some differences among the various countries, some of which are
moving forward more quickly than others, the present situation is a
preliminary phase to the possible adoption of CO2GS as a mean for the
reduction of excess CO2 in the atmosphere.
Any decision regarding energy issues will have an enormous impact on
society in terms of quality of life and well – being, economic costs and
profits, environmental exploitation and protection, social safety and risks,
etc.. Thus it is socially very relevant that complete and correct information is
available on the various technological opportunities in order to help take
decisions. At the same time all the different social groups, with their specific
requests, need to enter into the learning process to be able to participate in
the decision-making process (Shackley et al., 2004).
The type of information requested on CO2GS will vary in relation to the
needs of different social subjects. For example environmentalists and citizen
Stakeholder Acceptance and Understanding of CO Geological Storage
348
associations will probably be more interested in safety and health-related
issues, politicians to costs and implementation times and plans, industries to
costs and advantages such as incentives, and local administrators to control
and monitoring of sites, etc.
3. WHY A COMMUNICATION STRATEGY IS
NEEDED
CO2 geological storage is a relatively new technology which is still very
little known by the public at large. In the United States just 4% of the
population seems to have heard about CO2GS (Curry et al., 2004). We don’t
have data for Europe but probably the situation is similar. At the same time,
however, CO2GS is believed to be quite a crucial technology for the
reduction of excess CO2 in the atmosphere.
CO2 production is expected to increase globally in the future. Newly
industrialised countries, such as China, are expected to further contribute to
a situation that many observers already consider very dangerous for the
earth’s health and for our well – being. There is a lot of debate on how to
deal with this very serious health and environmental issue, but one point
seems to be clear: CO2 emissions need to be controlled and reduced.
To reduce emissions we must find, improve or increase new ways of
energy production that do not result in massive CO2 production. In the
intervening time, during which the new technologies will be developed, we
must do all we can to deal with CO2 that is still being produced through the
use of fossil fuels. It is here that CO2GS comes to be regarded as a safe
technology that can potentially have a major role in avoiding the release of
large quantities of CO2 from present technologies into the atmosphere.
We have a problem, CO2 excess, and we have a potential partial solution
to that problem in the form of CO2GS. What is needed to implement this
solution and thus improve the overall situation of CO2 in the atmosphere?
Certainly more research is needed, more studies need to be done on how this
technology can best be implemented, on where and how storage sites must
be constructed, how they must be monitored and how local populations are
to be involved in site selection and implementation. We need technical,
legal, economic, and socio – psychological guidelines to be able to facilitate
a wide exploitation of this technology (de Conink and Huijts, 2004). But
what is probably needed more at this stage is that this technology is better
known and understood, both by the public at large and by decision-makers
dealing with the problem of excess CO2.
A correct dissemination of information on CO2GS issues is fundamental
for the promotion of social support and funding, which are both essential for
Vercelli and Tambelli

349
further development and exploitation of this technology. Making CO2GS
better known means:
positioning it in the minds of the public as one available option for
reducing CO2. At the moment most people don’t even know about the
existence of CO2GS, therefore it can hardly be considered an option.
Furthermore, one has to take care that people get acquainted with the
new technology through positive and correct information.
facilitating communication with stakeholders. Stakeholders would
find it very difficult to make decisions concerning a technology that is
very little known, and therefore implies the risk of a lack of consensus.
Clear and tested guidelines can greatly facilitate becoming familiar with
the technology and taking appropriate decisions.
facilitating communication with the public living near potential sites.
Public consensus is a decisive factor for the construction of new sites.
The exploration of the demands and needs of people living near a
potential site is required. It is of no use to develop sophisticated
technologies if one cannot find a place to put them because people don’t
know how to evaluate them, and therefore are afraid and don’t want
them. Getting people to know what CO2GS is all about must then be a
major goal of any policy regarding CO2GS (Bradbury and Dooley,
2004).
4. STAKEHOLDERS
When we consider the problem of social acceptance we must be careful
to take into account any social agency that could be concerned with our
problem. In this respect “stakeholders” is a key concept.
What do we mean by stakeholders? In general they can be thought of as
those people who have an interest in a particular decision, either as
individuals or as representatives of a group of people. This includes people
who influence a decision, or can influence it, as well as those who are
affected by it. In other words any social group which is directly or indirectly
involved with the matter can be viewed as a stakeholder, such as all people
living in a site area, all people concerned with environmental issues, all
people working in the energy field, all people living in large polluted cities,
etc. This way to define stakeholders permits us to take into consideration the
various components that contribute to the formation of public opinion and,
even more importantly, to avoid neglect of such factors which could arise
should our subject strike any sensitive topics in the public. What we mean is
that strong reactions can sometimes be elicited and action be taken by
previously unknown and unconsidered social groups. It is important to be
2Stakeholder Acceptance and Understanding of CO Geological Storage

350
able to anticipate whether a certain subject could cause particular reactions
in the public, in people who are not usually active in taking decisions. Social
decisional processes are quite complex and being able to understand the
factors which could have a determining influence is greatly facilitating.
Let us consider an example. Recently in Italy it was possible to observe
what can happen when stakeholders (in its broadest sense) are not taken into
account and thus are not consulted, informed or prepared. In Scanzano,
Basilicata, the government had decided to create a dangerous-waste disposal
landfill in a site which was considered very safe from a scientific point of
view. Unfortunately the local public had not been consulted and no one
suspected that a very strong feeling against this waste disposal could arise.
In fact, the reaction was so strong that the entire population in the region was
actively involved, and for weeks the main roads and railway lines were
blocked (with many people sleeping under the stars) until the government
had to finally change its decision. What had happened? The area is still a
rather well-preserved, uncontaminated region with beautiful landscape,
where tourism is expected to increase, and has recently seen the substantial
development of organic agriculture. The development potential of this area
therefore relies on it being a clean environment. Radioactive waste disposal,
even the disposal of low level radioactive waste (such as medical and
radiological waste), did not fit with the idea of the local population as how to
preserve a clean environment. It was felt that the central government was
just interested in discharging at this site something “they didn’t know where
to put”. One can easily understand why this waste disposal site had then
come to be considered as such a life threatening issue.
A more common definition for stakeholders is all those social agencies
that, in one way or another, have a recognised power to decide or to
influence decisions regarding a certain subject, such as local or central
administrators, politicians, environmental associations, citizens’
associations, scientific centres, etc.. In an even more restricted meaning we
can also consider the so called “opinion makers” to be stakeholders, such as
specialised journalists, eminent scientists or writers, singers or actors etc.
5. CONSENSUS
Social consensus is a crucial issue for research development and
application. It is easily understandable that the greater the interest and the
approval a population holds for a certain research domain, the higher the
possibilities that that research will be supported. This support will manifest
itself not only through research funding, but also in the processes that
concern the research being carried out and applied.
Vercelli and Tambelli

351
Social consensus for research can very often not be an explicit issue. To
get an idea of its importance, one can think about television programs
organised to raise funds for medical research into particular, and sometimes
very rare, illnesses. Looking at one of this programs one can easily
understand that the fact that most people feel involved with the researcher’s
goals makes it possible to raise quite large sums of money, while at the same
time ever increasing the interest of people for this kind of research.
It can be quite interesting to reflect on this striking observation: a
population’s health depends greatly on a safe and clean environment, having
clean air to breathe, clean water to drink, good shelter and so on; we also
know that the incidence of many illnesses is reduced by living in a healthy
environment. Nevertheless it is much easier for the general public to get
concerned and involved over certain specific illnesses rather than over issues
that can have a much greater influence for the health of entire populations,
not to say for the entire global population.
Climate changes can adversely affect the life of millions of people. But to
date we haven’t seen any television shows raising funds for research on this
very subject. How can we understand the scarce involvement and activation
level towards issues that can have a massive impact on the public’s well –
being? Is there a correct distribution of resources with respect to the relative
importance of the various problems? From this simple example one can
realize the fundamental role of social consensus and its relevance for the
development of different scientific domains.
Social consensus can be regarded as an expression of the level at which
research goals are shared and understood. That is, there are both an
emotional and a cognitive side to the building of consensus.
6. STUDY OF THE IMAGE OF CO2GS
CO2GS is presently very little known by the public at large, and thus we
have the opportunity to work on its potential image to facilitate its
understanding and acceptance. Working on the image implies the
identification of the core aspects that qualify a certain subject and the
The image of a given subject is formed both on available information and
on the attitude that the object stimulates in the receiver. The first response
of the receiver to the image subject can be positive or negative, depending
on the feeling and the affective encoding that will be activated. It is very
important to get a positive reaction when first contact with the subject takes
place. A positive reaction opens the way to further communication, to the
demand for more information, to the gradual construction of a relation with
communication goals to be pursued. (Vercelli, 1989).
2Stakeholder Acceptance and Understanding of CO Geological Storage

352
the subject that can evolve in time. To summarise we could describe the
positive attitude as “tell me more”.
On the other hand, if the first reaction is negative, it will be very difficult
to change it, as a negative reaction is bound to activate defences toward
something which is regarded as inimical. If the first feeling when coming in
contact with the given subject is unpleasant, then any further information
might not be taken into account. Thus we could describe the negative
attitude as “I’m not interested”.
So, the first and fundamental goal is to find a formula to present our
subject in such a way that the majority of people will react wanting to know
more.
Our message should be:
Easy: anybody can feel involved
Simple: anybody can understand (language).
As we said before the matter we are working on is particularly complex
and relatively unknown by the majority of people. At present we can study
the image of CO2GS in the scientific community, looking at some
stakeholders which have already been involved (like some environmentalist
associations) in those areas where it has already been implemented and in
the natural analogues areas . This kind of work will enable us to identify the
core aspects that characterise CO2GS with respect to the way people think
and feel about it.
At the same time, the fact itself of conducting this kind of study provides
a new context within which the feelings and thoughts related to CO2GS enter
into a process of psycho-social elaboration.
7. PSYCHO-SOCIAL REPRESENTATIONS
7.1 Thinking
When first contact with a new concept or area of knowledge takes place,
a process begins which involves the integration of the new information in a
pre–existing cognitive network. Previous knowledge, its type and
complexity, interacts with the new concepts or data. Depending on the
already-assimilated information it can be more or less difficult to understand
the new concepts. For example, if I have some knowledge about the earth,
how it is constituted, what are the physics of the subsurface, I have a
cognitive basis within which geological storage can fit. In the same way
people who are used to the scientific approach will have a different
comprehension from people who have another cultural background, etc..
Vercelli and Tambelli

353
Language is also a central issue. It plays an important role in making new
knowledge more or less understandable. Terms that are new or particularly
relevant require a clear and simple definition. In particular when non–
technical stakeholders need to be involved it can be quite crucial that correct
information is expressed in simple and everyday language.
7.2 Feeling
On a different level, the new information is categorized on the basis of its
affective value. Do I feel this could be meaningful for me, do I feel it can be
advantageous or do I feel it might possibly be dangerous? etc… Whereas
the basic categorization is friendly/inimical, it is subsequently elaborated
depending on specific personal and context variables. This elaboration takes
the form of representations that express the kind of relationship with the
given subject (Carli and Paniccia 1981; Carli and Paniccia, 2002).
Let us consider an example. In a study for the dissemination of data from
the EC-funded Geochemical Seismic Zonation project (Lombardi and
Vercelli, 2000), two different groups were studied: one living in Spoleto, a
high seismic risk area of central Italy; and one living in Rome, a low seismic
risk area.
Rom
e
Spole
to
Social
Organisation
Popular
Wisdom
Control
Earthquakes as totally
unexpected events
Omnipotent
ScienceUseful
Science
Science
as knowledge
Technical
Science
Figure 1. Symbolic dimensions of earthquake culture and science image.
The two groups expressed several earthquake representations, which
were linked differently to the image of science and what they expected from
2Stakeholder Acceptance and Understanding of CO Geological Storage
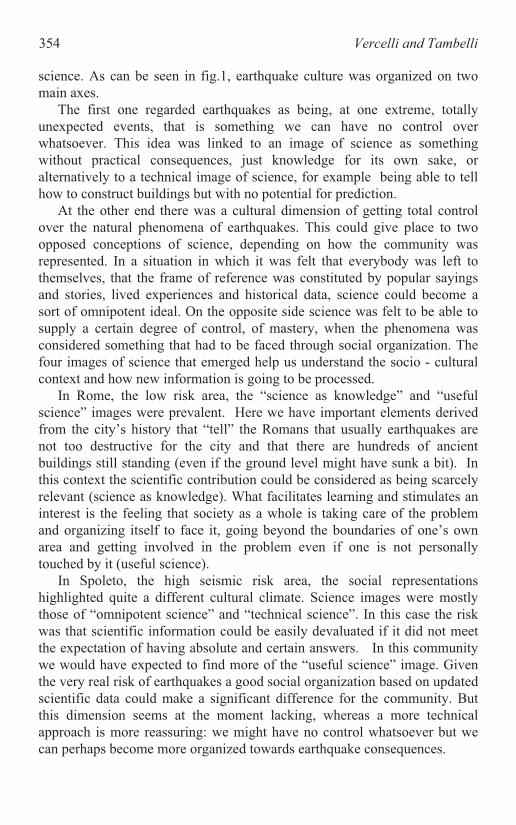
354
science. As can be seen in fig.1, earthquake culture was organized on two
main axes.
The first one regarded earthquakes as being, at one extreme, totally
unexpected events, that is something we can have no control over
whatsoever. This idea was linked to an image of science as something
without practical consequences, just knowledge for its own sake, or
alternatively to a technical image of science, for example being able to tell
how to construct buildings but with no potential for prediction.
At the other end there was a cultural dimension of getting total control
over the natural phenomena of earthquakes. This could give place to two
opposed conceptions of science, depending on how the community was
represented. In a situation in which it was felt that everybody was left to
themselves, that the frame of reference was constituted by popular sayings
and stories, lived experiences and historical data, science could become a
sort of omnipotent ideal. On the opposite side science was felt to be able to
supply a certain degree of control, of mastery, when the phenomena was
considered something that had to be faced through social organization. The
four images of science that emerged help us understand the socio - cultural
context and how new information is going to be processed.
In Rome, the low risk area, the “science as knowledge” and “useful
science” images were prevalent. Here we have important elements derived
from the city’s history that “tell” the Romans that usually earthquakes are
not too destructive for the city and that there are hundreds of ancient
buildings still standing (even if the ground level might have sunk a bit). In
this context the scientific contribution could be considered as being scarcely
relevant (science as knowledge). What facilitates learning and stimulates an
interest is the feeling that society as a whole is taking care of the problem
and organizing itself to face it, going beyond the boundaries of one’s own
area and getting involved in the problem even if one is not personally
touched by it (useful science).
In Spoleto, the high seismic risk area, the social representations
highlighted quite a different cultural climate. Science images were mostly
those of “omnipotent science” and “technical science”. In this case the risk
was that scientific information could be easily devaluated if it did not meet
the expectation of having absolute and certain answers. In this community
we would have expected to find more of the “useful science” image. Given
the very real risk of earthquakes a good social organization based on updated
scientific data could make a significant difference for the community. But
this dimension seems at the moment lacking, whereas a more technical
approach is more reassuring: we might have no control whatsoever but we
can perhaps become more organized towards earthquake consequences.
Vercelli and Tambelli

355
Here (“technical science”) we find more realistic expectations, which
positively evaluate the contribution of social organization. It is then possible
that an approach that couples scientific data with more technical information
will facilitate learning and gradually help develop a more functional cultural
representation ( could be “useful science”).
The way it “feels” can make a great difference in the degree of interest
for learning about a new subject. And the study of psycho–social
representations can help us understand which is the better way to stimulate
positive feelings and thus create a connection with people and stakeholders
that will facilitate communication, learning, exchange of ideas and the
discussion of problems (Carli, 1987; Carli et al., 1988).
The study of the cultural dimension we enter into, as we start talking
about CO2GS, allows us to identify the possible obstacles to good
communication. In this way we get to know the context factors that will
influence the way people will look at what we are presenting. There is,
though, an even more important outcome. As we start the study of psycho–
social representations we give attention to something people live but haven’t
yet shared, expressed or thought about. We start to make connections and
bring into the open issues that constitute implicit ties that need to be
discussed. In this way we open a space where scientific data and research
can become, and be felt as, the community’s property. In other words we
actively stimulate the process that allows research to be assimilated into the
general culture. At the same time scientific research development is
promoted through an open flux between the academic community and the
rest of society (Gregory and Miller, 1998).
8. CONCLUSIONS
Geological storage has the potential to be a very valuable technology to
help us face the problems that arise from excess CO2 in the atmosphere. At
the moment, however, not only the great majority of the general public but
also many relevant stakeholders know very little or nothing about it.
The scientific concepts and data that support this technology are not yet
integrated into everyday culture. The way people are going to understand
and react when coming in contact with this technology needs to be studied.
This is particularly true for people who might be directly involved (because
they are living in a potential site area) and for all stakeholders (that is the
decision-makers who have the power to implement CO2GS).
The moment is favourable. Since the matter is for most totally new, there
is the opportunity to reach the public with correct information without it
already being prejudiced. This same fact, though, makes it particularly
2Stakeholder Acceptance and Understanding of CO Geological Storage

356
difficult to find the right communication channel that can prevent negative
reactions and enhance learning and understanding.
CO2GS is just one aspect of the efforts that are being made to face
climate change and that part of it that depends on human activities. It is a
potential technology that people need to learn more about, as part of a wider
range of measures that can be adopted (Shackley et al., 2004). An organised
image strategy is desirable both to meet the demands of stakeholders and the
public, and to help the scientific community in the effort of communicating.
Stakeholders acceptance and understanding is the basis for a social
decisional process that correctly evaluates advantages and disadvantages of
each possible solution. It is essential to understand that cultural dimensions
play a fundamental role in social decisional processes. When the gap
between new concepts and the current way of thinking is large, it may be
very difficult to recognise the social relevance of new technologies and
solutions.
The implementation of CO2GS requires the construction of a context
where all different social parties, all stakeholders, can meet and elaborate
together a new cultural dimension that takes into account all available
information and “reads” it in the light of shared feelings and impressions.
This kind of process forms the basis for the understanding of what we, as
society, really consider valuable and therefore worth achieving.
The study of psycho–social representations can provide a starting point
for such new context, in that it brings to light at least some aspects of the
network of thoughts and feelings that are socially shared on a certain subject
in a certain social group. In so doing, new symbolic representations and new
cognitive networks are stimulated and a new culture can develop where
climate change, geological storage and CO2 issues are presented in such a
way that everybody is enabled to understand what is being discussed and
which solutions are wise to choose.
REFERENCES
Bradbury, J.A., and Dooley, J.J., 2004, Who’s talking? What are the issues? The media’s
portrayal of carbon dioxide capture and sequestration in the United States, GHGT7 - 7th
International Conference on Greenhouse Gas Control Technologies, Vancouver, Canada,
5-9 September 2004, 4 p.
Carli, R., 1987, The analysis of the question, Rivista di Psicologia Clinica 1:38-53. (in
Italian).
Carli, R., and Paniccia, R.M., 1981, Psycho-sociology of organisations and institutions,
Carli, R., and Paniccia, R.M., 2002, The emotional analysis of text, , Franco Angeli, Milano,
2002.
Bologna: Il Mulino. (in Italian).
Vercelli and Tambelli

357
Carli, R., Paniccia, R.M., and Lancia, F., 1988, The group in clinical psychology. Roma: La
Nuova Italia Scientifica (in Italian).
Curry, T., Reiner D.M., Ansolabehere, S., Herzog, H.J., 2004, How aware is the public of
carbon capture and storage?, GHGT7 - 7th International Conference on Greenhouse Gas
Control Technologies, Vancouver, Canada, 5-9 September 2004, 9 p.
De Conink, H.C., and Huijts, N.M.A., Carbon Dioxide Capture and Storage: Public
Perception, Policy and Regulatory Issues in the Netherlands, GHGT7 - 7th International
Conference on Greenhouse Gas Control Technologies, Vancouver, Canada, 5-9
September 2004, 4 p.
Gregory, J., and Miller, S., 1998, Science in public, Communication, culture and credibility,
Perseus Publishing, Cambridge Massachussetts.
Lombardi, S., and .Vercelli, S.,2000, How to help people enjoy the advantages of scientific
knowledge: a project to disseminate the scientific results of the geochemical seismic
zonation project, Workshop proceedings of Mitigation of Seismic Risk Support to Recently
Affected European Countries, November 2000, European Commission-Joint Research
Centre.
Lombardi, S., and Vercelli, S., 2000, “Understand” the earthquake: study for the
dissemination of scientific data obtained durino the EC-funded project “Geochemical
Seismic Zonation”, Proceedings of the conference: Scientific museums and scholarly
Shackley, S., McLachlan, C., Gough, C., 2004, The public perceptions of carbon cpture and
storage, Tyndall Centre for Climate Change Research, Working Paper 44, January 2004.
Vercelli S., L’immagine dello psicologo: ipotesi sul rapporto tra ricerca d’identità e opinione
sociale, Tesi di laurea, Roma 1989.
formation: problems, resources and instruments, October 2000, Rome Italy. (in Italian).
2Stakeholder Acceptance and Understanding of CO Geological Storage

CO2GEONET – AN EC-FUNDED “NETWORK OF
EXCELLENCE” TO STUDY THE GEOLOGICAL
STORAGE OF CO2
N. Riley
British Geological Survey, Keyworth, Nottingham NG12 5GG, UK
Abstract: The Sixth Framework Programme (FP6)- 2002-2006 - is the European Unions'
main instrument for research funding in Europe. FP6 serves two main strategic
objectives: to strengthen the scientific and technological bases of industry and
to improve competitiveness and innovation in Europe through the promotion
of increased co-operation and improved coordination between relevant actors
at all levels. Within FP6, the Network of Excellence (NoE) instrument was
developed to strengthen excellence on a particular research topic by tackling
the fragmentation of European research. One such NoE, formed in 2004, is
CO2GeoNet, which is made up of 13 research organizations from across
Europe who have extensive experience and expertise in the study of the
geological storage of CO2. The principle goal of this consortium is to
contribute to and form a durable integration of research into CO2 geological
storage, in the European Research Area, as a means of mitigating
anthropogenic mass loading of this greenhouse gas to the atmosphere and
ocean, while there is continued use of fossil fuels.
Key words: European Network of Excellence, geological storage of CO2, research
consortium, CO2GeoNet
The EC Framework 6 Network of Excellence, "CO2GeoNet", a 13
partner research network, contains a critical mass of research activity in the
area of underground carbon dioxide (CO2) storage. World projections of
energy use show that fossil fuel dependency will continue to 2030 and
beyond; but sustainability will need CO2 global emissions reductions by at
least 60% by 2050. This will be difficult, especially with the rise of the
emerging economies such as China, India, Russia and Brazil, and the huge
growth in surface transport. By 2020 China and the USA are likely to be
359
S. Lombardi et al. (eds.),
Advances in the Geological Storage of Carbon Dioxide, 359–362.
© 2006 Springer. Printed in the Netherlands.
360 Riley
responsible for 50% of global emissions. It will require various strategies by
Europe, both with its internal energy systems and in international
negotiations/policy implementation to set the world on the 60% reduction
path within the next decade. The associated rise in global CO2 emissions,
without abatement, will be at an average rate of 1.8% per annum (from the
current value of 25Gt p.a., to 38Gt by 2030) - a rise of over 50%. This would
be catastrophic for the planet's sustainability, leading to dangerous levels of
global warming (+2°C above pre-industrial), sea level rise and ocean
acidification (+0.7°C has already been achieved and ocean pH has fallen by
0.1). Urgent action is needed. Europe's CO2 emissions will rise by an
average of 0.6% p.a. up to 2020, from a 2000 level of 3.1Gt to 3.5Gt by
2020.
The rocks under the N. Sea have a theoretical capacity for storing over
800Gt of CO2. Capturing CO2 from industrial point sources and storing it
underground (a process that mimics nature) is a very attractive route to make
cuts in CO2 emissions. CO2 capture and storage allows diverse fuel
inputs/outputs, enhances security of energy supply and is well aligned with
hydrogen production from fossil fuels. About 33% of CO2 emissions arise
from power generation. If hydrogen or electricity based motive power takes
over surface transport, then a major proportion of the 60% emission cut
could be achieved using CCS. Through the European Commission's Joule 2,
FP4 & 5 projects Europe has led the world in R&D in this area, with rapid
growth this decade. National programmes are also emerging. This success
has a downside, by creating fragmentation through diversification. N.
America despite its rejection of Kyoto (except Canada), has recently
embraced CO2 capture and geological storage and is allocating huge
resources (over $4bn) over the next 10 years, and similar developments are
happening in Australian research programmes. Europe, as a result, risks
losing its head start. We therefore must work more effectively and
restructure accordingly. The main aim of CO2GeoNet will be to integrate,
strengthen, and build upon the momentum of previous and existing
European R&D. In addition it will project European excellence
internationally, so as to ensure that Europe remains at the forefront of CO2
underground storage research and that research leading to implementing
large scale and quick deployment of underground CO2 storage in Europe is
delivered as effectively as possible.
The Network focus is on the geological storage of CO2 as a greenhouse
gas mitigation option (not capture). It has several objectives over the 5-year
period of EC funding for integration;
To form a durable and complimentary partnership comprising of a
critical mass of key European research centres whose expertise and
capability becomes increasingly mutually interdependent. The initial

361
partnership will be between 13 institutes, most of whom have a long and
established history of research in geological sequestration. Some new
players are also included, either because they are expected to have
significant national strategic profile in future CO2 storage projects, or
have capabilities which can be realigned to strengthen the network, or
even bring uniqueness. For the first time in an EC FP project marine
biologists will be drawn into this research topic.
To maintain and build upon the momentum and world lead that Europe
has on geological CO2 sequestration and project that lead into the
international arena.
To improve efficiency through realignment of national research
programmes, prevention of duplication of research effort, sharing of
existing and newly acquired infrastructure and IPR.
To identify knowledge gaps and formulate new research projects and
tools to fill these gaps.
Seek external funding from national and industrial programmes in order
to diversify, build and strengthen the portfolio of shared research
activities.
To provide the authoritative body for technical, impartial, high quality
information on geological storage of CO2, and in so doing enable public
confidence in the technology, participate in policy, regulatory
formulation and common standards.
Provide training to strengthen the partners, bring in new network
members and sustain a replacement supply of researchers for the future.
To exploit network IPR, both as a revenue earner to sustain the network
and to equip European industry to be competitive in the emerging global
low carbon energy markets.
In order to achieve these goals the following five areas of research have
been defined, with each partner participating in the areas where they have
the most expertise:
Predictive numerical tools, including geochemical, geophysical, fluid
flow and geomechanical tools
Rock and fluid dynamic experimental facilities, including geochemical,
geophysical, fluid flow and geomechanical facilities, data and
information.
Enhanced hydrocarbon recovery methods and tools, including enhanced
oil, gas, coal bed methane. Monitoring techniques, including
geochemical, geophysical, hydrological, biological and remote sensing
techniques
2 CO GeoNet - A 2 CO Geological Storage NoE

362 Riley
Risk and uncertainty methods and tools, including ecosystem, health and
safety and long term impacts, as well as data and risk scenario
uncertainty and mitigation strategy
A total of 7 European nations are represented within the Network, with
participation by the following institutions:
1. Denmark
Geological Survey of Denmark and Greenland - GEUS
2. France
Bureau de Recherches Geologiques et Minieres- BRGM
Institute Francais du Petrole - IFP
3. Germany
Federal Institute for Geosciences and Natural Resources - BGR
4. Italy
Istituto Nazionale di Oceanografia e di Geofisica Sperimentale- OGS
Università di Roma "La Sapienza" - URS
5. Netherlands
Netherlands Organisation for Applied Scientific Research - TNO
6. Norway
Norwegian Institute for Water Research - NIVA
Stiftelsen Rogalandsforskning- RF
SINTEF Petroleumsforskning AS - SPR
7. UK
British Geological Survey (BGS- NERC)
Heriot-Watt University - HWU
Imperial College of Science, Technology and Medicine- IMPERIAL
Further information can be obtained at www.CO2geonet.com, or by
contacting the co-ordinator, Dr. Nick Riley at [email protected], tel +44 115
9363312