Embed Size (px)
Citation preview

A D VA N C E S T O E N E R G Y I N F O R M AT I C S
O N T H E C O L L E C T I O N , P R O C E S S I N G , A N D P R I VA C YP R O T E C T I O N O F E L E C T R I C I T Y C O N S U M P T I O N D ATA
kumulative
H A B I L I TAT I O N S S C H R I F T
A N D R E A S R E I N H A R D T

Andreas Reinhardt
Advances to Energy Informatics: On the Collection, Processing, and PrivacyProtection of Electricity Consumption Data
Von der Fakultät für Mathematik/Informatik und Maschinenbau derTechnischen Universität Clausthal genehmigte Habilitationsschrift
Clausthal-Zellerfeld, 2019

C O N T E N T S
1 introduction 1
1.1 Energy informatics . . . . . . . . . . . . . . . . . . . . . . . . . . . 3
1.2 State of the art . . . . . . . . . . . . . . . . . . . . . . . . . . . . . . 5
1.3 Contributions and outline . . . . . . . . . . . . . . . . . . . . . . . 10
2 collection of electricity consumption data 13
2.1 Load signatures . . . . . . . . . . . . . . . . . . . . . . . . . . . . . 13
2.2 Collecting load signatures using embedded systems . . . . . . . . 15
2.3 Load signature compression . . . . . . . . . . . . . . . . . . . . . . 17
2.4 Remote re-configuration of data collection devices . . . . . . . . . 19
2.5 In-network data processing . . . . . . . . . . . . . . . . . . . . . . 22
3 processing electricity consumption data 25
3.1 Appliance recognition . . . . . . . . . . . . . . . . . . . . . . . . . 25
3.2 Consumption prediction . . . . . . . . . . . . . . . . . . . . . . . . 29
3.3 Anomaly detection . . . . . . . . . . . . . . . . . . . . . . . . . . . 32
3.4 Load modeling for automated evaluations . . . . . . . . . . . . . 34
4 protecting user privacy in smart grids 37
4.1 Intentional data perturbation . . . . . . . . . . . . . . . . . . . . . 37
4.2 Load hiding through renewable power generation . . . . . . . . . 40
5 conclusions and future research directions 43
6 references 45
7 list of acronyms 61
a publications contributing to this habilitation thesis 63


1I N T R O D U C T I O N
The almost ubiquitous availability of electrical power is one of the keyaccomplishments of the 20
th century. This electrification has not only led to asignificantly increased comfort for users of electrical energy, but also enabledformerly inconceivable technological progress. The global population has sincebecome widely accustomed to the omnipresence of electricity; almost 80% ofthe planet’s population have access to electrical power today [IEA10]. In orderto provide a reliable and resilient energy supply, electrical energy generation,transmission, and distribution systems are being steadily improved. As a resultof these efforts, most power supply grids worldwide already attain availabilitylevels in excess of 99% [CEE16]. The German power grid, being particularlywell known for its stability, ranks among the most reliable power grids, with anaverage unavailability time of less than 12 minutes for the year 2015 [VDE16].
Besides the evolution of electrical power grids, strong research activitiestowards the digitalization have been conducted throughout the past decades.Thanks to continuous innovations in computer systems and communicationtechnologies, innumerable digital devices have found their way into privatehomes, offices, and industrial plants worldwide. While initially operatedin a standalone fashion, their interconnection in a world-spanning networkhas enabled formerly unimaginable novel systems and services, includingthe World Wide Web [BLCG92], Cloud computing [MG11], and the Internetof Things [Ash09]. In analogy to electrical power grids, a world withoutubiquitous access to networked resources has become truly unthinkable.
The symbiotic combination of electrification and digitalization has led to theemergence of smart grids [AKM12]. Smart grids augment conventional elec-trical power grids by their instrumentation with networked data collectionpoints. This decentralized deployment of data collection devices allows for adetailed monitoring of the grid status in real-time. Diverse application scenar-ios exist for the use of data collected this way, including the early detectionof transitions into unstable regions of operation and the enablement of de-tailed consumption analytics for better capacity planning. A second character-istic property of smart grids is the presence of decentralized data processingand actuator devices, which allow stakeholders to exert fine-grained controlover the grid’s operation, e.g., to quickly respond to changing operating condi-tions by applying corresponding countermeasures. The principal features thatset smart grids apart from conventional power grids are the availability of alarge volume of information provided by the deployed sensing points, and therange of services enabled by appropriately combining available data from suchsources.
1
introduction 2
Electricity metering infrastructure has seen a constantly progressing trendtowards its digitalization. Electromechanical induction meters are graduallybeing replaced by digital metering devices (smart meters) with communicationinterfaces. More and more electrical in-home appliances are equipped withnetwork adapters to enable their interconnection and create smart homes.Even commercial and industrial sites are gradually being retrofitted with thesensing infrastructure necessary to gain a deeper understanding of energyconsumption and allow for its optimization, as part of the transition towardsIndustrie 4.0 [KWH13]. The notion of smart cities is a continuation of theseconcepts at greater scale, and combines information from electrical distributionand transmission grids with data from other modalities in urban regions.
This range of deployment scenarios for measurement devices already hintsat the heterogeneity of the landscape of data collection points in smart grids.The high information requirement in some locations may necessitate the use ofPhasor Measurement Units (PMUs), i.e., devices that capture a range of electri-cal parameters at high temporal and amplitude resolutions. In contrast, othersensing points may have less stringent requirements to the rate and resolu-tion of collected data, so they can be realized using smart meters or even un-calibrated low-cost plug-level power sensors. Regardless of the technologicalrealization of measurement devices, however, the principal components in anAdvanced Metering Infrastructure (AMI) consistently integrate three function-alities synergistically: Sensors to measure power-related physical quantities,a data processing component to extract relevant features from collected data,and a bidirectional communication interface to relay such information and re-ceive configuration and actuation commands.
The benefits of a fine-grained data collection in smart grids become apparentwhen considering the services they enable for the different stakeholders.Transmission System Operators (TSOs) and Distribution System Operators(DSOs) can gain deeper insights into the evolution of consumer characteristicsover time and use this information for the appropriate dimensioning ofthe infrastructure they operate. Through the detection and localization offluctuations and disturbances in the power grid, decentralized generators, suchas photovoltaic (PV) systems or wind turbines, as well as controllable storagesystems can be operated accordingly to minimize the risk of propagatingfaults into the grid and to avoid peak loads. Electricity consumers can alsobenefit from the correlation of grid-wide information with the data they haveprovided. One the one hand, detailed insights into generation and demandallow utility companies to offer flexible tariff structures to incentivize “grid-friendly” user behavior. On the other hand, data collected within industrialsites or private homes can be used to create awareness for a building’s energyconsumption and to achieve savings, e.g., through energy-aware buildingautomation. In conclusion, the holistic collection of generation and demanddata allows for an unprecedented view of the power grid and the enablementof many novel services.

1.1 energy informatics 3
Data collection
Power generation
Power consumption
Environmental data
Data analysis and interpretation
Disaggregation
Load forecasting
Pattern recognition
… Anomaly detection
Correlation analysis
Data fusion
Machine learning
…
Service provision
Device actuation
User-centric services
Notifications
…
Networking Networking
Cross-sectional topics: IT security, privacy protection, user acceptance, human-computer interfaces, …
Figure 1.1: Delineation of the scope of energy informatics.
1.1 energy informatics
The technological challenges and opportunities arising from the intersectionof electrical power grids with networked systems that collect, relay, andprocess information from/within them, represent the foundation of energyinformatics, the principal subject of this habilitation. Energy informatics is aninterdisciplinary research field that encompasses all aspects of smart grids thatcan be addressed through the application of Information and CommunicationTechnology (ICT). The focus of energy informatics thus lies on the integrationof computer networking, data processing, and systems engineering within thepower grid. A visualization of the core components of energy informaticsis shown in Figure 1.1 and to be understood as follows. Data sources (left)provide readings of grid properties, analysis methods (center) cater to theirinterpretation and fusion, and services are provided to stakeholders (right)based on the insights gained. Computer networks are employed to interfacethe components with each other.
Its dependency on requirements and boundary conditions imposed byseveral involved disciplines sets energy informatics apart from many otherapplication domains of ICT. Given that transmission and distribution gridsbuild up the core of the smart grid, knowledge of power electronics andelectrical power engineering is vital to understand design decisions, validoperating condition ranges, and characteristics of the components deployed inpower grids. Moreover, smart grids are also tightly coupled to measurementengineering, given that AMI devices need to be carefully designed and correctlydeployed to collect meaningful data. Lastly, adequate solutions for ensuringdata security and privacy protection are mandatory to cater for user acceptanceand fulfill legal requirements for data collection, transmission, and storagein smart grids. For the realization of energy informatics functionalities, theseaspects need to be adequately considered.
Energy informatics will gradually transform the traditional power grid, inwhich electrical power and energy consumption used to be the principal quan-tities of interest, into a smart power grid. Readings which used to be solelymetered at the customer handover point and merely sufficed to enable ser-vices like billing and capacity planning, will be enriched by a broad range ofother sensed modalities. Even today, the increasing deployment of further sens-

1.1 energy informatics 4
ing devices in the power grid has already led to an unprecedented degree ofadditional information. In addition to monitoring electrical power flows, cur-rently sensed modalities also include power quality [Bol99], ElectromagneticInterference (EMI) emissions in substations [Smo12], or environmental condi-tions [HBA+12]. Thus, a comprehensive set of data describing the status of apower grid in a detailed fashion can already be retrieved on demand, and thisholistic situative picture is constantly refined due to the perpetually growingnumber of deployed data collection systems.
Meaningful ways to analyze and correlate collected data, with the objectiveof extracting higher-level information and providing services based thereupon,are at the core of energy informatics. Consequently, this research area has seenan almost exponential increase of scientific attention in the last decade. One ofthe fundamental ideas behind energy informatics has been highlighted in sem-inal work by George Hart in [Har85]: Using observed changes to a household’saggregate load (collected at the electricity meter) to identify appliance usageand operation modes. Since then, the task of disaggregating the household totalload into information about the individual contributing appliances, often re-ferred to as Non-Intrusive Load Monitoring (NILM), has evolved into a researchchallenge addressed by numerous researchers worldwide, including Hart him-self [Har89; Har92]. Many more works that extend and/or refine this concepthave been presented subsequently, differing in the sensor deployment loca-tions, their temporal and amplitude resolutions, or the extent of supplemen-tary data collected. Moreover, numerous prototypes have been implementedto underpin the practical relevance of energy informatics, such as through en-ergy audits [BGM+01], the identification of user types [CDW+11; AXR+15],the detection of household characteristics [WHM+12; BSS+14; BSS+15] and oc-cupancy [KBS15], the detection of anomalous consumption [APR15; AKG+15],and the prediction of future demand [BMN09; RCK14]. While the majority ofthese approaches is centered around the inhabitants of a dwelling, the under-lying data processing operations are often generally applicable across applica-tion scenarios, e.g., to determine an appliance’s mechanical wear [ORL+10]for predictive maintenance purposes. This brief excerpt of the state of theart already shows that significant research activities are being conductedon converting conventional electrical power grids into smart grids throughthe application of ICT, with contributions ranging from generic architectures(e.g., [CEN12]) to complex technical solutions for specific challenges.
A contributing factor for the wide scientific and industrial uptake of energyinformatics is its practicality due to the large-scale rollout of smart meteringinfrastructure [EU12]. Millions of homes and industrial sites worldwide havealready been equipped with such networked electricity meters (cf. [EC14;EF14]). Besides smart electricity meters, many dwellings are also beingfitted out with smart home and/or building automation systems, whichoften comprise energy monitoring devices for electrical circuits or individualwall outlets. An unprecedented and fast-growing amount of fine-grained

1.2 state of the art 5
energy consumption data is thus continually becoming available for analysis.Moreover, supplementary data to increase the data processing accuracy andperformance in energy informatics are gradually being provided thanks to theemergence of smart cities and industrial automation networks. The rise of theInternet of Things (IoT), with its envisioned 50 billion terminal devices by theyear 2020 [Eva11], is fueling this process even more. A holistic architecture forcollecting, processing, and interpreting data related to the generation and/orconsumption in a power grid in meaningful ways is thus strongly required.Once it is in place, a wide range of novel services will provide benefits to allstakeholders, including electricity consumers, operators (including DSOs andTSOs), and the power grid itself.
1.2 state of the art
It is the objective of energy informatics to consider the collection, prepro-cessing, and storage of electricity consumption data in a holistic and all-encompassing way. Contributions to several, partially orthogonal, research top-ics must hence be considered in union. The current state of the art for each ofthe relevant fields is summarized as follows.
Technically, the collection of energy consumption data can be realized in oneof the following four ways [FLG+11]:
1. Distributed direct sensing: This approach relies on (retro-)fitting individualelectrical appliances with sensing devices. The currently prevalent ap-proach to facilitate distributed direct sensing is the insertion of a sensorinto the appliance’s power cord. To this end, both commercially avail-able solutions (smart plugs, often part of home automation solutions)as well as research prototypes like Plug [LFO+07], ACme [JDHD+09],SEM [WBD+11], or SmartMeter.KOM [RBM+11] exist. While allowingfor the data collection at appliance-level granularity, the need for an indi-vidual sensor per appliance makes this approach expensive. To cut thiscost, sensors with low resolution are often being used, resulting in lowerachievable signal information.
2. Single-point sensing: Given the presence of electricity meters in virtuallyall homes, leveraging them to collect measurements of voltage andcurrent (and thus the extraction of phase information) is the most directand trivial way of gathering information. As smart meters are generallysupplied by a customer’s utility company and need to be installed bycertified technicians, however, their technical specifications are usuallypre-determined (cf. [DoE11]) and non-changeable. The absence of aunified interface to collect (high-resolution) sampling data from smartmeters additionally complicates the actual retrieval of data.
3. Intermediate sensing methods: While the two aforementioned methodsreflect the extremal points of potential sensor locations in dwellings,several intermediate options exist as well. Marchiori et al. have proposed
1.2 state of the art 6
the installation of metering equipment on circuit level in [MHH+10]. In[JS10], Jung and Savvides present a methodology for the progressivedeployment of sensors in order to minimize the risk of ambiguous powerattribution to appliances. A versatile hardware platform for intermediatesensing is Monjolo [DCD13], which can be clipped to any cable (e.g., onthe distribution board or in conduit boxes). Monjolo can determine thepresence of flowing currents, yet by design it is neither able to quantifytheir exact amplitude nor whether they result in a real or reactive powerconsumption.
4. Indirect sensing: In contrast to the direct monitoring of electrical powerflows, approaches have also emerged to indirectly infer power flow in-formation based on different modalities. Concepts leveraging sensorsfor vibration, magnetic fields, or thermal imaging have been publishedin ViridiScope [KSC+09], ANNOT [SGD+10], TinyEARS [TGM10], Heat-Probe [HKC+11], Supero [PTM+13], Deltaflow [CCD14]. Such surrogateindicators are often suitable to infer the operational state of an appliance,although they are commonly not able to exactly quantify the resultantenergy demand.
Besides the sensor deployment locations, their sampling rate is equally im-portant to consider. Across the practical deployments referenced above, it canbe noted that the majority of existing approaches technically only allow forthe collection of samples at a sampling rate 1 Hz, or even less. An analy-sis of spectral components in appliances’ current waveforms is hence implic-itly excluded because this sampling frequency does not satisfy the Nyquist-Shannon sampling theorem. In order to overcome this limitation, several re-search platforms have been presented which allow to capture voltage and cur-rent signatures at higher sampling rates (e.g., 15 kHz [BGS+11; CLY08; CLL10],or 8 kHz [LFO+07; LLC+03; RPL+10]). However, such systems are mostlynot available commercially, particularly not in larger quantities. Even thoughgeneral-purpose power analyzers could be used to facilitate this data collec-tion, economic reasons hinder their wide deployment (e.g., for distributeddirect sensing). Research has nonetheless unambiguously demonstrated thathigher sampling frequencies – up to the megahertz range – are required forcapturing transient events or even characteristic noise signatures backscatteredby electrical consumers onto the power lines [FLG+11]. Assessments of sin-gle point sensing deployments with sampling rates of 36 kHz [GRP10] andeven 100 kHz [BGM+09] have been conducted to this end. When recordingcurrent flows at such sampling rates, the authors of the related studies foundthat transition noises do not only occur for device de-/activation transitions,but also for internal appliance state changes [CLS+06; PRK+07]. This obser-vation is also well aligned with earlier work by Marubayashi [Mar97], whichindicated that each appliance (de)activation leads to minimal changes of themains voltage within the household. Another general observation was thatswitching power supplies, such as the ones typically shipped with laptop com-

1.2 state of the art 7
puters, produce considerable characteristic noise in the range of hundreds ofkilohertz [FLG+11]. A dedicated consideration of high-frequency sampling, atleast at selected points within a building, thus appears as a promising ap-proach to infer additional information on electrical energy consumption, asconfirmed by preliminary studies in [GRS14; KUK+16].
Data collection campaigns in the real-world incur significant monetary ex-penses for sensor purchases, installation, and maintenance. This is particularlyaggravated by the fact that no universally applicably collection methodologyhas been proposed to this day, thus the longevity of installations is not ensured.However, the use of real-world data in indispensable for the development of prac-tically applicable analytics algorithms. Consequently, researchers around theglobe have started to collect power and/or energy consumption data by meansof measurement campaigns. In the last decade, a growing number of energyconsumption data sets has been collected and made available for download.A selection of such data sets is listed in Table 1.1 on page 8, annotated bytheir year of collection and instrumentation methodology. Moreover, the num-ber of buildings monitored, sensor sampling rates, and geographic locationsof collection are reported.
When reviewing the characteristics of the listed data sets, it becomes appar-ent that no coherent data collection strategy can be observed. Measurementdevices are often deployed opportunistically, and the re-use of existing de-vices (e.g., smart meters) is paramount in most scenarios. As a result, severallimitations of the published data sets can be summarized:
B Only a small subset of the available data sets feature information on ahousehold’s aggregate demand in conjunction with the power consump-tions of all present appliances (i.e., the combination of SPS with DDS orPDS). Only two data sets encompass full-building instrumentations, yettheir data has not been collected at a sampling rate sufficient for spectralanalysis.
B User actions that correlate to appliance actuation decisions are rarelyrecorded and published with the data (with Smart* [BMI+12] andECO [BKC+14] being exceptions).
B Additional annotations like the ground truth of an appliance’s actualmode of operation are absent from the aforementioned data sets. Onlythe PLAID data set [GGK+14] contains different entries for start-up andsteady-state current traces.
It is imperative to valuate the information content of collected data in orderto determine the efficacy of a sensor instrumentation methodology. Despitethe importance of this research challenge, however, it has received only littlescientific attention to date. In contrast to this barely covered research topic,energy data processing (also named energy analytics) has been intensively studiedand numerous algorithms have been proposed to this end. Even though theydo not primarily target to valuate the information content in consumption data,they allow for its indirect inference; input data of higher quality generally

1.2 state of the art 8
name year granularity # buildings sampling rate location
PowerNet [KGH+10] 2010 DDS 1 1 Hz United States
REDD [KJ11] 2011
SPS + PDS6
15 kHz (SPS)United States
+ ISM 1–1/3 Hz (PDS/ISM)
BLUED [AOB+12] 2012 SPS 1 12 kHz United States
Tracebase [RBB+12] 2012 PDS 20+ 1 Hz Germany
Smart* [BMI+12] 2013
SPS + DDS3
1 Hz (SPS/ISM)United States
+ ISM ∼1/5 Hz (DDS)
AMPds [MPB+13] 2013 SPS + ISM 11/60 Hz Canada
ACS-F2 [RGH13] 2013 PDS n/a 1/10 Hz Switzerland
OCTES [EST13] 2013 SPS 331/7 Hz Scotland
iAWE [BGS+13] 2013
SPS + PDS1 1 Hz India
+ ISM
GREEND [MEE+14] 2014 PDS 9 1 Hz Austria/Italy
ECO [BKC+14] 2014 SPS + PDS 6 1 Hz Switzerland
PLAID [GGK+14] 2014 PDS 55 30 kHz United States
UK-DALE [KK14] 2015 SPS + PDS 5
16 kHz (SPS)United Kingdom
1/8 Hz (PDS)
DRED [URP15] 2015 SPS + DDS 1 1 Hz Netherlands
REFIT [MLS+15] 2015 SPS + PDS 201/8 Hz United Kingdom
WHITED [KUK+16] 2016 PDS n/a 44 kHz worldwide
COOLL [PNMR+16] 2016 PDS 1 100 kHz France
Table 1.1: Selection of existing energy informatics data sets. Sensor instrumentations:DDS: distributed direct sensing of all individual loads; PDS: partial dis-tributed direct sensing (selected loads only); SPS: single-point sensing at themeter; ISM: intermediate sensing methods, e.g., circuit-level monitoring.
also lead to higher accuracy values of the energy analytics algorithms. Theprimary focus of early energy analytics research has been the disaggregation ofa household’s energy demand based on the observed changes of its real – andoften also reactive – power consumption [Har92; DK99; FZ99; Pru02; LLC+03;BV04; Cox04]. While initial solutions were predominantly focused on binary-state appliances (i.e., devices with a deterministic and repeatable change ofreal and reactive power when turned on or off), many subsequent projectshave also looked at appliances with more complex consumption patterns. Inthe majority of solutions presented to date (cf. [ZR11; ZGI+12; AGS+13] forcomprehensive surveys of NILM approaches), low-frequency data have beenused, i.e., samples collected at a rate below the frequency of the mains voltage(often 1 Hz or less). However, other approaches have also looked into the use of

1.2 state of the art 9
input data containing spectral components in order to disaggregate householdtotals (e.g., [LSJ95; CA98; CA00; IUI+04; BGM+09; PGW+11; DDD+17]).Besides household load disaggregation, the detection of operational state andanomalous consumption behavior in industrial settings (e.g., electrical motors)has emerged as a secondary application scenario of energy analytics [LLN+05;SLN+08; ORL+10]. Once initial solutions had demonstrated the possibility andviability of energy analytics, subsequent approaches were designed to cater tothe disaggregation of appliances with variable power consumptions duringtheir operation (such as variable-frequency drives) as well as the usage ofmore sophisticated techniques for their use disaggregation algorithms, e.g.,Bayesian networks [PGW+14] or neural networks [Pru02; RNS+10; KK15].Domain-specific preprocessing steps have also been investigated in [QG14;RK14], targeting the elimination of spurious data or the conversion of rawsensor samples into data structures that allow for faster processing.
Despite this positive prospect for energy analytics, two more aspects are vitalfor its success. Firstly, a trade-off between the amplitudinal and temporal res-olution of collected power data and the desired accuracy of the data analyticsneeds to be determined to optimize their demand for storage space. Correlationanalyses were conducted in [EK10; LES+14; TSB+14], hinting at a non-linearrelation between the granularity at which data are collected and the resultantservice quality. Requirements to data storage systems also show a major depen-dency on the sampling resolution; in [MCB+15], annotated power flows fromseven channels captured at 12.8 kHz sampling rate have been shown to pro-duce a daily volume of almost 20 gigabytes. Even when applying lossless com-pression, the storage requirement for data collected at 24 bits resolution and16 kHz sampling rate sums up to 4.8 gigabytes per appliance per day [KK14].More recently, a storage demand of 286 gigabytes per day has been determinedwhen sampling a three-phase system at 250 kHz [HKK+17]. Besides the datapreprocessing solutions presented above, orthogonal approaches to maintainmanageability have hence also been presented in literature. For example, pro-posals have been made to downsample data recorded at 100 kHz to a mere20 Hz in order to mitigate the storage requirement [BGM+09], or to compresssmart meter data [RRR+12; EEK+15]. Storage demands are also strongly in-fluenced by the way in which consumption data are being recorded. WhileIBM recommends database solutions [IBM12], the NILMTK project [BKP+14]natively supports input data in the HDF5 file format. The data sets listedin Table 1.1 mostly use plain comma-separated value files (e.g., in [KGH+10;RBB+12; GGK+14]) or XML-based representations (such as [RGH13]), neitherof which is well-suited to achieve high performance.
Secondly, besides purely technological constraints, the user acceptance ofsmart metering and other forms of energy data collection is crucial for thesuccess and adoption of energy analytics. Adequate privacy protection ofcollected data is thus mandatory, especially as numerous campaigns against

1.3 contributions and outline 10
the installation of smart meters have already formed worldwide1. Existingapproaches mostly rely on cryptography to protect the confidentiality ofcollected data [JAL12; WL13], but are partially also complemented by meansfor local data obfuscation [REC15] or the use of local storage or renewablegeneration to cover up power consumption [ZJW+14; EPE14; RKE+15] andmaintain user privacy this way.
1.3 contributions and outline
To realize truly smart grids, research and development activities in all ofthe underlying domains need to be conducted, and their results must besynergistically combined. Energy informatics is one of the pivotal areas for thesuccess of smart grids. Predominantly concerned with the application of ICT
in the domain of electrical power systems, energy informatics encompasses arange of topic fields, as shown in the overview diagram in Figure 1.1 on page 3.My recent research activities have been focused on this domain, and I havemade several scientific contributions to the areas depicted in the figure. Thesecontributions are presented in more technical depth in the following chaptersof this manuscript, yet briefly categorized in this section to cater for a commonunderstanding of their relation to each other and their interconnections.
The first set of contributions presented in this habilitation thesis addressthe field of collecting electricity consumption information and ensuringtheir lossless storage and forwarding. The concerted collection of sensordata related to electrical quantities as well as supplementary sensor dataabout the prevailing environmental conditions serves as the foundation formany services, and is thus an important foundation for energy informatics.Unless sensor data of appropriate resolution and granularity are available,the processing and resulting services provision is severely hampered. Thus,a first set of my contributions concerns the creation of infrastructures tocollect data from decentralized sources in a scalable fashion and ensure theirtimely and accurate transmission. My contributions to this domain include thedesign and implementation of embedded systems (in hard- and software) tocollect electricity consumption information, as well as their efficient coding toalleviate bandwidth requirements and cater for scalability. The contributions Ihave made to the field of energy information collection, targeting to capture aholistic and comprehensive picture of a part of the power grid, are presentedin Chapter 2.
Besides the collection of data, their processing takes an integral role inenergy informatics and smart grids. Raw electricity consumption data aregenerally large in volume, repetitive in their nature, and often contain only fewevents of importance. In order to fully exploit the information content in suchdata, it is thus necessary to eliminate redundancies in the data and extract
1Examples include http://www.stopsmartmeters.org and http://stopsmartmeters.org.uk

1.3 contributions and outline 11
patterns of significance. Due to their nature of being periodically sampled,electricity consumption information can be modeled as time-series data. Thus,techniques from the domain of time series analysis be applied to extractknowledge from the input data. I have investigated several alternative waysto extract high-level information from raw electricity consumption data in myresearch. By considering electricity consumption data in both the time andthe frequency domain, the approaches allow to determine characteristic powerconsumption patterns when appliances are activated, deactivated, or changetheir mode of operation. Based on such information, it becomes possible todetect anomalies by identifying deviations from previously observed patterns,or to predict an appliance’s future power demand when such recurringpatterns are detected. My research results on the extraction of informationcontent from raw electricity consumption data are summarized in Chapter 3.
Besides purely technological considerations, user acceptance is vital forthe success of smart grids and energy informatics. In order to cater to theusers’ needs, an adequate protection of the sensitive data collection from theirmetering points is indispensable. This is also of great relevance to ensurecompliance with current legislation (e.g., the European Union’s General DataProtection Regulation [EU16]). In essence, the protection of user privacy isa key contributor to the acceptance of load monitoring in private homes.Ensuring a strict compliant to privacy regulations and the sufficient protectionof electricity consumption data thus represents a cross-sectional topic of highpractical relevance. Consequently, I have investigated mechanisms to protectuser privacy in smart grids, which are presented in Chapter 4 of this work.Given that it is not possible to measure the degree of achieved privacyprotection in absolute numbers, in-depth analyses of the parameter spaceshave been conducted in order to derive recommendations for configuring thedesigned protection algorithms.
This habilitation thesis concludes with a summary of the presented contri-butions and possible future research directions in Chapter 5.


2C O L L E C T I O N O F E L E C T R I C I T Y C O N S U M P T I O N D ATA
The availability of energy consumption data at the required resolution foradequate processing is one of the principal pillars of energy informatics.While a plethora of devices to collect energy information in a scalablemanner have been presented in prior research, they most often featurelimited data reporting rates to ensure their operability over bandwidth-limited communication channels. In fact, it is not uncommon to see reportingintervals as long as 15 minutes between samples (as defined in §60 MsbG),even though most approaches presented in scientific publications rely onreadings reported once per second. Besides the different data reportingintervals, the nature of the collected readings also often differs between sensordeployments. In a large number of systems, only a single sample of thevalue of interest (usually the averaged consumption since the last report)is being communicated. Substituting a possibly large number of collectedvoltage and current waveform samples by a single scalar value leads toa loss of information, though. Thus, it severely hampers the operation ofmany energy analytics algorithms, or at least affects their accuracy negatively.Nonetheless, reasons for the widespread collection of such downsampleddata exist, most importantly the significantly reduced buffer and bandwidthrequirements for the data transmissions. The transmission of low-rate low-detail readings makes it possible to use tightly resource-constrained embeddedsystems for data collection, while still allowing for the observation of generaltrends. In order to fully exploit the potential of energy informatics, innovativecontributions are needed to collect electricity consumption data at sufficientlyhigh resolutions to enable the extraction of their full information content,yet keep the volume of data manageable at the same time. After a briefintroduction of the notion of load signatures, four of my contributions thataddress this challenge are presented in the remainder of this section.
2.1 load signatures
Load signatures represent the fundamental quantities of interest in energy ana-lytics. They model an electrical appliance’s characteristic power consumptionduring the course of its operation, determined by the current drawn as wellas the voltage simultaneously applied to its terminals. The analysis of loadsignatures has been extensively studied in research, e.g., in [LNK+10; CCT+12;DHH+16; DRD+18], with the objective of extracting high-level informationfrom collected data. My own contributions to the field of load signature analy-sis are presented in Chapter 3 of this work. Two principal types of load sig-
13

2.1 load signatures 14
-40
-20
0
20
40
0 250 500 750 1000
Cu
rre
nt
[A]
Time [msec]
(a) Microscopic load signature of a washing machine’s activation current [Rei17a].
0
500
1000
1500
2000
2500
19:00 19:30 20:00 20:30 21:00 21:30 22:00
Pow
er
[W]
Time of day
(b) Macroscopic load signature of a washing machine’s power consumption [Rei17a].
Figure 2.1: Macroscopic and microscopic load signatures of a washing machine.
natures have been defined by Zeifman and Roth in [ZR11], which are brieflysummarized as follows to cater for a common understanding.
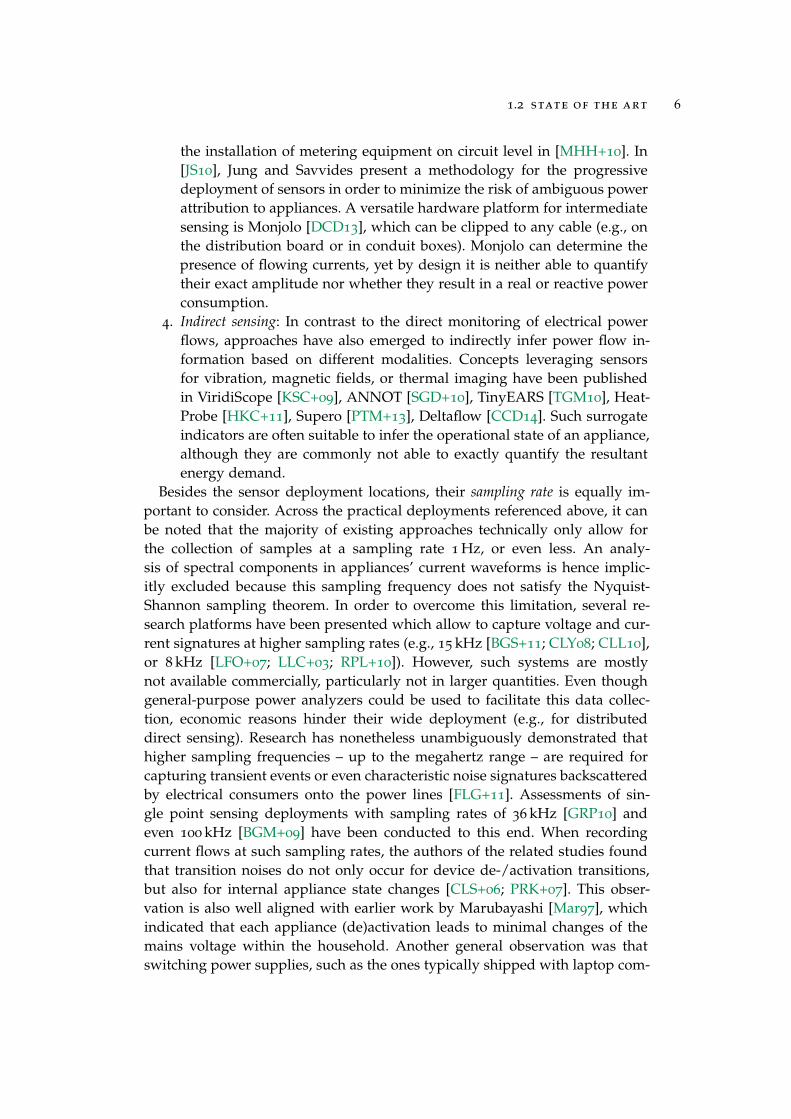
Load signatures that contain voltage and current signals captured atfrequencies much greater than the frequency of the mains voltage are generallyreferred to as microscopic load signatures. PLAID [GGK+14] is a data set ofmicroscopic appliance inrush signatures collected at 30 kHz sampling rate, i.e.,500 times the mains frequency of its collection location (Pittsburgh, USA). Asample load signature from the PLAID data set is shown in Figure 2.1a; notethat only the current consumption waveform is shown for visual clarity. Itshows a washing machine’s current consumption in the moment the applianceis switched on. The sinusoidal nature of the current is clearly visible, as well asthe fact that the power consumption in the initial mains periods after activationis largely different than the comparably steady waveform afterwards, dueto the initially low resistance of internal heating elements. While this levelof detail appears promising for energy data analytics, a key downside ofmicroscopic load signatures is their storage demand.
Alternatively, load signatures can be composed of averaged readings ofa load’s power consumption, reported at low frequencies, such as onceper second. This lowered resolution makes it impossible to reconstruct theactual shape of the appliance’s current intake. However, such macroscopic loadsignatures cater to the limitations imposed by wireless communications andstorage systems. Even though the level of detail achievable from microscopicload signatures is no longer available, macroscopic load signatures still allow
2.2 collecting load signatures using embedded systems 15
for the analysis of long-term trends and patterns on time scales of minutes,hours, or even days. An example for this type of load signature is shown inFigure 2.1b, which visualizes the power consumption of a washing machinefrom the Tracebase data set [RBB+12], in which appliance-level data hasbeen collected in Germany at 1 Hz sampling rate. The washing machine’sheating cycles with power consumptions in excess of 2,000 W can be easilydistinguished from rinsing phases with considerably lower power demand.
The conversion of a microscopic load signature into its macroscopic repre-sentation is easily possible, yet a lossy process. For example, the multiplicationof the current waveform shown in Figure 2.1a with the corresponding voltagesamples (also part of the data set) yields the washing machine’s power con-sumption which can then be integrated over the course of one second. Thethree largely different phases visible in Figure 2.1a (off, initial inrush, steadystate), however, all take place within one second. Consequently, they can nolonger be discerned in the macroscopic load signature once the data have beenconverted, despite their potential relevance for load signature analysis algo-rithms.
2.2 collecting load signatures using embedded systems
Electricity consumption data can be collected in many distributed locationswithin the power grid. Many more meaningful insights can, however, begained by correlating data simultaneously captured in different locations.A network of data collection devices must hence be established to createsuch an infrastructure for energy data analytics. As many potential meteringlocations are located in places where no wired data connection is available,wireless solution are frequently used to this end. A key advantage is theirquick and simple installation, and due to their installation at a live mainsconnection there is virtually no installation effort to supply them with power.From a technological point of view, networked metering devices can be seenas an instantiation of Wireless Sensor Networks (WSNs) [ASS+02], in whicheach distributed sensor is responsible for the collection, on-board processing,and reporting of electricity consumption data. Their miniaturized form factorand the low monetary cost of WSN devices makes them highly viable fordeployments at scale. The strong research activities that have been ongoingin the domain of WSNs for almost two decades moreover provide an excellentfoundation for the practical use of wireless sensors for energy monitoring.
The majority of today’s WSN platforms do not feature sensors for mains volt-age amplitudes or current flows by default. Versatile expansion headers, how-ever, make it possible to interface external peripherals. To foster research onenergy analytics I have thus designed TUCap, an embedded microcontroller-based systems that allows for the collection and processing of consumptiondata. Technical details about TUCap’s features and its data processing capabil-ities are presented in the following publication.

2.2 collecting load signatures using embedded systems 16
A. Reinhardt. “TUCap: A Sensing System to Capture and Process AppliancePower Consumption in Smart Spaces.” In: Proceedings of the 16th GI/ITG KuVSFachgespräch “Sensornetze” (FGSN). 2017, pp. 31–34.
At the heart of TUCap is an extension board that relies on an Analog-to-Digital Converter (ADC) which allows for the synchronous sampling ofvoltage and current signals at 36 kHz sampling rate and 24 bits of resolution.Thus, it enables the collection of microscopic load signatures, and harmonicsup to the 360
th order can be analyzed. Through the choice of transducers(a clip-on current transformer and a voltage transformer with CEE 7/16
“Europlug” connector), its non-instrusive installation is facilitated. The TUCapsensor interface is connected to an attached microcontroller board via aSerial Peripheral Interface (SPI) bus connection. A photography of the sensorinterface is shown in Figure 2.2.
The buffering, processing, and transmission of collected voltage and currentreadings is the task of an attached microcontroller platform. Without loss ofgenerality, a Teensy 3.22 device has been used in the prototypical evaluationof TUCap. Based on a 72 MHz ARM Cortex-M4 microcontroller with 256 kB ofFlash memory and 64 kB of RAM, the Teensy platform natively supports SPI
communications at up to 25 MHz frequency. Thus, it can retrieve and buffersensor readings in real-time; even real-time data processing is possible to alimited extent. In fact, a supplementary study on the similarity of consecu-tive voltage and current waveforms, also part of the publication, has demon-strated their high resemblance, making them well-suited for compression. Insummary, TUCap is a key enabling component for load signature collection onembedded systems and the basis for the contributions presented in Section 2.3.
ADC
Current input
Voltage input
Load resistors
Crystal
Power connection
Data connection
Figure 2.2: Key components on the TUCap sensor interface board [Rei17b].
2A technical description of the device is available at https://www.pjrc.com/teensy/

2.3 load signature compression 17
2.3 load signature compression
The information content in microscopic load signatures is significantly greaterthan in macroscopic load signatures [LES+14; TSB+14]. Thus, the use ofmicroscopic features is strongly favorable to tap the full potential of energyinformatics. Their demand for storage, however, is non-negligible. Whilereadings collected once per second amount to a total of 86,400 samples perday, more than 3 billion data points are collected when collecting samplesat a rate of 36 kHz. At an amplitude resolution of 24 bits per sample, thisamounts to a storage demand of almost 10 gigabytes per day, as comparedto slightly more than 250 kilobytes for the secondly interval. At the same time,the repetitive nature of current and voltage waveforms (cf. Figure 2.1) showsonly little variations between successive mains periods. This has motivatedthe investigation to what extent a compression of subsequent waveforms ispossible, which has been documented in the following publication:
A. Reinhardt. “Adaptive Load Signature Coding for Electrical ApplianceMonitoring over Low-Bandwidth Communication Channels.” In: Proceedingsof the 5th IFIP Conference on Sustainable Internet and ICT for Sustainability(SustainIT). 2017, pp. 1–8.
The key contribution of aforementioned paper is ALSCEAM, a schemefor the adaptive compression of microscopic load signatures. In the paper,I initially conducted an assessment of the compressibilty of load signaturesby converting them into different time series data representations: IEEE 754
floating-point numbers, as Comma-Separated Values (CSV), and RIFF WAVE(PCM data). A subsequent assessment of their compressibility with establisheddata compression tools (ZIP, bzip2, FLAC) has demonstrated savings in excessof 99.5%, yet only when sufficiently many waveform periods were availablefor compression. When only a single waveform or the concatenation of 120
mains periods were used for analysis, the savings dropped to 15–80%. In fact,in some configurations compression losses even occurred, i.e., the compressedoutput was larger in size than the input data. Moreover, the bzip2 compressionalgorithms is documented to require at least 400 kilobytes of RAM; it thusvastly exceeds the capacity available on the TUCap platform (cf. Section 2.2).
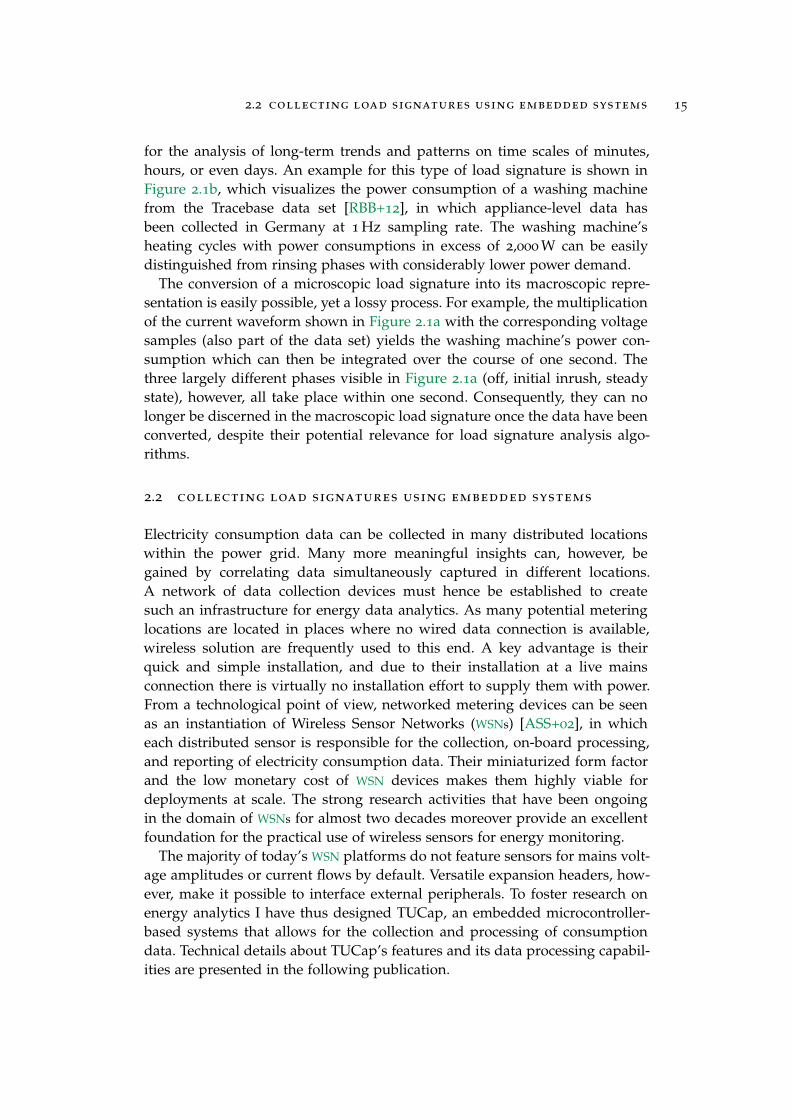
ALSCEAM instead relies on the concept of omitting repetitive waveformswithout significant variations from their transmission altogether. To this end,the waveform of one period of the quantity of interest (voltage or current) isbuffered initially. A dissimilarity metric based on the Root-Mean-Square Error(RMSE) to the stored data is computed for all subsequently recorded waveforms.Newly collected waveforms are only transmitted when their dissimilarity tothe previously recorded waveform exceeds a threshold ρth. The effect ofapplying ALSCEAM is visualized in Figure 2.3. Instead of transmitting datafor all 120 mains periods, only values for 10, 6, or 4 mains periods are reportedwhen applying ALSCEAM, leading to a reduction of the data by 91.7–96.7%.

2.3 load signature compression 18
Sample number5000 10000 15000 20000 25000 30000 35000 40000 45000 50000 55000
Cur
rent
[A]
-2
-1
0
1
2
(a) Current consumption of a compact fluorescent lamp for a duration of two seconds, takenfrom the PLAID data set [GGK+14] (file 3.csv). Note that a negative peak overshoot atsampling point 5,399 has been omitted for improved visual clarity.
Sample0 250
10x
Sample0 250
1x
Sample0 250
1x
Sample0 250
1x
Sample0 250
2x
Sample0 250
1x
Sample0 250
1x
Sample0 250
2x
Sample0 250
13x
Sample0 250
88x
(b) Application of ALSCEAM to decompose the trace shown above into repetitive currentconsumption waveform periods using sensitivity value ρth=0.25.
Sample0 250
10x
Sample0 250
1x
Sample0 250
2x
Sample0 250
3x
Sample0 250
3x
Sample0 250
101x
(c) Decomposition of the trace with a less strict similarityrequirement (ρth=0.45).
Sample0 250
10x
Sample0 250
1x
Sample0 250
8x
Sample0 250
101x
(d) Decomposition of the trace withρth=0.6.
Figure 2.3: Application of ALSCEAM to separate a microscopic load signature intosimilar repetitive waveforms. The number of occurrences of the waveformsis annotated in the top-right corner of each diagram [Rei17a].
A complementary approach to reduce the traffic resulting from the transmis-sion of uncompressed macroscopic load signature data is presented in:
A. Reinhardt and S. Koessler. “PowerSAX: Fast Motif Matching in Dis-tributed Power Meter Data Using Symbolic Representations.” In: Proceedingsof the 9th IEEE International Workshop on Practical Issues in Building Sensor Net-work Applications (SenseApp). 2014, pp. 531–538.
The proposed approach, named PowerSAX, is conceptually similar toALSCEAM in the sense that it is based on the detection of previously observedconsumption patterns. Its operation on macroscopic data, however, imposesdifferent boundary conditions to be considered. While the periodic nature ofcurrent and voltage waveforms can be analyzed in-depth when microscopicdetail is available, macroscopic load signatures lack such short-term patterns.Instead, a different type of repetitive patterns can be observed for numerousdevice types: Many appliances, particularly white goods, operate according toa pre-defined sequence of (internal) states. The macroscopic load signature ofthe washing machine visualized in Figure 2.1b can, e.g., be expected to repeatin the same fashion for every operation of the appliance. Such devices alsooften have operation durations on the order of minutes or even hours (thewashing cycle in Figure 2.1b takes over two hours to complete).

2.4 remote re-configuration of data collection devices 19
0 500 1000 1500 2000 2500Power (watts)
[0,1] → B
(1,110] → C
(-∞,0) → A
(2008,2125] → E
(2125,3680] → F (3680, ∞) → G
(110,2008] → D
Figure 2.4: Histogram of the power consumption values of a dishwasher appliance,with cluster boundaries and corresponding symbol annotations [RK14].
Like ALSCEAM, PowerSAX has been designed with a its applicability onembedded sensing platforms in mind. In particular, it mitigates memory con-straints by operating on symbolic approximations [LKL+03] of the macro-scopic load signature data instead of processing raw consumption readings.The computation of the mapping between consumption data and correspond-ing symbolic value is determined through a density-based clustering of theobserved readings. To this end, the histogram of an appliance’s power con-sumption is being computed, and clusters of similar consumption values aredetermined using the MeanShift algorithm [CM02]. An example for this in-ternal conversion process is shown in Figure 2.4, which shows the clusteredhistogram of a dishwasher’s power consumption and the mapping of clustersto a symbolic alphabet with characters A–G. This alphabet generation processis executed during an initialization phase and adapts the symbol mapping tothe consumption characteristsics of the attached appliance(s). As a positiveside effect of histogram clustering, PowerSAX is also mostly immune againstmeasurement noise.
During its regular operation, newly collected macroscopic consumptionvalues are converted to their symbolic representations according to thepreviously determined mapping. Thereafter, the most recent symbols in asliding time window are compared to a set of previously stored symbolicsequences. Once a known symbolic sequence pattern is found in the stream ofsymbols, a corresponding message is transmitted to notify stakeholders aboutthe occurrence of the underlying event (e.g., “dishwasher cycle completed”).The potential for efficient binary encodings of the symbol sequences, combinedwith the early termination of the symbol sequence matching as soon asa mismatching symbol is detected further minimize PowerSAX’s resourcedemand and accelerate its operation.
2.4 remote re-configuration of data collection devices
When data sources for energy analytics applications are connected throughlow-power wireless links, bandwidth utilization considerations are of majorconcern. The data rates of protocols currently used for networked embeddedsystems (such as IEEE 802.15.4 [IEEE06]) often range below 1 Mbps, and packet
2.4 remote re-configuration of data collection devices 20
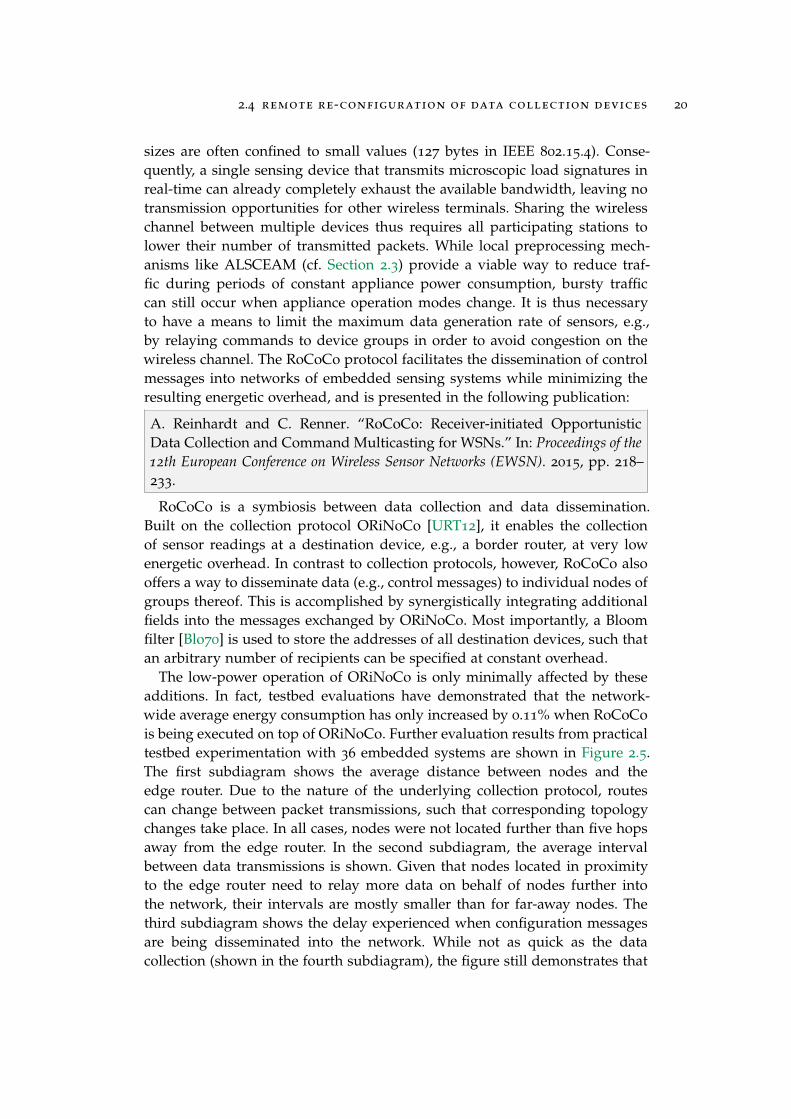
sizes are often confined to small values (127 bytes in IEEE 802.15.4). Conse-quently, a single sensing device that transmits microscopic load signatures inreal-time can already completely exhaust the available bandwidth, leaving notransmission opportunities for other wireless terminals. Sharing the wirelesschannel between multiple devices thus requires all participating stations tolower their number of transmitted packets. While local preprocessing mech-anisms like ALSCEAM (cf. Section 2.3) provide a viable way to reduce traf-fic during periods of constant appliance power consumption, bursty trafficcan still occur when appliance operation modes change. It is thus necessaryto have a means to limit the maximum data generation rate of sensors, e.g.,by relaying commands to device groups in order to avoid congestion on thewireless channel. The RoCoCo protocol facilitates the dissemination of controlmessages into networks of embedded sensing systems while minimizing theresulting energetic overhead, and is presented in the following publication:
A. Reinhardt and C. Renner. “RoCoCo: Receiver-initiated OpportunisticData Collection and Command Multicasting for WSNs.” In: Proceedings of the12th European Conference on Wireless Sensor Networks (EWSN). 2015, pp. 218–233.
RoCoCo is a symbiosis between data collection and data dissemination.Built on the collection protocol ORiNoCo [URT12], it enables the collectionof sensor readings at a destination device, e.g., a border router, at very lowenergetic overhead. In contrast to collection protocols, however, RoCoCo alsooffers a way to disseminate data (e.g., control messages) to individual nodes ofgroups thereof. This is accomplished by synergistically integrating additionalfields into the messages exchanged by ORiNoCo. Most importantly, a Bloomfilter [Blo70] is used to store the addresses of all destination devices, such thatan arbitrary number of recipients can be specified at constant overhead.
The low-power operation of ORiNoCo is only minimally affected by theseadditions. In fact, testbed evaluations have demonstrated that the network-wide average energy consumption has only increased by 0.11% when RoCoCois being executed on top of ORiNoCo. Further evaluation results from practicaltestbed experimentation with 36 embedded systems are shown in Figure 2.5.The first subdiagram shows the average distance between nodes and theedge router. Due to the nature of the underlying collection protocol, routescan change between packet transmissions, such that corresponding topologychanges take place. In all cases, nodes were not located further than five hopsaway from the edge router. In the second subdiagram, the average intervalbetween data transmissions is shown. Given that nodes located in proximityto the edge router need to relay more data on behalf of nodes further intothe network, their intervals are mostly smaller than for far-away nodes. Thethird subdiagram shows the delay experienced when configuration messagesare being disseminated into the network. While not as quick as the datacollection (shown in the fourth subdiagram), the figure still demonstrates that

2.4 remote re-configuration of data collection devices 21
0
2
4
6ho
pco
unt
0
20
40
60
avg.
data
send
inte
rval
(s)
0
20
40
60
80
100
com
man
dde
lay
(s)
5 2 53 1 4 45 9 46 41 49 16 8 56 42 40 18 44 52 21 14 20 17 22 28 32 29 33 34 30 70 68 69 65 64 66
0
2
4
6
8
node ID
confi
rmat
ion
dela
y(s
)
Figure 2.5: Synoptic visualization of four key evaluation parameters when runningRoCoCo in a testbed setting with 36 devices. Nodes are ordered by theiraverage hop count to the network edge (first subfigure). The secondsubfigure shows the average interval at which packets (i.e., collectionmessages and command confirmations) are being sent. The remaining twosubfigures visualize the time required to disseminate the command to eachdevice, as well as the time taken to confirm receipt of the command to theedge router. Error bars indicate the standard deviation [RR15].
dissemination of control messages for up to four hops is mostly accomplishedin less than one minute. The fourth and last subfigure finally shows the timetaken to confirm the receipt of the configuration message back to the edgerouter. Given that this traffic follows the same direction as the data that is beingcollected by the sensor devices, the forwarding process terminates quickly, inless than eight seconds for the given topology.
In conclusion, RoCoCo serves as a substrate for wireless networks ofembedded systems which facilitates quick data collection while allowing forthe configuration of nodes at extremely low energy overhead. It is sufficientlylightweight to be executed on sensor devices with only 48 kilobytes of programmemory and 10 kilobytes of RAM, thus well-suited for its application in energyinformatics data collection scenarios.

2.5 in-network data processing 22
2.5 in-network data processing
Up to this point, only devices with identical hardware configurations havebeen considered in the presented contributions. The upcoming vision of theInternet of Things (IoT) will entail a drastic change to this assumption. Smartobjects with embedded networking capabilities will permeate our everydaylives and enable many currently unthinkable services and novel interactionparadigms. Heterogeneous in their nature, IoT devices will not only servedifferent purposes, but be equipped with different sensing, processing, storage,and communication capabilities.
As a result of the exponentially growing number of devices, an increasedsaturation of wireless communication links is highly likely to be observed. Be-sides the option to transition to new communication technologies like the fifthgeneration of mobile communication systems (5G) [PSS16], technologies to in-tegrate existing devices and infrastructures are vital for the success of the IoT.One concept from the domain of WSNs stands out in this regard, given its im-plicit applicability on heterogeneous systems: In-network processing relies on theuse of computational power available within the network [CLX+06]. Leverag-ing processing capabilities inside the network of embedded systems dispenseswith the need to fully forward a sensor’s collected data to the network edge,possibly relayed by multiple intermediate stations. Instead, devices with suf-ficient computational energy reserves can apply data processing algorithmswithin the network to reduce the traffic volume. As a side effect, the negativeeffects of energy holes [LM07] can be reduced when in-network processing isapplied.
Existing works on in-network processing partially consider device hetero-geneity, yet primarily with regard to a device’s residual energy. Through shift-ing resource-intensive processing tasks away from nodes that are approachingthe depletion of their energy budget, a prolonged network runtime can oftenbe accomplished. However, methods to compensate for other dimensions ofdevice heterogeneity have rarely been considered in related work, despite theexpectation that networks composed of devices with entirely different specifi-cations are expected to emerge. This motivated the contributions of the follow-ing paper:
A. Reinhardt and D. Burgstahler. “Exploiting Platform Heterogeneity inWireless Sensor Networks by Shifting Resource-Intensive Tasks to DedicatedProcessing Nodes.” In: Proceedings of the 14th International Symposium on aWorld of Wireless, Mobile and Multimedia Networks (WoWMoM). 2013, pp. 1–9.
The paper presents an investigation into the facets of device heterogeneity,by conducting an in-depth comparison of six widely used hardware platformsfor embedded sensing systems with regard to their computational capabilities.Four data processing algorithms that can be employed to process and/orreduce wireless traffic have been implemented on each of the target systems,

2.5 in-network data processing 23
FFT sorensen 1024
FFT 1024
0100200300400500600700800900
Im
ote
2
I
ng
a
M
ull
e v
5.2
S
un
SP
OT
T
elo
sB
X
M1
00
0
En
erg
yco
nsu
mp
tio
n [m
J]
(a) Fast Fourier Trans-form (FFT).
LZSS
[mJ]
0
50
100
150
200
250
Im
ote
2
I
ng
a
M
ull
e v
5.2
S
un
SP
OT
T
elo
sB
X
M1
00
0
En
erg
yco
nsu
mp
tio
n [m
J](b) LZSS compression.
05
10152025303540
Im
ote
2
I
ng
a
M
ull
e v
5.2
S
un
SP
OT
T
elo
sB
X
M1
00
0
En
erg
yco
nsu
mp
tio
n
[mJ]
(c) Twofish encryption.
Fibo recu 25
0
50
100
150
200
Im
ote
2
I
ng
a
M
ull
e v
5.2
S
un
SP
OT
T
elo
sB
X
M1
00
0
En
erg
yco
nsu
mp
tio
n [m
J]
(d) Recursive Fibonacciseries calculation.
Figure 2.6: Energy demand for the execution of four benchmarking functions on eachof the six embedded sensing platforms [RB13].
and the corresponding energy consumptions for their execution been used asa benchmark. Results are visualized in Figure 2.6 and demonstrate the hugelyvarying energy demands to perform the same operation on different devices.In the paper, this observation is followed by a simulative analysis to determinesituations in which task migration between deployed devices is meaningful,and to what extent energy can be saved through collaborative data processing.A key insight was that there are many situations where lightweight systemswith inefficient processors can benefit from the data processing in their vicinity,leading to network-wide energy savings from 46–77%.
This result also allows for conclusions to be drawn on the successfulapplication of energy informatics. As soon as buildings will experience astronger penetration with IoT systems, setting up dedicated networks to collectelectricity consumption information will no longer be necessary. Instead,sensors for voltage, current, and relevant environmental parameters canbe expected to seamlessly integrate into this IoT infrastructure. The studyconducted in the presented paper has effectively proven that there will bepotential in in-network data processing, particularly when heterogeneousdevices are available. The resultant possible traffic reductions will stronglycater to the requirements of energy informatics.

3P R O C E S S I N G E L E C T R I C I T Y C O N S U M P T I O N D ATA
Besides investigating methodologies and instrumentation approaches to col-lect electricity consumption information in an efficient and scalable way, theirprocessing also takes a key role in energy informatics. In existing literature,both macroscopic and microscopic load signatures have been found to containa large information content. By extracting such information, a variety of ser-vices for all involved stakeholders in the smart grid are conceivable. Firstly,the user’s comfort and convenience can be improved by learning typical us-age patterns of appliances and actuating them autonomously according tothe user’s preferences. At the same time, the automated deactivation of ap-pliances to reduce a household’s energy consumption while maintaining theuser’s satisfaction becomes possible. Secondly, services to the advantage ofutility companies can be realized, such as the prediction of future electricitydemand. Such information can be used in the capacity planning of transmis-sion lines and to estimate the demand for generation. Thirdly and lastly, func-tionalities to ensure and improve safety and security in both residential andindustrial settings can be based on consumption data. By finding outliers inconsumption data, anomalies in household activities and manufacturing pro-cesses alike can be recognized early and relevant stakeholders be notified. Ihave made contributions to three current research challenges in energy dataprocessing: Appliance recognition, load forecasting, and anomalous consump-tion detection. The contents of the corresponding scientific publications aresummarized in the following sections. Lastly, Section 3.4 introduces AMBAL,a tool to synthetically generate load signatures, and thus enlarge the body ofavilable data sets (cf. Table 1.1 on page 8) significantly. While not directly atechnique for load signature processing, AMBAL facilitates the generation oflarge and well-annotated data sets for the evaluation of such algorithms.
3.1 appliance recognition
One of the principal services in energy informatics is the capability to rec-ognize electrical appliances based on their microscopic and/or macroscopicconsumption characteristics. Expressive features are required to fully distin-guish consumption patterns between appliances. Most often, these are basedon the characteristic power consumption patterns, the temporal patterns ofconsumption changes, and possibly the prevailing environmental conditionsduring appliance use. The most prominent application scenario for appliancerecognition is its use in NILM, i.e., the recognition of currently operated appli-ances from the aggregate household load.
25

3.1 appliance recognition 26
The extraction of features from collected load signatures to is also theprincipal contribution of the following publication:
A. Reinhardt, P. Baumann, D. Burgstahler, M. Hollick, H. Chonov, M.Werner, and R. Steinmetz. “On the Accuracy of Appliance IdentificationBased on Distributed Load Metering Data.” In: Proceedings of the 2nd IFIPConference on Sustainable Internet and ICT for Sustainability (SustainIT). 2012,pp. 1–9.
Contrary to the majority of research works that try to tackle NILM from aholistic viewpoint (i.e., through the analysis of aggregate consumption traces),the paper addresses an important sub-challenge, namely the recognition ofsingle appliances from their macroscopic load signatures. Even though thisproblem is less complex to solve than full NILM, several research challengeshave been determined during the research undertaken for this paper. Firstand foremost, characteristic and expressive features are required that allowmachine learning algorithms to discriminate between appliances, with ideallyno confusion between appliance types. Thus, a key contribution of the paperis the investigation of potential features. Thorugh feature engineering fromthe domains of electrical engineering, information technology, and computerscience and engineering, a selection of 517 candidate features has beendetermined.
Features have been considered in four principal areas; a selection of thefeatures in each category is briefly summarized as follows:
1. Temporal appliance behavior: Features in this category describe applianceactivities with regard to their timings. To this end, both the durationsof active periods as well as the intervals in-between active periods areconsidered. Moreover, features like the number of appliance activationsper day fall into this category.
2. Power and energy consumption: For both power and energy (i.e., theintegration of power consumption over time) features are extracted thatmodel average and extremal values. Also, a division of the 24 hours ofa day into 144 segments of ten minutes length each is performed, andpower and energy consumption values for these segments are consideredas features.
3. Power consumption shape: The way how an appliance’s power consump-tion evolves over time during its activity is also considered as a featureto describe appliances. In particular, the smoothness of a device’s loadsignature and the amplitude changes of power consumption are consid-ered to discriminate between appliances.
4. Noise level and other statistical features: Some appliances exhibit periodici-ties in their power consumptions. Thus, through a transformation to thefrequency domain, such recurrences are identified and used to recognizethe type of the underlying appliance.

3.1 appliance recognition 27
Table 3.1: Ten most relevant macroscopic features according to their information gain.
rank feature
1 maximum power consumption in last daily activity phase
2 maximum power consumption throughout the day
3 average power consumed during all daily activity phases
4 average power demand for the complete day
5 average energy demand for appliance activity phases
6 highest power consumption observed during activity phases
7 lowest power consumption observed during activity phases
8 average power consumption during activity phases
9 median duration of activity phases
10 highest encountered drop in power consumption
In order to assess to what extent these features are expedient to recognizeappliance types, a supplementary contribution was needed. At the time ofthe paper’s publication, only a very small number of data sets of macroscopicload signatures was available (cf. Table 1.1). Also, macroscopic traces were onlyavailable for a small subset of the appliance types, predominantly IT systems(desktop computers, monitors, printers, and network switches) [KGH+10].To overcome this limitation, a data set called tracebase3 has been collectedwithin the scope of the paper’s research. Composed of more than 1,200
macroscopic load signature traces from more than 100 appliances, the data sethas established itself in the NILM community and been used as the foundationfor numerous subsequent research works.
Through the combination of the collected load signatures with the candidatefeatures, a system design for appliance recognition has been developed thatsucceeded in discriminating between 33 appliance types at an accuracy of95.5%. A supplementary analysis of the information gain of the used candidatefeatures has moreover been conducted, with its results shown in Table 3.1.Thus, a classification of appliances has been demonstrated to be possible, yetinsights for future improvements were also determined. For example, deviceswith similar operational times and consumption ranges (such as various lampsor computer monitors of different types) were often confused with each other.Also, the time window used in the presented approach has always been chosenas one day, i.e., 24 hours. This might be sufficient for many practical applicationscenarios, given that it is rather uncommon to connect electrical appliances todifferent outlets every time they are being used. However, other applicationsmight require faster reactions to changed consumption characteristics.
3Available for download at http://www.tracebase.org

3.1 appliance recognition 28
0 40 80 120−0.5
0
0.5
1
1.5
Time [ms]
Cur
rent
[A]
0 100 200 300 400 5000
0.05
0.1
0.15
Frequency [Hz]
|I(f)|
(a) Halogen lamp.
0 40 80 120−1.5
−1
−0.5
0
0.5
1
1.5
Time [ms]
Cur
rent
[A]
0 100 200 300 400 5000
0.01
0.02
0.03
0.04
0.05
Frequency [Hz]
|I(f)|
(b) Fast Ethernet switch.
0 40 80 120−0.4
−0.2
0
0.2
0.4
Time [ms]
Cur
rent
[A]
0 100 200 300 400 5000
0.05
0.1
0.15
0.2
0.25
Frequency [Hz]
|I(f)|
(c) Pedestal fan.
Figure 3.1: Inrush current waveforms and corresponding frequency spectra (as com-puted by the data collection platform) of three appliances [RBZ+12].
To address the aforementioned limitation, I have conducted further researchinto accelerating the appliance recognition step. For this purpose, the useof microscopic load signatures has emerged as a viable option. Collectedat a much higher temporal resolution, more information content can beextracted from short segments already. An corresponding approach towardsthe appliance detection based on high-resolution data is documented in:
A. Reinhardt, D. Burkhardt, M. Zaheer, and R. Steinmetz. “Electric Appli-ance Classification Based on Distributed High Resolution Current Sensing.”In: Proceedings of the 7th IEEE International Workshop on Practical Issues in Build-ing Sensor Network Applications (SenseApp). 2012, pp. 1003–1009.
The paper describes how microscopic current consumption waveformsare being collected by means of a SmartMeter.KOM [RBM+11] sensor ata sampling rate of 1.6 kHz. The resource limitations of the used platform(32 kilobytes of program memory and 2.56 kilobytes of RAM), however, limitthe data processing to the computation of a Fast Fourier Transform (FFT)over a duration of 16 mains periods. Subsequently, the amplitudes of thefundamental frequency as well as the first four odd harmonics (i.e., 150 Hzthrough 450 Hz for a mains frequency of 50 Hz) are forwarded to an externalsystem for storage and analysis. The analysis of spectral information duringan appliance’s initial activation and its steady-state operation showed thatboth greatly vary between devices, and thus qualify as distinctive features forthe application of machine learning. Based on further results of the analysesconducted in the paper, it could be shown that the spectra of inrush currentsare slightly more expressive than those during steady-state operation. Theirvisualization in the time and frequency domain is thus shown in Figure 3.1.
3.2 consumption prediction 29
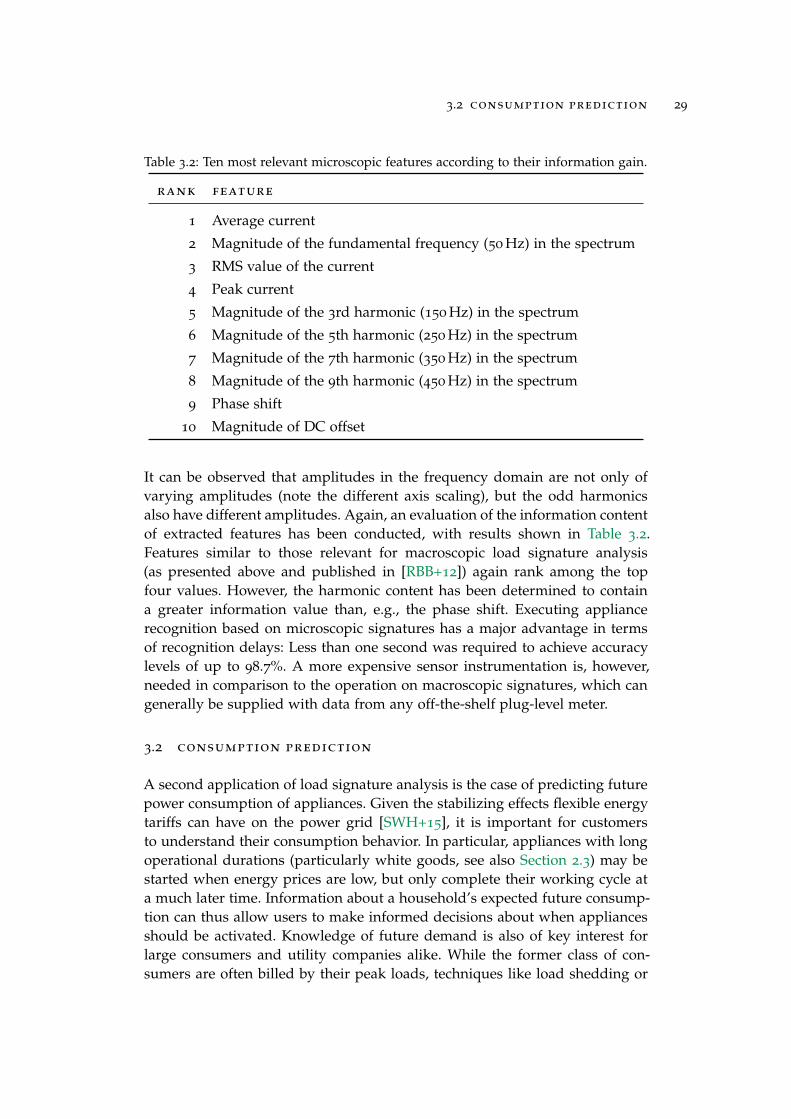
Table 3.2: Ten most relevant microscopic features according to their information gain.
rank feature
1 Average current
2 Magnitude of the fundamental frequency (50 Hz) in the spectrum
3 RMS value of the current
4 Peak current
5 Magnitude of the 3rd harmonic (150 Hz) in the spectrum
6 Magnitude of the 5th harmonic (250 Hz) in the spectrum
7 Magnitude of the 7th harmonic (350 Hz) in the spectrum
8 Magnitude of the 9th harmonic (450 Hz) in the spectrum
9 Phase shift
10 Magnitude of DC offset
It can be observed that amplitudes in the frequency domain are not only ofvarying amplitudes (note the different axis scaling), but the odd harmonicsalso have different amplitudes. Again, an evaluation of the information contentof extracted features has been conducted, with results shown in Table 3.2.Features similar to those relevant for macroscopic load signature analysis(as presented above and published in [RBB+12]) again rank among the topfour values. However, the harmonic content has been determined to containa greater information value than, e.g., the phase shift. Executing appliancerecognition based on microscopic signatures has a major advantage in termsof recognition delays: Less than one second was required to achieve accuracylevels of up to 98.7%. A more expensive sensor instrumentation is, however,needed in comparison to the operation on macroscopic signatures, which cangenerally be supplied with data from any off-the-shelf plug-level meter.
3.2 consumption prediction
A second application of load signature analysis is the case of predicting futurepower consumption of appliances. Given the stabilizing effects flexible energytariffs can have on the power grid [SWH+15], it is important for customersto understand their consumption behavior. In particular, appliances with longoperational durations (particularly white goods, see also Section 2.3) may bestarted when energy prices are low, but only complete their working cycle ata much later time. Information about a household’s expected future consump-tion can thus allow users to make informed decisions about when appliancesshould be activated. Knowledge of future demand is also of key interest forlarge consumers and utility companies alike. While the former class of con-sumers are often billed by their peak loads, techniques like load shedding or
3.2 consumption prediction 30
0 500 1000 1500 20000
1000
2000
Time (seconds)
Pow
er (
wat
ts)
(a) Traces aligned by starting time.
176 663 820 1090 13381521 21450
1000
2000
Time (seconds)
Pow
er (
wat
ts)
(b) Traces aligned at each point where major changes in consumption occur.
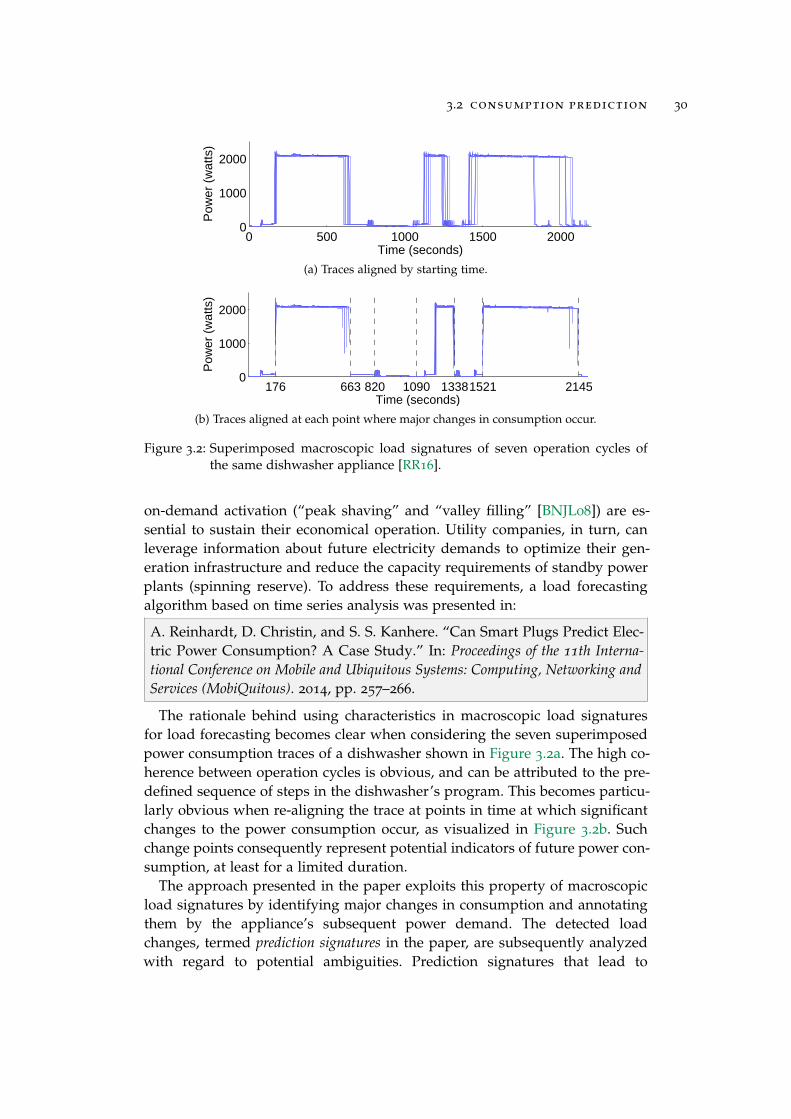
Figure 3.2: Superimposed macroscopic load signatures of seven operation cycles ofthe same dishwasher appliance [RR16].
on-demand activation (“peak shaving” and “valley filling” [BNJL08]) are es-sential to sustain their economical operation. Utility companies, in turn, canleverage information about future electricity demands to optimize their gen-eration infrastructure and reduce the capacity requirements of standby powerplants (spinning reserve). To address these requirements, a load forecastingalgorithm based on time series analysis was presented in:
A. Reinhardt, D. Christin, and S. S. Kanhere. “Can Smart Plugs Predict Elec-tric Power Consumption? A Case Study.” In: Proceedings of the 11th Interna-tional Conference on Mobile and Ubiquitous Systems: Computing, Networking andServices (MobiQuitous). 2014, pp. 257–266.
The rationale behind using characteristics in macroscopic load signaturesfor load forecasting becomes clear when considering the seven superimposedpower consumption traces of a dishwasher shown in Figure 3.2a. The high co-herence between operation cycles is obvious, and can be attributed to the pre-defined sequence of steps in the dishwasher’s program. This becomes particu-larly obvious when re-aligning the trace at points in time at which significantchanges to the power consumption occur, as visualized in Figure 3.2b. Suchchange points consequently represent potential indicators of future power con-sumption, at least for a limited duration.
The approach presented in the paper exploits this property of macroscopicload signatures by identifying major changes in consumption and annotatingthem by the appliance’s subsequent power demand. The detected loadchanges, termed prediction signatures in the paper, are subsequently analyzedwith regard to potential ambiguities. Prediction signatures that lead to

3.2 consumption prediction 31
0 20 40 60 80 100
Water kettleWater boiler
Washing machineTumble dryer
ToasterRefrigerator
PrinterMicrowave oven
LampIron
FreezerDishwasher
Cooking stoveCoffee maker
Alarm clock
Percentage of activity segments
Correct prediction Incorrect prediction No prediction
(a) Distribution of predictions when using pre-diction signature databases trained to indi-vidual appliance types.
0 20 40 60 80 100
Water kettleWater boiler
Washing machineTumble dryer
ToasterRefrigerator
PrinterMicrowave oven
LampIron
FreezerDishwasher
Cooking stoveCoffee maker
Alarm clock
Percentage of activity segments
Correct prediction Incorrect prediction No prediction
(b) Distribution of predictions when using acommon database of prediction signaturesfor all appliance types.
Figure 3.3: Fraction of correct, incorrect, and missing predictions for 15 appliancetypes; in both cases, the prediction horizon was set to 120 seconds [RCK14].
inconsistent subsequent demands are purged, given that they do not allowfor forecasts. In turn, prediction signatures that are always followed by thesame (or a sufficiently similar) power consumption pattern, are retained.Due to the limited scale of the data set used in the evaluations, a thirdclass of prediction signatures exist, namely those that occur exactly once inmacroscopic load signatures. Such signatures can be seen as an artifact of thedata set’s limitations. Thus, they are not considered in the evaluation to avoida falsification of the results.
It also needs to be noted that variations in appliance activity durations limitthe time for which predications can be made reliably. Thus, different predictionhorizons, i.e., times for which future consumption annotations are being made,have been evaluated. Selected results for two scenarios are shown in Figure 3.3.In Figure 3.3a, the results are plotted when prediction signatures are extractedand evaluated for each considered appliance type separately. The analysis ishence based on 15 sets of signatures that occur more than once in the trainingdata and lead to consistent forecasting results. The attained results show that alarge fraction of correct forecasts are possible for many appliance types, underthe precondition that only predication signatures for the given type are beingused. In contrast to the class-wise analysis, Figure 3.3b shows the outcomeswhen a single prediction signature database is created for all appliance types.Once all ambiguous prediction signatures have been purged, many moreincorrect predictions result than in the class-wise analysis. The reason lieswithin the similarity of power consumption changes across appliance types,yet with different subsequent consumption behavior. An accurate fitting of theprediction signature database to the appliance(s) under consideration is thuscrucial for successful predictions.

3.3 anomaly detection 32
3.3 anomaly detection
A third use case for energy analytics is the detection of consumption anomalies.Analogous to the forecasting future electricity demands, anomaly detection isof relevance for both consumers and suppliers of electrical energy. To TSOs,DSOs, and utility companies, anomalous consumption can be an indicatorof faults in the power grid. In industrial sites, anomalies and in particulargradual shifts of consumption patterns are often indicative of the mechanicalwear of machinery [ORL+10]; thus, their detection is an enabling element forpredictive maintenance. Even in private homes, anomalies often either indicateimminent danger or at least an unusual behavior of the residents. The latter isparticularly of interest in Ambient Assisted Living (AAL) scenarios.
From a technical perspective, anomaly detection and load prediction sharemany commonalities. An expectation of future consumption is mandatoryto determine to what extent the actual consumption deviates from it. Ihave consequently presented insights into the recognition of consumptionanomalies based on the observation of regularities in load signatures in thefollowing work:
A. Reinhardt and D. Reinhardt. “Detecting Anomalous Electrical ApplianceBehavior based on Motif Transition Likelihood Matrices.” In: Proceedings ofthe IEEE International Conference on Smart Grid Communications (SmartGrid-Comm) Symposium on Data Management, Grid Analytics and Dynamic Pricing.2016, pp. 704–709.
In the work, again prediction signatures are being discovered in macroscopicload signature data. In contrast to the sole matching of such predictionsignatures, as performed in the work discussed in Section 3.2, the forecasts arenow being compared to an appliance’s actual consumption. In case projectedand actual power demand match up, the appliance is considered to exhibit aregular operation pattern. In contrast, once a mismatch between predictionand actual demand is detected, an event is signaled to inform interestedstakeholders about the occurrence. The paper builds on the concept of a motiftransition likelihood matrix, a multidimensional structure that maps predictionsignatures to the probabilities of future demand. Again, a conversion intosymbolic representations (cf. Section 2.3) is applied to macroscopic loadsignatures to reduce computational efforts. Symbol sequences of a fixed length,referred to as motifs, are subsequently extracted, and an analysis is conductedon the temporal distances of their occurrences. During a training phase, thesystem computes the probabilities of transitions between motifs and insertsthem into the transition likelihood matrix. A graphical visualization of theprobabilities for motif transitions from the motif AAAB is shown in Figure 3.4.The temporal offset between the motif occurrences is shown on the x-axis,whereas the probabilities of the given transition are cumulatively plotted onthe ordinate axis.
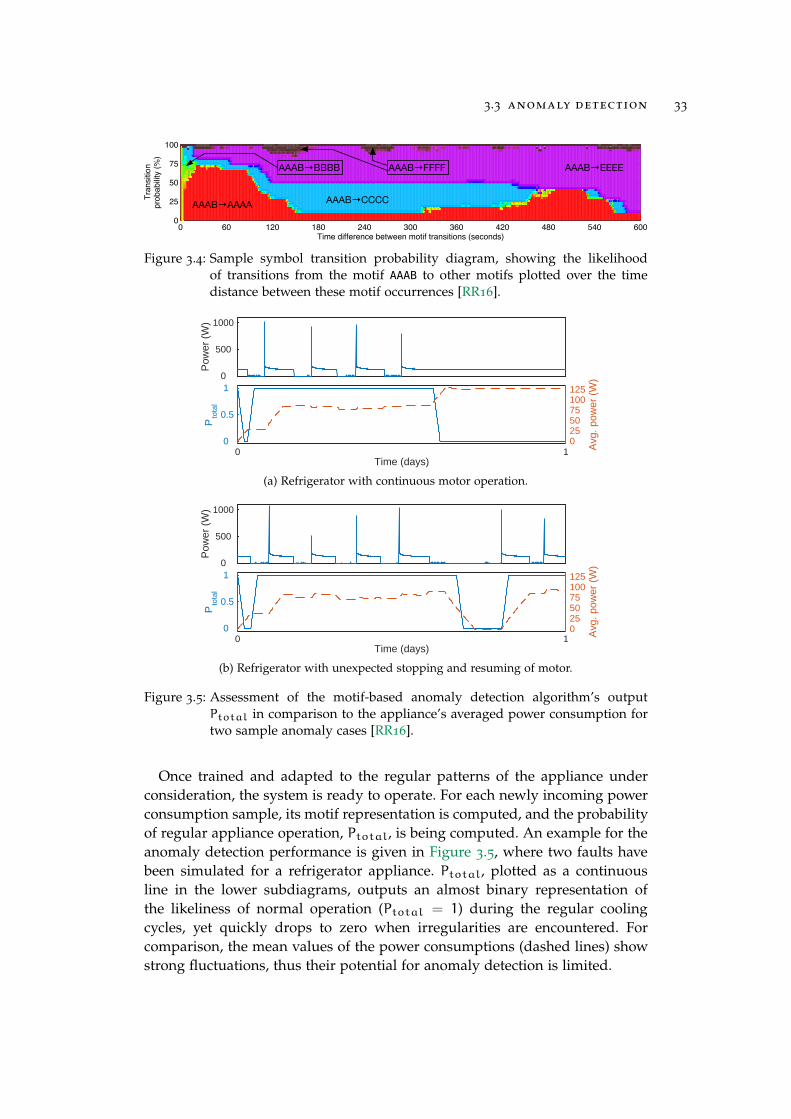
3.3 anomaly detection 33
0 60 120 180 240 300 360 420 480 540 6000
25
50
75
100Tr
ansi
tion
prob
abilit
y (%
)
Time difference between motif transitions (seconds)
AAAB→AAAA AAAB→CCCC
AAAB→EEEEAAAB→BBBB AAAB→FFFF
Figure 3.4: Sample symbol transition probability diagram, showing the likelihoodof transitions from the motif AAAB to other motifs plotted over the timedistance between these motif occurrences [RR16].
Pow
er (
W)
0
500
1000
Time (days)0 1
Pto
tal
0
0.5
1
Avg
. pow
er (
W)
0 25 50 75 100125
(a) Refrigerator with continuous motor operation.
Pow
er (
W)
0
500
1000
Time (days)0 1
Pto
tal
0
0.5
1
Avg
. pow
er (
W)
0 25 50 75 100125
(b) Refrigerator with unexpected stopping and resuming of motor.
Figure 3.5: Assessment of the motif-based anomaly detection algorithm’s outputPtotal in comparison to the appliance’s averaged power consumption fortwo sample anomaly cases [RR16].
Once trained and adapted to the regular patterns of the appliance underconsideration, the system is ready to operate. For each newly incoming powerconsumption sample, its motif representation is computed, and the probabilityof regular appliance operation, Ptotal, is being computed. An example for theanomaly detection performance is given in Figure 3.5, where two faults havebeen simulated for a refrigerator appliance. Ptotal, plotted as a continuousline in the lower subdiagrams, outputs an almost binary representation ofthe likeliness of normal operation (Ptotal = 1) during the regular coolingcycles, yet quickly drops to zero when irregularities are encountered. Forcomparison, the mean values of the power consumptions (dashed lines) showstrong fluctuations, thus their potential for anomaly detection is limited.

3.4 load modeling for automated evaluations 34
3.4 load modeling for automated evaluations
Many energy informatics research challenges are encountered by using toolsfrom the domain of artificial intelligence, in particular machine learning. Mostoften, one or more of the publicly available data sets (cf. Table 1.1) are beingused to evaluate the performance of newly developed algorithms and systems.Undiscovered annotation errors or incomplete data thus manifest themselvesnot only in the data sets, but also in all papers based upon them. In manycases, the limited scale of the data sets also expresses itself in an effect knownas overfitting. Overfitting takes place when machine learning algorithms adapttoo well to the characteristics of the training data set and can as a result nolonger be generalized to other, yet unseen, data. Mitigating the shortage of datasets is not trivial, given the efforts required to set up, operate, and maintainenergy data collection campaigns. Thus, other means to source input data forresearch and development purposes are needed. An approach that relies onthe modeling of macroscopic load signatures and their subsequent synthesisinto representative and annotated traces is presented in:
N. Buneeva and A. Reinhardt. “AMBAL: Realistic Load Signature Genera-tion for Load Disaggregation Performance Evaluation.” In: Proceedings of theIEEE International Conference on Smart Grid Communications (SmartGridComm)Symposium on Big Data Management and Analytics. 2017, pp. 443–448.
The developed system is a tool to analyze macroscopic load signaturesand derive accurate appliance-level power consumption models. Generatedmodels are composed of parametrizable basic building blocks, a conceptinitially presented by Barker et al. in [BKI+13]. Through their combination,appliance power consumption can be approximated to the desired accuracylevel. A generalization step used in the model-building process ensures thatrepresentative, yet compact, descriptions of consumption patterns are beingextracted for each modeled appliance.
AMBAL has been tested by modeling the consumption behavior of 24 appli-ances (14 from Tracebase [RBB+12] and 10 from ECO [BKC+14]). It could beobserved that for many appliance types (e.g., water kettle, refrigerator, freezer,microwave oven) models can be composed of less than five components, whilestill not exceeding a modeling error of 6%.
Furthermore, AMBAL has been augmented by a tool to synthesize formerlyextracted appliance consumption models into artificial, yet realistic-looking,traces for their use in testing and improving energy analytics algorithms.Moreover, by coupling AMBAL with a user activity models (following thework of Richardson et al. [RTI08]), the foundation for the generation of fullysynthetic, yet realistic-looking, aggregate consumption traces has been created.A visualization of the potential of this synergistic combination is shown inFigure 3.6. Models for 14 electrical household appliances have been derivedusing AMBAL, and recombined according to the activity models for a single-

3.4 load modeling for automated evaluations 35
person household as well as for a household that accommodates three persons.Besides the generation of time series data, AMBAL also outputs annotationsabout appliance de-/activations. The workflow for evaluating NILM algorithmsusing AMBAL was chosen as follows: A large number of appliance-level tracesare generated through AMBAL and forwarded to a software NILM tool callednilmtk4 for training its internal models. After that step, AMBAL is executedonce again to create a new set of synthetic macroscopic load signatures aswell as an aggregated trace that contains the summation of the loads ofall contributing devices. The latter trace is then forwarded to nilmtk fordisaggregation. In a final step, the disaggregated components are comparedagainst the appliance-level traces created by AMBAL. Through changing thenumber of traces that are generated and aggregated, input data of differentcomplexity levels [EPE15] can be used in the evaluation of NILM algorithmperformance.
4nilmtk is available for download at http://nilmtk.github.io

3.4 load modeling for automated evaluations 36
0
500
1000
1500
2000
2500
0 10000 20000 30000 40000 50000 60000 70000 80000
Po
wer
(W
att)
Time (s)
(a) Synthetic aggregate consumption trace for a household with one occupant.
0
1000
2000
3000
4000
5000
6000
0 10000 20000 30000 40000 50000 60000 70000 80000
Po
wer
(W
att)
Time (s)
(b) Synthetic aggregate consumption trace for a household with three occupants.
Figure 3.6: Examples of aggregated daily power consumption traces generated usinga set of 14 appliances with appliance usage times defined by user activitymodels [Bun16].
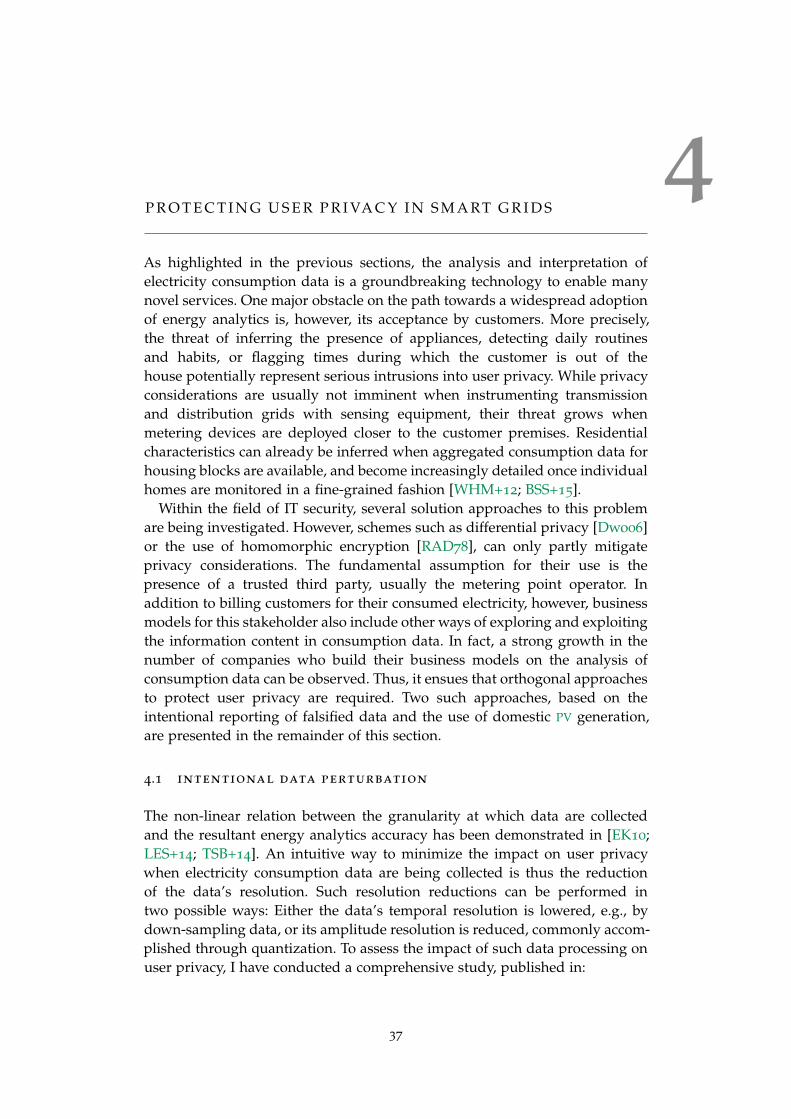
4P R O T E C T I N G U S E R P R I VA C Y I N S M A RT G R I D S
As highlighted in the previous sections, the analysis and interpretation ofelectricity consumption data is a groundbreaking technology to enable manynovel services. One major obstacle on the path towards a widespread adoptionof energy analytics is, however, its acceptance by customers. More precisely,the threat of inferring the presence of appliances, detecting daily routinesand habits, or flagging times during which the customer is out of thehouse potentially represent serious intrusions into user privacy. While privacyconsiderations are usually not imminent when instrumenting transmissionand distribution grids with sensing equipment, their threat grows whenmetering devices are deployed closer to the customer premises. Residentialcharacteristics can already be inferred when aggregated consumption data forhousing blocks are available, and become increasingly detailed once individualhomes are monitored in a fine-grained fashion [WHM+12; BSS+15].
Within the field of IT security, several solution approaches to this problemare being investigated. However, schemes such as differential privacy [Dwo06]or the use of homomorphic encryption [RAD78], can only partly mitigateprivacy considerations. The fundamental assumption for their use is thepresence of a trusted third party, usually the metering point operator. Inaddition to billing customers for their consumed electricity, however, businessmodels for this stakeholder also include other ways of exploring and exploitingthe information content in consumption data. In fact, a strong growth in thenumber of companies who build their business models on the analysis ofconsumption data can be observed. Thus, it ensues that orthogonal approachesto protect user privacy are required. Two such approaches, based on theintentional reporting of falsified data and the use of domestic PV generation,are presented in the remainder of this section.
4.1 intentional data perturbation
The non-linear relation between the granularity at which data are collectedand the resultant energy analytics accuracy has been demonstrated in [EK10;LES+14; TSB+14]. An intuitive way to minimize the impact on user privacywhen electricity consumption data are being collected is thus the reductionof the data’s resolution. Such resolution reductions can be performed intwo possible ways: Either the data’s temporal resolution is lowered, e.g., bydown-sampling data, or its amplitude resolution is reduced, commonly accom-plished through quantization. To assess the impact of such data processing onuser privacy, I have conducted a comprehensive study, published in:
37

4.1 intentional data perturbation 38
A. Reinhardt, F. Englert, and D. Christin. “Averting the Privacy Risks ofSmart Metering by Local Data Preprocessing.” In: Pervasive and MobileComputing (PMC) 16 (2015), pp. 171–183.
The study is based on macroscopic load signatures and the appliancerecognition approach presented in [RBB+12] (cf. Section 3.1). Instead of usingthe input data in its unaltered form, i.e., one sample per second, the followingdata preprocessing steps to reduce the data resolution are considered:
B Temporal averaging lowers the temporal resolution of load signatures byreporting the average power consumption of a window containing afixed number of most recent values whenever a new sample is collected.
B In temporal down-sampling, a sample of the data is taken at a rate lowerthan the native data resolution and repeatedly reported for a fixed timeduration; all intermediate load changes remain unreported.
B Noise addition is a way of modifying the amplitude of power consumptionreadings by overlaying random fluctuations on the reported data. It isparticularly beneficial when characteristic patterns in appliance powerconsumption have small amplitudes, thus they can be covered in theadded noise, which leads to a potentially higher privacy protection.
B Amplitude quantization is a way to alter the load signature’s amplitudeby rounding each consumption sample to a multiple of a pre-definedquantization factor.
All combinations of the two amplitude alteration schemes with the twoapproaches to alter the temporal resolution of data have been analyzedwith regard to their impact on the appliance recognition accuracy. Moreover,averaged down-sampling, i.e., the combination of an averaging step with asubsequent down-sampling, has been considered in the analysis. The impactof these data filters on the device recognition accuracy is shown in Figure 4.1.Across all diagrams, an appliance recognition rate of 93.5% is achieved whenfeeding unaltered data to the appliance recognition system. Note that thisis slightly lower than the 95.5% determined in Section 3.1 due to the factthat an extended version of the data set with more appliance diversity hasbeen used here. The figure shows strongly differing accuracy degradationsfor different choices of the perturbation methods’ parameterizations. Thecombination of temporal down-sampling with value quantization (shown inFigure 4.1a; lowest observed recognition rate at 36.9%) provides much betterprivacy protection than the choice of noise addition and temporal averaging(see Figure 4.1d and Figure 4.1f; lowest observed recognition rate 56.1%).
Reporting of intentionally perturbed data may lead to inaccuracies inbilling, yet such errors can be bounded by the choice of the quantization anddownsampling values. At the same time, however, making less informationavailable to the operator of the data collection infrastructure implicitly lowersthe risk of intrusions into user privacy.

4.1 intentional data perturbation 39
050
100150
0
200
400
600
800
0
20
40
60
80
100
Wind
ow si
ze (s
econ
ds)
Quantization factor (watts)
Cla
ssifi
catio
n ac
cura
cy (
perc
ent)
(a) Temporal down-sampling vs. quantization.
050
100150
0
200
400
600
800
0
20
40
60
80
100
Wind
ow si
ze (s
econ
ds)
Noise amplitude (watts)
Cla
ssifi
catio
n ac
cura
cy (
perc
ent)
(b) Temporal down-sampling vs. noise addition.
050
100150
0
200
400
600
800
0
20
40
60
80
100
Wind
ow si
ze (s
econ
ds)
Quantization factor (watts)
Cla
ssifi
catio
n ac
cura
cy (
perc
ent)
(c) Averaging vs. quantization.
050
100150
0
200
400
600
800
0
20
40
60
80
100
Wind
ow si
ze (s
econ
ds)
Noise amplitude (watts)
Cla
ssifi
catio
n ac
cura
cy (
perc
ent)
(d) Averaging vs. noise addition.
050
100150
0
200
400
600
800
0
20
40
60
80
100
Wind
ow si
ze (s
econ
ds)
Quantization factor (watts)
Cla
ssifi
catio
n ac
cura
cy (
perc
ent)
(e) Averaging/down-sampling vs. quantization.
050
100150
0
200
400
600
800
0
20
40
60
80
100
Wind
ow si
ze (s
econ
ds)
Noise amplitude (watts)
Cla
ssifi
catio
n ac
cura
cy (
perc
ent)
(f) Averaging/down-sampling vs. noise addi-tion.
Figure 4.1: Resulting device recognition accuracies when the preprocessing filters havebeen applied to the input data [REC15].

4.2 load hiding through renewable power generation 40
4.2 load hiding through renewable power generation
An intentional degradation of data quality by means of the removal or pertur-bation of characteristic signals can be used to limit the potential of energy ana-lytics. While this generally leads to improvements in user privacy, it may not al-ways be possible to report modified data. Particularly when data shall be usedfor billing purposes, legislative requirements usually impose strict accuracyrequirements. Alternatives to the intentional reporting of falsified data havethus emerged through the local installation of controllable consumers [EPE14]or energy storages [KED+10]. By using energy stored in local batteries to sup-ply appliances with electricity, their existence can effectively be obfuscated oreven completely covered. As a downside, potentially large banks of batteriesmight be required to satisfactorily hide the presence of large consumers. Thisis partly mitigated when following the approach of load-based load hiding, i.e.,the load signature perturbation through the addition of controllable consump-tion. However, besides the monetary cost incurred when operating appliancesfor the purpose of hiding consumption patterns, high maintenance efforts alsoresult from the requirement to keep appliances ready at all times.
Photovoltaic (PV) generation, a renewable energy source, is widely deployedin Germany. In 2018, almost 24% of the country’s total energy generationwere supplied by PV installations5. The strong dependency on the prevailingenvironmental conditions renders the output PV installations volatile by nature.Their generation is strongly dependent on the current weather conditions, andsmall variations in insolation and cloud coverage can already lead to drasticchanges in the output power. Moreover, the fact that the solar radiation caneven vary even between neighboring homes when shattered clouds are present,makes solar generation hard to predict; a strong asset when leveraging it forprivacy protection. It is thus conceivable to use PV systems to improve userprivacy protection, an analysis of which is presented in:
A. Reinhardt, G. Konstantinou, D. Egarter, and D. Christin. “WorriedAbout Privacy? Let Your PV Converter Cover Your Electricity ConsumptionFingerprints.” In: Proceedings of the IEEE International Conference on Smart GridCommunications (SmartGridComm) Symposium on Cyber Security and Privacy.2015, pp. 25–30.
In the work, a coupling is created between macroscopic load signaturescollected in real-time and the operating point of a PV converter. A converteris a device that transforms the Direct Current (DC) output of solar cells intoan Alternating Current (AC) voltage of utility frequency that can be suppliedto the power grid. During regular operation of the converter, a MaximumPower Point Tracking (MPPT) algorithm is being executed to maximize itsdelivered power. Thus, no further increases to its output power are possible,yet controlled reductions are viable and easy to realize. By modifying the MPPT
5Up-to-date charts are available at https://www.energy-charts.de/energy_pie.htm
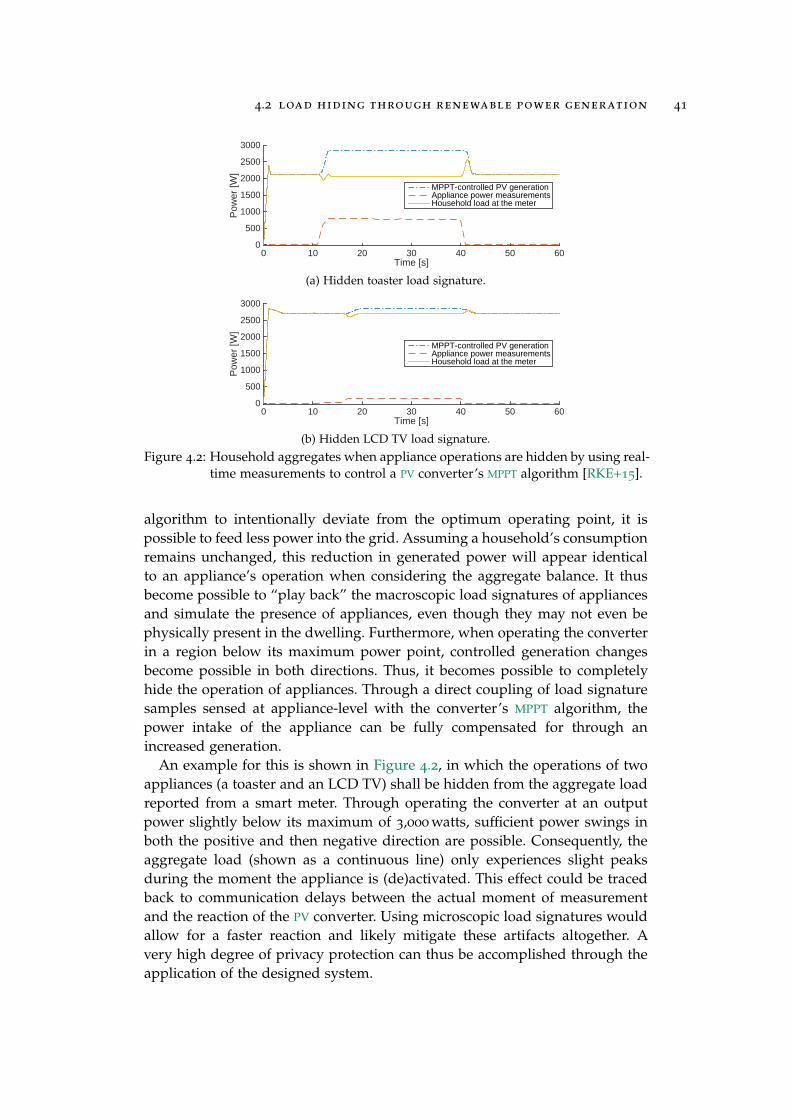
4.2 load hiding through renewable power generation 41
Time [s]0 10 20 30 40 50 60
Pow
er [W
]0
500
1000
1500
2000
2500
3000
MPPT-controlled PV generationAppliance power measurementsHousehold load at the meter
(a) Hidden toaster load signature.
Time [s]0 10 20 30 40 50 60
Pow
er [W
]
0
500
1000
1500
2000
2500
3000
MPPT-controlled PV generationAppliance power measurementsHousehold load at the meter
(b) Hidden LCD TV load signature.Figure 4.2: Household aggregates when appliance operations are hidden by using real-
time measurements to control a PV converter’s MPPT algorithm [RKE+15].
algorithm to intentionally deviate from the optimum operating point, it ispossible to feed less power into the grid. Assuming a household’s consumptionremains unchanged, this reduction in generated power will appear identicalto an appliance’s operation when considering the aggregate balance. It thusbecome possible to “play back” the macroscopic load signatures of appliancesand simulate the presence of appliances, even though they may not even bephysically present in the dwelling. Furthermore, when operating the converterin a region below its maximum power point, controlled generation changesbecome possible in both directions. Thus, it becomes possible to completelyhide the operation of appliances. Through a direct coupling of load signaturesamples sensed at appliance-level with the converter’s MPPT algorithm, thepower intake of the appliance can be fully compensated for through anincreased generation.
An example for this is shown in Figure 4.2, in which the operations of twoappliances (a toaster and an LCD TV) shall be hidden from the aggregate loadreported from a smart meter. Through operating the converter at an outputpower slightly below its maximum of 3,000 watts, sufficient power swings inboth the positive and then negative direction are possible. Consequently, theaggregate load (shown as a continuous line) only experiences slight peaksduring the moment the appliance is (de)activated. This effect could be tracedback to communication delays between the actual moment of measurementand the reaction of the PV converter. Using microscopic load signatures wouldallow for a faster reaction and likely mitigate these artifacts altogether. Avery high degree of privacy protection can thus be accomplished through theapplication of the designed system.


5C O N C L U S I O N S A N D F U T U R E R E S E A R C H D I R E C T I O N S
Energy informatics is an emerging research field that has sparked interest inmany different research communities. Across all involved disciplines, theunequivocal objective is to create a smart power grid, i.e., an infrastructurefor the transport of electrical power that is aware of its current status and canadapt and react to changes. To turn this vision into reality, many contributionsalong the flow of electrical consumption data are required. Some of themhave already been extensively considered in research for several decades,e.g., investigations into ways to accomplish Non-Intrusive Load Monitoring.In contrast, many other fundamental challenges, e.g., how to minimize thenumber of sensing devices in a building while maximizing the informationcontent in their collected data, have barely received any scientific coverageyet. Energy informatics is thus still dependent on more novel contributions tomake smart grids a reality.
Twelve such contributions were presented in this manuscript, all of whichhave been summarized in the previous chapters. Their order of presentationhas been aligned with the flow of electricity consumption data in electricalpower grids: From their collection (e.g., by means of a smart meter), via theirnetworked transmission to a data collection device (e.g., a concentrator node),to the processing at their destination (e.g., a notification system that alarmsan operator in case of consumption anomalies). Boundary conditions from themultitude of involved domains, including electrical power engineering, mea-surement engineering, information and communication technology, computerscience and engineering, and economics, were considered in the designs andimplementations of the contributions presented in this habilitation thesis. Onlyby considering energy informatics from a holistic and interdisciplinary view-point, practical and usable solutions with a high user acceptance will emerge.
The way to truly smart power grids is, however, still long and winding, andthe following research challenges remain as major obstacles on this path.
B Collecting data in a methodological way: How and where must sensorsbe deployed to capture all necessary data in the required resolution?
B Networking between data-collecting devices: How can the data collectedfrom distributed sensors be exchanged in a scalable and timely fashion?
B Universally applicable data processing algorithms: Which methods canextract the greatest information content from all collected data, whilebeing resilient to varying data quality levels and providing adequatemeans for user privacy protection?
Expressive data, combined with powerful analysis methods, will enable novelopportunities for energy informatics. Let us see what the future has in store.
43


6R E F E R E N C E S
[ASS+02] I. F. Akyildiz, W. Su, Y. Sankarasubramaniam, and E. Cayirci.“A Survey on Sensor Networks.” In: IEEE CommunicationsMagazine 40.8 (2002).
[APR15] J. Alcalá, O. Parson, and A. Rogers. “Health Monitoringof Elderly Residents via Disaggregated Smart Meter Dataand Log Gaussian Cox Processes.” In: Proceedings of the 2ndACM International Conference on Embedded Systems for Energy-Efficient Buildings (BuildSys). 2015.
[AXR+15] A. Alhamoud, P. Xu, A. Reinhardt, F. Englert, P. Scholl, D.Böhnstedt, and R. Steinmetz. “Extracting Human BehaviorPatterns from Appliance-level Power Consumption Data.”In: Proceedings of the 12th European Conference on WirelessSensor Networks (EWSN). 2015.
[AOB+12] K. Anderson, A. Ocneanu, D. Benitez, D. Carlson, A. Rowe,and M. Bergés. “BLUED: A Fully Labeled Public Datasetfor Event-Based Non-Intrusive Load Monitoring Research.”In: Proceedings of the 2nd KDD Workshop on Data MiningApplications in Sustainability (SustKDD). 2012.
[AKM12] H.-J. Appelrath, H. Kagermann, and C. Mayer, eds. FutureEnergy Grid. Migrationspfade ins Internet der Energie (acatechSTUDIE). Heidelberg u.a.: Springer Verlag, 2012.
[AKG+15] P. Arjunan, H. D. Khadilkar, T. Ganu, Z. M. Charbiwala, andA. S. P. Singh. “Multi-User Energy Consumption Monitoringand Anomaly Detection with Partial Context Information.”In: Proceedings of the 2nd ACM International Conference on Em-bedded Systems for Energy-Efficient Buildings (BuildSys). 2015.
[AGS+13] K. C. Armel, A. Gupta, G. Shrimali, and A. Albert. “IsDisaggregation the Holy Grail of Energy Efficiency? TheCase of Electricity.” In: Energy Policy 52.1 (2013).
[Ash09] K. Ashton. “That ’Internet of Things’ Thing.” In: RFIDJournal (2009). Available online at: http://www.rfidjournal.com/articles/pdf?4986.
[BNJL08] A. Bar-Noy, M. Johnson, and O. Liu. “Peak Shaving throughResource Buffering.” In: Proceedings of the 6th Workshop onApproximation and Online Algorithms (WAOA). 2008.
45

references 46
[BV04] M. Baranski and J. Voss. “Genetic Algorithm for Pattern De-tection in NIALM Systems.” In: Proceedings of the IEEE Inter-national Conference on Systems, Man and Cybernetics (ICSMC).2004.
[BKI+13] S. Barker, S. Kalra, D. Irwin, and P. Shenoy. “EmpiricalCharacterization and Modeling of Electrical Loads in SmartHomes.” In: Proceedings of the 4th International Green Comput-ing Conference (IGCC). 2013.
[BMI+12] S. Barker, A. Mishra, D. Irwin, E. Cecchet, P. Shenoy, andJ. Albrecht. “Smart*: An Open Data Set and Tools forEnabling Research in Sustainable Homes.” In: Proceedingsof the Workshop on Data Mining Applications in Sustainability(SustKDD). 2012.
[BGS+13] N. Batra, M. Gulati, A. Singh, and M. B. Srivastava. “It’s Dif-ferent: Insights into Home Energy Consumption in India.”In: Proceedings of the 5th ACM Workshop on Embedded SystemsFor Energy-Efficient Buildings (BuildSys). 2013.
[BKP+14] N. Batra, J. Kelly, O. Parson, H. Dutta, W. Knottenbelt,A. Rogers, A. Singh, and M. Srivastava. “NILMTK: AnOpen Source Toolkit for Non-intrusive Load Monitoring.” In:Proceedings of the 5th ACM International Conference on FutureEnergy Systems (e-Energy). 2014.
[BKC+14] C. Beckel, W. Kleiminger, R. Cicchetti, T. Staake, and S.Santini. “The ECO Data Set and the Performance of Non-Intrusive Load Monitoring Algorithms.” In: Proceedings ofthe 1st ACM International Conference on Embedded Systems forEnergy-Efficient Buildings (BuildSys). 2014.
[BSS+15] C. Beckel, L. Sadamori, S. Santini, and T. Staake. “AutomatedCustomer Segmentation Based on Smart Meter Data withTemperature and Daylight Sensitivity.” In: Proceedings of the6th IEEE International Conference on Smart Grid Communica-tions (SmartGridComm). 2015.
[BSS+14] C. Beckel, L. Sadamori, T. Staake, and S. Santini. “RevealingHousehold Characteristics from Smart Meter Data.” In: Else-vier Energy 78 (2014).
[BGM+01] M. E. Bergés, E. Goldman, H. S. Matthews, and L. Soibelman.“Enhancing Electricity Audits in Residential Buildings withNonintrusive Load Monitoring.” In: Journal of IndustrialEcology 14.5 (2001).

references 47
[BGS+11] M. E. Bergés, E. Goldman, L. Soibelman, H. S. Matthews,and K. Anderson. “User-centered Non-Intrusive ElectricityLoad Monitoring for Residential Buildings.” In: Journal ofComputing in Civil Engineering 25.1 (2011).
[BGM+09] M. Bergés, E. Goldman, H. Matthews, and L. Soibelman.“Learning Systems for Electric Consumption of Buildings.”In: Proceedings of the ASCE International Workshop on Comput-ing in Civil Engineering (IWCCE). 2009.
[BLCG92] T. J. Berners-Lee, R. Cailliau, and J.-F. Groff. “The World-Wide Web.” In: Computer Networks and ISDN Systems 25
(1992).
[BMN09] V. Bianco, O. Manca, and S. Nardini. “Electricity Consump-tion Forecasting in Italy using Linear Regression Models.”In: Energy 34.9 (2009).
[Blo70] B. H. Bloom. “Space/Time Trade-offs in Hash Coding withAllowable Errors.” In: Communications of the ACM 13.7 (1970).
[Bol99] M. H. Bollen. Understanding Power Quality Problems: VoltageSags and Interruptions. Wiley-IEEE Press, 1999.
[Bun16] N. Buneeva. “Automated Modeling of Appliance Signaturesfor Realistic Consumption Trace Synthesis.” M.Sc. Thesis.Technische Universität Clausthal, 2016.
[CEN12] CEN-CENELEC-ETSI Smart Grid Coordination Group.Smart Grid Reference Architecture. Online: http : / /
gridscientific . com / images / Smart _ Grid _ Reference _
Artichtecture.pdf. 2012.
[CCT+12] H. H. Chang, K. L. Chen, Y. P. Tsai, and W. J. Lee. “A NewMeasurement Method for Power Signatures of NonintrusiveDemand Monitoring and Load Identification.” In: IEEETransactions on Industry Applications 48.2 (2012).
[CLL10] H. Chang, C. Lin, and J. Lee. “Load Identification in Non-intrusive Load Monitoring Using Steady-State and Turn-OnTransient Energy Algorithms.” In: Proceedings of the 14th In-ternational Conference on Computer Supported Cooperative Workin Design (CSCWD). 2010.
[CLY08] H.-H. Chang, C.-L. Lin, and H.-T. Yang. “Load Recognitionfor Different Loads with the Same Real Power and ReactivePower in a Non-intrusive Load-monitoring System.” In:Proceedings of the 12th International Conference on ComputerSupported Cooperative Work in Design (CSCWD). 2008.

references 48
[CDW+11] F. Chen, J. Dai, B. Wang, S. Sahu, M. Naphade, and C.-T. Lu.“Activity Analysis Based on Low Sample Rate Smart Me-ters.” In: Proceedings of the 17th ACM SIGKDD InternationalConference on Knowledge Discovery and Data Mining (KDD).2011.
[CLX+06] Y. Chen, H. V. Leong, M. Xu, J. Cao, K. C. C. Chan, and A.T. S. Chan. “In-Network Data Processing forWireless SensorNetworks.” In: Proceedings of the 7th International Conferenceon Mobile Data Management (MDM). 2006.
[CCD14] M. Clark, B. Campbell, and P. Dutta. “Deltaflow: Submeter-ing by Synthesizing Uncalibrated Pulse Meter Streams.” In:Proceedings of the 5th ACM International Conference on FutureEnergy Systems (e-Energy). 2014.
[CA00] A. Cole and A. Albicki. “Nonintrusive Identification of Elec-trical Loads in a Three-phase Environment based on Har-monic Content.” In: Proceedings of the 17th IEEE Instrumenta-tion and Measurement Technology Conference (IMTC). 2000.
[CA98] A. I. Cole and A. Albicki. “Data Extraction for EffectiveNon-Intrusive Identification of Residential Power Loads.”In: Proceedings of the 15th Instrumentation and MeasurementTechnology Conference (IMTC). 1998.
[CM02] D. Comaniciu and P. Meer. “Mean Shift: A Robust ApproachToward Feature Space Analysis.” In: IEEE Transactions onPattern Analysis and Machine Intelligence 24.5 (2002).
[CEE16] Council of European Energy Regulators (CEER). 6th CEERBenchmarking Report on the Quality of Electricity and GasSupply. Online: https://www.nve.no/Media/4862/1-c16-eqs-72-03_ceer-6thbr_intro-ch1-2-2.pdf. 2016.
[CLS+06] R. Cox, S. Leeb, S. Shaw, and L. Norford. “Transient EventDetection for Nonintrusive Load Monitoring and DemandSide Management using Voltage Distortion.” In: Proceedingsof the Applied Power Electronics Conference and Exposition(APEC). 2006.
[Cox04] R. W. Cox. A Field-based Approach to Non-Intrusive Load Moni-toring. Proceedings of the “Inference from Data and Models”Workshop at the Massachusetts Institute of Technology, USA.2004.
[DDD+17] L. De Baets, C. Develder, D. Deschrijver, and T. Dhaene.“Automated Classification of Appliances using EllipticalFourier Descriptors.” In: Proceedings of the IEEE InternationalConference on Smart Grid Communications (SGC). 2017.

references 49
[DRD+18] L. De Baets, J. Ruyssinck, C. Develder, T. Dhaene, and D. De-schrijver. “Appliance Classification using VI Trajectories andConvolutional Neural Networks.” In: Energy and Buildings158 (2018).
[DCD13] S. DeBruin, B. Campbell, and P. Dutta. “Monjolo: An Energy-harvesting Energy Meter Architecture.” In: Proceedings of the11th ACM Conference on Embedded Networked Sensor Systems(SenSys). 2013.
[DoE11] Department of Energy and Climate Change and the Officeof Gas and Electricity Markets. Functional Requirements Cata-logue. Online: https://www.gov.uk/government/uploads/system / uploads / attachment _ data / file / 42737 / 1480 -
design-requirement-annex.pdf. 2011.
[DK99] S. Drenker and A. Kader. “Nonintrusive Monitoring ofElectric Loads.” In: IEEE Computer Applications in Power 12.4(1999).
[DHH+16] L. Du, D. He, R. G. Harley, and T. G. Habetler. “ElectricLoad Classification by Binary Voltage-Current TrajectoryMapping.” In: IEEE Transactions on Smart Grid 7.1 (2016).
[Dwo06] C. Dwork. “Differential Privacy.” In: Proceedings of the 33rdInternational Colloquium on Automata, Languages and Program-ming (ICALP). 2006.
[EF14] The Edison Foundation – Institute for Electric Innovation.Utility-scale Smart Meter Deployments: Building Block of theEvolving Power Grid. IEI Report. 2014.
[EK10] C. Efthymiou and G. Kalogridis. “Smart Grid Privacy viaAnonymization of Smart Metering Data.” In: Proceedings ofthe 1st IEEE International Conference on Smart Grid Communi-cations (SmartGridComm). 2010.
[EPE14] D. Egarter, C. Prokop, and W. Elmenreich. “Load Hidingof Household’s Power Demand.” In: Proceedings of the 5thIEEE International Conference on Smart Grid Communications(SmartGridComm). 2014.
[EPE15] D. Egarter, M. Pöchacker, and W. Elmenreich. “Complexityof Power Draws for Load Disaggregation.” In: arXiv Comput-ing Research Repository (CoRR) abs/1501.02954 (2015).
[EEK+15] F. Eichinger, P. Efros, S. Karnouskos, and K. Böhm. “A Time-Series Compression Technique and Its Application to theSmart Grid.” In: The VLDB Journal 24.2 (2015).
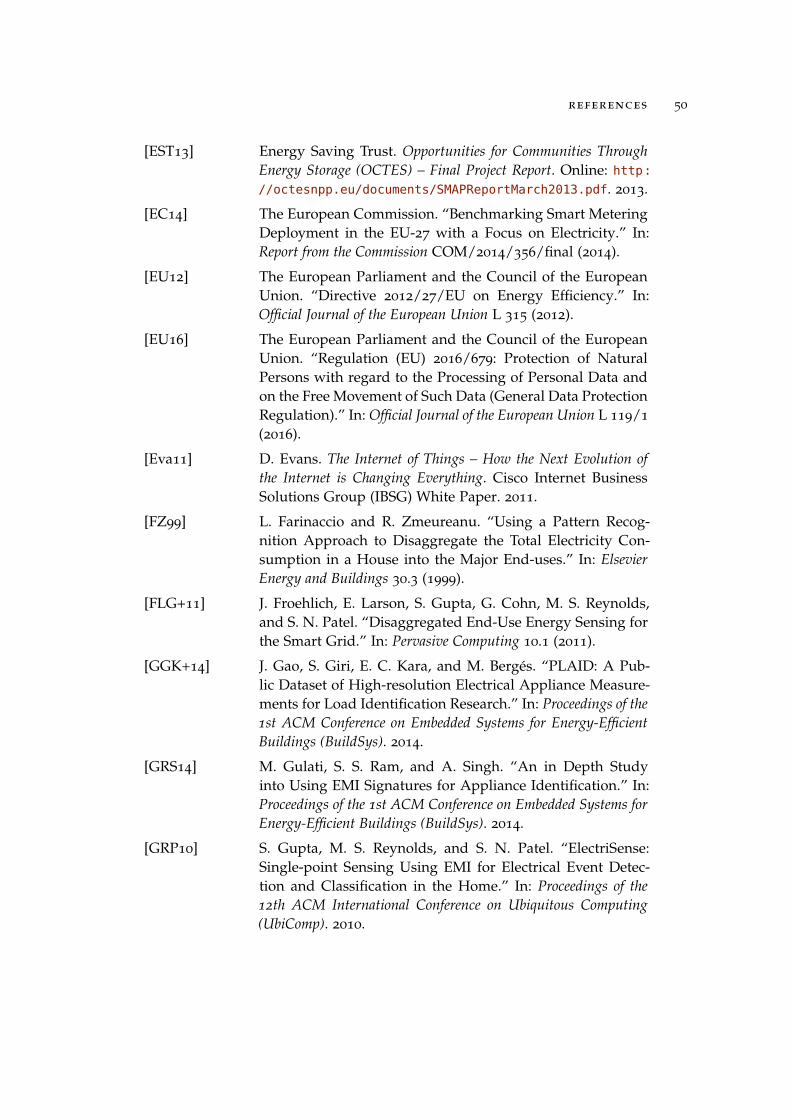
references 50
[EST13] Energy Saving Trust. Opportunities for Communities ThroughEnergy Storage (OCTES) – Final Project Report. Online: http://octesnpp.eu/documents/SMAPReportMarch2013.pdf. 2013.
[EC14] The European Commission. “Benchmarking Smart MeteringDeployment in the EU-27 with a Focus on Electricity.” In:Report from the Commission COM/2014/356/final (2014).
[EU12] The European Parliament and the Council of the EuropeanUnion. “Directive 2012/27/EU on Energy Efficiency.” In:Official Journal of the European Union L 315 (2012).
[EU16] The European Parliament and the Council of the EuropeanUnion. “Regulation (EU) 2016/679: Protection of NaturalPersons with regard to the Processing of Personal Data andon the Free Movement of Such Data (General Data ProtectionRegulation).” In: Official Journal of the European Union L 119/1
(2016).
[Eva11] D. Evans. The Internet of Things – How the Next Evolution ofthe Internet is Changing Everything. Cisco Internet BusinessSolutions Group (IBSG) White Paper. 2011.
[FZ99] L. Farinaccio and R. Zmeureanu. “Using a Pattern Recog-nition Approach to Disaggregate the Total Electricity Con-sumption in a House into the Major End-uses.” In: ElsevierEnergy and Buildings 30.3 (1999).
[FLG+11] J. Froehlich, E. Larson, S. Gupta, G. Cohn, M. S. Reynolds,and S. N. Patel. “Disaggregated End-Use Energy Sensing forthe Smart Grid.” In: Pervasive Computing 10.1 (2011).
[GGK+14] J. Gao, S. Giri, E. C. Kara, and M. Bergés. “PLAID: A Pub-lic Dataset of High-resolution Electrical Appliance Measure-ments for Load Identification Research.” In: Proceedings of the1st ACM Conference on Embedded Systems for Energy-EfficientBuildings (BuildSys). 2014.
[GRS14] M. Gulati, S. S. Ram, and A. Singh. “An in Depth Studyinto Using EMI Signatures for Appliance Identification.” In:Proceedings of the 1st ACM Conference on Embedded Systems forEnergy-Efficient Buildings (BuildSys). 2014.
[GRP10] S. Gupta, M. S. Reynolds, and S. N. Patel. “ElectriSense:Single-point Sensing Using EMI for Electrical Event Detec-tion and Classification in the Home.” In: Proceedings of the12th ACM International Conference on Ubiquitous Computing(UbiComp). 2010.

references 51
[HKK+17] A. U. Haq, T. Kriechbaumer, M. Kahl, and H. A. Jacobsen.“CLEAR: A Circuit Level Electric Appliance Radar for theElectric Cabinet.” In: IEEE International Conference on Indus-trial Technology (ICIT). 2017.
[Har85] G. W. Hart. Prototype Nonintrusive Appliance Load Monitor.Tech. rep. MIT Energy Laboratory and Electric Power Re-search Institute, 1985.
[Har89] G. W. Hart. “Residential Energy Monitoring and Computer-ized Surveillance via Utility Power Flows.” In: IEEE Technol-ogy and Society Magazine 8.2 (1989).
[Har92] G. W. Hart. “Nonintrusive Appliance Load Monitoring.” In:Proceedings of the IEEE 80.12 (1992).
[HBA+12] L. Hernández, C. Baladrón, J. M. Aguiar, L. Calavia, B.Carro, A. Sánchez-Esguevillas, D. J. Cook, D. Chinarro, and J.Gómez. “A Study of the Relationship between Weather Vari-ables and Electric Power Demand inside a Smart Grid/SmartWorld Framework.” In: MDPI Sensors 12.9 (2012).
[HKC+11] B.-J. Ho, H.-L. C. Kao, N.-C. Chen, C.-W. You, H.-H. Chu,and M.-S. Chen. “HeatProbe: A Thermal-based Power Meterfor Accounting Disaggregated Electricity Usage.” In: Proceed-ings of the 13th International Conference on Ubiquitous Comput-ing (UbiComp). 2011.
[IBM12] IBM Software. Managing Big Data for Smart Grids and SmartMeters. Information management white paper. Available fordownload at http : / / www - 935 . ibm . com / services /
multimedia/Managing_big_data_for_smart_grids_and_
smart_meters.pdf. 2012.
[IEEE06] IEEE Std. 802.15.4 Part 15.4: Wireless medium access control(MAC) and Physical layer (PHY) specifications for low-ratewireless personal are networks (LR-WPANs). 2006.
[IEA10] International Energy Agency. World Energy Outlook. Avail-able at http : / / www . worldenergyoutlook . org / media /
weo2010.pdf. 2010.
[IUI+04] M. Ito, R. Uda, S. Ichimura, K. Tago, T. Hoshi, and Y. Mat-sushita. “A Method of Appliance Detection based on Fea-tures of Power Waveform.” In: Proceedings of the InternationalSymposium on Applications and the Internet (SAINT). 2004.
[JDHD+09] X. Jiang, S. Dawson-Haggerty, P. Dutta, and D. E. Culler.“Design and Implementation of a High-Fidelity AC MeteringNetwork.” In: Proceedings of the 8th International Conference onInformation Processing in Sensor Networks (IPSN). 2009.

references 52
[JAL12] P. Jokar, N. Arianpoo, and V. C. M. Leung. “A Survey on Se-curity Issues in Smart Grids.” In: Security and CommunicationNetworks 9.3 (2012).
[JS10] D. Jung and A. Savvides. “Estimating Building ConsumptionBreakdowns Using ON/OFF State Sensing and IncrementalSub-meter Deployment.” In: Proceedings of the 8th ACMConference on Embedded Networked Sensor Systems (SenSys).2010.
[KWH13] H. Kagermann, W. Wahlster, and J. Helbig, eds. DeutschlandsZukunft als Produktionsstandort sichern: Umsetzungsempfehlun-gen für das Zukunftsprojekt Industrie 4.0, Abschlussbericht desArbeitskreises Industrie 4.0. acatech – Deutsche Akademie derTechnikwissenschaften e.V., 2013.
[KUK+16] M. Kahl, A. Ul Haq, T. Kriechbaumer, and H.-A. Jacobsen.“WHITED – A Worldwide Household and Industry Tran-sient Energy Data Set.” In: Proceedings of the 3rd InternationalWorkshop on Non-Intrusive Load Monitoring (NILM). 2016.
[KED+10] G. Kalogridis, C. Efthymiou, S. Z. Denic, T. A. Lewis, and R.Cepeda. “Privacy for Smart Meters: Towards UndetectableAppliance Load Signatures.” In: First IEEE InternationalConference on Smart Grid Communications (SmartGridComm).2010.
[KGH+10] M. Kazandjieva, O. Gnawali, B. Heller, P. Levis, and C.Kozyrakis. Identifying Energy Waste through Dense PowerSensing and Utilization Monitoring. Tech. rep. CSTR 2010-03.Stanford University, 2010.
[KK14] J. Kelly and W. J. Knottenbelt. “UK-DALE: A Dataset Record-ing UK Domestic Appliance-Level Electricity Demand andWhole-House Demand.” In: arXiv Computing Research Reposi-tory (CoRR) abs/1404.0284 (2014).
[KK15] J. Kelly and W. Knottenbelt. “Neural NILM: Deep NeuralNetworks Applied to Energy Disaggregation.” In: Proceed-ings of the 2nd ACM International Conference on Embedded Sys-tems for Energy-Efficient Buildings (BuildSys). 2015.
[KSC+09] Y. Kim, T. Schmid, Z. M. Charbiwala, and M. B. Srivastava.“ViridiScope: Design and Implementation of a Fine GrainedPower Monitoring System for Homes.” In: Proceedings ofthe 11th International Conference on Ubiquitous Computing(UbiComp). 2009.

references 53
[KBS15] W. Kleiminger, C. Beckel, and S. Santini. “Household Occu-pancy Monitoring Using Electricity Meters.” In: Proceedingsof the ACM International Joint Conference on Pervasive and Ubiq-uitous Computing (UbiComp). 2015.
[KJ11] J. Z. Kolter and M. J. Johnson. “REDD: A Public DataSet for Energy Disaggregation Research.” In: Proceedings ofthe Workshop on Data Mining Applications in Sustainability(SustKDD). 2011.
[LLC+03] C. Laughman, K. Lee, R. Cox, S. Shaw, S. Leeb, L. Norford,and P. Armstrong. “Power Signature Analysis.” In: IEEEPower & Energy Magazine 1.2 (2003).
[LLN+05] K. D. Lee, S. B. Leeb, L. K. Norford, P. R. Armstrong, J.Holloway, and S. R. Shaw. “Estimation of Variable-Speed-Drive Power Consumption From Harmonic Content.” In:IEEE Transactions on Energy Conversion 20.3 (2005).
[LSJ95] S. B. Leeb, S. R. Shaw, and J. L. K. Jr. “Transient EventDetection in Spectral Envelope Estimates for NonintrusiveLoad Monitoring.” In: IEEE Transactions on Power Delivery10.3 (1995).
[LM07] J. Li and P. Mohapatra. “Analytical Modeling and Mitiga-tion Techniques for the Energy Hole Problem in Sensor Net-works.” In: Pervasive and Mobile Computing 3.3 (2007).
[LNK+10] J. Liang, S. K. K. Ng, G. Kendall, and J. W. M. Cheng. “LoadSignature Study — Part I: Basic Concept, Structure, andMethodology.” In: IEEE Transactions on Power Delivery 25.2(2010).
[LES+14] J. Liao, G. Elafoudi, L. Stankovic, and V. Stankovic. “Non-intrusive Appliance Load Monitoring using Low-resolutionSmart Meter Data.” In: Proceedings of the 5th IEEE Interna-tional Conference on Smart Grid Communications (SmartGrid-Comm). 2014.
[LFO+07] J. Lifton, M. Feldmeier, Y. Ono, C. Lewis, and J. Paradiso. “APlatform for Ubiquitous Sensor Deployment in Occupationaland Domestic Environments.” In: Proceedings of the 6th In-ternational Symposium on Information Processing in Sensor Net-works (IPSN). 2007.
[LKL+03] J. Lin, E. Keogh, S. Lonardi, and B. Chiu. “A Symbolic Rep-resentation of Time Series, with Implications for StreamingAlgorithms.” In: Proceedings of the 8th ACM SIGMOD Work-shop on Research Issues in Data Mining and Knowledge Discovery(DMKD). 2003.

references 54
[MCB+15] H. Maaß, H. K. Cakmak, F. Bach, R. Mikut, A. Harrabi,W. Süß, W. Jakob, K.-U. Stucky, U. G. Kühnapfel, and V.Hagenmeyer. “Data Processing of High-Rate Low-VoltageDistribution Grid Recordings for Smart Grid Monitoringand Analysis.” In: EURASIP Journal on Advances in SignalProcessing 1 (2015).
[MPB+13] S. Makonin, F. Popowich, L. Bartram, B. Gill, and I. V. Bajic.“AMPds: A Public Dataset for Load Disaggregation and Eco-Feedback Research.” In: Proceedings of the Electrical Power andEnergy Conference (EPEC). 2013.
[MHH+10] A. Marchiori, D. Hakkarinen, Q. Han, and L. Earle. “Circuit-Level Load Monitoring for Household Energy Manage-ment.” In: IEEE Pervasive Computing 10.1 (2010).
[Mar97] G. Marubayashi. “Noise Measurements of the ResidentialPower Line.” In: Proceedings of the 1st International Symposiumon Power Line Communications and Its Applications (ISPLC).1997.
[MG11] P. Mell and T. Grance. The NIST Definition of Cloud Computing.Tech. rep. 800-145. National Institute of Standards andTechnology (NIST), 2011.
[MEE+14] A. Monacchi, D. Egarter, W. Elmenreich, S. D’Alessandro,and A. M. Tonello. “GREEND: An Energy ConsumptionDataset of Households in Italy and Austria.” In: Proceedingsof the 5th IEEE International Conference on Smart Grid Commu-nications (SmartGridComm). 2014.
[MLS+15] D. Murray, J. Liao, L. Stankovic, V. Stankovic, R. Hauxwell-Baldwin, C. Wilson, M. Coleman, T. Kane, and S. Firth.“A Data Management Platform for Personalised Real-timeEnergy Feedback.” In: Proceedings of the 8th InternationalConference on Energy Efficiency in Domestic Appliances andLighting (EEDAL). 2015.
[ORL+10] U. A. Orji, Z. Remscrim, C. Laughman, S. B. Leeb, W.Wichakool, C. Schantz, R. Cox, J. Paris, J. L. Kirtley Jr., andL. K. Norford. “Fault Detection and Diagnostics for Non-intrusive Monitoring Using Motor Harmonics.” In: Proceed-ings of the 25th Annual IEEE Applied Power Electronics Confer-ence and Exposition (APEC). 2010.
[PSS16] N. Panwar, S. Sharma, and A. K. Singh. “A Survey on 5G.”In: Physical Communication 18 (2016).

references 55
[PGW+11] O. Parson, S. Ghosh, M Weal, and A. Rogers. “Using HiddenMarkov Models for Iterative Non-intrusive Appliance Mon-itoring.” In: Proceedings of the Workshop on Machine Learningfor Sustainability Workshop (MLSUST). 2011.
[PGW+14] O. Parson, S. Ghosh, M. Weal, and A. Rogers. “An Unsu-pervised Training Method for Non-intrusive Appliance LoadMonitoring.” In: Artificial Intelligence 217 (2014).
[PRK+07] S. Patel, T. Robertson, J. Kientz, M. Reynolds, and G. Abowd.“At the Flick of a Switch: Detecting and Classifying UniqueElectrical Events on the Residential Power Line.” In: Proceed-ings of the 9th International Conference on Ubiquitous Computing(UbiComp). 2007.
[PTM+13] D. Phillips, R. Tan, M. Moazzami, G. Xing, J. Chen, and D.Yau. “Supero: A Sensor System for Unsupervised ResidentialPower Usage Monitoring.” In: Proceedings of the IEEE Interna-tional Conference on Pervasive Computing and Communications(PerCom). 2013.
[PNMR+16] T. Picon, M. Nait Meziane, P. Ravier, G. Lamarque, C. Nov-ello, J.-C. Le Bunetel, and Y. Raingeaud. “COOLL: Con-trolled On/Off Loads Library, a Public Dataset of High-Sampled Electrical Signals for Appliance Identification.” In:arXiv Computing Research Repository (CoRR) abs/1611.05803
(2016).
[Pru02] A. Prudenzi. “A Neuron Nets Based Procedure for Iden-tifying Domestic Appliances Pattern-of-Use from EnergyRecordings at Meter Panel.” In: Proceedings of the IEEE PowerEngineering Society Winter Meeting. Vol. 2. 2002.
[QG14] F. L. Quilumba-Gudino. “Using Advanced Metering Infras-tructure Data for Smart Grid Development.” PhD thesis. TheUniversity of Texas at Arlington, 2014.
[Rei17a] A. Reinhardt. “Adaptive Load Signature Coding for Electri-cal Appliance Monitoring over Low-Bandwidth Communi-cation Channels.” In: Proceedings of the 5th IFIP Conference onSustainable Internet and ICT for Sustainability (SustainIT). 2017.
[Rei17b] A. Reinhardt. “TUCap: A Sensing System to Capture andProcess Appliance Power Consumption in Smart Spaces.” In:Proceedings of the 16th GI/ITG KuVS Fachgespräch “Sensornetze”(FGSN). 2017.

references 56
[RBB+12] A. Reinhardt, P. Baumann, D. Burgstahler, M. Hollick, H.Chonov, M. Werner, and R. Steinmetz. “On the Accuracyof Appliance Identification Based on Distributed Load Me-tering Data.” In: Proceedings of the 2nd IFIP Conference on Sus-tainable Internet and ICT for Sustainability (SustainIT). 2012.
[RB13] A. Reinhardt and D. Burgstahler. “Exploiting PlatformHeterogeneity in Wireless Sensor Networks by ShiftingResource-Intensive Tasks to Dedicated Processing Nodes.”In: Proceedings of the 14th International Symposium on a Worldof Wireless, Mobile and Multimedia Networks (WoWMoM). 2013.
[RBM+11] A. Reinhardt, D. Burkhardt, P. S. Mogre, M. Zaheer, and R.Steinmetz. “SmartMeter.KOM: A Low-cost Wireless Sensorfor Distributed Power Metering.” In: Proceedings of the 6thIEEE International Workshop on Practical Issues in BuildingSensor Network Applications (SenseApp). 2011.
[RBZ+12] A. Reinhardt, D. Burkhardt, M. Zaheer, and R. Steinmetz.“Electric Appliance Classification Based on Distributed HighResolution Current Sensing.” In: Proceedings of the 7th IEEEInternational Workshop on Practical Issues in Building SensorNetwork Applications (SenseApp). 2012.
[RCK14] A. Reinhardt, D. Christin, and S. S. Kanhere. “Can SmartPlugs Predict Electric Power Consumption? A Case Study.”In: Proceedings of the 11th International Conference on Mobileand Ubiquitous Systems: Computing, Networking and Services(MobiQuitous). 2014.
[REC15] A. Reinhardt, F. Englert, and D. Christin. “Averting the Pri-vacy Risks of Smart Metering by Local Data Preprocessing.”In: Pervasive and Mobile Computing 16 (2015).
[RK14] A. Reinhardt and S. Koessler. “PowerSAX: Fast Motif Match-ing in Distributed Power Meter Data Using Symbolic Repre-sentations.” In: Proceedings of the 9th IEEE International Work-shop on Practical Issues in Building Sensor Network Applications(SenseApp). 2014.
[RKE+15] A. Reinhardt, G. Konstantinou, D. Egarter, and D. Christin.“Worried About Privacy? Let Your PV Converter Cover YourElectricity Consumption Fingerprints.” In: Proceedings of the6th IEEE SmartGridComm (SGC) Symposium on Cyber Securityand Privacy. 2015.
[RR16] A. Reinhardt and D. Reinhardt. “Detecting Anomalous Elec-trical Appliance Behavior based on Motif Transition Likeli-hood Matrices.” In: Proceedings of the IEEE International Con-ference on Smart Grid Communications (SmartGridComm), Sym-

references 57
posium on Data Management and Grid Analytics and DynamicPricing. 2016.
[RR15] A. Reinhardt and C. Renner. “RoCoCo: Receiver-initiatedOpportunistic Data Collection and Command Multicastingfor WSNs.” In: Proceedings of the 12th European Conference onWireless Sensor Networks (EWSN). 2015.
[RPL+10] Z. Remscrim, J. Paris, S. Leeb, S. Shaw, S. Neuman, C.Schantz, S. Muller, and S. Page. “FPGA-based Spectral En-velope Preprocessor for Power Monitoring and Control.” In:Proceedings of the 25th Annual IEEE Applied Power ElectronicsConference and Exposition (APEC). 2010.
[RTI08] I. Richardson, M. Thomson, and D. Infield. “A High-Resolution Domestic Building Occupancy Model for EnergyDemand Simulations.” In: Energy and Buildings 40.8 (2008).
[RGH13] A. Ridi, C. Gisler, and J. Hennebert. “ACS-F2 – A NewDatabase of Appliance Consumption Signatures.” In: Pro-ceedings of the 6th International Conference of Soft Computingand Pattern Recognition (SoCPaR). 2013.
[RRR+12] M. Ringwelski, C. Renner, A. Reinhardt, A. Weigel, and V.Turau. “The Hitchhiker’s Guide to Choosing the Compres-sion Algorithm for Your Smart Meter Data.” In: Proceedingsof the 2nd IEEE ENERGYCON Conference and Exhibition / ICTfor Energy Symposium (ENERGYCON). 2012.
[RAD78] R. L. Rivest, L Adleman, and M. L. Dertouzos. “On DataBanks and Privacy Homomorphisms.” In: Foundations ofSecure Computation 4.11 (1978).
[RNS+10] A. Ruzzelli, C. Nicolas, A. Schoofs, and G. O’Hare. “Real-Time Recognition and Profiling of Appliances through aSingle Electricity Sensor.” In: Proceedings of the 7th AnnualIEEE Communications Society Conference on Sensor Mesh andAd Hoc Communications and Networks (SECON). 2010.
[SGD+10] A. Schoofs, A. Guerrieri, D. T. Delaney, G. M. P. O’Hare, andA. G. Ruzzelli. “ANNOT: Automated Electricity Data Anno-tation Using Wireless Sensor Networks.” In: Proceedings ofthe 7th Annual IEEE Communications Society Conference on Sen-sor Mesh and Ad Hoc Communications and Networks (SECON).2010.
[SWH+15] M. Schreiber, M. E. Wainstein, P. Hochloff, and R. Dargaville.“Flexible Electricity Tariffs: Power and Energy Price SignalsDesigned for a Smarter Grid.” In: Energy 93 (2015).
references 58
[SLN+08] S. Shaw, S. Leeb, L. Norford, and R. Cox. “NonintrusiveLoad Monitoring and Diagnostics in Power Systems.” In:IEEE Transactions on Instrumentation and Measurement 57.7(2008).
[Smo12] R. Smolenski. “EMI Measuring Procedures in Smart Grids.”In: Conducted Electromagnetic Interference (EMI) in Smart Grids.Springer London, 2012.
[TSB+14] M. G. Tauber, F. Skopik, T. Bleier, and D. Hutchison. “ASelf-organising Approach for Smart Meter CommunicationSystems.” In: Proceedings of the 7th IFIP TC 6 InternationalWorkshop on Self-Organizing Systems (IWSOS). 2014.
[TGM10] Z. C. Taysi, M. A. Guvensan, and T. Melodia. “TinyEARS:Spying on House Appliances with Audio Sensor Nodes.”In: Proceedings of the 2nd ACM Workshop on Embedded SensingSystems for Energy-Efficiency in Building (BuildSys). 2010.
[URT12] S. Unterschütz, C. Renner, and V. Turau. “Opportunistic,Receiver-Initiated Data-Collection Protocol.” In: Proceedingsof the 9th European Conference on Wireless Sensor Networks(EWSN). 2012.
[URP15] A. S. N. Uttama Nambi, A. Reyes Lua, and V. R. Prasad.“LocED: Location-aware Energy Disaggregation Frame-work.” In: Proceedings of the 2nd ACM International Conferenceon Embedded Systems for Energy-Efficient Built Environments(BuildSys). 2015.
[VDE16] VDE Verband der Elektrotechnik Elektronik Information-stechnik e.V.; Forum Netztechnik/Netzbetrieb im VDE(FNN). Störungs- und Verfügbarkeitsstatistik, Berichtsjahr 2015.2016.
[WL13] W. Wang and Z. Lu. “Cyber Security in the Smart Grid:Survey and Challenges.” In: Elsevier Computer Networks 57.5(2013).
[WHM+12] M. Weiss, A. Helfenstein, F. Mattern, and T. Staake. “Lever-aging Smart Meter Data to Recognize Home Appliances.”In: Proceedings of the IEEE International Conference on PervasiveComputing and Communications (PerCom). 2012.
[WBD+11] T. Weng, B. Balaji, S. Dutta, R. Gupta, and Y. Agarwal. “Man-aging Plug-loads for Demand Response Within Buildings.”In: Proceedings of the 3rd ACM Workshop on Embedded SensingSystems for Energy-Efficiency in Buildings (BuildSys). 2011.
[ZR11] M. Zeifman and K. Roth. “Nonintrusive Appliance LoadMonitoring: Review and Outlook.” In: IEEE Transactions onConsumer Electronics 57.1 (2011).

references 59
[ZJW+14] J. Zhao, T. Jung, Y. Wang, and X. Li. “Achieving DifferentialPrivacy of Data Disclosure in the Smart Grid.” In: Proceed-ings of the IEEE International Conference on Computer Commu-nications (INFOCOM). 2014.
[ZGI+12] A. Zoha, A. Gluhak, M. A. Imran, and S. Rajasegarar. “Non-Intrusive Load Monitoring Approaches for DisaggregatedEnergy Sensing: A Survey.” In: MDPI Sensors 12 (2012).


7L I S T O F A C R O N Y M S
5G fifth generation of mobile communication systems
AAL Ambient Assisted Living
AC Alternating Current
ADC Analog-to-Digital Converter
AMI Advanced Metering Infrastructure
CSV Comma-Separated Values
DC Direct Current
DSO Distribution System Operator
EMI Electromagnetic Interference
FFT Fast Fourier Transform
ICT Information and Communication Technology
IoT Internet of Things
MPPT Maximum Power Point Tracking
NILM Non-Intrusive Load Monitoring
PMU Phasor Measurement Unit
PV photovoltaic
RMSE Root-Mean-Square Error
SPI Serial Peripheral Interface
TSO Transmission System Operator
WSN Wireless Sensor Network
61


AP U B L I C AT I O N S C O N T R I B U T I N G T O T H I S H A B I L I TAT I O NT H E S I S
The following scientific contributions have been presented in this manuscript.
A. Reinhardt, P. Baumann, D. Burgstahler, M. Hollick, H. Chonov, M.Werner, and R. Steinmetz. “On the Accuracy of Appliance IdentificationBased on Distributed Load Metering Data.” In: Proceedings of the 2nd IFIPConference on Sustainable Internet and ICT for Sustainability (SustainIT). 2012,pp. 1–9, cited on page 26 of this thesis.
Contribution: A load signature data set is presented in this paper, which hasbeen collected as part of Hristo Chonov’s B.Sc. thesis, which I supervised.The data set has undergone post-processing by Burgstahler and Werner. Asits second contribution, the paper presents a machine learning-based dataprocessing solution to identify appliances based on their load signatures. Thisalgorithm has been implemented by myself, based on student contributions.I was supported by Baumann in the evaluations. Hollick and Steinmetzcontributed to the writing. Overall, I contributed more than half of this paper.
A. Reinhardt, D. Burkhardt, M. Zaheer, and R. Steinmetz. “Electric Appli-ance Classification Based on Distributed High Resolution Current Sensing.”In: Proceedings of the 7th IEEE International Workshop on Practical Issues inBuilding Sensor Network Applications (SenseApp). 2012, pp. 1003–1009, citedon page 28 of this thesis.
Contribution: This paper summarizes the outcomes of Dominic Burkhardt’sB.Sc. thesis, which he wrote under my supervision. All conceptual consid-erations were jointly developed in weekly meetings and implemented byBurkhardt. Co-author Zaheer has been responsible for the practical evalua-tions. Steinmetz made textual contributions to the manuscript. Burkhardt andI equally shared the workload and put the same efforts into this paper.
A. Reinhardt and D. Burgstahler. “Exploiting Platform Heterogeneity inWireless Sensor Networks by Shifting Resource-Intensive Tasks to DedicatedProcessing Nodes.” In: Proceedings of the 14th International Symposium on aWorld of Wireless, Mobile and Multimedia Networks (WoWMoM). 2013, pp. 1–9,cited on page 22 of this thesis.
Contribution: This paper presents the results of Daniel Burgstahler’s M.Sc.thesis, which he wrote under my supervision. I proposed the paper’s fun-damental concept of understanding and exploiting system heterogeneity in
63
publications contributing to this habilitation thesis 64
networks of embedded systems, and held weekly meetings to discuss conceptsto utilize it in practice. Burgstahler was responsible for the implementationsand evaluations on different hardware platforms and contributed paragraphsto the paper. The workload was equally shared between the two authors.
A. Reinhardt and S. Koessler. “PowerSAX: Fast Motif Matching in Dis-tributed Power Meter Data Using Symbolic Representations.” In: Proceedingsof the 9th IEEE International Workshop on Practical Issues in Building SensorNetwork Applications (SenseApp). 2014, pp. 531–538, cited on page 18 of thisthesis.
Contribution: This publication is an outcome of Sebastian Kößler’s studentresearch project, conducted at UNSW Australia under my supervision.Conceptual considerations for solving the motif matching problem in loadsignature data were drafted in weekly discussions and subsequently imple-mented and evaluated by the student. Each co-author contributed about thesame amount of work to this publication.
A. Reinhardt, D. Christin, and S. S. Kanhere. “Can Smart Plugs Predict Elec-tric Power Consumption? A Case Study.” In: Proceedings of the 11th Interna-tional Conference on Mobile and Ubiquitous Systems: Computing, Networking andServices (MobiQuitous). 2014, pp. 257–266, cited on page 30 of this thesis.
Contribution: This work on assessing the potential of predicting future appli-ance electricity consumption has been completely conducted by myself. Minorlanguage revisions were proposed by Christin and Kanhere.
A. Reinhardt, F. Englert, and D. Christin. “Averting the Privacy Risksof Smart Metering by Local Data Preprocessing.” In: Pervasive and MobileComputing (PMC) 16 (2015), pp. 171–183, cited on page 38 of this thesis.
Contribution: The impact of load obfuscation on appliance classification accu-racy is studied in this work. I am responsible for the scientific approach takenand its implementation. Co-author Englert has supported this publicationby conducting all necessary evaluations, co-author Christin has proposedselected initial ideas and contributed paragraphs to the paper. Overall, morethan two thirds of this study were based on my contributions.
A. Reinhardt and C. Renner. “RoCoCo: Receiver-initiated OpportunisticData Collection and Command Multicasting for WSNs.” In: Proceedings of the12th European Conference on Wireless Sensor Networks (EWSN). 2015, pp. 218–233, cited on page 20 of this thesis.
Contribution: This paper is joint work with Bernd-Christian Renner withwhom all stages of the research have been conducted conjointly. We bothcontributed to an equal extent to the implementation, evaluation, and writing.
publications contributing to this habilitation thesis 65
A. Reinhardt, G. Konstantinou, D. Egarter, and D. Christin. “WorriedAbout Privacy? Let Your PV Converter Cover Your Electricity ConsumptionFingerprints.” In: Proceedings of the IEEE International Conference on Smart GridCommunications (SmartGridComm) Symposium on Cyber Security and Privacy.2015, pp. 25–30, cited on page 40 of this thesis.
Contribution: In this work, we use active components to enhance user privacyin smart grids. While I have taken primary responsibility for the work, theco-authors have contributed at different stages. Egarter has been active duringthe evolution of the concept, given his own prior work on related topics.Konstantinou has contributed simulation models of photovoltaic convertersand evaluated how their intentional deviation from the maximum powerpoint impacts their operation in practice. Co-author Christin has assisted indetermining to what extent privacy protection can be improved by means ofthe proposed approach. In total, I have contributed about half of this paper.
A. Reinhardt and D. Reinhardt. “Detecting Anomalous Electrical ApplianceBehavior based on Motif Transition Likelihood Matrices.” In: Proceedings ofthe IEEE International Conference on Smart Grid Communications (SmartGrid-Comm) Symposium on Data Management, Grid Analytics and Dynamic Pricing.2016, pp. 704–709, cited on page 32 of this thesis.
Contribution: Anomalous appliance consumption behavior is often an indica-tor for mechanical wear and thus hints at the risk of device failure. This paperthus presents an anomaly detection algorithm based on transition matriceswhich I have devised, implemented, and evaluated. I am the paper’s principalcontributor, and co-author Delphine Reinhardt has primarily supported me inwriting the paper.
A. Reinhardt. “Adaptive Load Signature Coding for Electrical ApplianceMonitoring over Low-Bandwidth Communication Channels.” In: Proceedingsof the 5th IFIP Conference on Sustainable Internet and ICT for Sustainability(SustainIT). 2017, pp. 1–8, cited on page 17 of this thesis.
Contribution: I am the only author of this paper and fully responsible for allcontributions of this work.
N. Buneeva and A. Reinhardt. “AMBAL: Realistic Load Signature Genera-tion for Load Disaggregation Performance Evaluation.” In: Proceedings of theIEEE International Conference on Smart Grid Communications (SmartGridComm)Symposium on Big Data Management and Analytics. 2017, pp. 443–448, cited onpage 34 of this thesis.
Contribution: This thesis summarizes the key contributions of NadezdaBuneeva’s M.Sc. thesis which she wrote under my supervision. I have con-tributed the initial idea for this work and to writing the paper. In turn, the

publications contributing to this habilitation thesis 66
concept of this work has been conjointly developed during weekly meetingsand was fully implemented and evaluated by the student. Each co-authorcontributed about the same amount of effort to this work.
A. Reinhardt. “TUCap: A Sensing System to Capture and Process AppliancePower Consumption in Smart Spaces.” In: Proceedings of the 16th GI/ITGKuVS Fachgespräch “Sensornetze” (FGSN). 2017, pp. 31–34, cited on page 16
of this thesis.
Contribution: I am the only author of this paper and fully responsible for allcontributions of this work.