Embed Size (px)
Citation preview
Advancing Equity in Transportation in Oakland, California May 2016
ADVANCING EQUITY IN TRANSPORTATION IN OAKLAND, CALIFORNIA
FERN UENNATORNWARANGGOON
Client Report submitted in partial fulfillment of the
requirements for the degree of
MASTER OF CITY PLANNING
Department of City and Regional Planning University of California, Berkeley
May 2016
Committee: Karen Chapple Karen Trapenberg Frick Matt Nichols
Advancing Equity in Transportation in Oakland, California May 2016
Disclaimer
This client report has been prepared for the Office of Oakland Mayor Libby Schaaf, at the direction of Matt Nichols, Policy Director for Transportation & Infrastructure. The author conducted this study in partial fulfillment of the requirements for the degree of Master in City Planning at the Department of City and Regional Planning, UC Berkeley. The judgments and conclusions are solely those of the author, and are not necessarily endorsed by the UC Berkeley, the sponsoring organization, or any other agency.
Acknowledgement
I would like to thank Professors Karen Chapple and Karen Frick for their guidance and helpful suggestions in the completion of this report. My deepest thanks to Matt Nichols, who gave me the opportunity to work in the uniquely wonderful City of Oakland and to experience first-hand the opportunities and challenges of planning in a fast changing city. My gratitude to colleagues in the City of Oakland and in the transportation justice community for generously giving their time to share important insights and advice that went into this work. Lastly, a big thank you to my fellow MCP students for their comradery and support throughout our two years in the program.
Advancing Equity in Transportation in Oakland, California May 2016
1
CONTENTS
I. EXECUTIVE SUMMARY 3
II. INTRODUCTION 5
OBJECTIVE 5 STUDY QUESTIONS 6 TRANSPORTATION ISSUES OF FOCUS 7 METHODOLOGIES 7
III. LITERATURE REVIEW 8
DEFINING TRANSPORTATION EQUITY 8 REVIEW OF PRACTICE 13
IV. BACKGROUND 15
OAKLAND CITY CONTEXT 15 OAKLAND TRANSPORTATION EQUITY CHALLENGE 19 NEW MOMENTUM 21
V. FINDINGS & DISCUSSION 22
1. STREET PAVING 22 2. SAFE STREETS FOR PEDESTRIANS AND CYCLISTS 27 3. THE GROWING SHARED MOBILITY SECTOR 33 4. ACCESS AND AFFORDABILITY OF TRANSIT 37
VI. RECOMMENDATIONS & CONCLUSIONS 41
VII. RECOMMENDATIONS SUMMARY TABLE 45
VIII. REFERENCES 52
APPENDICES 55
Advancing Equity in Transportation in Oakland, California May 2016
2
List of Figures
Figure 1: Transportation equity framework Figure 2: ‘Equity Ladder’ – a framework for equity standards Figure 3: MTC equity analysis framework Figure 4: Mode split for Oakland commuters Figure 5a: Median household income by block group Figure 5b: Percent of minority populations by block group Figure 6a: Percent of household with zero vehicle Figure 6b: Percent of household with fewer vehicles than household members Figure 6: Minority populations and concentration of low-vehicle households Figure 7: Map of Oakland Pavement Condition Index Figure 8: Pedestrian-vehicle collisions in Oakland 1996-2000 Figure 9: Mobility Hub Suitability Map
List of Tables
Table 1: Oakland racial and ethnic composition Table 2: Household median income Table 3: Oakland inflow/outflow workforce Table 4: Comparison of Disadvantaged Populations Index, Pavement Condition Index and 5-year planned repaving Table 5a: Example of a weighting scale based on Disadvantaged Populations Index Table 5b: Changes in amount of repaving when applying DPI-based weighting List of Abbreviations
ACS American Community Survey AC Transit Alameda-Contra Costa Transit District BART Bay Area Rapid Transit BRT Bus Rapid Transit CBTP Community Based Transportation Plan LEHD Longitudinal Employer-Household Dynamics MTC Metropolitan Transportation Commission
Advancing Equity in Transportation in Oakland, California May 2016
3
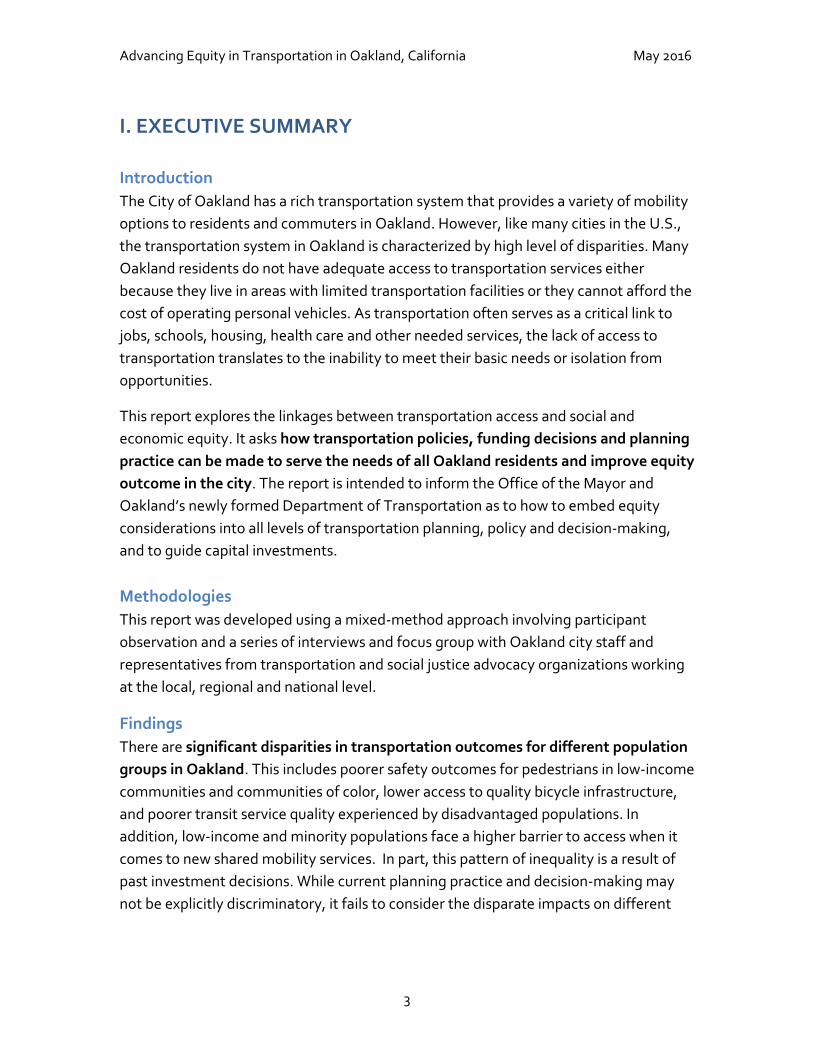
I. EXECUTIVE SUMMARY Introduction The City of Oakland has a rich transportation system that provides a variety of mobility options to residents and commuters in Oakland. However, like many cities in the U.S., the transportation system in Oakland is characterized by high level of disparities. Many Oakland residents do not have adequate access to transportation services either because they live in areas with limited transportation facilities or they cannot afford the cost of operating personal vehicles. As transportation often serves as a critical link to jobs, schools, housing, health care and other needed services, the lack of access to transportation translates to the inability to meet their basic needs or isolation from opportunities.
This report explores the linkages between transportation access and social and economic equity. It asks how transportation policies, funding decisions and planning practice can be made to serve the needs of all Oakland residents and improve equity outcome in the city. The report is intended to inform the Office of the Mayor and Oakland’s newly formed Department of Transportation as to how to embed equity considerations into all levels of transportation planning, policy and decision-making, and to guide capital investments. Methodologies This report was developed using a mixed-method approach involving participant observation and a series of interviews and focus group with Oakland city staff and representatives from transportation and social justice advocacy organizations working at the local, regional and national level.
Findings There are significant disparities in transportation outcomes for different population groups in Oakland. This includes poorer safety outcomes for pedestrians in low-income communities and communities of color, lower access to quality bicycle infrastructure, and poorer transit service quality experienced by disadvantaged populations. In addition, low-income and minority populations face a higher barrier to access when it comes to new shared mobility services. In part, this pattern of inequality is a result of past investment decisions. While current planning practice and decision-making may not be explicitly discriminatory, it fails to consider the disparate impacts on different
Advancing Equity in Transportation in Oakland, California May 2016
4
populations. As such it can have an exclusionary effect and lead to inequitable outcomes as shown in this report.
Recommendations There is an emergent practice of integrating equity considerations into transportation planning in Oakland, starting with equity analyses in modal plans such as the bike and pedestrian plans, and in the new shared mobility sector. However, to achieve a systemic change, equity principles would need to be instituted in the city’s transportation practice at all levels from vision, policy formation, planning and funding allocation, through to individual programs and projects. The new Department of Transportation (DOT) presents a prime opportunity to do so and the city needs to ensure that equity principles are codified into policies and incorporated into standard operating procedures as the DOT becomes established.
Advancing Equity in Transportation in Oakland, California May 2016
5
II. INTRODUCTION The City of Oakland is a major transportation hub for the San Francisco Bay Area region; it hosts a diverse range of transportation systems including local streets, regional road and highways, freight and passenger rail, bus systems and ferries. The city is well served by transit with many high-capacity bus trunk lines provided by Alameda-Contra Costa Transit District (AC Transit) and commuter rail operated by the Bay Area Rapid Transit (BART). Such rich transportation system provides a variety of mobility options to residents and commuters in Oakland.
However, like many cities in the U.S., the transportation system in Oakland is characterized by a high level of disparities. Many Oakland residents do not have adequate access to transportation services either because they live in areas with limited transportation facilities or they cannot afford the cost of operating personal vehicles. As transportation often serves as a critical link to jobs, schools, housing, health care and other needed services, the lack of access to transportation translates to an inability to meet their basic needs and presents a barrier to other opportunities.
Transportation planning and investment decisions can bring fundamental improvements in communities that support their development and growth, or they can exclude them from access, isolating them from opportunities. Indeed, many communities in Oakland have borne the brunt of infrastructure disinvestments in the past and are still underserved today. Recognizing the history of disinvestments and the growing social and economic inequality that many residents experience today, the issue of transportation has become a priority for the City of Oakland. This report explores the linkages between transportation access and social and economic inequalities. It asks how transportation policies, funding decisions and planning practice more generally can be made to serve the needs of all Oakland residents and improve equity outcomes in the city.
Objective This report is intended to inform the Office of the Mayor and Oakland’s newly formed Department of Transportation and Department of Race and Equity as to how best to measure and embed equity considerations in all levels of transportation planning, policy and decision-making and to guide capital investments. It is envisioned that the report will serve as a guide for relevant officials involved in transportation on how to incorporate equity perspectives as a standard procedure at all levels of the city’s
Advancing Equity in Transportation in Oakland, California May 2016
6
transportation decision-making. The ultimate goal is to improve transportation access and affordability for disadvantaged and underserved populations. Currently, there is no formal practice in the City of Oakland to incorporate equity considerations into transportation planning and investment. There is no formal policy or administrative guidance, and equity analysis is neither mandated nor practiced as part of transportation decision-making at the city level. However, the planning practice in Oakland is evolving and this report captures insights from this emerging effort. The following sub-sections describe the approach used in conducting the research for this report. They lay out the study questions that guided the research, a brief framework for considering different types of equity, and selected transportation issues that are the focus of this report and research methodologies.
Study Questions Current transportation equity challenges:
x What are the equity concerns related to transportation infrastructure and services in Oakland?
x How accessible and affordable is transportation for low-income residents and communities of concern in Oakland?
x What are current policies and practices that attempt to address inequity in transportation in Oakland? Do any policies worsen inequity?
What next: x What are current impediments to advancing transportation equity? x What policies and practices are needed to advance equity in transportation in
Oakland? x How can Oakland expand transportation options for low-income residents and
communities of concern? x What transportation investments should Oakland prioritize over the next 3 years to
improve accessibility and affordability? x What are potential equity indices that can track and inform transportation
maintenance activities and the way transportation investments are prioritized?
There are many ways to consider equity in transportation as outlined by Litman (2015). This report focuses primarily on socio-economic and demographic equity, that is, on the distribution of investment and benefits to different user groups. (Benefits include access to economic opportunities and other services necessary for a healthy and
Advancing Equity in Transportation in Oakland, California May 2016
7
productive life.) To a lesser extent, the report will focus on geographic equity (to the extent that it relates to spatial distribution of different demographic groups, especially communities of concern), modal equity (defined as access to different modes of transportation), and ability-based equity (to the extent that a high proportion of disabled population tend to be mobility disadvantaged, and a large proportion are low-income).
Transportation Issues of Focus This report highlights four transportation planning issues that Oakland staff have identified as their current priorities. The first three issues – paving, safe streets for pedestrians and cyclists and the growing shared mobility sector – are areas where there is currently a strong drive toward a more equitable outcome. There are also linkages and interdependencies between paving and safe streets which is further discussed in Section V. In analyzing transportation equity, transit is a key issue as disadvantaged populations – whether they are socio-economically or physically disadvantaged – are often dependent on transit systems. Lastly, there are overarching issues, presented in the concluding section, related to transportation planning practice more generally that cut across all modes and are presented in Section VI.
1. Street Paving 2. Safe Streets for Pedestrians and Cyclists 3. Rapidly Growing Shared Mobility Sector 4. Quality of Transit
Methodologies This report was developed using a mixed-method qualitative approach involving participant observation based on my internship with the Director of Transportation and Infrastructure Policy in the Mayor’s Office over a 10-month period. During this time I provided on-going planning and coordination support to the Director on a wide range of transportation issues including the establishment of the new Department of Transportation, helping to prepare the groundwork for Oakland’s first Transportation Strategic Plan, supporting the planning and implementation of a potential infrastructure bond measure, and liaising with environmental and social justice advocacy groups.
In addition, findings and insights in this report are drawn from interviews and focus group with relevant stakeholders including:
Advancing Equity in Transportation in Oakland, California May 2016
8
x 8 interviews and 1 focus group with Oakland city staff whose roles relate directly to transportation planning and decision-making, as well as a representative of the recently established Department of Race and Equity; and
x 5 interviews with representatives of transportation and social justice advocacy organizations who work at the local, regional and national level.
The report also includes a review of the literature related to transportation equity and emerging practices from other cities. I also draw from secondary data sources including the U.S. Census and American Community Survey, Longitudinal Employer-Household Dynamics, and California Household Travel Data, to provide a profile of equity challenges in relation to transportation in Oakland.
III. LITERATURE REVIEW The section presents a review of different ways in which transportation equity is defined and measured, drawing on legal frameworks, academic literature, as well as policies and plans of key transportation authorities and other organizations working on transportation justice and social equity. It also highlights emerging practices from other cities on how to advance equity considerations into transportation planning.
Defining Transportation Equity Many of the equity considerations in transportation planning and decision-making at the regional and local levels derive from laws, regulations, and policies set at the federal level, starting with Title VI of the Civil Rights Act of 1964 and subsequent federal Environmental Justice laws. Some of the key laws that are pertinent to equity considerations in transportation include the Americans with Disabilities Act of 1990 which aims to ensure equal opportunity for persons with disabilities in employment, state and local government services, public accommodations, commercial facilities, and transportation; Executive Order 12898 “Federal Actions to Address Environmental Justice in Minority Populations and Low-Income Populations” of 1994 which charged each federal agency with the mandate to achieve environmental justice by identifying and addressing disproportionately high and adverse human health or environmental effects of its programs, policies, and activities on minority populations and low-income populations; and the Transportation Equity Act for the 21st Century (TEA-21) which attempts to broaden opportunities for public participation in transportation decision making. A more comprehensive list of laws and regulations can be found in Appendix A.
At the heart of it, these laws, regulations and policies are designed to ensure that transportation decisions meet the needs of all people by looking at the distributional
Advancing Equity in Transportation in Oakland, California May 2016
9
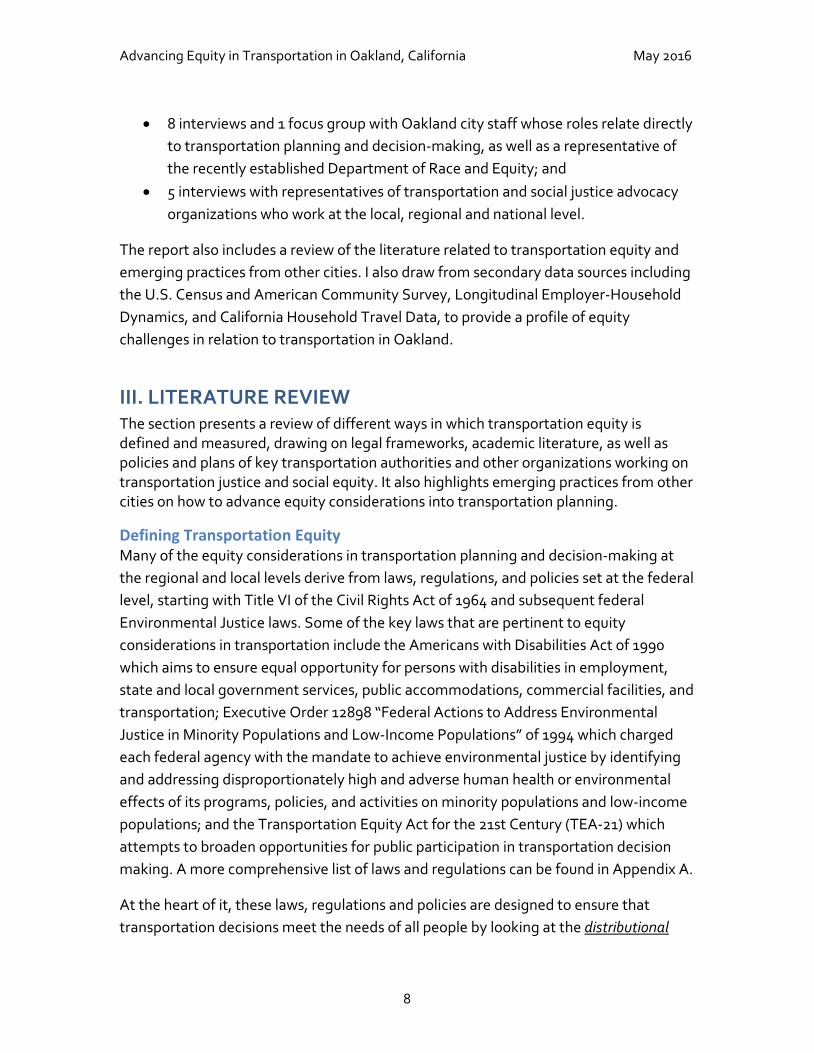
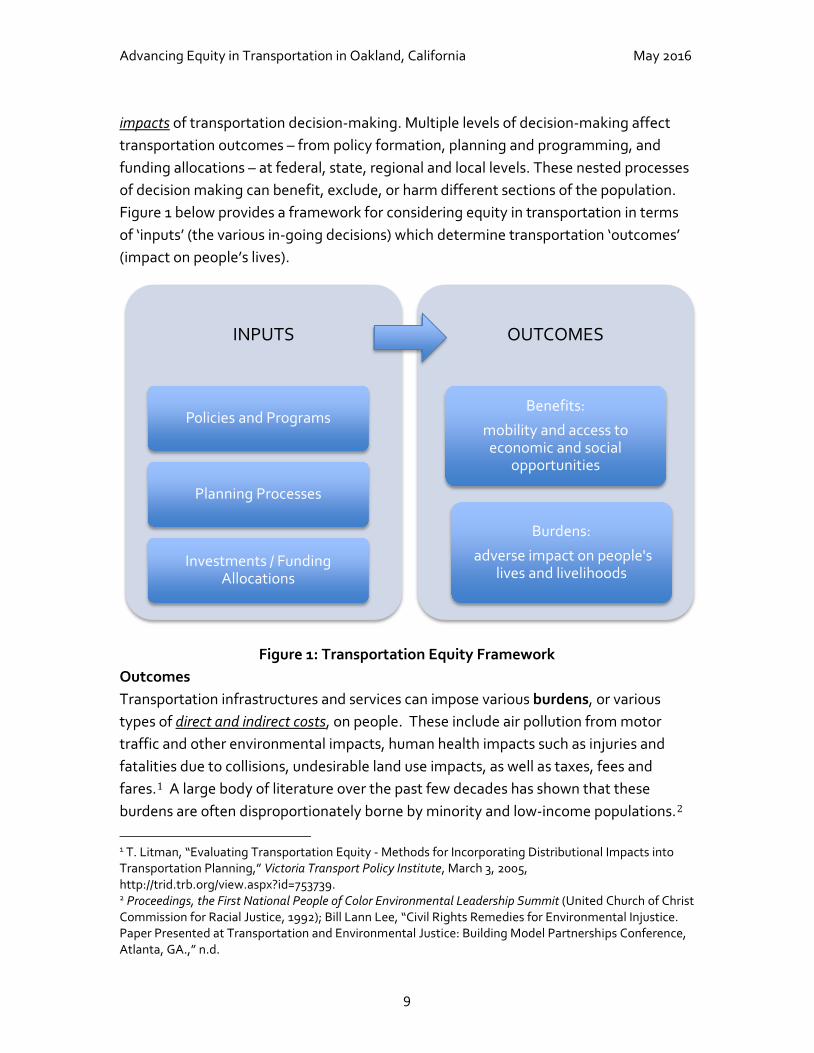
impacts of transportation decision-making. Multiple levels of decision-making affect transportation outcomes – from policy formation, planning and programming, and funding allocations – at federal, state, regional and local levels. These nested processes of decision making can benefit, exclude, or harm different sections of the population. Figure 1 below provides a framework for considering equity in transportation in terms of ‘inputs’ (the various in-going decisions) which determine transportation ‘outcomes’ (impact on people’s lives).
Figure 1: Transportation Equity Framework Outcomes Transportation infrastructures and services can impose various burdens, or various types of direct and indirect costs, on people. These include air pollution from motor traffic and other environmental impacts, human health impacts such as injuries and fatalities due to collisions, undesirable land use impacts, as well as taxes, fees and fares.1 A large body of literature over the past few decades has shown that these burdens are often disproportionately borne by minority and low-income populations.2
1 T. Litman, “Evaluating Transportation Equity - Methods for Incorporating Distributional Impacts into Transportation Planning,” Victoria Transport Policy Institute, March 3, 2005, http://trid.trb.org/view.aspx?id=753739. 2 Proceedings, the First National People of Color Environmental Leadership Summit (United Church of Christ Commission for Racial Justice, 1992); Bill Lann Lee, “Civil Rights Remedies for Environmental Injustice. Paper Presented at Transportation and Environmental Justice: Building Model Partnerships Conference, Atlanta, GA.,” n.d.
INPUTS
Policies and Programs
Planning Processes
Investments / Funding Allocations
OUTCOMES
Benefits:
mobility and access to economic and social
opportunities
Burdens:
adverse impact on people's lives and livelihoods
Advancing Equity in Transportation in Oakland, California May 2016
10
One common pattern is disparate highway siting in low-income communities and communities of color that destroys the fabric of the neighborhood fabric and has negative health impacts on residents.3 Indeed, many of the efforts to advance transportation equity grew out of the environmental justice movement, which is concerned with mitigating these impacts on disadvantaged populations. The above framework also points to transportation benefits primarily in terms of mobility and access. In the Bay Area and much of the U.S., where land uses are dispersed in a generally low density suburban form, a lack or low quality of transportation can directly result in a lack of opportunities for work, school, recreation, and social networks, profoundly impacting the prospects for communities and individuals (Ong and Blumenberg, 1998; Ihlanfeldt and Sjoquist, 1998; Taylor and Ong, 1995; Sanchez et al., 2003; Lucas, 2006). Transportation provides a crucial link to economic and social opportunities and critical services that ultimately affect people’s livelihoods and welfare. Benefits and burdens of transportation are two sides of the same coin and both are important aspects of transportation equity. The emphasis of this report, however, is on the distribution of benefits, with the main goal being inclusive transportation which focuses on expanding access to transportation to underserved populations. In addition, access to transportation is defined not only as availability of transportation services but also as access to transportation options that are affordable, reliable and efficient. Inputs A substantial amount of research has shown that public investments in transportation infrastructures and services often benefit some groups of people more than others.4 Research show that large disparities exist in levels of transportation access by different population groups. For instance, Blumenburg and Ong (1998, 2004) found that low-income women and welfare recipients face higher travel cost burden and lower job accessibility.5, 6, 7 This body of literature also finds that for low-income populations,
3 Robert Doyle Bullard and Glenn Steve Johnson, Just Transportation: Dismantling Race and Class Barriers to Mobility (New Society Publishers, 1997). 4 Robert Bullard, “Addressing Urban Transportation Equity in the United States,” Fordham Urban Law Journal 31, no. 5 (January 1, 2003): 1183. 5 Paul Ong and Evelyn Blumenberg, “Job Access, Commute and Travel Burden among Welfare Recipients,” Urban Studies 35, no. 1 (1998): 77–93. 6 Evelyn Blumenberg, “En-Gendering Effective Planning: Spatial Mismatch, Low-Income Women, and Transportation Policy,” Journal of the American Planning Association 70, no. 3 (2004): 269–81.
Advancing Equity in Transportation in Oakland, California May 2016
11
longer commutes (whether in travel-time or distances) result in significantly lower earnings compared to higher-wage worker groups. Conversely, access to effective transportation can lead to increased access to job opportunity and allow people to access services to meet other needs. However, the spatial distribution of jobs, services and where people live are complex, leading to vastly differentiated travel patterns and needs across population groups. 8, 9, 10 As such, transportation decisions need to be informed by context-specific analysis and should be targeted for different population groups in different geographies.
A related set of research finds persistent inequities in transportation investments. In studying the 2005 case of Darensburg et al. v. Metropolitan Transportation Commission, a case of Title VI complaint, Golub (2013) found that regional transportation planning processes in the Bay Area disproportionately benefit a higher income, mostly white population, while overlooking bus riders who tend to be low-income people of color. (See Box 1 below). Assessment of existing legal frameworks such as the TEA-21 also found deficiencies in policy implementation that results in inequitable transportation investment decisions being made.
Box 1. Racial Inequity in Transportation Planning in the Bay Area In 2005, a group of minority bus riders in the San Francisco Bay Area brought a federal civil rights lawsuit against the Metropolitan Transportation Commission (Darensburg et al. v. MTC). The plaintiff highlighted the disparities both in the subsidy per rider ($3 per trip for bus riders vs. $6-$14 for BART riders) and in service levels over the last two decades (stagnant bus service while rail service more than doubled) (Public Advocates, 2009). They asserted that this unequal treatment was a direct result of MTC’s regional transportation planning and funding practices. Ultimately, both the District Court and the Ninth Circuit Court ruled in favor of MTC, believing that there was no discriminatory intent and that the outcome was the pragmatic result of the agency’s attempt to balance diverse demands.
7 Evelyn Blumenberg and Michael Manville, “Beyond the Spatial Mismatch: Welfare Recipients and Transportation Policy,” Journal of Planning Literature 19, no. 2 (2004): 182–205. 8 Evelyn Blumenberg, “On the Way to Work: Welfare Participants and Barriers to Employment,” Economic Development Quarterly 16, no. 4 (2002): 314–25. 9 Robert Cervero, Onésimo Sandoval, and John Landis, “Transportation as a Stimulus of Welfare-to-Work Private versus Public Mobility,” Journal of Planning Education and Research 22, no. 1 (September 1, 2002): 50–63. 10 Neil Bania, Laura Leete, and Claudia Coulton, “Job Access, Employment and Earnings: Outcomes for Welfare Leavers in a US Urban Labour Market,” Urban Studies 45, no. 11 (October 1, 2008): 2179–2202.
Advancing Equity in Transportation in Oakland, California May 2016
12
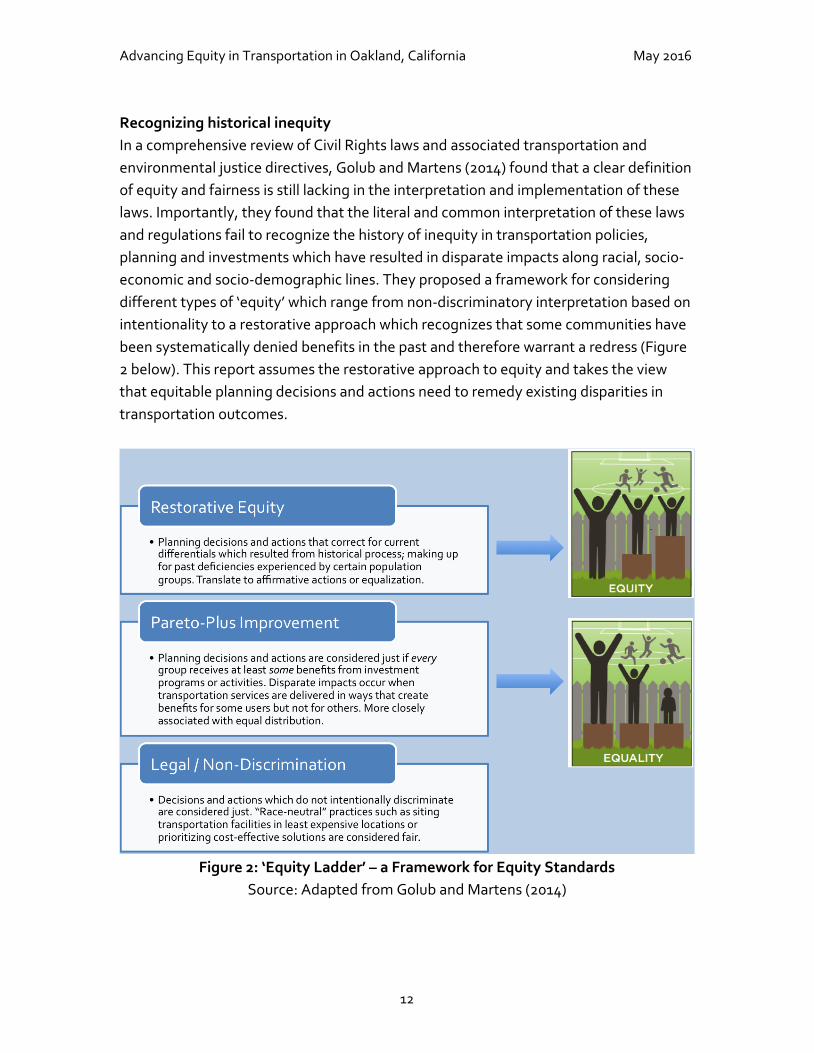
Recognizing historical inequity In a comprehensive review of Civil Rights laws and associated transportation and environmental justice directives, Golub and Martens (2014) found that a clear definition of equity and fairness is still lacking in the interpretation and implementation of these laws. Importantly, they found that the literal and common interpretation of these laws and regulations fail to recognize the history of inequity in transportation policies, planning and investments which have resulted in disparate impacts along racial, socio-economic and socio-demographic lines. They proposed a framework for considering different types of ‘equity’ which range from non-discriminatory interpretation based on intentionality to a restorative approach which recognizes that some communities have been systematically denied benefits in the past and therefore warrant a redress (Figure 2 below). This report assumes the restorative approach to equity and takes the view that equitable planning decisions and actions need to remedy existing disparities in transportation outcomes.
Figure 2: ‘Equity Ladder’ – a Framework for Equity Standards
Source: Adapted from Golub and Martens (2014)
Advancing Equity in Transportation in Oakland, California May 2016
13
Review of Practice This section presents a review of how key transportation authorities and other organizations working on transportation and social equity define transportation equity. It also highlights emerging practices in other cities that integrate equity considerations into transportation planning.
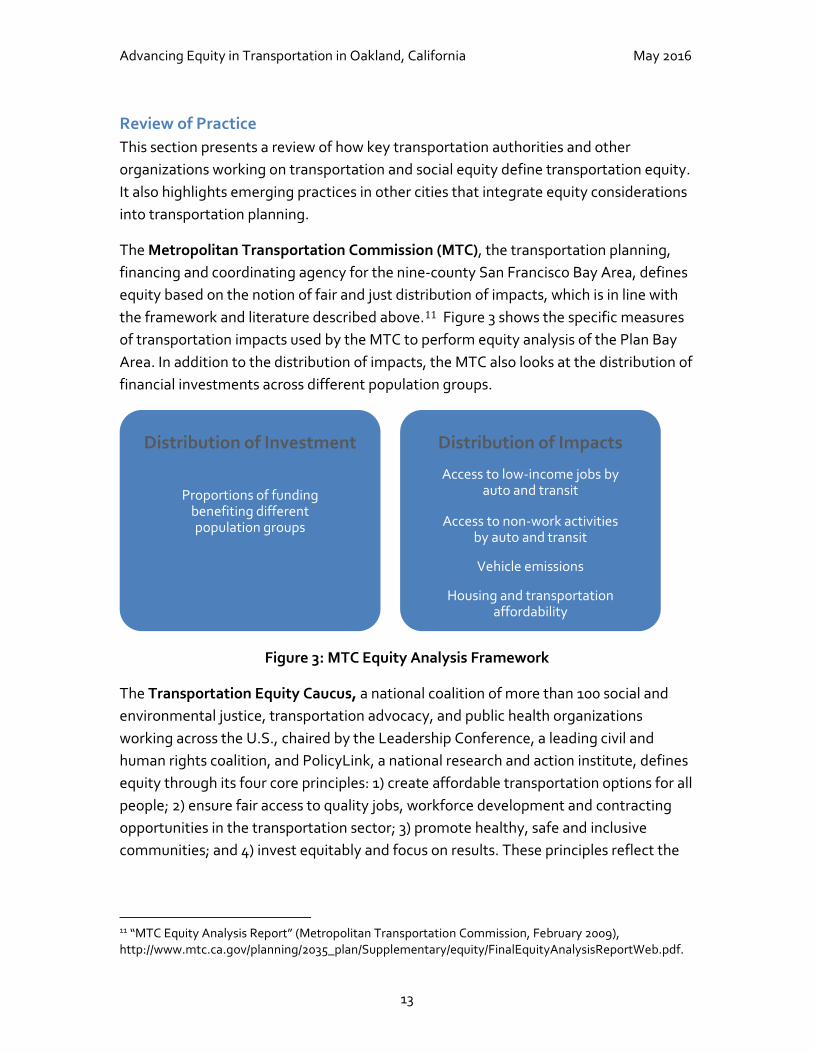
The Metropolitan Transportation Commission (MTC), the transportation planning, financing and coordinating agency for the nine-county San Francisco Bay Area, defines equity based on the notion of fair and just distribution of impacts, which is in line with the framework and literature described above.11 Figure 3 shows the specific measures of transportation impacts used by the MTC to perform equity analysis of the Plan Bay Area. In addition to the distribution of impacts, the MTC also looks at the distribution of financial investments across different population groups.
Figure 3: MTC Equity Analysis Framework
The Transportation Equity Caucus, a national coalition of more than 100 social and environmental justice, transportation advocacy, and public health organizations working across the U.S., chaired by the Leadership Conference, a leading civil and human rights coalition, and PolicyLink, a national research and action institute, defines equity through its four core principles: 1) create affordable transportation options for all people; 2) ensure fair access to quality jobs, workforce development and contracting opportunities in the transportation sector; 3) promote healthy, safe and inclusive communities; and 4) invest equitably and focus on results. These principles reflect the
11 “MTC Equity Analysis Report” (Metropolitan Transportation Commission, February 2009), http://www.mtc.ca.gov/planning/2035_plan/Supplementary/equity/FinalEquityAnalysisReportWeb.pdf.
Distribution of Investment
Proportions of funding benefiting different population groups
Distribution of Impacts
Access to low-income jobs by auto and transit
Access to non-work activities by auto and transit
Vehicle emissions
Housing and transportation affordability
Advancing Equity in Transportation in Oakland, California May 2016
14
importance of distributional effects of transportation investments, and the desire “to ensure all people can participate and prosper”.12
Move Seattle13, the City of Seattle’s 10-year strategic plan for transportation adopted in 2015, lays out ways in which the city will fund and deliver transportation projects to meet its overall vision of being a safe, interconnected, vibrant, affordable, and innovative city. With respect to equity, the plan focuses on geographic equity to ensure a fair distribution of investment and benefits among different communities. Geographic equity is one of six criteria used for project prioritization proposed in the plan. However, there is no information in the report on how this qualitative measure is defined.
Another way that the report touches on equity is in its core value and measures related to affordability. The goal for this core value is to “provide high-quality, low-cost travel options for everyone” and proposed measures include implementing programs for low-income and non-English speaking residents that facilitate access to transit, bike share, car share, and other travel options. For instance, the report recommends requiring new development to provide transit passes and other travel options to disadvantaged residents as a condition of development approval.
In addition to transportation plans, some cities have also developed other tools to translate equity considerations into practice. For instance, the Twin Cities, Minneapolis and St. Paul, MN, employ an Equitable Development Scorecard 14 which provides a flexible guide for various areas of planning including land use planning, housing, economic development and transportation. As part of their Race & Social Justice Initiative, the City of Seattle has developed a Racial Equity Toolkit 15 to assess policies, initiatives, programs and budget allocation. The toolkit guides planners to define outcomes specific to the population of concern.
12 “Statement of Principles,” Transportation Equity Caucus, accessed December 5, 2015, http://www.equitycaucus.org/About/StatementofPrinciples. 13 Seattle Department of Transportation, “Move Seattle: 10-Year Strategic Vision for Transportation,” Transportation Plan (Seattle: Seattle Department of Transportation, Spring 2015), http://www.seattle.gov/transportation/docs/MoveSeatte-FinalDraft-2-25-Online.pdf. 14 “Twin Cities Equitable Development Scorecard: A Tool for Communities and Planners,” October 2014. 15 Race and Social Justice Initiative, “Racial Equity Toolkit to Assess Policies, Initiatives, Programs, and Budget Issues,” accessed April 29, 2016, http://www.seattle.gov/Documents/Departments/RSJI/RacialEquityToolkit_FINAL_August2012.pdf.
Advancing Equity in Transportation in Oakland, California May 2016
15
IV. BACKGROUND
Oakland City Context Oakland is an integral part of the booming Bay Area economy. As one of the major urban centers in the region, Oakland is expected to see substantial growth in jobs and population alongside San Francisco and San Jose over the next few decades. The Plan Bay Area projects that nearly 40% of job growth will locate in these three cities over the next 25 years. Oakland’s population is projected to grow by 41% or 160,000 people in the same period. This represents almost 20% of total growth in central cities in the region. While growth is generally considered to be positive, it is also putting enormous pressures on Oakland’s infrastructures, particularly on housing and transportation. The housing crisis is a daily news headline and roads and transit systems are operating at or near maximum capacity. The most pressing challenge for Oakland and other cities in the region is how to balance job growth, housing supply and transportation services in such way to ensure a vibrant economy and enable the region to achieve its sustainability goals.
In order to accommodate the projected growth, Oakland will need to invest heavily in the coming decades to improve and expand its transportation infrastructures. Meeting the resource needs will pose a significant challenge. However, an equally important challenge is ensuring that new investments are driven toward equitable outcomes. Many parts of Oakland have experienced infrastructure disinvestment historically and are still underserved today. While Oakland prides itself as one of the most diverse cities in the U.S., there is striking social and racial inequality with respect to income, employment rate, exposure to and impact of violence, and health and other life outcomes. The pattern of disparities is the result of decades of planning policies and decisions making that have led to the hugely unequal outcomes for different sections of the population. Transportation is but one area where inequities have played out in the past and continues to do so today.
Inequity in transportation manifests in many ways: it can be seen in the disparity in bus service, the high concentration of air pollution in poor communities and communities of color, where freeways and BART stations are built through neighborhoods, and the large differentials in levels of mobility. Transportation is a critical link to opportunity, connecting people to jobs, schools, affordable housing, health care, grocery stores, and more. Oakland needs to put greater emphasis on transportation equity and create transportation options for all people that effectively connect them to opportunities.
Advancing Equity in Transportation in Oakland, California May 2016
16
Population
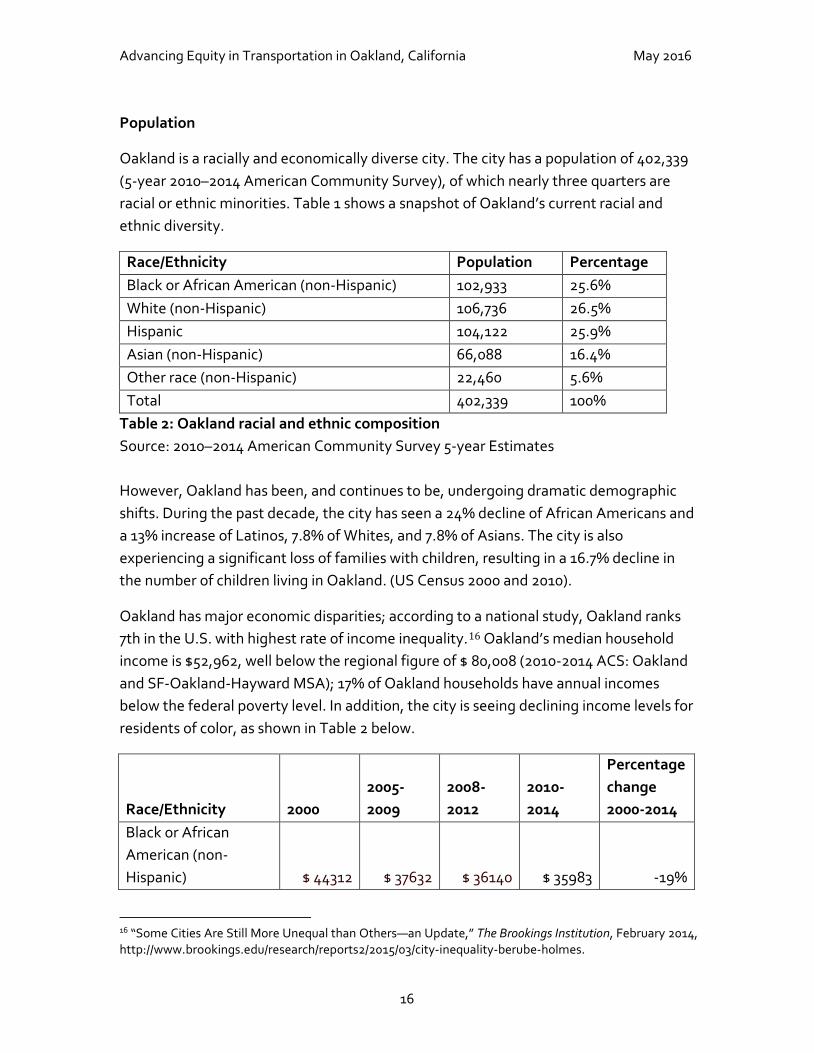
Oakland is a racially and economically diverse city. The city has a population of 402,339 (5-year 2010–2014 American Community Survey), of which nearly three quarters are racial or ethnic minorities. Table 1 shows a snapshot of Oakland’s current racial and ethnic diversity.
Race/Ethnicity Population Percentage Black or African American (non-Hispanic) 102,933 25.6% White (non-Hispanic) 106,736 26.5% Hispanic 104,122 25.9% Asian (non-Hispanic) 66,088 16.4% Other race (non-Hispanic) 22,460 5.6% Total 402,339 100%
Table 2: Oakland racial and ethnic composition Source: 2010–2014 American Community Survey 5-year Estimates However, Oakland has been, and continues to be, undergoing dramatic demographic shifts. During the past decade, the city has seen a 24% decline of African Americans and a 13% increase of Latinos, 7.8% of Whites, and 7.8% of Asians. The city is also experiencing a significant loss of families with children, resulting in a 16.7% decline in the number of children living in Oakland. (US Census 2000 and 2010).
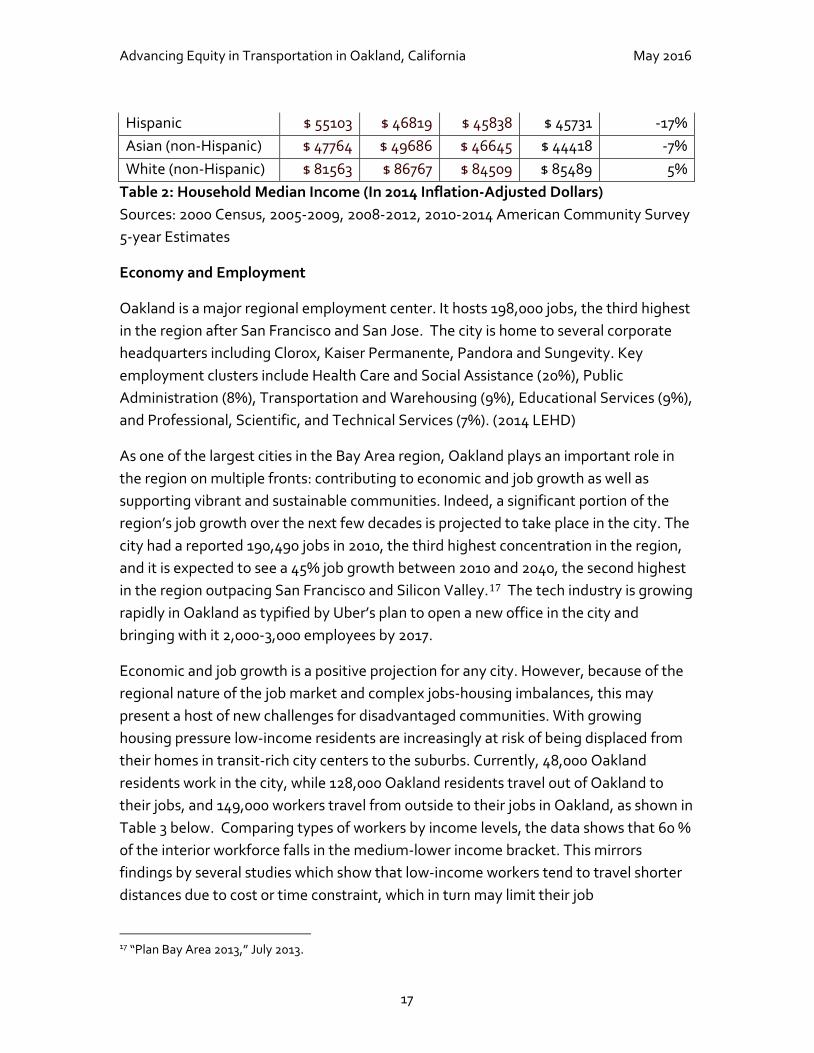
Oakland has major economic disparities; according to a national study, Oakland ranks 7th in the U.S. with highest rate of income inequality.16 Oakland’s median household income is $52,962, well below the regional figure of $ 80,008 (2010-2014 ACS: Oakland and SF-Oakland-Hayward MSA); 17% of Oakland households have annual incomes below the federal poverty level. In addition, the city is seeing declining income levels for residents of color, as shown in Table 2 below.
Race/Ethnicity 2000 2005-2009
2008-2012
2010-2014
Percentage change 2000-2014
Black or African American (non-Hispanic) $ 44312 $ 37632 $ 36140 $ 35983 -19%
16 “Some Cities Are Still More Unequal than Others—an Update,” The Brookings Institution, February 2014, http://www.brookings.edu/research/reports2/2015/03/city-inequality-berube-holmes.
Advancing Equity in Transportation in Oakland, California May 2016
17
Hispanic $ 55103 $ 46819 $ 45838 $ 45731 -17% Asian (non-Hispanic) $ 47764 $ 49686 $ 46645 $ 44418 -7% White (non-Hispanic) $ 81563 $ 86767 $ 84509 $ 85489 5%
Table 2: Household Median Income (In 2014 Inflation-Adjusted Dollars) Sources: 2000 Census, 2005-2009, 2008-2012, 2010-2014 American Community Survey 5-year Estimates
Economy and Employment
Oakland is a major regional employment center. It hosts 198,000 jobs, the third highest in the region after San Francisco and San Jose. The city is home to several corporate headquarters including Clorox, Kaiser Permanente, Pandora and Sungevity. Key employment clusters include Health Care and Social Assistance (20%), Public Administration (8%), Transportation and Warehousing (9%), Educational Services (9%), and Professional, Scientific, and Technical Services (7%). (2014 LEHD)
As one of the largest cities in the Bay Area region, Oakland plays an important role in the region on multiple fronts: contributing to economic and job growth as well as supporting vibrant and sustainable communities. Indeed, a significant portion of the region’s job growth over the next few decades is projected to take place in the city. The city had a reported 190,490 jobs in 2010, the third highest concentration in the region, and it is expected to see a 45% job growth between 2010 and 2040, the second highest in the region outpacing San Francisco and Silicon Valley.17 The tech industry is growing rapidly in Oakland as typified by Uber’s plan to open a new office in the city and bringing with it 2,000-3,000 employees by 2017.
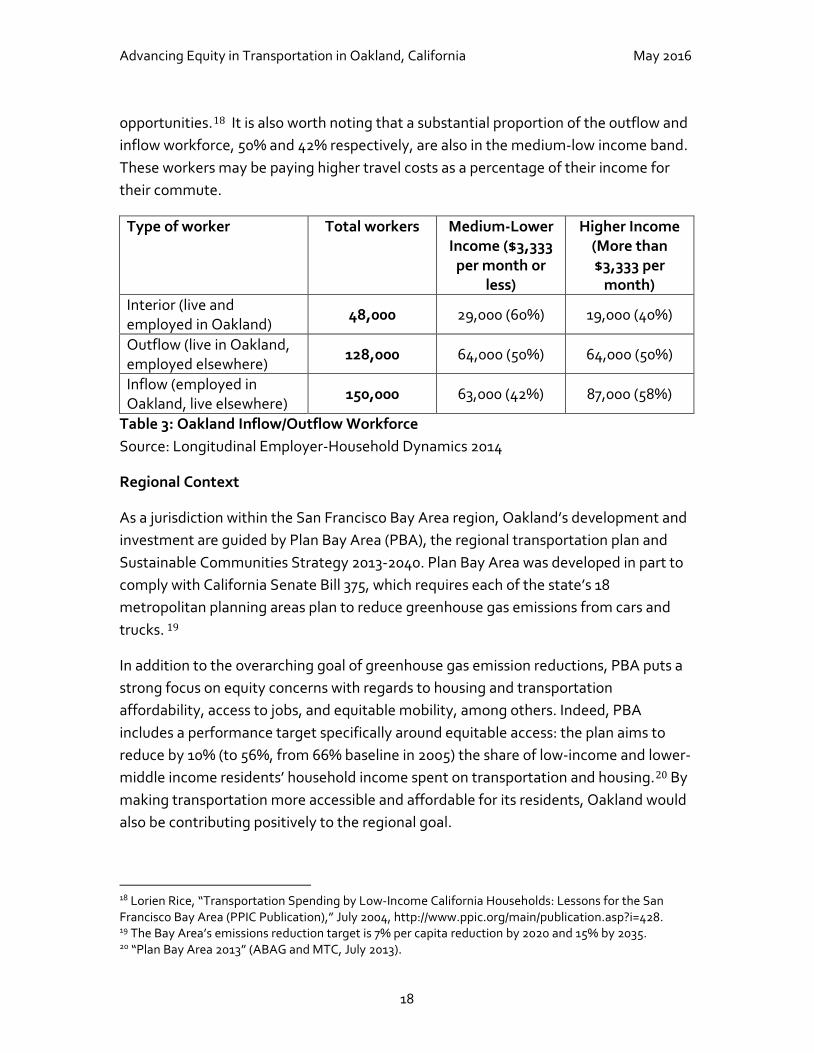
Economic and job growth is a positive projection for any city. However, because of the regional nature of the job market and complex jobs-housing imbalances, this may present a host of new challenges for disadvantaged communities. With growing housing pressure low-income residents are increasingly at risk of being displaced from their homes in transit-rich city centers to the suburbs. Currently, 48,000 Oakland residents work in the city, while 128,000 Oakland residents travel out of Oakland to their jobs, and 149,000 workers travel from outside to their jobs in Oakland, as shown in Table 3 below. Comparing types of workers by income levels, the data shows that 60 % of the interior workforce falls in the medium-lower income bracket. This mirrors findings by several studies which show that low-income workers tend to travel shorter distances due to cost or time constraint, which in turn may limit their job
17 “Plan Bay Area 2013,” July 2013.
Advancing Equity in Transportation in Oakland, California May 2016
18
opportunities.18 It is also worth noting that a substantial proportion of the outflow and inflow workforce, 50% and 42% respectively, are also in the medium-low income band. These workers may be paying higher travel costs as a percentage of their income for their commute.
Type of worker Total workers Medium-Lower Income ($3,333
per month or less)
Higher Income (More than $3,333 per
month) Interior (live and employed in Oakland)
48,000 29,000 (60%) 19,000 (40%)
Outflow (live in Oakland, employed elsewhere)
128,000 64,000 (50%) 64,000 (50%)
Inflow (employed in Oakland, live elsewhere)
150,000 63,000 (42%) 87,000 (58%)
Table 3: Oakland Inflow/Outflow Workforce Source: Longitudinal Employer-Household Dynamics 2014
Regional Context
As a jurisdiction within the San Francisco Bay Area region, Oakland’s development and investment are guided by Plan Bay Area (PBA), the regional transportation plan and Sustainable Communities Strategy 2013-2040. Plan Bay Area was developed in part to comply with California Senate Bill 375, which requires each of the state’s 18 metropolitan planning areas plan to reduce greenhouse gas emissions from cars and trucks. 19
In addition to the overarching goal of greenhouse gas emission reductions, PBA puts a strong focus on equity concerns with regards to housing and transportation affordability, access to jobs, and equitable mobility, among others. Indeed, PBA includes a performance target specifically around equitable access: the plan aims to reduce by 10% (to 56%, from 66% baseline in 2005) the share of low-income and lower-middle income residents’ household income spent on transportation and housing.20 By making transportation more accessible and affordable for its residents, Oakland would also be contributing positively to the regional goal.
18 Lorien Rice, “Transportation Spending by Low-Income California Households: Lessons for the San Francisco Bay Area (PPIC Publication),” July 2004, http://www.ppic.org/main/publication.asp?i=428. 19 The Bay Area’s emissions reduction target is 7% per capita reduction by 2020 and 15% by 2035. 20 “Plan Bay Area 2013” (ABAG and MTC, July 2013).
Advancing Equity in Transportation in Oakland, California May 2016
19
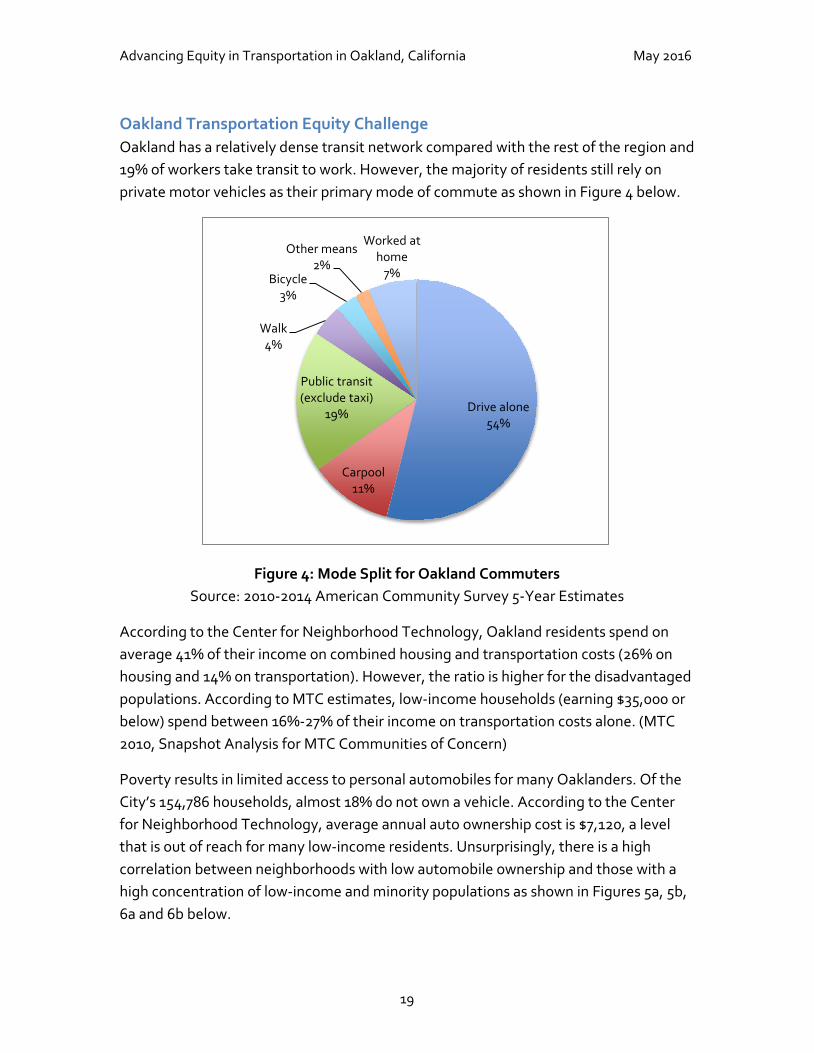
Oakland Transportation Equity Challenge Oakland has a relatively dense transit network compared with the rest of the region and 19% of workers take transit to work. However, the majority of residents still rely on private motor vehicles as their primary mode of commute as shown in Figure 4 below.
Figure 4: Mode Split for Oakland Commuters Source: 2010-2014 American Community Survey 5-Year Estimates
According to the Center for Neighborhood Technology, Oakland residents spend on average 41% of their income on combined housing and transportation costs (26% on housing and 14% on transportation). However, the ratio is higher for the disadvantaged populations. According to MTC estimates, low-income households (earning $35,000 or below) spend between 16%-27% of their income on transportation costs alone. (MTC 2010, Snapshot Analysis for MTC Communities of Concern)
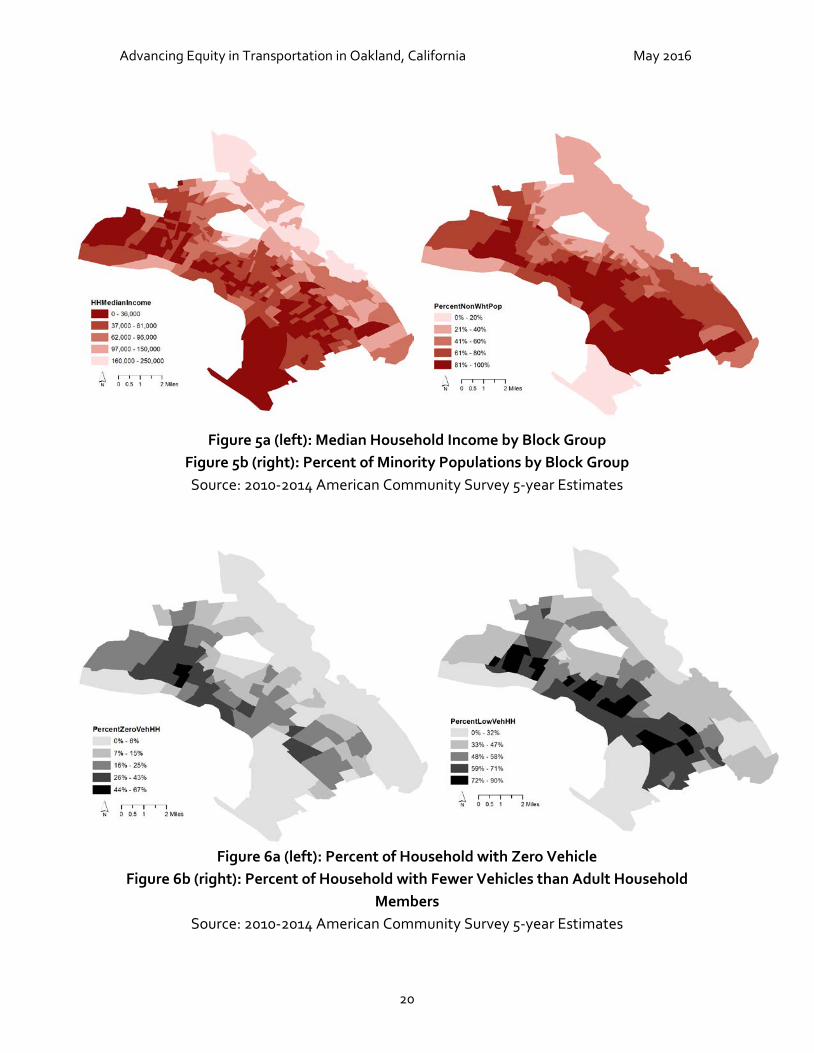
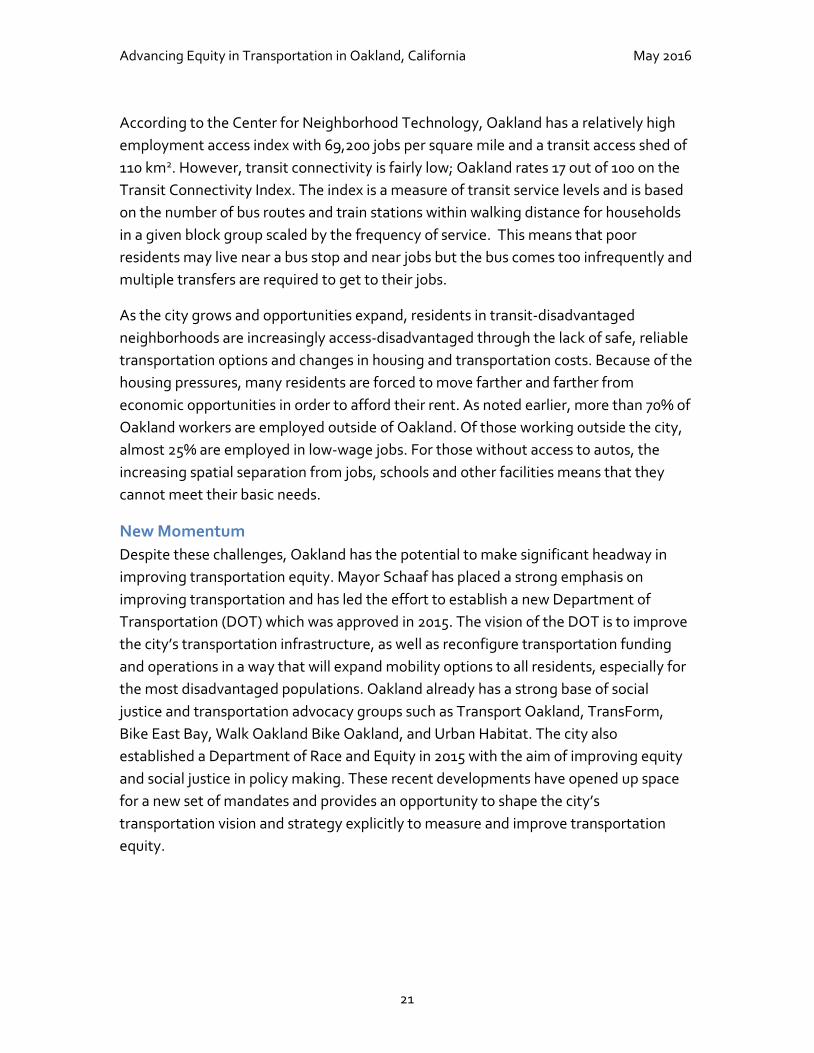
Poverty results in limited access to personal automobiles for many Oaklanders. Of the City’s 154,786 households, almost 18% do not own a vehicle. According to the Center for Neighborhood Technology, average annual auto ownership cost is $7,120, a level that is out of reach for many low-income residents. Unsurprisingly, there is a high correlation between neighborhoods with low automobile ownership and those with a high concentration of low-income and minority populations as shown in Figures 5a, 5b, 6a and 6b below.
Drive alone54%
Carpool11%
Public transit (exclude taxi)
19%
Walk4%
Bicycle3%
Other means2%
Worked at home
7%
Advancing Equity in Transportation in Oakland, California May 2016
20
Figure 5: Household median income and concentration of zero-car households
Source: 2010-2014 American Community Survey 5-year Estimates
Figure 5a (left): Median Household Income by Block Group
Figure 5b (right): Percent of Minority Populations by Block Group Source: 2010-2014 American Community Survey 5-year Estimates
Figure 6a (left): Percent of Household with Zero Vehicle Figure 6b (right): Percent of Household with Fewer Vehicles than Adult Household
Members Source: 2010-2014 American Community Survey 5-year Estimates
Advancing Equity in Transportation in Oakland, California May 2016
21
According to the Center for Neighborhood Technology, Oakland has a relatively high employment access index with 69,200 jobs per square mile and a transit access shed of 110 km2. However, transit connectivity is fairly low; Oakland rates 17 out of 100 on the Transit Connectivity Index. The index is a measure of transit service levels and is based on the number of bus routes and train stations within walking distance for households in a given block group scaled by the frequency of service. This means that poor residents may live near a bus stop and near jobs but the bus comes too infrequently and multiple transfers are required to get to their jobs.
As the city grows and opportunities expand, residents in transit-disadvantaged neighborhoods are increasingly access-disadvantaged through the lack of safe, reliable transportation options and changes in housing and transportation costs. Because of the housing pressures, many residents are forced to move farther and farther from economic opportunities in order to afford their rent. As noted earlier, more than 70% of Oakland workers are employed outside of Oakland. Of those working outside the city, almost 25% are employed in low-wage jobs. For those without access to autos, the increasing spatial separation from jobs, schools and other facilities means that they cannot meet their basic needs.
New Momentum Despite these challenges, Oakland has the potential to make significant headway in improving transportation equity. Mayor Schaaf has placed a strong emphasis on improving transportation and has led the effort to establish a new Department of Transportation (DOT) which was approved in 2015. The vision of the DOT is to improve the city’s transportation infrastructure, as well as reconfigure transportation funding and operations in a way that will expand mobility options to all residents, especially for the most disadvantaged populations. Oakland already has a strong base of social justice and transportation advocacy groups such as Transport Oakland, TransForm, Bike East Bay, Walk Oakland Bike Oakland, and Urban Habitat. The city also established a Department of Race and Equity in 2015 with the aim of improving equity and social justice in policy making. These recent developments have opened up space for a new set of mandates and provides an opportunity to shape the city’s transportation vision and strategy explicitly to measure and improve transportation equity.
Advancing Equity in Transportation in Oakland, California May 2016
22
V. FINDINGS & DISCUSSION Currently, there is no formal practice in the City of Oakland to incorporate equity considerations into transportation planning and investment. There is no formal policy or administrative guidance, and equity analysis is neither mandated nor practiced as part of transportation decision-making at the city level. But planning practice is evolving and some work units are beginning to tackle the difficult task of conducting equity analyses to better understand who benefits and who may lose out from various transportation plans and investments. This effort is at a very nascent stage. However, there is a growing appetite within the transportation planning staff to expand and codify this practice into standard business processes.
1. Street Paving
Crumbling streets
Oakland has 2,293 lane miles of local streets and roads, and they are one of the city government’s biggest and most valuable assets. Road infrastructure not only serves Oakland residents but regional travelers and freight movement. However, with the decline in federal and state funding support over the past several decades much of the city’s pavement has fallen into disrepair. The city’s average pavement condition index (PCI) is 59 out of 100. PCI is the industry standard for measuring the general condition of a pavement. Oakland’s PCI score is considered a level “at risk” by the MTC, a threshold at which deterioration accelerates rapidly and major rehabilitation is required. Correspondingly, potholes are the third most frequently reported issue on Oakland’s SeeClickFix, a web platform that allows citizens to report non-emergency neighborhood issues. More than 5,800 incidents of potholes have been reported on SeeClickFix over the last three years.
The struggle to keep the city’s pavement in a state of good repair is not new. The city faces a substantial backlog of street rehabilitation (at $443 million) with limited budget to close this gap. (FY2015-2017 Adopted Budget) However, paving is increasingly a priority issue as the city is proposing to put forward a General Obligation bond measure in November 2016 that could potentially raise a significant amount of resource to improve Oakland’s streets and sidewalks. How this new source of funding can be deployed toward equitable outcomes will be an important question for the city to address.
Advancing Equity in Transportation in Oakland, California May 2016
23
Pavement maintenance investment and equity
While Oakland’s poor pavement condition is a citywide problem, low-income communities and communities of color, who live in parts of the city that have experienced disinvestment and neglect historically, have voiced concerns that funding for repairs and improvements are not distributed equitably. Recently, East Oakland residents mobilized residents in their “flatland” community to rally in protest of the badly damaged streets in their neighborhoods.21 Residents have demanded a commitment from the city to investigate whether paving efforts are done equitably and to explore potential changes to paving and sidewalk repair policy to add specific social and racial equity considerations to the conventional capital investment criteria currently in use.
Oakland’s paving prioritization plan is guided by two policies: 1) the use of StreetSaver, and 2) an “80-20 policy” which was adopted by the City Council in 2007. The 80-20 policy dictates that 80% of paving funds be allocated to StreetSaver-designated streets, which put a priority on cost-effectiveness and preventive treatments which prolong the useful life of roads, while 20% of the City’s paving funds are distributed equally to each City Council district, for reconstruction of streets in the worst condition, which is much more expensive. Since the policy was implemented, the city has improved its average PCI from 57 in 2011 to 59 currently. However, the policy also results in most of the worst streets being left untouched.
Over the past six months, the Mayor’s Office and the Office of Public Works have conducted analyses to better understand the correlation between social and racial equity and the current street condition, as well as equity implications of the 5-year paving plan. In addition, the city also looked at the relationship between social and racial equity and historical street investments.
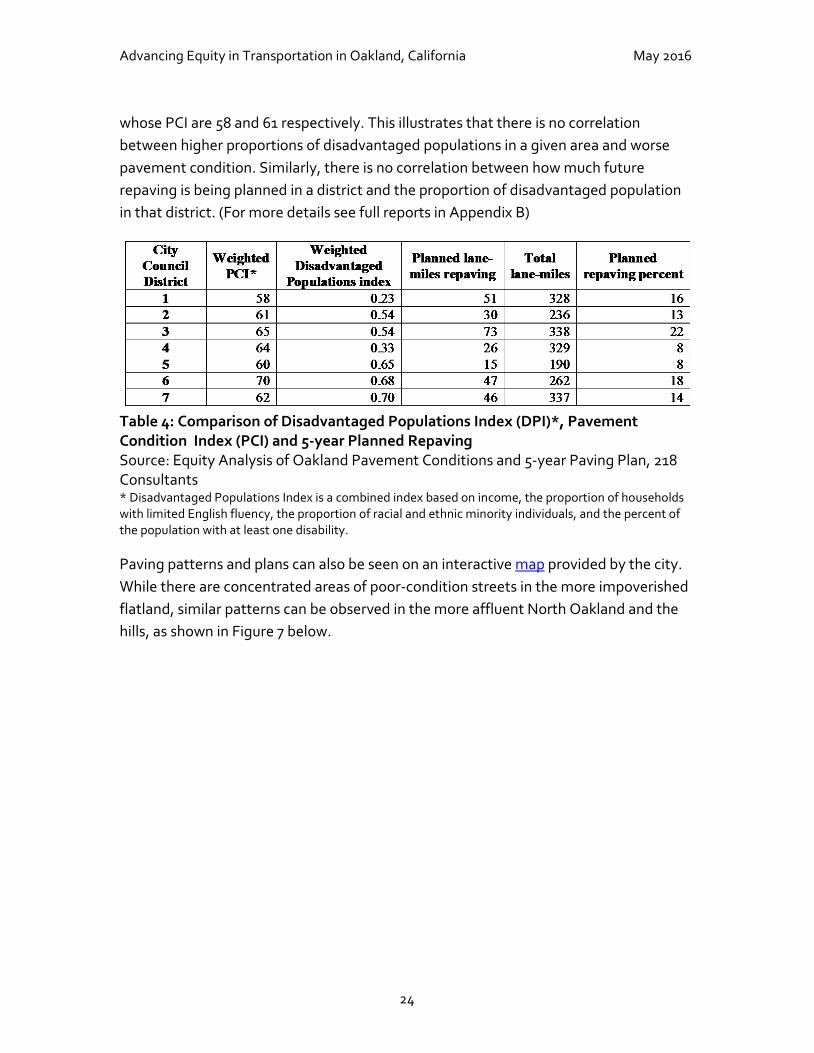
The analyses found no statistically significant correlation between demographic characteristics of an area (based on income, race and ethnicity and disabilities) and the pavement conditions, the percentage of roads scheduled for paving, or the historical paving pattern. Table 4 below shows a comparison between the Disadvantaged Populations Index (DPI), the current pavement conditions and the 5-year planned repaving. In the top three districts with the highest DPI (D5, D6 and D7), the PCI ranges from 60 to 70, which is higher than some districts with lower DPI such as D1 and D2
21 Tulio Ospina, “East Oakland Residents Take Mayor Schaaf on Tour of Neglected Flatland Streets,” Post News Group, September 18, 2015, http://postnewsgroup.com/blog/2015/09/18/east-oakland-residents-take-mayor-schaaf-tour-neglected-flatland-streets/.
Advancing Equity in Transportation in Oakland, California May 2016
24
whose PCI are 58 and 61 respectively. This illustrates that there is no correlation between higher proportions of disadvantaged populations in a given area and worse pavement condition. Similarly, there is no correlation between how much future repaving is being planned in a district and the proportion of disadvantaged population in that district. (For more details see full reports in Appendix B)
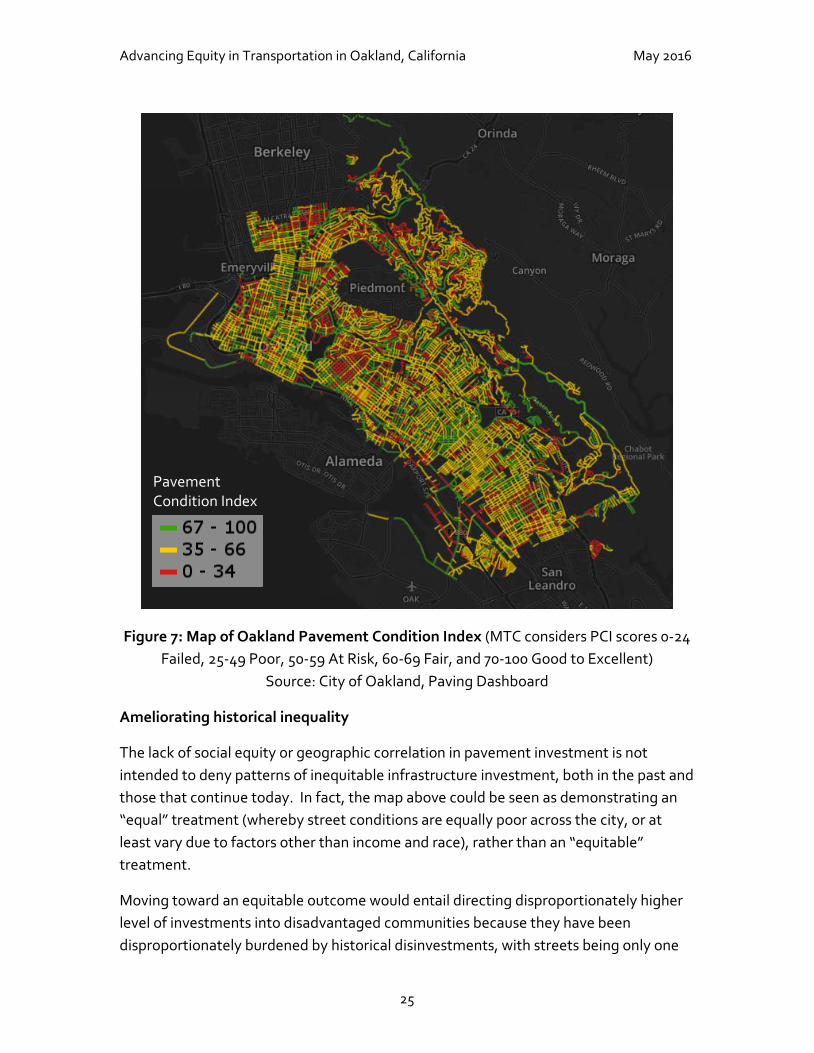
Table 4: Comparison of Disadvantaged Populations Index (DPI)*, Pavement Condition Index (PCI) and 5-year Planned Repaving Source: Equity Analysis of Oakland Pavement Conditions and 5-year Paving Plan, 218 Consultants * Disadvantaged Populations Index is a combined index based on income, the proportion of households with limited English fluency, the proportion of racial and ethnic minority individuals, and the percent of the population with at least one disability. Paving patterns and plans can also be seen on an interactive map provided by the city. While there are concentrated areas of poor-condition streets in the more impoverished flatland, similar patterns can be observed in the more affluent North Oakland and the hills, as shown in Figure 7 below.
Advancing Equity in Transportation in Oakland, California May 2016
25
Figure 7: Map of Oakland Pavement Condition Index (MTC considers PCI scores 0-24 Failed, 25-49 Poor, 50-59 At Risk, 60-69 Fair, and 70-100 Good to Excellent)
Source: City of Oakland, Paving Dashboard
Ameliorating historical inequality
The lack of social equity or geographic correlation in pavement investment is not intended to deny patterns of inequitable infrastructure investment, both in the past and those that continue today. In fact, the map above could be seen as demonstrating an “equal” treatment (whereby street conditions are equally poor across the city, or at least vary due to factors other than income and race), rather than an “equitable” treatment.
Moving toward an equitable outcome would entail directing disproportionately higher level of investments into disadvantaged communities because they have been disproportionately burdened by historical disinvestments, with streets being only one
Pavement Condition Index
Advancing Equity in Transportation in Oakland, California May 2016
26
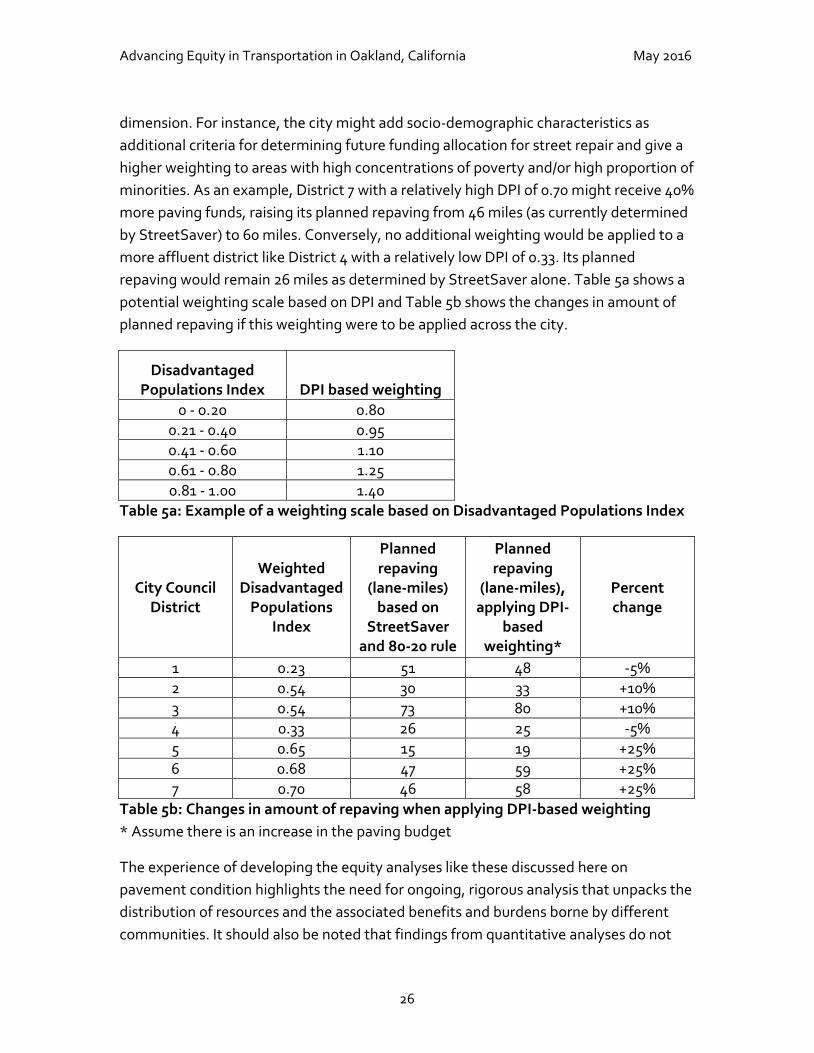
dimension. For instance, the city might add socio-demographic characteristics as additional criteria for determining future funding allocation for street repair and give a higher weighting to areas with high concentrations of poverty and/or high proportion of minorities. As an example, District 7 with a relatively high DPI of 0.70 might receive 40% more paving funds, raising its planned repaving from 46 miles (as currently determined by StreetSaver) to 60 miles. Conversely, no additional weighting would be applied to a more affluent district like District 4 with a relatively low DPI of 0.33. Its planned repaving would remain 26 miles as determined by StreetSaver alone. Table 5a shows a potential weighting scale based on DPI and Table 5b shows the changes in amount of planned repaving if this weighting were to be applied across the city.
Disadvantaged Populations Index DPI based weighting
0 - 0.20 0.80 0.21 - 0.40 0.95 0.41 - 0.60 1.10 0.61 - 0.80 1.25 0.81 - 1.00 1.40
Table 5a: Example of a weighting scale based on Disadvantaged Populations Index
City Council District
Weighted Disadvantaged
Populations Index
Planned repaving
(lane-miles) based on
StreetSaver and 80-20 rule
Planned repaving
(lane-miles), applying DPI-
based weighting*
Percent change
1 0.23 51 48 -5% 2 0.54 30 33 +10% 3 0.54 73 80 +10% 4 0.33 26 25 -5% 5 0.65 15 19 +25% 6 0.68 47 59 +25% 7 0.70 46 58 +25%
Table 5b: Changes in amount of repaving when applying DPI-based weighting * Assume there is an increase in the paving budget
The experience of developing the equity analyses like these discussed here on pavement condition highlights the need for ongoing, rigorous analysis that unpacks the distribution of resources and the associated benefits and burdens borne by different communities. It should also be noted that findings from quantitative analyses do not
Advancing Equity in Transportation in Oakland, California May 2016
27
substitute for or should not be used to discount people’s lived experiences; however, such analyses can improve accountability and transparency of the city. The analytical approach developed so far can also be modified and applied to other types of infrastructures beyond pavement. Such analyses will be important as the city develops a bond measure that includes significant infrastructure improvements in addition to streets and sidewalks.
RECOMMENDATIONS
� Explore an adoption of a 5-year Paving Plan Policy that explicitly adjusts investments toward equity. One potential mechanism is to use a weighting system based on socio-economic and race variables.
� Include results from paving equity analysis as part of the bi-annual paving progress report to the City Council Finance and Management Committee.
� Publish results of paving equity analysis publicly and/or integrate the findings into the city’s existing Paving Dashboard.
� Ensure that an equity analysis is built into the infrastructure bond measure and that it informs the bond expenditure plan. The analytical methodology should be further developed and refined for the purposes of assessing different types of infrastructures considered in the bond. The language for the bond measure should include an explicit requirement for equity analysis.
2. Safe Streets for Pedestrians and Cyclists
Safety of pedestrians and cyclists is a key transportation concern in Oakland. Pedestrians and cyclists are the most vulnerable road users in the city and collisions with motor vehicles often result in serious injury or death. According to the California Office of Traffic Safety, 263 pedestrians and 220 cyclists were killed or injured in Oakland in 2013. In fact, neighborhoods around the Coliseum Stadium and Oakland International Airport make the list of the nation's deadliest places for pedestrians with some of the highest fatality rates as ranked against other cities, based on an analysis of the National Highway Traffic Safety Administration’s Fatality Analysis Reporting System (2008-2012). 22
Disparities in safety outcomes
22 “Neighborhoods with the Highest Pedestrian Death Rates,” accessed March 21, 2016, http://www.governing.com/topics/public-justice-safety/gov-deadly-neighborhoods-pedestrian-deaths-maps.html.
Advancing Equity in Transportation in Oakland, California May 2016
28
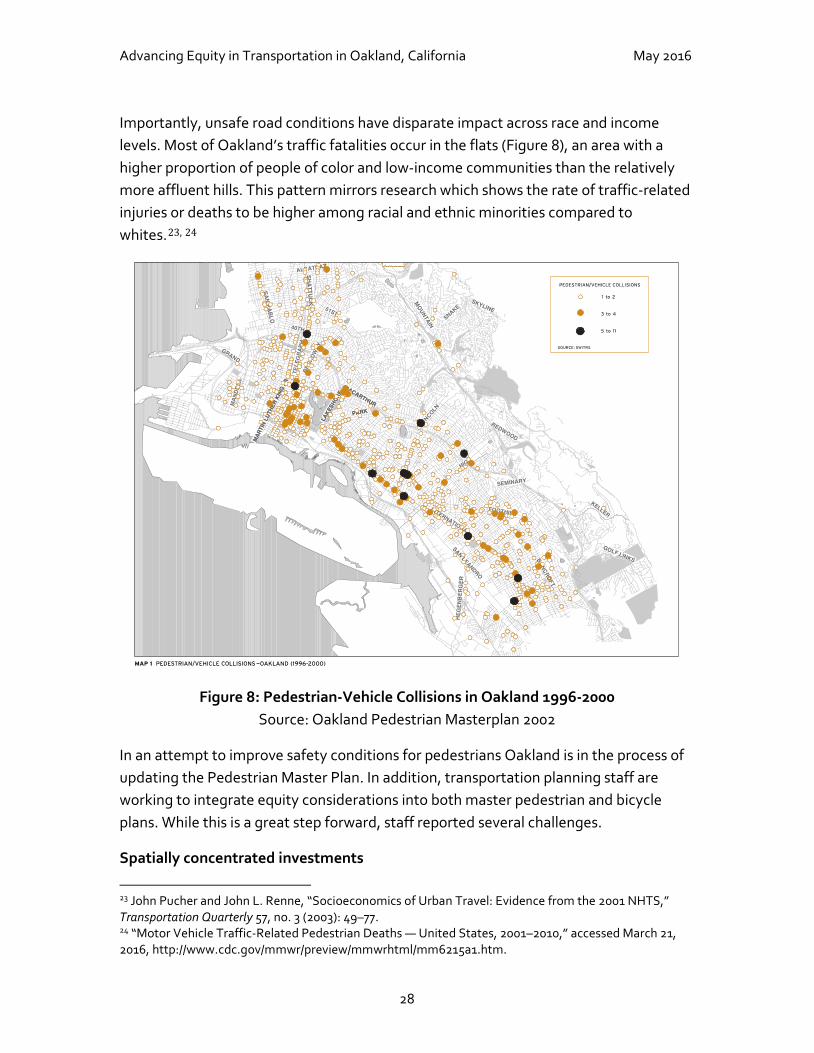
Importantly, unsafe road conditions have disparate impact across race and income levels. Most of Oakland’s traffic fatalities occur in the flats (Figure 8), an area with a higher proportion of people of color and low-income communities than the relatively more affluent hills. This pattern mirrors research which shows the rate of traffic-related injuries or deaths to be higher among racial and ethnic minorities compared to whites.23, 24
Figure 8: Pedestrian-Vehicle Collisions in Oakland 1996-2000 Source: Oakland Pedestrian Masterplan 2002
In an attempt to improve safety conditions for pedestrians Oakland is in the process of updating the Pedestrian Master Plan. In addition, transportation planning staff are working to integrate equity considerations into both master pedestrian and bicycle plans. While this is a great step forward, staff reported several challenges.
Spatially concentrated investments
23 John Pucher and John L. Renne, “Socioeconomics of Urban Travel: Evidence from the 2001 NHTS,” Transportation Quarterly 57, no. 3 (2003): 49–77. 24 “Motor Vehicle Traffic-Related Pedestrian Deaths — United States, 2001–2010,” accessed March 21, 2016, http://www.cdc.gov/mmwr/preview/mmwrhtml/mm6215a1.htm.
Advancing Equity in Transportation in Oakland, California May 2016
29
With respect to bicycle planning, staff acknowledged that while Oakland has a high level of bicycle usage on average compared to other cities in the region, there are marked differences between neighborhoods. Staff recognized that bike infrastructure investments have often followed a demand trend that started in more affluent North Oakland and downtown, with a comparatively lower level of investments going in lower-income areas in East and West Oakland. The current planning and implementation practice is generally reactive; the default mode is to respond to complaints, so that those who are most organized or have the loudest voice tend to get attention and action by the city. The current disparity in bike infrastructure is also driven by locations of BART stations, as cyclists tend to use bikes for the first and last mile to connect to trunk transit. Since BART users tend to be in the higher income group, the concentration of bike infrastructures around BART system may have an exclusionary effect.
“People who are switching to bike modes are often white affluent men. We need more education and encouragement in East Oakland for there to be demand especially as riding bikes in those communities is historically a sign of poverty and not being able to afford a car.” Oakland City Staff
While the above is generally true, some projects, including the Mandela Parkway in West Oakland and the Bay Trail, have made provided large investments towards multi-use pathways in low-income neighborhoods. Nevertheless, these projects are unusual - Mandela Parkway is a replacement for the freeway destroyed by the 1989 earthquake, and the Bay Trail is part of a regional project - and the more local bicycle improvements of bike racks and on-street bikeways, are provided on a more reactive basis.
Observations made above mirror recent research by Stehlin (2014 and 2015) who attributes the racial gap in bike usage to the way planning processes for bike infrastructures have been conducted and the development of cycling practice and cycling culture. These processes have unintentional exclusionary effect and play a role in reinforcing the racialized patterns of spatial investment.25 Stehlin also highlighted the gap between bicycle advocacy community, which tend to represent white, middle-class interest, and groups focused on the issues affecting people of color. This gap needs to be bridged in order to make infrastructure investments related to bike and
25 John Stehlin, “Regulating Inclusion: Spatial Form, Social Process, and the Normalization of Cycling Practice in the USA,” Mobilities 9, no. 1 (January 2, 2014): 21–41, doi:10.1080/17450101.2013.784527.
Advancing Equity in Transportation in Oakland, California May 2016
30
pedestrians more inclusive.26
New impetus in Oakland: emerging planning practice and challenges
Staff are currently developing new analytical methodologies to better understand existing inequities with respect to bicycle and pedestrian infrastructures. These methodologies should help to identify the extent to which different areas and different populations are underserved. Better analytics would also allow staff to disentangle the needs from the demand driven by those groups with greater resources and political organization, so that planning efforts can be directed toward the underserved areas.
Challenge: ambiguity of a new approach
However, staff identified the lack of standardized practice for carrying out equity analysis as a key challenge. While the analysis for the bike plan takes a zonal or geographic approach and is being developed in-house, the pedestrian plan is employing external consultants to develop a methodology that parallels the MTC’s Communities of Concern, which is based on socio-demographic variables. As such, there is a concern that these different methodologies could be working at cross-purposes with each other.
It is worth noting that this challenge is not unique to Oakland. As the literature shows, there are many ways to define equity in transportation, and transport equity can be extremely difficult to evaluate because of the various types, impacts, measurements and categories of people to consider. It is also important to note that there is no single way to evaluate transportation equity and planners and decision makers should consider what perspectives and impacts are relevant to the issue at hand. This requires a shift in practice that must start with a broader discussion about equity issues among those involved in the planning practice and decision-making process. In the short-term, looking at innovative practices from other cities could provide useful insights. For instance, researchers at Portland State University and University of Washington carried out equity analyses of the Bicycle Master Plan of Portland and Seattle respectively. Dill and Haggerty (2015) found that while the Portland plan will generate a dense bikeway network in the city there are service gaps where network coverage is sparse and some of these overlap with areas of higher concentration of disadvantaged populations.27
26 John Stehlin, “Cycles of Investment: Bicycle Infrastructure, Gentrification, and the Restructuring of the San Francisco Bay Area,” Environment and Planning A 47, no. 1 (January 1, 2015): 121–37, doi:10.1068/a130098p. 27 Jennifer Dill and Brendon Haggerty, “Equity Analysis of Portland’s Draft Bicycle Master Plan - Findings” (Report to Ellen Vanderslice, City of Portland Bureau of Transportation, 2009),
Advancing Equity in Transportation in Oakland, California May 2016
31
Similarly, Ulmer (2015) found that there are higher overall levels of bike access for census block groups with relatively high equity scores (based on proportions of minority, youth and elderly populations) in Seattle. However, some areas with high equity scores in the northern and southern parts of the city have relatively low bicycle access.28
Challenge: lack of data
Staff also identified the lack of data as an associated hurdle to conducting robust equity analysis. For instance, current data on bike users is based on journey-to-work data. This data fails to capture bike usage for non-work trips, which is the majority of trips taken by disadvantaged population who are without jobs, including youths. In addition, collision data (for both pedestrians and cyclists) are not broken down by race or income-level which makes it difficult to implement improvements that target these populations. Several concrete solutions have been identified including the need for primary data collection through comprehensive surveys to plug existing data gaps; expanding the annual exposure counts which the city already carries out; and obtaining support from experts on equity and social science to work with staff to design appropriate analytical tools. In addition, while Oakland has a citywide Equal Access Program, there are limited resources for it to be implemented within the Bike and Pedestrian Facilities Program.
Challenge: lack of coordination
Staff noted that much of the bike and pedestrian program implementation will be driven by the paving plan, as bike and pedestrian infrastructure improvements commonly follow paving work schedule due to the overlap in engineering and construction efforts. As such, the paving plan can significantly affect the implementation of the bike and pedestrian plans and influences changes to the latter unless there is effective coordination between paving and other plans upfront. As mentioned above, the paving plan is currently driven by the cost-effectiveness principle and equity analysis is not yet built into the plan. There is a concern that without aligning the paving and the bike and pedestrian plans, the equity analyses that have been carried out for the latter will be moot. As such, the question of equity in the future is therefore not so much one of network coverage or lack of coverage, but of project
http://www.bikeleague.org/sites/default/files/bikeleague/bikeleague.org/programs/bicyclefriendlyamerica/communities/pdfs/portland_bicycle_master_plan_equity_report_final.pdf. 28 Michael Ulmer, “An Equity Analysis of the 2014 Seattle Bicycle Master Plan” (University of Washington, 2015), https://digital.lib.washington.edu/researchworks/bitstream/handle/1773/34195/Ullmer_washington_0250O_14613.pdf?sequence=1.
Advancing Equity in Transportation in Oakland, California May 2016
32
priority and timing of implementation which is driven by factors other than the bike and pedestrian plans.
Challenge: need for more robust community participation
Lastly, staff recognize that desk-based equity analysis is only the starting point and there needs to be a range of consultations with communities to carefully assess their needs and desire for the planned improvements. This is particularly important in a city like Oakland where neighborhoods are changing rapidly and certain infrastructural investments, such as bike infrastructures, are associated with the process of gentrification. While there are many benefits to bicycling (low-cost mobility option, promoting physical health, easing congestion) planners should propose rather than impose bike infrastructures.
RECCOMMENDATIONS:
� Develop a policy mandate to expand and deepen the practice of incorporating equity considerations into planning. [Policy]
� Provide a forum for internal peer learning to share best practices on how to integrate equity into planning and implementation. [Organizational Capacity]
� Allocate resources to plug data gaps in order to better understand disadvantaged people’s travel needs and demands [Data]
� Obtain technical assistance on integrating race/ethnicity dimensions in technical transportation plans. [Organizational Capacity]
� Align paving prioritization plan with bicycle and pedestrian implementation plans. This may require a change in institutional relationship between Engineering & Construction Management Division and Transportation Planning & Funding Division. [Processes, Organizational Capacity]
� Allocate resources for carrying out robust community engagement efforts as part of the implementation of bicycle and pedestrian master plans, in order to ensure that planned improvements genuinely respond to the needs of the community. [Funding, Processes]
Advancing Equity in Transportation in Oakland, California May 2016
33
3. The Growing Shared Mobility Sector
Oakland is the next frontier for a fast growing market
Shared mobility services are set to expand rapidly in Oakland in 2016. In 2015, Oakland received a grant from MTC to expand the Bay Area Bike Share program, providing 850 bikes to Oakland through a public-private partnership with Motivate, the nation’s largest bike share operator. The point-to-point car share provider Car2go is planning to launch operations in 2016, joining ZipCar, City CarShare and others, which already operate over 100 carshare vehicles in the city. So-called Transportation Network Companies or TNCs, such as Lyft and Uber, also have a large and growing presence in Oakland. Live discussions are also taking place with other ride sharing providers including Scoot, an electric scooter-sharing firm, and Mahindra GenZe, the manufacturer of electric bicycles which is eager to launch a program test fleet services with shared, two-wheeled electric vehicles in the city.
Question of inclusivity
The emergence of these new transportation modes has the potential to supplement existing road and transit networks by helping to bridge the first- and last-mile access from many disconnected areas of the city. However, because of the relatively high cost to users and limited physical or logistical access, these options are not necessarily available to everyone, especially those in the lower income groups, seniors, and disabled travelers. A recent review of the shared mobility sector reveals that access to these services is generally poorer in areas with high proportion of low-income and racial or ethnic minority populations.29 Similarly, a study prepared for the City of Oakland found that many lower-income residents, people of color and immigrants are still disfranchised from public bicycle sharing systems, and there is a need for more targeted outreach to these groups who could benefit from this additional mobility option.30
Equity criteria in new service planning
In Oakland, efforts are being made to increase accessibility of shared mobility services in communities that are usually underrepresented. Equity analyses have been conducted as part of the planning and contracting process for the bike share and car
29 Michael Kodransky and Gabriel Lewenstein, “Connecting Low-Income People to Opportunity with Shared Mobility” (Institute for Transportation and Development Policy, December 2014), https://www.itdp.org/wp-content/uploads/2014/10/Shared-Mobility_Full-Report.pdf. 30 Sharon Robinson, “Oakland Bike Share: Pedaling Inclusions” (Master Degree Report, Mills College Public Policy Program, May 2015).
Advancing Equity in Transportation in Oakland, California May 2016
34
share program as required by the MTC grant agreement. The analyses involved integrating socio-economic and demographic data into the suitability analysis for potential bike share and car share locations. In the case of the bike share program, the analysis informed the contract agreement between the city and the operator. Importantly, the agreement specified that 20% of bike share stations would be placed in communities of concern as defined by MTC, putting equity at the core of the program’s design as it expands throughout the region. This led the other cities within the expansion program to follow suit and adopt the same distribution requirement. This experience has in turn influenced the planning and permitting process for the car share sector in Oakland, with the same 20% threshold being applied to designated parking zones for the Car2Go service.
Mobility Hubs
With other new transportation modes on the verge of launching, the city has also begun to explore the potential of mobility hubs. In August 2015, the city worked with a research team at UC Berkeley to conduct a mobility hub suitability analysis to identify potential sites that can optimally accommodate the various new modes. The project put a strong emphasis on maximizing mobility needs of disadvantaged populations in addition to service viability and network connectivity.
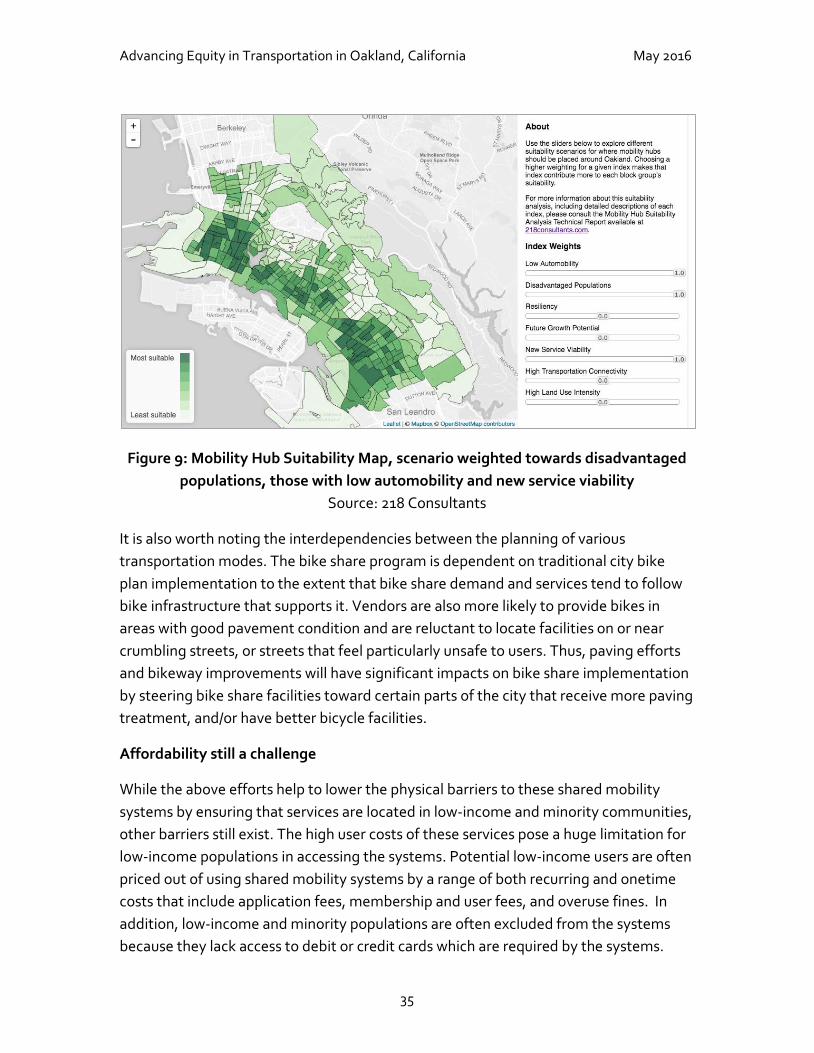
Using the interactive map developed by the team, the researchers identified areas suitable for mobility hubs under different scenarios. Under a planning scenario that places higher weighting on disadvantaged populations and populations with low auto mobility, while still emphasizing new service viability (profitability), the study indicated a high suitability rating for areas in West and deep East Oakland, suggesting both the need and an opportunity to expand bike share options to the traditionally underrepresented populations (Figure 9). For further details on the mobility hub project, see www.218consultants.com
Advancing Equity in Transportation in Oakland, California May 2016
35
Figure 9: Mobility Hub Suitability Map, scenario weighted towards disadvantaged populations, those with low automobility and new service viability
Source: 218 Consultants
It is also worth noting the interdependencies between the planning of various transportation modes. The bike share program is dependent on traditional city bike plan implementation to the extent that bike share demand and services tend to follow bike infrastructure that supports it. Vendors are also more likely to provide bikes in areas with good pavement condition and are reluctant to locate facilities on or near crumbling streets, or streets that feel particularly unsafe to users. Thus, paving efforts and bikeway improvements will have significant impacts on bike share implementation by steering bike share facilities toward certain parts of the city that receive more paving treatment, and/or have better bicycle facilities.
Affordability still a challenge
While the above efforts help to lower the physical barriers to these shared mobility systems by ensuring that services are located in low-income and minority communities, other barriers still exist. The high user costs of these services pose a huge limitation for low-income populations in accessing the systems. Potential low-income users are often priced out of using shared mobility systems by a range of both recurring and onetime costs that include application fees, membership and user fees, and overuse fines. In addition, low-income and minority populations are often excluded from the systems because they lack access to debit or credit cards which are required by the systems.
Advancing Equity in Transportation in Oakland, California May 2016
36
Some subsidy programs exist to support low-income users. For instance, the MTC initiated the Low Income Flexible Transportation (LIFT) Program in 2001. Through this program, City CarShare, a non-profit car share operator working primarily in San Francisco, Oakland and Berkeley, partnered with CalWorks, a program of the California Department of Social Services, to make certain types of car sharing memberships available to welfare-assisted working families.31 Another example is Buffalo CarShare, a non-profit service provider in New York. Dubbed as the Zipcar that low-income people can afford, Buffalo CarShare offers lower priced services and allows users of the system to pay by money order.32
However, shared mobility subsidy programs often rely on grant funding that are limited in scope and are time bound. Many programs no longer exist: the LIFT program received three cycles of funding, ending in 2004 with no replacement program. As new services continue to arrive in Oakland, the city will need to develop sustainable discount or subsidy programs in order to better connect disadvantaged population to shared mobility services. Shared mobility has the potential to expand transportation options for low-income population but only if they are made affordable.
RECOMMENDATIONS:
� Ensure new systems such as bikeshare, carshare and other incoming services are provided equitably to serve Oakland residents of all income levels, by requiring operators to conduct an equity analysis that includes underrepresented communities as part of the operating agreement. [Policy]
� Use the Mobility Hub Suitability Analysis tool to identify potential mobility hub locations that promote access by low-income and minority users. [Process, Organizational Capacity]
� Develop and implement discount and/or subsidy programs to decrease financial barriers for disadvantaged populations. Work with agencies such as the MTC and ACTC to make funding available for such programs. [Program]
� Strengthen community participation by partnering with community-based organizations that have strong, established relationships with underrepresented communities and communities of concern. [Process, Organizational Capacity]
31 Juan Ortega, “Car Sharing in the United States: Helping People Transition From Welfare to Work and Improving the Quality of Life of Low-Income Families,” 2005, http://web1.ctaa.org/webmodules/webarticles/articlefiles/carsharing_report_final.pdf. 32 Ryan McCarthy, “How Buffalo Car Share Fights Poverty” (Partnership for the Public Good, April 2012), http://archives.ppgbuffalo.org/wp-content/uploads/2012/02/How-Buffalo-Car-Share-Fights-Poverty.pdf.
Advancing Equity in Transportation in Oakland, California May 2016
37
� Develop and implement a public communication and engagement strategy for shared mobility programs that are currently underway in order to sustain pressure on private operators and the city to ensure equitable service provision. The Mobility Hub mapping tool can serve as an engagement platform. [Process, Organizational Capacity]
� Conduct on-going monitoring and evaluation of program effectiveness. Data collection should include disaggregation by race, ethnicity and other variables related to disadvantaged populations. [Process and Data]
4. Access and Affordability of Transit
Rich transit networks but poor service quality
Oakland is served primarily by two main transit systems: the urban rail service operated by the Bay Area Rapid Transit System (BART), with eight of BART’s 44 stations located in the city, and surface bus services operated by AC Transit, with 26 of 60 the system’s local lines serving Oakland, and more than half of the Transbay routes to San Francisco going through Oakland. AC Transit is also currently building the East Bay Bus Rapid Transit (BRT) line between Oakland and San Leandro. In addition, the city is served by Amtrak’s Capitol Corridor, the Alameda/Oakland Ferry, and several intercity bus services.
Oakland has a large number of low-income residents and residents of color (17% or over 70,000 people live below the federal poverty line and minorities make up over 70% of the population), many of whom do not have access to autos and are dependent on transit. Other transit-dependent groups include people with disabilities (8.3% of population), and children, youths and senior residents who make up 32% of the population. (2010-14 ACS)
While Oakland has a relatively dense transit network compared to many other cities in the Bay Area, connectivity is low due poor service levels in some areas. There are also significant transportation gaps in low-income communities and communities of color as identified by the West Oakland and Central-East Oakland Community Based Transportation Plans (CBTP). The Central-East Oakland CBTP compared the findings from the MTC’s Lifeline Transportation Network Report, which identified spatial and temporal gaps in transit service provision in the Bay Area, with the lived experience of the community through surveys and community meetings, and found significant discrepancies. The Lifeline Report found no low-income neighborhoods in the Central
Advancing Equity in Transportation in Oakland, California May 2016
38
��������������������������������������������������͙Ψ͜��������������������������; however, community groups identified several areas in Central and East Oakland that are outside the specified catchment area.33 The CBTP also found that most of the AC Transit routes in the area did not meet MTC’s frequency of service objectives. Only three of the 19 AC Transit routes in the Lifeline Network met their target frequencies. During weekday commute hours, only 9 routes meet the frequency target on average.34 Similar gaps were identified in the West Oakland CBTP, which surveyed over 600 area residents. The top four transportation needs identified were better pedestrian facilities around transit stations; BART and bus tickets/passes at reduced fares; more bus service on weekends, at night and early morning; and more frequent daytime bus service.35
“It goes beyond access. Just because you live near a bus stop that comes every hour, that’s not really access. It’s not efficient and is actually inaccessible when you need to get somewhere in a hurry and in a dignified way.” Transportation Advocate
The CBTPs were developed roughly ten years ago, and have not been updated, nor implemented, and the city does not act as the lead agency tracking CBTP implementation. As these plans provide valuable analysis, Oakland should take a more proactive role in updating, implementing and tracking progress on its CBTPs.
Another potential approach to addressing disparity in service quality is to pursue a more fine-grained analysis. One example is the San Francisco MUNI Service Equity Policy36, which was created in response to concerns that new investments in MUNI would not necessarily serve communities of concern. The policy requires that SFMTA staff carry out a comparative assessment of MUNI performance in targeted disadvantaged neighborhoods against citywide average of peer routes. The performance matrixes used include on-time service, travel time to destinations, frequency of bus bunching and crowding. Where they are found to be underperforming, improvement measures are identified and funding allocated to bridge the gap.
Transit-dependent populations underserved
33 “Central and East Oakland Community-Based Transportation Plan” (Alameda County Congestion Management Agency, December 2007). 34 Ibid. 35 “West Oakland Community-Based Transportation Plan” (Alameda County Congestion Management Agency, May 2006). 36 More information on the MUNI Service Equity Policy can be found at http://www.sfcta.org/sites/default/files/content/Executive/Meetings/board/2016/Feb/Revised/20160223_EquityStrategyPresentation_SFCTABoard_FINAL%20%281%29.pdf
Advancing Equity in Transportation in Oakland, California May 2016
39
A key concern repeatedly raised by interviewees is that transportation investments have largely gone to benefit white and more affluent communities historically, and decisions made by policy makers today perpetuate this trend. This concern mirrors the academic literature, which document transit policy’s bias toward the expansion of suburban bus, express bus and fixed rail systems which are used by higher income “choice riders”, while putting fewer resources toward transit services in low-income communities and communities of color who are more likely to be “transit dependent”.37
As demonstrated in Box 1 above (page 17), the spending of transportation dollars on different transit systems can be extremely inequitable, regressive and even illegal. While both AC Transit and BART systems are beyond the jurisdictive control of Oakland, the city must critically assess how it currently engages with these agencies that are responsible for providing vital services for the city’s most disadvantaged populations.
Investments that work for people who need it most
Transportation investments can advance equitable outcomes if directed toward those systems that serve those with high needs. Interviewees identified the current Bus Rapid Transit project on International Boulevard as an important investment that could significantly address transportation inequity in Oakland. This corridor currently serves 25,000 bus riders, 75% of whom are low-income people or people of color. The project will benefit this population by improving their mobility, providing a competitive alternative choice over auto, and making transit much more accessible, reliable and comfortable.
However, with the on-going process of rapid displacement and gentrification due to escalating real-estate prices in Oakland, there are concerns that current low-income residents in this area will be pushed out. The question for the city is how to ensure that other policies related to housing and land development are in place to protect those at risk of displacement. The need to create equitable transit-oriented development (TOD) is an extremely important and complex issue, and is beyond the scope of this report. However, other efforts are abound, chiefly the recently released Oakland Housing
37 Mark Garrett and Brian Taylor, “Reconsidering Social Equity in Public Transit,” Berkeley Planning Journal 13, no. 1 (January 1, 1999), http://escholarship.org/uc/item/1mc9t108; Robert D. Bullard, “Addressing Urban Transportation Equity in the United States,” Fordham Urban Law Journal 31 (2004 2003): 1183; Aaron Golub, Richard A. Marcantonio, and Thomas W. Sanchez, “Race, Space, and Struggles for Mobility: Transportation Impacts on African Americans in Oakland and the East Bay,” Urban Geography 34, no. 5 (August 1, 2013): 699–728, doi:10.1080/02723638.2013.778598.
Advancing Equity in Transportation in Oakland, California May 2016
40
Action Plan: Oakland At Home38, the State’s Affordable Housing and Sustainable Communities grant program, the Urban Displacement Project by UC Berkeley (www.urbandisplacement.org), and on-going work by the Great Communities Collaborative (www.greatcommunities.org) which has helped to shape a number of Oakland’s TOD plans with robust community engagement.
Gap in coordination with transit agencies
Until recently, Oakland has had no staff assigned as a point person to transit agencies. All of the transportation advocates interviewed and a number of city staff highlighted this as a significant gap and a barrier to achieving more equitable outcomes for the city’s transit-dependent community.
“I want the city to invest in a team of planners and engineers that work on transit and make transit a part of complete streets.” Oakland City Staff
“There needs to be a tighter working relationship between Oakland City and AC Transit and BART.” Local Transportation Advocate
The lack of coordination could mean that Oakland loses out when transit agencies make decisions about resource allocation. For instance, in early 2015 AC Transit announced a proposal for a radical rerouting and redesignation of many lines throughout their service area due to extra funds made available by the passage of Measure BB. The planned rerouting affected 17 lines that directly serve Oakland residents, yet there was limited engagement between the city and the AC Transit to assess the potential impact of the plan on communities. Similarly, the Alameda County Transportation Commission is leading the planning for an Affordable Student Transit Pass, a $15 million pilot program. Modeled after San Francisco’s Free MUNI for Youth Program, the Alameda County program aims to provide free passes to low and moderate-income youth. Due to lack of staff, Oakland has had very limited participation during the program design process where local stakeholders were consulted on program parameters and site selection, which would influence the distribution of program resources. As one interviewee noted, “Policies and decisions may not be overtly discriminatory, but they often don’t benefit low-income communities because they’re not appropriately targeted.”
RECOMMENDATIONS:
38 “Oakland At Home: Recommendations for Implementing A Roadmap Toward Equity From the Oakland Housing Cabinet,” March 2016, www2.oaklandnet.com/w/OAK057411.
Advancing Equity in Transportation in Oakland, California May 2016
41
� Designate staff to strengthen and formalize the working relationship with transit agencies, particularly with AC Transit, BART and MTC, to ensure that transit plans and programs benefit low-income communities and communities of color. [Organizational Capacity]
� Assess service level of bus system in communities of concern, building on the Service Equity approach used by SFMTA, and work with AC Transit to explore development of a similar program. [Program]
� Work with AC Transit to prioritize future BRT projects and jointly seek more funding for such projects. [Program]
� Develop a transit strategy that prioritizes transit-dependent communities, including policies regarding fares and passes. [Policy]
VI. RECOMMENDATIONS & CONCLUSIONS There is an emergent practice of integrating equity considerations into transportation planning in Oakland, starting with equity analyses in modal plans such as the bike and pedestrian plans, and in the new shared mobility sector. However, to achieve a systemic change, equity principles would need to be instituted in the city’s transportation practice at all levels from vision, policy formation, planning and funding allocation, and down to individual programs and projects. The new Department of Transportation presents a prime opportunity to do so and the city needs to ensure that equity principles are codified into policies and incorporated into standard operation procedures as the DOT becomes established. The following recommendations outline potential strategies for mainstreaming equity into the DOT. RECOMMENDATIONS: Vision, Goals and Policy Framework � At the highest level, the DOT needs to embed equity principles into its vision
and policy goals. Drawing from the literature review and research findings, the following lays out potential vision and goals that could be adopted by the DOT. As the first step, equity prinicples should be embedded in the Transportation Strategic Plan which is currently being developed.
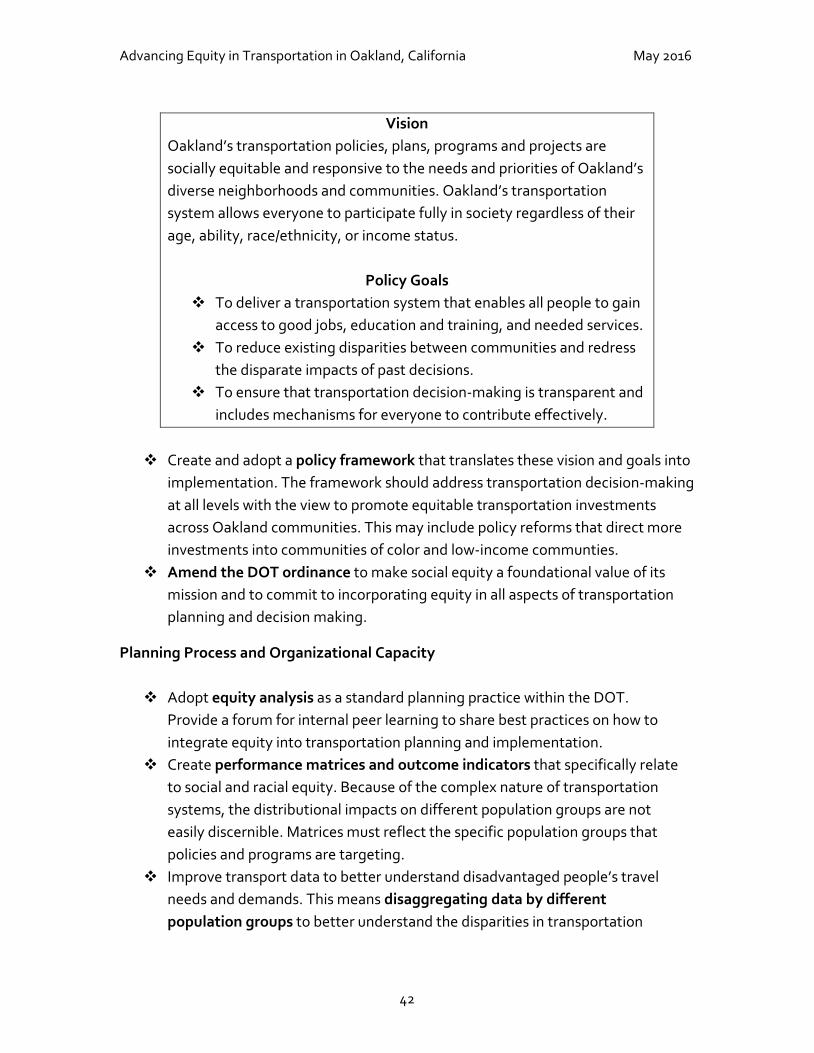
Advancing Equity in Transportation in Oakland, California May 2016
42
Vision Oakland’s transportation policies, plans, programs and projects are socially equitable and responsive to the needs and priorities of Oakland’s diverse neighborhoods and communities. Oakland’s transportation system allows everyone to participate fully in society regardless of their age, ability, race/ethnicity, or income status.
Policy Goals � To deliver a transportation system that enables all people to gain
access to good jobs, education and training, and needed services. � To reduce existing disparities between communities and redress
the disparate impacts of past decisions. � To ensure that transportation decision-making is transparent and
includes mechanisms for everyone to contribute effectively. � Create and adopt a policy framework that translates these vision and goals into
implementation. The framework should address transportation decision-making at all levels with the view to promote equitable transportation investments across Oakland communities. This may include policy reforms that direct more investments into communities of color and low-income communties.
� Amend the DOT ordinance to make social equity a foundational value of its mission and to commit to incorporating equity in all aspects of transportation planning and decision making.
Planning Process and Organizational Capacity � Adopt equity analysis as a standard planning practice within the DOT.
Provide a forum for internal peer learning to share best practices on how to integrate equity into transportation planning and implementation.
� Create performance matrices and outcome indicators that specifically relate to social and racial equity. Because of the complex nature of transportation systems, the distributional impacts on different population groups are not easily discernible. Matrices must reflect the specific population groups that policies and programs are targeting.
� Improve transport data to better understand disadvantaged people’s travel needs and demands. This means disaggregating data by different population groups to better understand the disparities in transportation
Advancing Equity in Transportation in Oakland, California May 2016
43
outcomes and get a true picture of who is benefiting from transportation dollars and who is not.
� Create a process for continuous community engagement to understand mobility needs of disadvantaged communities that extends beyond a specific project. The identified needs should inform the development future policies, programs and projects.
As the findings in the previous section show, community engagement and public participation is still a challenging area for Oakland. The following strategies are recommended: � Create mechanisms or access points to ensure the full and fair participation by
potentially affected communities in transportation decision-making processes. One strategy is to establish a transportation equity advisory committee as a way to improve institutional capacity for equity. Such committees can play many roles including to identifying and promoting the needs and priorities of disadvantaged communities and providing greater public oversight of transportation funding to ensure equitable outcomes. Examples include the Equity Advisory Council established by the Minneapolis Metropolitan Transportation Committee and the Social Equity Advisory Committee in Seattle. The committee may also serve as an access point for underrepresented residents and community organizations to get transportation projects funded.
� Incorporate existing community-based transportation plans (CBTPs) into the city’s Area Development Plans for the corresponding areas. Create a mechanism for development and funding of future community based transportation plans.
� Provide open access to in-depth information on city transportation funding, programs and projects.
� Cultivate intermediaries who serve as a connector to disadvantaged communities. Intermediaries have the ability to carry out targeted outreach and can play a more active role in community engagement. Develop a mechanism to allow community intermediaries to become on-call consultants in the same way as engineering and planning firms.
Programs and Initiative � Expand existing programs and develop new programs that provide reliable,
low-cost mobility options to disadvantaged populations. This includes
Advancing Equity in Transportation in Oakland, California May 2016
44
programs that expand access to transit, shared mobility services and other modes, and ensure affordability. More details on mode-specific recommendations are provided in the preceding Section IV and in the summary table below.
As this report has demonstrated, transportation decisions often have significant impact on equity outcomes and equity concerns are high on the City if Oakland’s agenda. In order to create a transportation system that is socially just and responsive to the needs of Oakland’s diverse communities, the city needs to incorporate equity principles into its decision making at all levels. The recommendations in this report provide strategies and specific action steps that the city can take to create a more inclusive and equitable transportation system
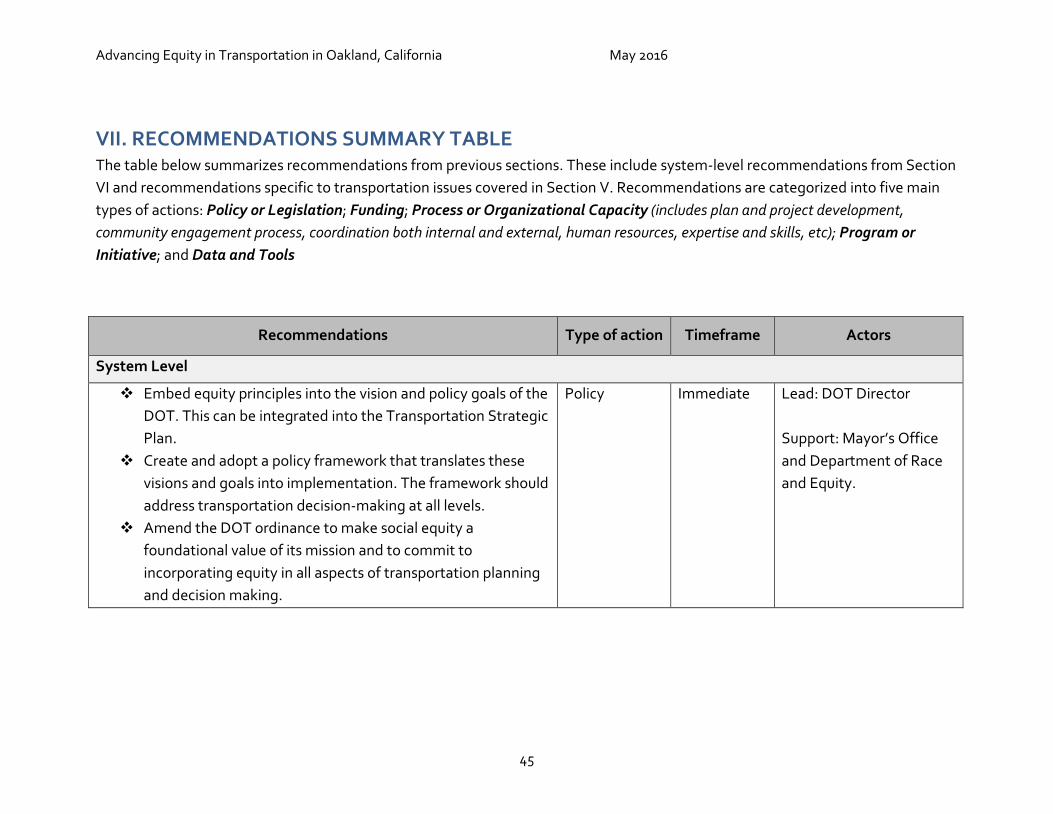
Advancing Equity in Transportation in Oakland, California May 2016
45
VII. RECOMMENDATIONS SUMMARY TABLE The table below summarizes recommendations from previous sections. These include system-level recommendations from Section VI and recommendations specific to transportation issues covered in Section V. Recommendations are categorized into five main types of actions: Policy or Legislation; Funding; Process or Organizational Capacity (includes plan and project development, community engagement process, coordination both internal and external, human resources, expertise and skills, etc); Program or Initiative; and Data and Tools
Recommendations Type of action Timeframe Actors
System Level
� Embed equity principles into the vision and policy goals of the DOT. This can be integrated into the Transportation Strategic Plan.
� Create and adopt a policy framework that translates these visions and goals into implementation. The framework should address transportation decision-making at all levels.
� Amend the DOT ordinance to make social equity a foundational value of its mission and to commit to incorporating equity in all aspects of transportation planning and decision making.
Policy Immediate Lead: DOT Director Support: Mayor’s Office and Department of Race and Equity.
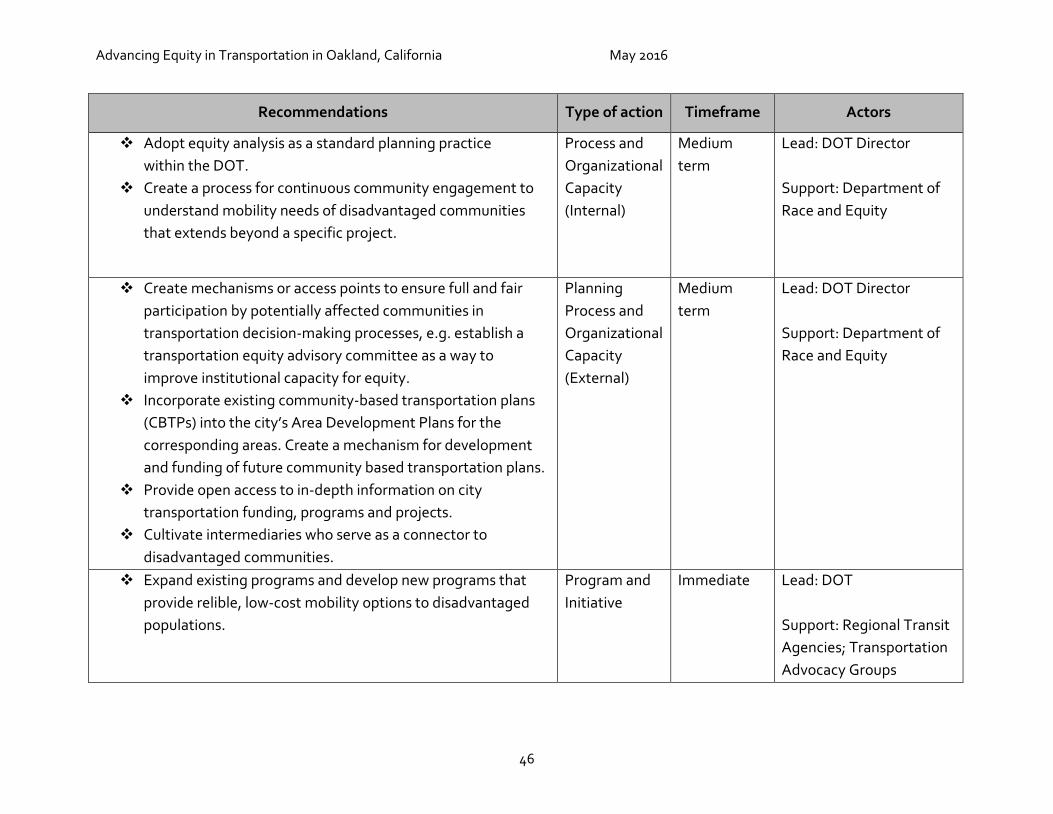
Advancing Equity in Transportation in Oakland, California May 2016
46
Recommendations Type of action Timeframe Actors
� Adopt equity analysis as a standard planning practice within the DOT.
� Create a process for continuous community engagement to understand mobility needs of disadvantaged communities that extends beyond a specific project.
Process and Organizational Capacity (Internal)
Medium term
Lead: DOT Director Support: Department of Race and Equity
� Create mechanisms or access points to ensure full and fair participation by potentially affected communities in transportation decision-making processes, e.g. establish a transportation equity advisory committee as a way to improve institutional capacity for equity.
� Incorporate existing community-based transportation plans (CBTPs) into the city’s Area Development Plans for the corresponding areas. Create a mechanism for development and funding of future community based transportation plans.
� Provide open access to in-depth information on city transportation funding, programs and projects.
� Cultivate intermediaries who serve as a connector to disadvantaged communities.
Planning Process and Organizational Capacity (External)
Medium term
Lead: DOT Director Support: Department of Race and Equity
� Expand existing programs and develop new programs that provide relible, low-cost mobility options to disadvantaged populations.
Program and Initiative
Immediate Lead: DOT Support: Regional Transit Agencies; Transportation Advocacy Groups
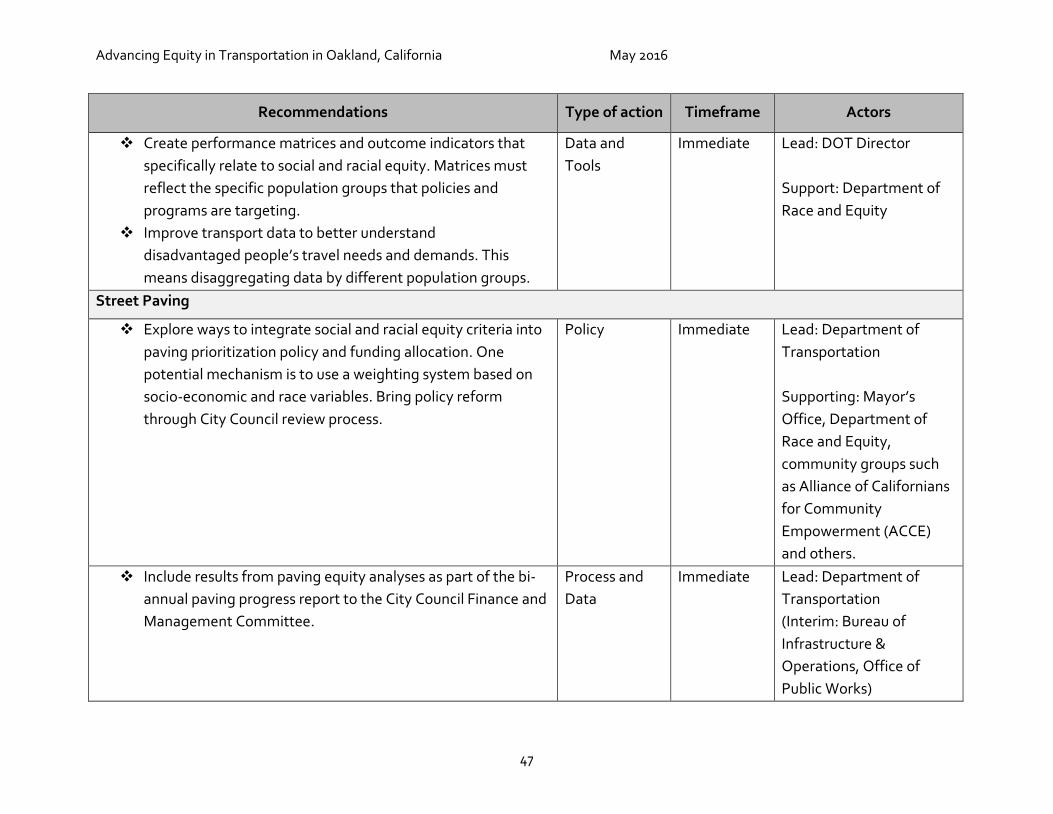
Advancing Equity in Transportation in Oakland, California May 2016
47
Recommendations Type of action Timeframe Actors
� Create performance matrices and outcome indicators that specifically relate to social and racial equity. Matrices must reflect the specific population groups that policies and programs are targeting.
� Improve transport data to better understand disadvantaged people’s travel needs and demands. This means disaggregating data by different population groups.
Data and Tools
Immediate Lead: DOT Director Support: Department of Race and Equity
Street Paving
� Explore ways to integrate social and racial equity criteria into paving prioritization policy and funding allocation. One potential mechanism is to use a weighting system based on socio-economic and race variables. Bring policy reform through City Council review process.
Policy Immediate Lead: Department of Transportation Supporting: Mayor’s Office, Department of Race and Equity, community groups such as Alliance of Californians for Community Empowerment (ACCE) and others.
� Include results from paving equity analyses as part of the bi-annual paving progress report to the City Council Finance and Management Committee.
Process and Data
Immediate Lead: Department of Transportation (Interim: Bureau of Infrastructure & Operations, Office of Public Works)
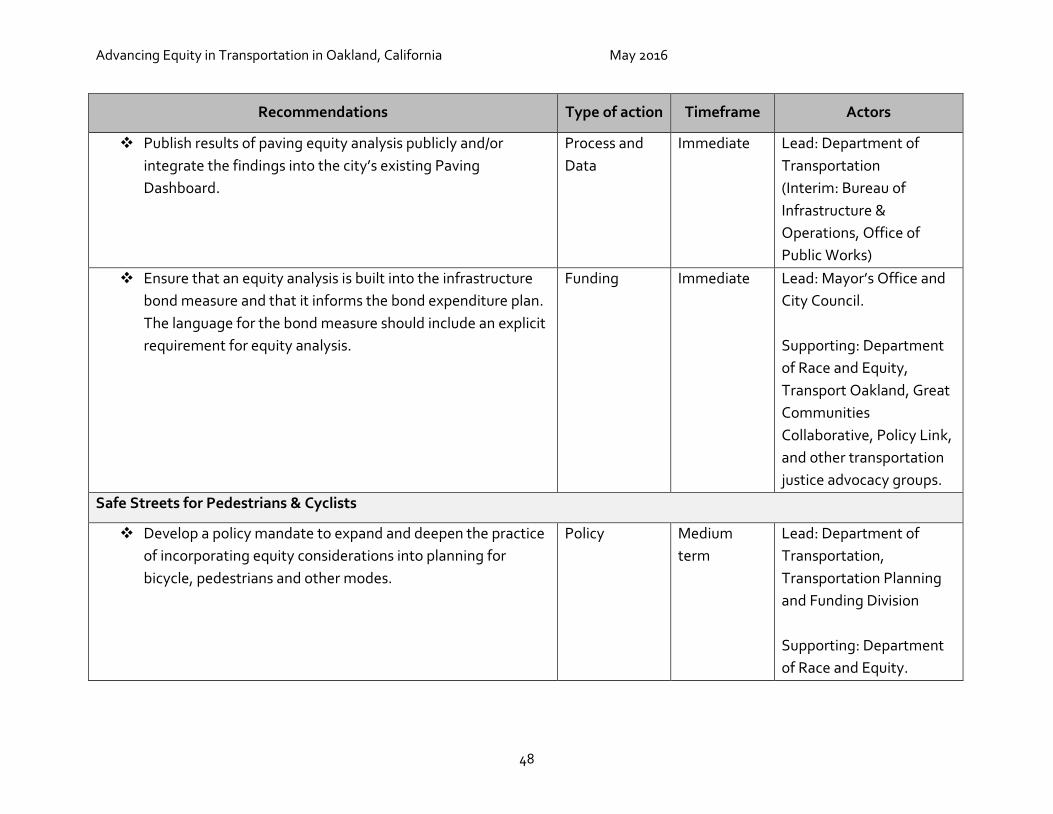
Advancing Equity in Transportation in Oakland, California May 2016
48
Recommendations Type of action Timeframe Actors
� Publish results of paving equity analysis publicly and/or integrate the findings into the city’s existing Paving Dashboard.
Process and Data
Immediate Lead: Department of Transportation (Interim: Bureau of Infrastructure & Operations, Office of Public Works)
� Ensure that an equity analysis is built into the infrastructure bond measure and that it informs the bond expenditure plan. The language for the bond measure should include an explicit requirement for equity analysis.
Funding Immediate Lead: Mayor’s Office and City Council. Supporting: Department of Race and Equity, Transport Oakland, Great Communities Collaborative, Policy Link, and other transportation justice advocacy groups.
Safe Streets for Pedestrians & Cyclists
� Develop a policy mandate to expand and deepen the practice of incorporating equity considerations into planning for bicycle, pedestrians and other modes.
Policy Medium term
Lead: Department of Transportation, Transportation Planning and Funding Division Supporting: Department of Race and Equity.
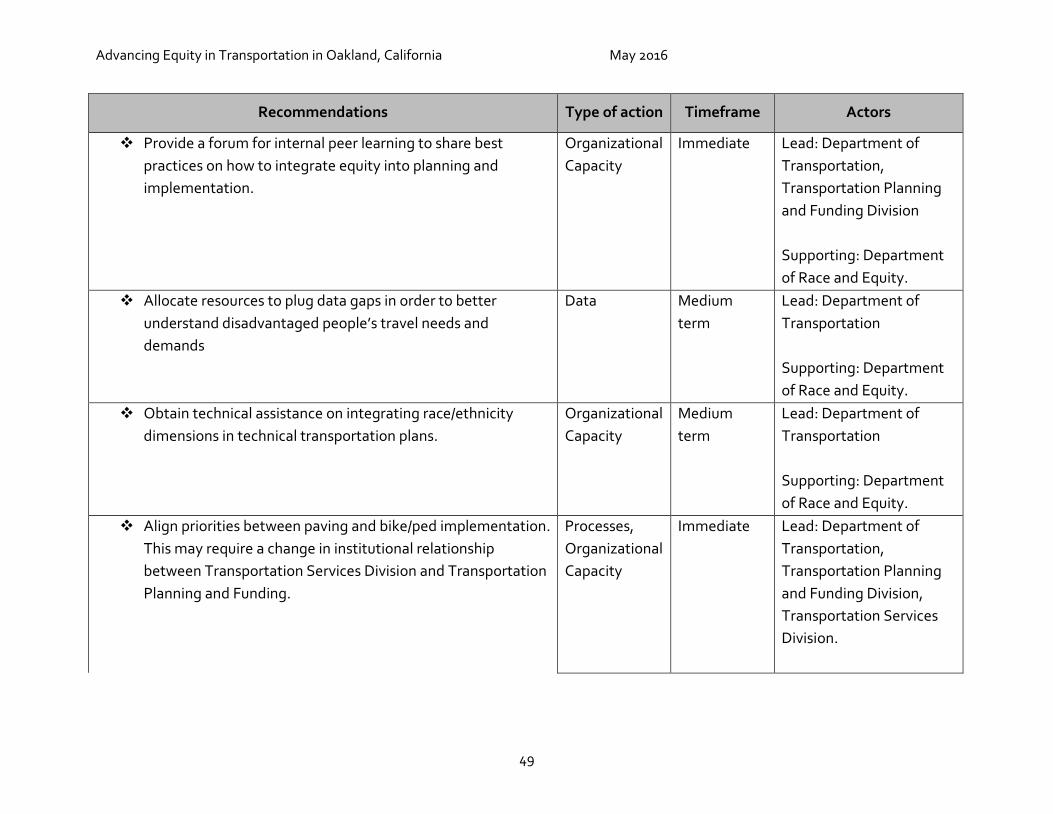
Advancing Equity in Transportation in Oakland, California May 2016
49
Recommendations Type of action Timeframe Actors
� Provide a forum for internal peer learning to share best practices on how to integrate equity into planning and implementation.
Organizational Capacity
Immediate Lead: Department of Transportation, Transportation Planning and Funding Division Supporting: Department of Race and Equity.
� Allocate resources to plug data gaps in order to better understand disadvantaged people’s travel needs and demands
Data Medium term
Lead: Department of Transportation Supporting: Department of Race and Equity.
� Obtain technical assistance on integrating race/ethnicity dimensions in technical transportation plans.
Organizational Capacity
Medium term
Lead: Department of Transportation Supporting: Department of Race and Equity.
� Align priorities between paving and bike/ped implementation. This may require a change in institutional relationship between Transportation Services Division and Transportation Planning and Funding.
Processes, Organizational Capacity
Immediate Lead: Department of Transportation, Transportation Planning and Funding Division, Transportation Services Division.
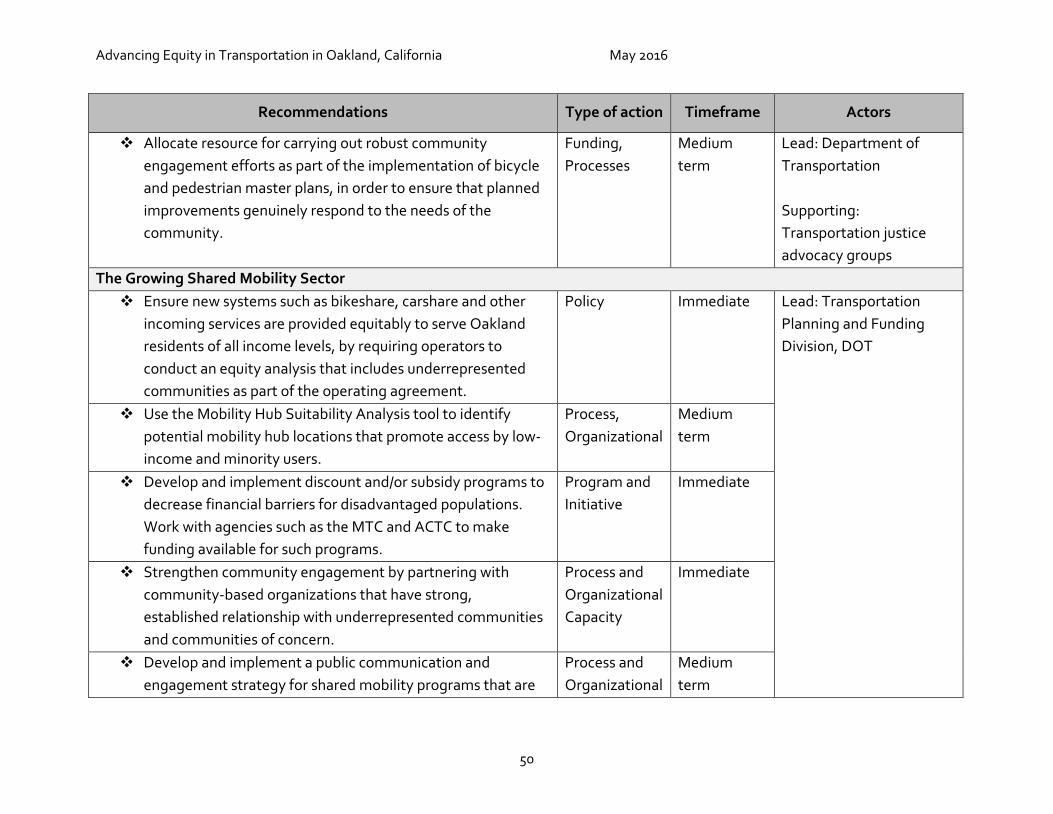
Advancing Equity in Transportation in Oakland, California May 2016
50
Recommendations Type of action Timeframe Actors
� Allocate resource for carrying out robust community engagement efforts as part of the implementation of bicycle and pedestrian master plans, in order to ensure that planned improvements genuinely respond to the needs of the community.
Funding, Processes
Medium term
Lead: Department of Transportation Supporting: Transportation justice advocacy groups
The Growing Shared Mobility Sector � Ensure new systems such as bikeshare, carshare and other
incoming services are provided equitably to serve Oakland residents of all income levels, by requiring operators to conduct an equity analysis that includes underrepresented communities as part of the operating agreement.
Policy Immediate Lead: Transportation Planning and Funding Division, DOT
� Use the Mobility Hub Suitability Analysis tool to identify potential mobility hub locations that promote access by low-income and minority users.
Process, Organizational
Medium term
� Develop and implement discount and/or subsidy programs to decrease financial barriers for disadvantaged populations. Work with agencies such as the MTC and ACTC to make funding available for such programs.
Program and Initiative
Immediate
� Strengthen community engagement by partnering with community-based organizations that have strong, established relationship with underrepresented communities and communities of concern.
Process and Organizational Capacity
Immediate
� Develop and implement a public communication and engagement strategy for shared mobility programs that are
Process and Organizational
Medium term
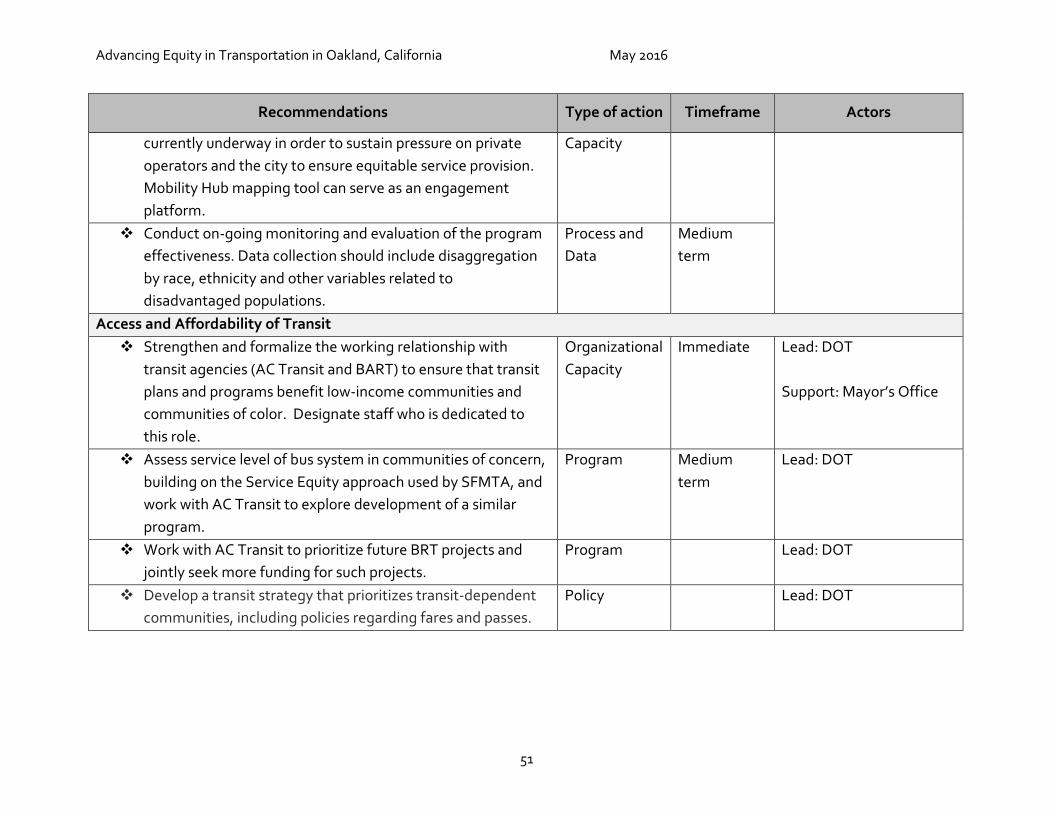
Advancing Equity in Transportation in Oakland, California May 2016
51
Recommendations Type of action Timeframe Actors
currently underway in order to sustain pressure on private operators and the city to ensure equitable service provision. Mobility Hub mapping tool can serve as an engagement platform.
Capacity
� Conduct on-going monitoring and evaluation of the program effectiveness. Data collection should include disaggregation by race, ethnicity and other variables related to disadvantaged populations.
Process and Data
Medium term
Access and Affordability of Transit � Strengthen and formalize the working relationship with
transit agencies (AC Transit and BART) to ensure that transit plans and programs benefit low-income communities and communities of color. Designate staff who is dedicated to this role.
Organizational Capacity
Immediate Lead: DOT Support: Mayor’s Office
� Assess service level of bus system in communities of concern, building on the Service Equity approach used by SFMTA, and work with AC Transit to explore development of a similar program.
Program Medium term
Lead: DOT
� Work with AC Transit to prioritize future BRT projects and jointly seek more funding for such projects.
Program Lead: DOT
� Develop a transit strategy that prioritizes transit-dependent communities, including policies regarding fares and passes.
Policy Lead: DOT
Advancing Equity in Transportation in Oakland, California May 2016
52
VIII. REFERENCES
Bania, Neil, Laura Leete, and Claudia Coulton. “Job Access, Employment and Earnings: Outcomes for Welfare Leavers in a US Urban Labour Market.” Urban Studies 45, no. 11 (October 1, 2008): 2179–2202. doi:10.1177/0042098008095864.
Blumenberg, Evelyn. “En-Gendering Effective Planning: Spatial Mismatch, Low-Income Women, and Transportation Policy.” Journal of the American Planning Association 70, no. 3 (2004): 269–81.
———. “On the Way to Work: Welfare Participants and Barriers to Employment.” Economic Development Quarterly 16, no. 4 (2002): 314–25.
Blumenberg, Evelyn, and Michael Manville. “Beyond the Spatial Mismatch: Welfare Recipients and Transportation Policy.” Journal of Planning Literature 19, no. 2 (2004): 182–205.
Bullard, Robert. “Addressing Urban Transportation Equity in the United States.” Fordham Urban Law Journal 31, no. 5 (January 1, 2003): 1183.
Bullard, Robert D. “Addressing Urban Transportation Equity in the United States.” Fordham Urban Law Journal 31 (2004 2003): 1183.
Bullard, Robert Doyle, and Glenn Steve Johnson. Just Transportation: Dismantling Race and Class Barriers to Mobility. New Society Publishers, 1997.
“Central and East Oakland Community-Based Transportation Plan.” Alameda County Congestion Management Agency, December 2007.
Cervero, Robert, Onésimo Sandoval, and John Landis. “Transportation as a Stimulus of Welfare-to-Work Private versus Public Mobility.” Journal of Planning Education and Research 22, no. 1 (September 1, 2002): 50–63. doi:10.1177/0739456X0202200105.
Dill, Jennifer, and Brendon Haggerty. “Equity Analysis of Portland’s Draft Bicycle Master Plan - Findings.” Report to Ellen Vanderslice, City of Portland Bureau of Transportation, 2009. http://www.bikeleague.org/sites/default/files/bikeleague/bikeleague.org/programs/bicyclefriendlyamerica/communities/pdfs/portland_bicycle_master_plan_equity_report_final.pdf.
Garrett, Mark, and Brian Taylor. “Reconsidering Social Equity in Public Transit.” Berkeley Planning Journal 13, no. 1 (January 1, 1999). http://escholarship.org/uc/item/1mc9t108.
Golub, Aaron, Richard A. Marcantonio, and Thomas W. Sanchez. “Race, Space, and Struggles for Mobility: Transportation Impacts on African Americans in Oakland and the East Bay.” Urban Geography 34, no. 5 (August 1, 2013): 699–728. doi:10.1080/02723638.2013.778598.
Kodransky, Michael, and Gabriel Lewenstein. “Connecting Low-Income People to Opportunity with Shared Mobility.” Institute for Transportation and Development Policy, December 2014. https://www.itdp.org/wp-content/uploads/2014/10/Shared-Mobility_Full-Report.pdf.
Advancing Equity in Transportation in Oakland, California May 2016
53
Lee, Bill Lann. “Civil Rights Remedies for Environmental Injustice. Paper Presented at Transportation and Environmental Justice: Building Model Partnerships Conference, Atlanta, GA.,” n.d.
Litman, T. “Evaluating Transportation Equity - Methods for Incorporating Distributional Impacts into Transportation Planning.” Victoria Transport Policy Institute, March 3, 2005. http://trid.trb.org/view.aspx?id=753739.
Lorien Rice. “Transportation Spending by Low-Income California Households: Lessons for the San Francisco Bay Area (PPIC Publication),” July 2004. http://www.ppic.org/main/publication.asp?i=428.
McCarthy, Ryan. “How Buffalo Car Share Fights Poverty.” Partnership for the Public Good, April 2012. http://archives.ppgbuffalo.org/wp-content/uploads/2012/02/How-Buffalo-Car-Share-Fights-Poverty.pdf.
“Motor Vehicle Traffic-Related Pedestrian Deaths — United States, 2001–2010.” Accessed March 21, 2016. http://www.cdc.gov/mmwr/preview/mmwrhtml/mm6215a1.htm.
“MTC Equity Analysis Report.” Metropolitan Transportation Commission, February 2009. http://www.mtc.ca.gov/planning/2035_plan/Supplementary/equity/FinalEquityAnalysisReportWeb.pdf.
“Neighborhoods with the Highest Pedestrian Death Rates.” Accessed March 21, 2016. http://www.governing.com/topics/public-justice-safety/gov-deadly-neighborhoods-pedestrian-deaths-maps.html.
“Oakland At Home: Recommendations for Implementing A Roadmap Toward Equity From the Oakland Housing Cabinet,” March 2016. www2.oaklandnet.com/w/OAK057411.
Ong, Paul, and Evelyn Blumenberg. “Job Access, Commute and Travel Burden among Welfare Recipients.” Urban Studies 35, no. 1 (1998): 77–93.
Ortega, Juan. “Car Sharing in the United States: Helping People Transition From Welfare to Work and Improving the Quality of Life of Low-Income Families,” 2005. http://web1.ctaa.org/webmodules/webarticles/articlefiles/carsharing_report_final.pdf.
Ospina, Tulio. “East Oakland Residents Take Mayor Schaaf on Tour of Neglected Flatland Streets.” Post News Group, September 18, 2015. http://postnewsgroup.com/blog/2015/09/18/east-oakland-residents-take-mayor-schaaf-tour-neglected-flatland-streets/.
“Plan Bay Area 2013,” July 2013. Proceedings, the First National People of Color Environmental Leadership Summit. United
Church of Christ Commission for Racial Justice, 1992. Pucher, John, and John L. Renne. “Socioeconomics of Urban Travel: Evidence from the
2001 NHTS.” Transportation Quarterly 57, no. 3 (2003): 49–77. Race and Social Justice Initiative. “Racial Equity Toolkit to Assess Policies, Initiatives,
Programs, and Budget Issues.” Accessed April 29, 2016.
Advancing Equity in Transportation in Oakland, California May 2016
54
http://www.seattle.gov/Documents/Departments/RSJI/RacialEquityToolkit_FINAL_August2012.pdf.
Robinson, Sharon. “Oakland Bike Share: Pedaling Inclusions.” Master Degree Report, Mills College Public Policy Program, May 2015.
Seattle Department of Transportation. “Move Seattle: 10-Year Strategic Vision for Transportation.” Transportation Plan. Seattle: Seattle Department of Transportation, Spring 2015. http://www.seattle.gov/transportation/docs/MoveSeatte-FinalDraft-2-25-Online.pdf.
“Some Cities Are Still More Unequal than Others—an Update.” The Brookings Institution, February 2014. http://www.brookings.edu/research/reports2/2015/03/city-inequality-berube-holmes.
“Statement of Principles.” Transportation Equity Caucus. Accessed December 5, 2015. http://www.equitycaucus.org/About/StatementofPrinciples.
Stehlin, John. “Cycles of Investment: Bicycle Infrastructure, Gentrification, and the Restructuring of the San Francisco Bay Area.” Environment and Planning A 47, no. 1 (January 1, 2015): 121–37. doi:10.1068/a130098p.
———. “Regulating Inclusion: Spatial Form, Social Process, and the Normalization of Cycling Practice in the USA.” Mobilities 9, no. 1 (January 2, 2014): 21–41. doi:10.1080/17450101.2013.784527.
“Twin Cities Equitable Development Scorecard: A Tool for Communities and Planners,” October 2014.
Ulmer, Michael. “An Equity Analysis of the 2014 Seattle Bicycle Master Plan.” University of Washington, 2015. https://digital.lib.washington.edu/researchworks/bitstream/handle/1773/34195/Ullmer_washington_0250O_14613.pdf?sequence=1.
“West Oakland Community-Based Transportation Plan.” Alameda County Congestion Management Agency, May 2006.
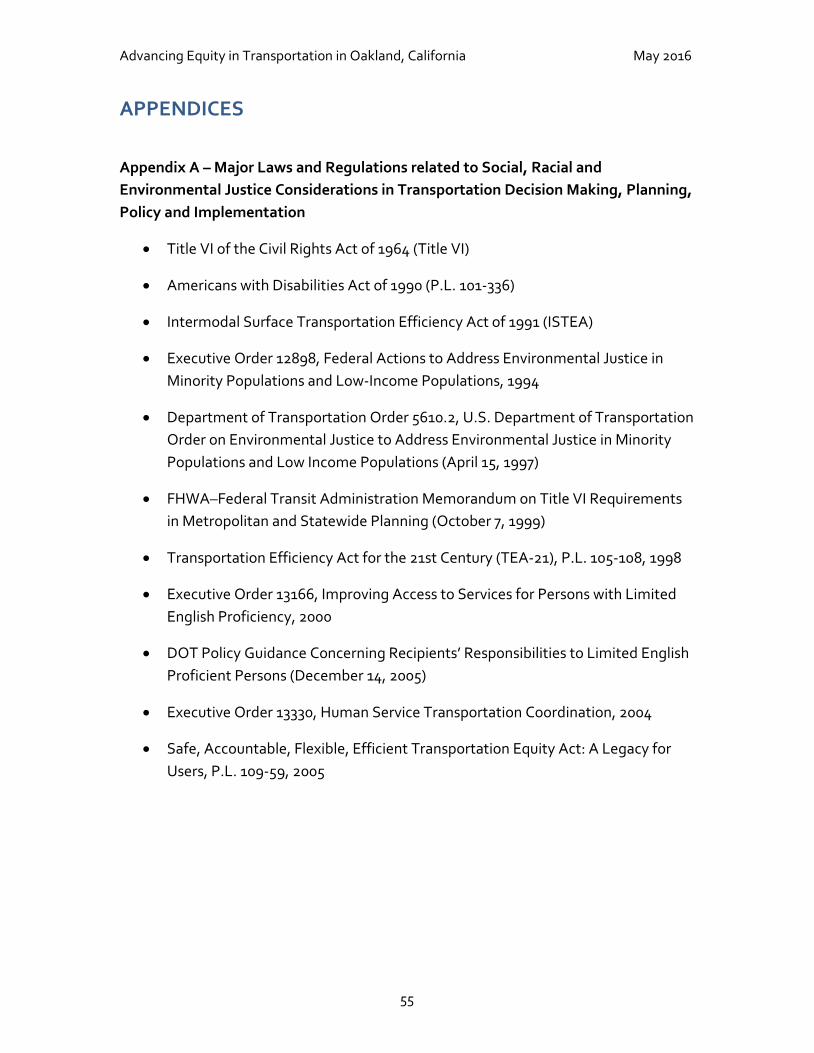
Advancing Equity in Transportation in Oakland, California May 2016
55
APPENDICES Appendix A – Major Laws and Regulations related to Social, Racial and Environmental Justice Considerations in Transportation Decision Making, Planning, Policy and Implementation
x Title VI of the Civil Rights Act of 1964 (Title VI)
x Americans with Disabilities Act of 1990 (P.L. 101-336)
x Intermodal Surface Transportation Efficiency Act of 1991 (ISTEA)
x Executive Order 12898, Federal Actions to Address Environmental Justice in Minority Populations and Low-Income Populations, 1994
x Department of Transportation Order 5610.2, U.S. Department of Transportation Order on Environmental Justice to Address Environmental Justice in Minority Populations and Low Income Populations (April 15, 1997)
x FHWA–Federal Transit Administration Memorandum on Title VI Requirements in Metropolitan and Statewide Planning (October 7, 1999)
x Transportation Efficiency Act for the 21st Century (TEA-21), P.L. 105-108, 1998
x Executive Order 13166, Improving Access to Services for Persons with Limited English Proficiency, 2000
x DOT Policy Guidance Concerning Recipients’ Responsibilities to Limited English Proficient Persons (December 14, 2005)
x Executive Order 13330, Human Service Transportation Coordination, 2004
x Safe, Accountable, Flexible, Efficient Transportation Equity Act: A Legacy for Users, P.L. 109-59, 2005

Advancing Equity in Transportation in Oakland, California May 2016
56
Appendix B1 – Equity Analysis of Oakland Pavement Conditions and 5-year Paving Plan Memo
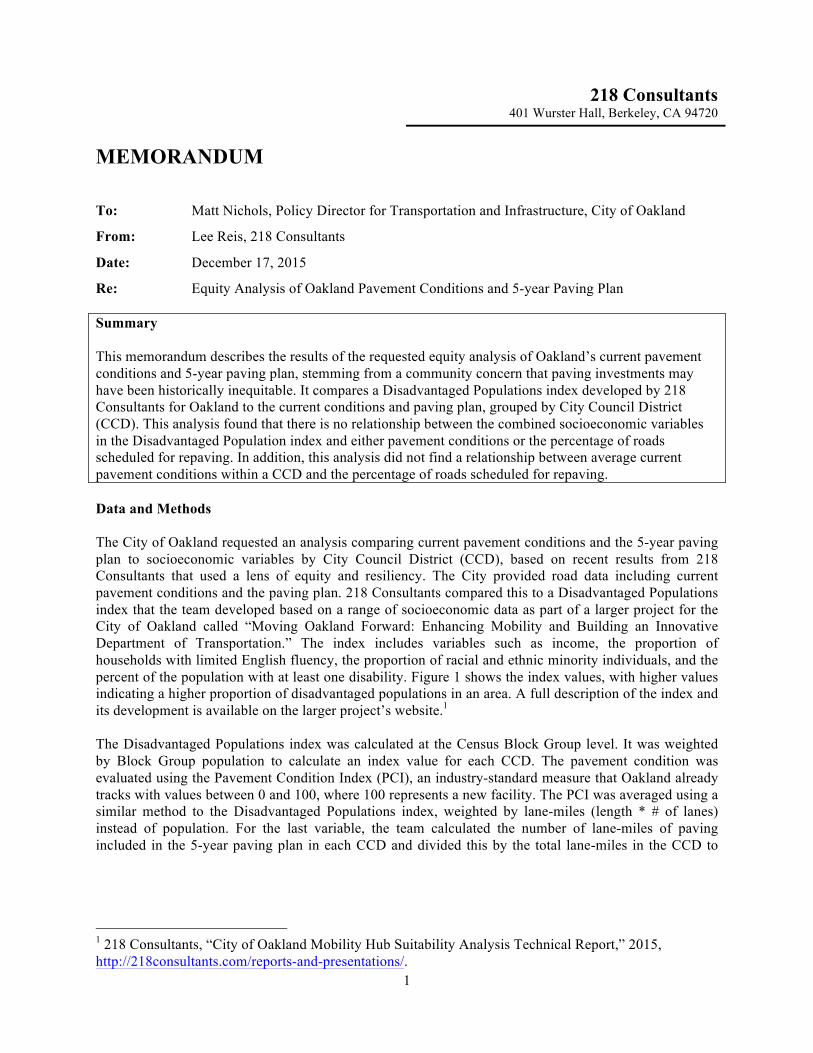
1
218 Consultants 401 Wurster Hall, Berkeley, CA 94720
MEMORANDUM To: Matt Nichols, Policy Director for Transportation and Infrastructure, City of Oakland
From: Lee Reis, 218 Consultants
Date: December 17, 2015
Re: Equity Analysis of Oakland Pavement Conditions and 5-year Paving Plan Summary This memorandum describes the results of the requested equity analysis of Oakland’s current pavement conditions and 5-year paving plan, stemming from a community concern that paving investments may have been historically inequitable. It compares a Disadvantaged Populations index developed by 218 Consultants for Oakland to the current conditions and paving plan, grouped by City Council District (CCD). This analysis found that there is no relationship between the combined socioeconomic variables in the Disadvantaged Population index and either pavement conditions or the percentage of roads scheduled for repaving. In addition, this analysis did not find a relationship between average current pavement conditions within a CCD and the percentage of roads scheduled for repaving. Data and Methods The City of Oakland requested an analysis comparing current pavement conditions and the 5-year paving plan to socioeconomic variables by City Council District (CCD), based on recent results from 218 Consultants that used a lens of equity and resiliency. The City provided road data including current pavement conditions and the paving plan. 218 Consultants compared this to a Disadvantaged Populations index that the team developed based on a range of socioeconomic data as part of a larger project for the City of Oakland called “Moving Oakland Forward: Enhancing Mobility and Building an Innovative Department of Transportation.” The index includes variables such as income, the proportion of households with limited English fluency, the proportion of racial and ethnic minority individuals, and the percent of the population with at least one disability. Figure 1 shows the index values, with higher values indicating a higher proportion of disadvantaged populations in an area. A full description of the index and its development is available on the larger project’s website.1 The Disadvantaged Populations index was calculated at the Census Block Group level. It was weighted by Block Group population to calculate an index value for each CCD. The pavement condition was evaluated using the Pavement Condition Index (PCI), an industry-standard measure that Oakland already tracks with values between 0 and 100, where 100 represents a new facility. The PCI was averaged using a similar method to the Disadvantaged Populations index, weighted by lane-miles (length * # of lanes) instead of population. For the last variable, the team calculated the number of lane-miles of paving included in the 5-year paving plan in each CCD and divided this by the total lane-miles in the CCD to
1 218 Consultants, “City of Oakland Mobility Hub Suitability Analysis Technical Report,” 2015, http://218consultants.com/reports-and-presentations/.
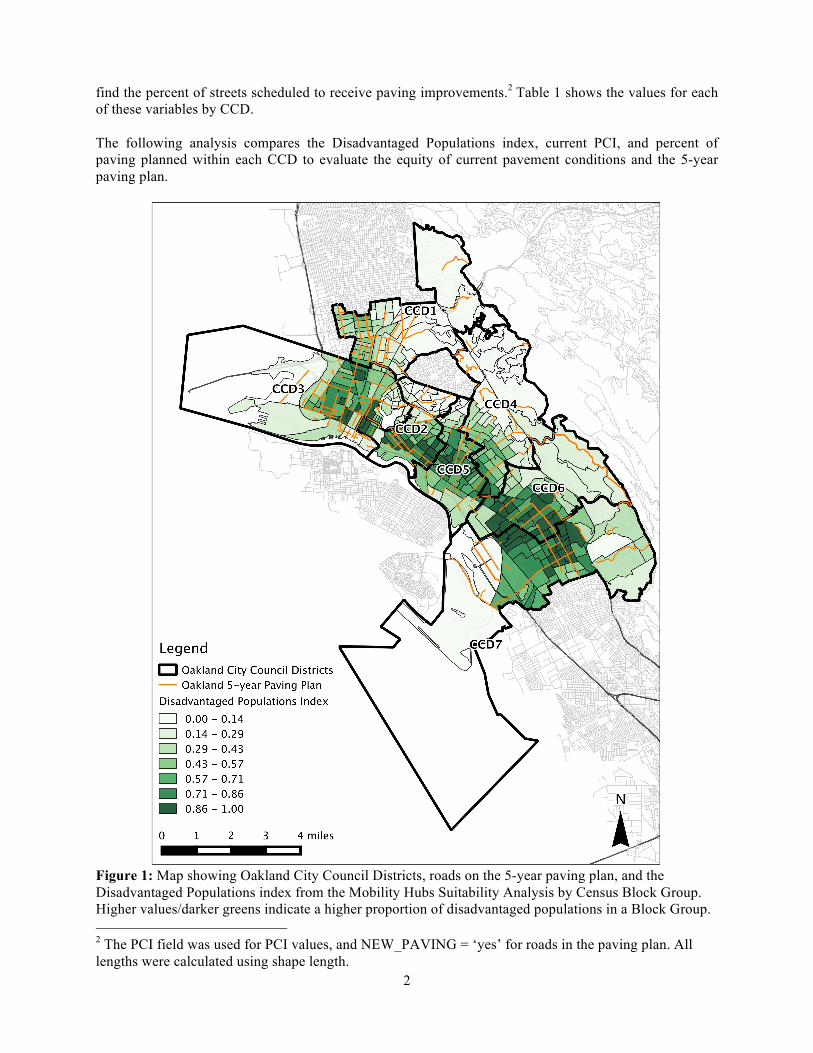
2
find the percent of streets scheduled to receive paving improvements.2 Table 1 shows the values for each of these variables by CCD. The following analysis compares the Disadvantaged Populations index, current PCI, and percent of paving planned within each CCD to evaluate the equity of current pavement conditions and the 5-year paving plan.
Figure 1: Map showing Oakland City Council Districts, roads on the 5-year paving plan, and the Disadvantaged Populations index from the Mobility Hubs Suitability Analysis by Census Block Group. Higher values/darker greens indicate a higher proportion of disadvantaged populations in a Block Group. 2 The PCI field was used for PCI values, and NEW_PAVING = ‘yes’ for roads in the paving plan. All lengths were calculated using shape length.
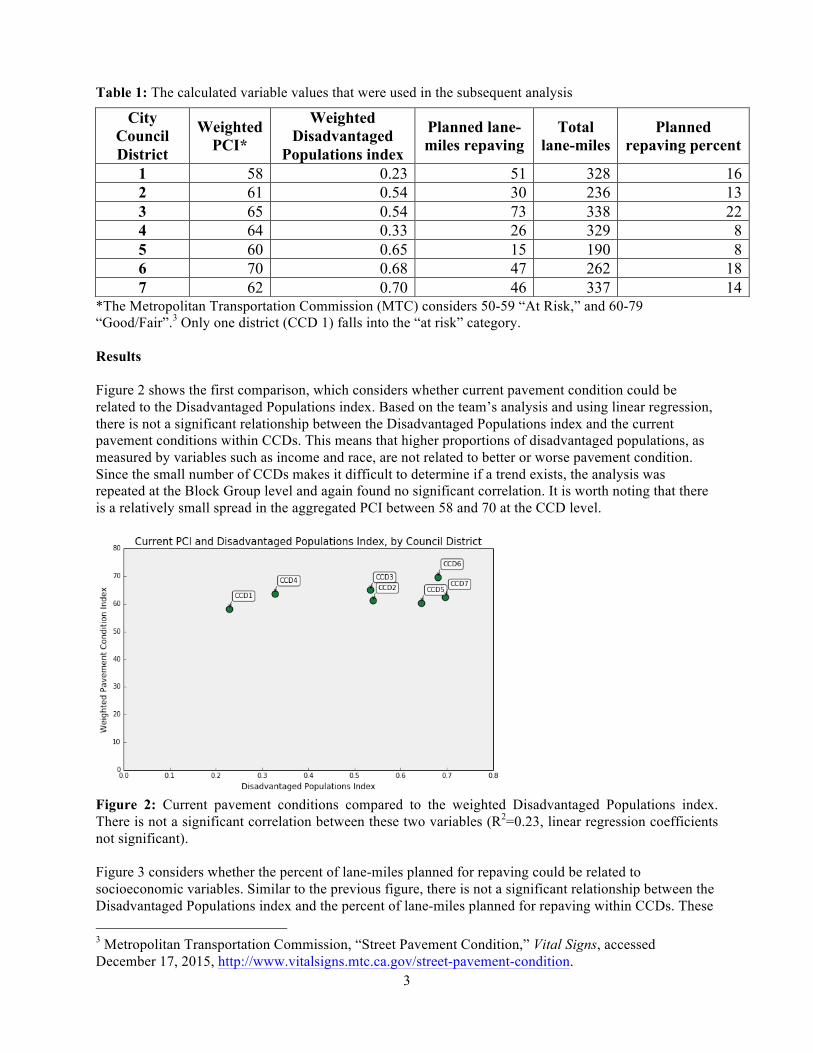
3
Table 1: The calculated variable values that were used in the subsequent analysis
*The Metropolitan Transportation Commission (MTC) considers 50-59 “At Risk,” and 60-79 “Good/Fair”.3 Only one district (CCD 1) falls into the “at risk” category. Results Figure 2 shows the first comparison, which considers whether current pavement condition could be related to the Disadvantaged Populations index. Based on the team’s analysis and using linear regression, there is not a significant relationship between the Disadvantaged Populations index and the current pavement conditions within CCDs. This means that higher proportions of disadvantaged populations, as measured by variables such as income and race, are not related to better or worse pavement condition. Since the small number of CCDs makes it difficult to determine if a trend exists, the analysis was repeated at the Block Group level and again found no significant correlation. It is worth noting that there is a relatively small spread in the aggregated PCI between 58 and 70 at the CCD level.
Figure 2: Current pavement conditions compared to the weighted Disadvantaged Populations index. There is not a significant correlation between these two variables (R2=0.23, linear regression coefficients not significant). Figure 3 considers whether the percent of lane-miles planned for repaving could be related to socioeconomic variables. Similar to the previous figure, there is not a significant relationship between the Disadvantaged Populations index and the percent of lane-miles planned for repaving within CCDs. These 3 Metropolitan Transportation Commission, “Street Pavement Condition,” Vital Signs, accessed December 17, 2015, http://www.vitalsigns.mtc.ca.gov/street-pavement-condition.
City Council District
Weighted PCI*
Weighted Disadvantaged
Populations index
Planned lane-miles repaving
Total lane-miles
Planned repaving percent
1 58 0.23 51 328 16 2 61 0.54 30 236 13 3 65 0.54 73 338 22 4 64 0.33 26 329 8 5 60 0.65 15 190 8 6 70 0.68 47 262 18 7 62 0.70 46 337 14
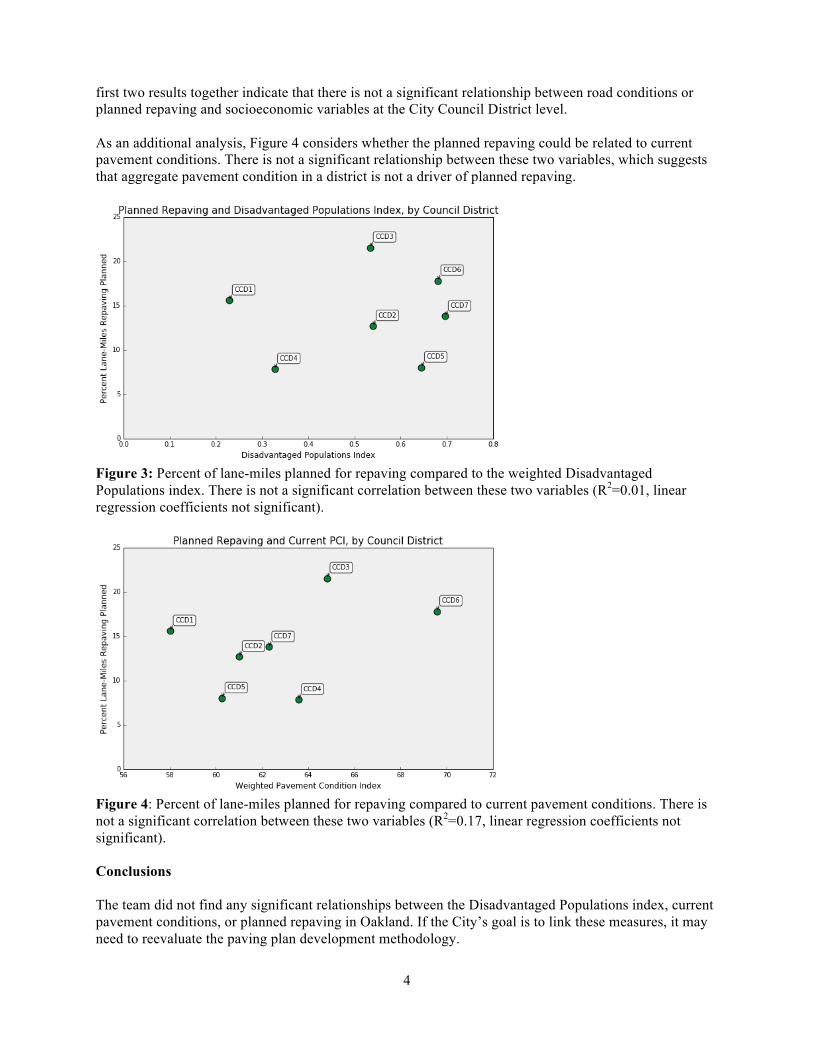
4
first two results together indicate that there is not a significant relationship between road conditions or planned repaving and socioeconomic variables at the City Council District level. As an additional analysis, Figure 4 considers whether the planned repaving could be related to current pavement conditions. There is not a significant relationship between these two variables, which suggests that aggregate pavement condition in a district is not a driver of planned repaving.
Figure 3: Percent of lane-miles planned for repaving compared to the weighted Disadvantaged Populations index. There is not a significant correlation between these two variables (R2=0.01, linear regression coefficients not significant).
Figure 4: Percent of lane-miles planned for repaving compared to current pavement conditions. There is not a significant correlation between these two variables (R2=0.17, linear regression coefficients not significant). Conclusions The team did not find any significant relationships between the Disadvantaged Populations index, current pavement conditions, or planned repaving in Oakland. If the City’s goal is to link these measures, it may need to reevaluate the paving plan development methodology.

Advancing Equity in Transportation in Oakland, California May 2016
61
Appendix B2 – Equity Analysis of 10-Year Pavement History Memo
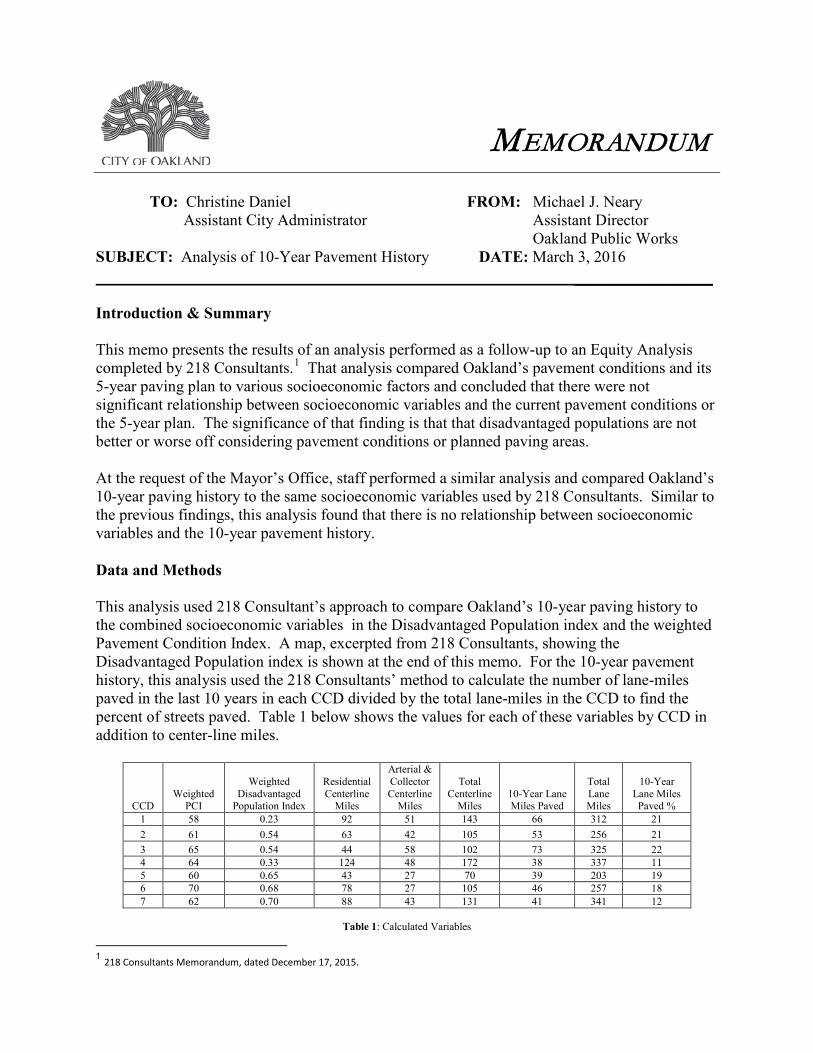
MEMORANDUM
TO: Christine Daniel FROM: Michael J. Neary Assistant City Administrator Assistant Director Oakland Public Works SUBJECT: Analysis of 10-Year Pavement History DATE: March 3, 2016 ________________ Introduction & Summary This memo presents the results of an analysis performed as a follow-up to an Equity Analysis completed by 218 Consultants.1 That analysis compared Oakland’s pavement conditions and its 5-year paving plan to various socioeconomic factors and concluded that there were not significant relationship between socioeconomic variables and the current pavement conditions or the 5-year plan. The significance of that finding is that that disadvantaged populations are not better or worse off considering pavement conditions or planned paving areas. At the request of the Mayor’s Office, staff performed a similar analysis and compared Oakland’s 10-year paving history to the same socioeconomic variables used by 218 Consultants. Similar to the previous findings, this analysis found that there is no relationship between socioeconomic variables and the 10-year pavement history. Data and Methods This analysis used 218 Consultant’s approach to compare Oakland’s 10-year paving history to the combined socioeconomic variables in the Disadvantaged Population index and the weighted Pavement Condition Index. A map, excerpted from 218 Consultants, showing the Disadvantaged Population index is shown at the end of this memo. For the 10-year pavement history, this analysis used the 218 Consultants’ method to calculate the number of lane-miles paved in the last 10 years in each CCD divided by the total lane-miles in the CCD to find the percent of streets paved. Table 1 below shows the values for each of these variables by CCD in addition to center-line miles.
CCD Weighted
PCI
Weighted Disadvantaged
Population Index
Residential Centerline
Miles
Arterial & Collector Centerline
Miles
Total Centerline
Miles 10-Year Lane Miles Paved
Total Lane Miles
10-Year Lane Miles Paved %
1 58 0.23 92 51 143 66 312 21 2 61 0.54 63 42 105 53 256 21 3 65 0.54 44 58 102 73 325 22 4 64 0.33 124 48 172 38 337 11 5 60 0.65 43 27 70 39 203 19 6 70 0.68 78 27 105 46 257 18 7 62 0.70 88 43 131 41 341 12
Table 1: Calculated Variables
1 218 Consultants Memorandum, dated December 17, 2015.
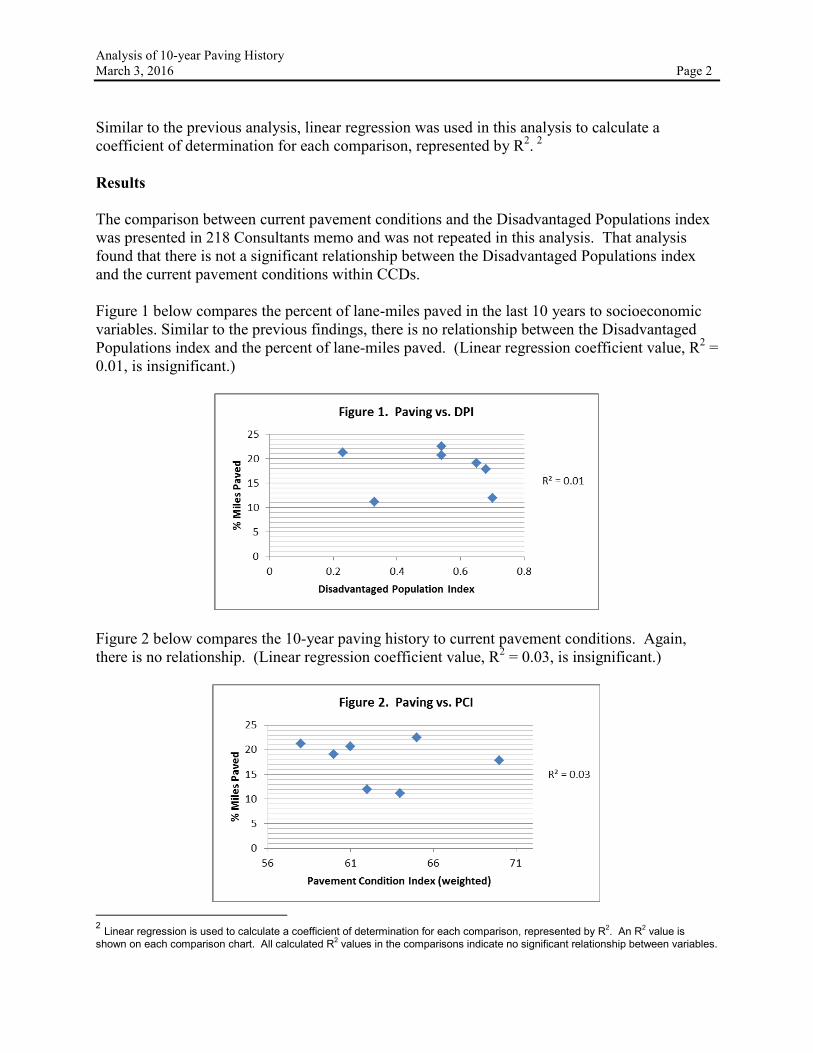
Analysis of 10-year Paving History March 3, 2016 Page 2
Similar to the previous analysis, linear regression was used in this analysis to calculate a coefficient of determination for each comparison, represented by R2. 2 Results The comparison between current pavement conditions and the Disadvantaged Populations index was presented in 218 Consultants memo and was not repeated in this analysis. That analysis found that there is not a significant relationship between the Disadvantaged Populations index and the current pavement conditions within CCDs. Figure 1 below compares the percent of lane-miles paved in the last 10 years to socioeconomic variables. Similar to the previous findings, there is no relationship between the Disadvantaged Populations index and the percent of lane-miles paved. (Linear regression coefficient value, R2 = 0.01, is insignificant.)
Figure 2 below compares the 10-year paving history to current pavement conditions. Again, there is no relationship. (Linear regression coefficient value, R2 = 0.03, is insignificant.)
2 Linear regression is used to calculate a coefficient of determination for each comparison, represented by R2. An R2 value is shown on each comparison chart. All calculated R2 values in the comparisons indicate no significant relationship between variables.
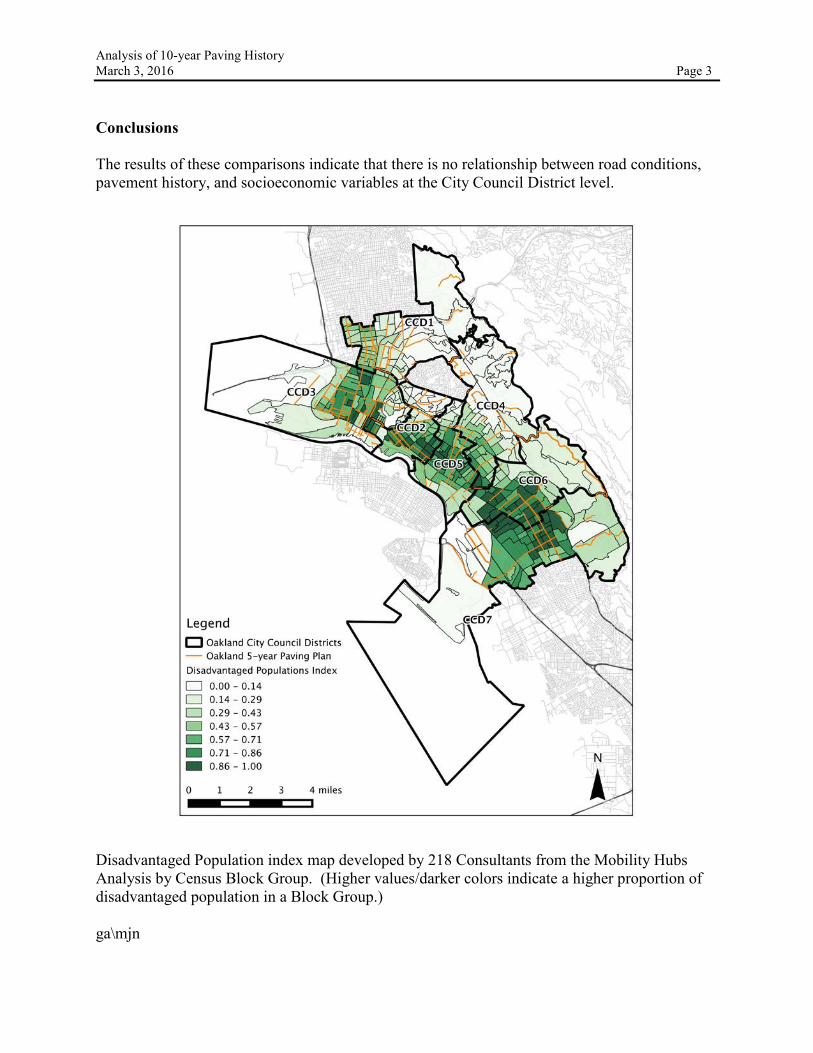
Analysis of 10-year Paving History March 3, 2016 Page 3
Conclusions The results of these comparisons indicate that there is no relationship between road conditions, pavement history, and socioeconomic variables at the City Council District level.
Disadvantaged Population index map developed by 218 Consultants from the Mobility Hubs Analysis by Census Block Group. (Higher values/darker colors indicate a higher proportion of disadvantaged population in a Block Group.) ga\mjn