Embed Size (px)
Citation preview

Advancing Our Global Momentum
Consumer Analyst Group of Europe
Gary Fayard Chief Financial Officer
Steve Cahillane President and CEO
March 30, 2011

2
Forward-Looking Statements This presentation may contain statements, estimates or projections that constitute “forward-looking statements” as defined under U.S. federal securities laws. Generally, the words “believe,” “expect,” “intend,” “estimate,” “anticipate,” “project,” “will” and similar expressions identify forward-looking statements, which generally are not historical in nature. Forward-looking statements are subject to certain risks and uncertainties that could cause actual results to differ materially from The Coca-Cola Company’s historical experience and our present expectations or projections. These risks include, but are not limited to, obesity and other health concerns; scarcity and quality of water; changes in the nonalcoholic beverages business environment, including changes in consumer preferences based on health and nutrition considerations and obesity concerns; shifting consumer tastes and needs, changes in lifestyles and competitive product and pricing pressures; risks related to the assets acquired and liabilities assumed, as well as the integration of, CCE’s North American business; the continuing uncertainty in the credit and equity market conditions; increased competition; our ability to expand our operations in developing and emerging markets; foreign currency exchange rate fluctuations; increases in interest rates; our ability to maintain good relationships with our bottling partners; the financial condition of our bottling partners; increases in income tax rates or changes in income tax laws; increases in indirect taxes or new indirect taxes; our ability and the ability of our bottling partners to maintain good labor relations, including the ability to renew collective bargaining agreements on satisfactory terms and avoid strikes, work stoppages or labor unrest; increase in cost, disruption of supply or shortage of energy; increase in cost, disruption of supply or shortage of ingredients or packaging materials; changes in laws and regulations relating to beverage containers and packaging, including container deposit, recycling, eco-tax and/or product stewardship laws or regulations; adoption of significant additional labeling or warning requirements; unfavorable general economic conditions in the United States and other major markets; unfavorable economic and political conditions in international markets, including civil unrest and product boycotts; litigation uncertainties; adverse weather conditions; our ability to maintain brand image and corporate reputation as well as other product issues such as product recalls; changes in, or our failure to comply with, laws and regulations applicable to our products or our business operations; changes in accounting standards and taxation requirements; our ability to achieve overall long-term goals; our ability to protect our information technology infrastructure; additional impairment charges; our ability to successfully manage Company-owned or controlled bottling operations; the impact of climate change on our business; global or regional catastrophic events; and other risks discussed in our filings with the Securities and Exchange Commission (SEC), including our Annual Report on Form 10-K for the year ended December 31, 2009 and our subsequently filed Quarterly Reports on Form 10-Q, which filings are available from the SEC. You should not place undue reliance on forward-looking statements, which speak only as of the dates they are made. The Coca-Cola Company undertakes no obligation to publicly update or revise any forward-looking statements.
Reconciliation to US GAAP Financial Information The following presentation includes certain "non-GAAP financial measures" as defined in Regulation G under the Securities Exchange Act of 1934. A schedule is posted on the Company's website at TheCoca-ColaCompany.com (in the “Investors" section) which reconciles our results as reported under General Accepted Accounting Principles and the non-GAAP financial measures included in the following presentation.

Advancing Our Global Momentum
• Realizing Our 2020 Vision
• Advancing From a Position of Strength
• Driving Results Around the World
• Growing Again in North America
• The Opportunity is Abundant
3 3

4
Realizing Our
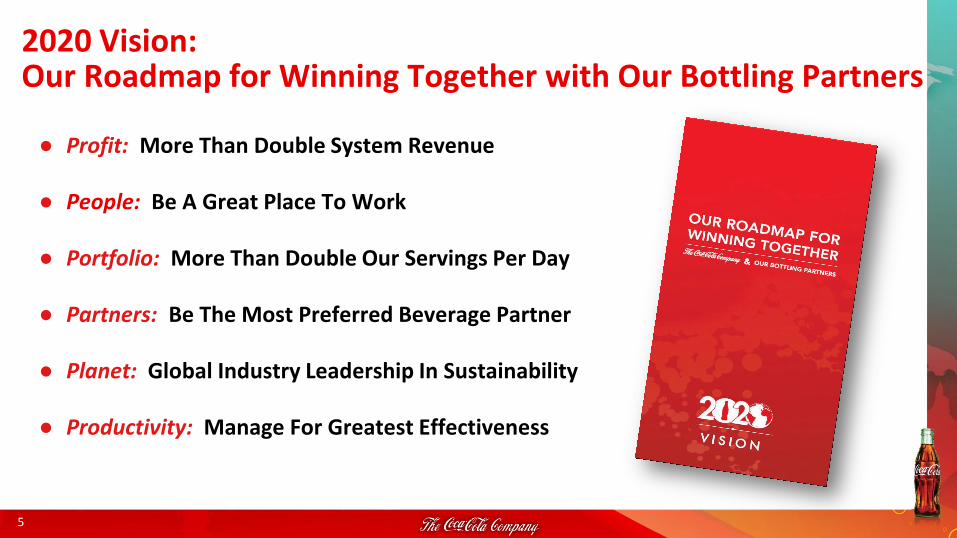
2020 Vision: Our Roadmap for Winning Together with Our Bottling Partners
● Profit: More Than Double System Revenue
● People: Be A Great Place To Work
● Portfolio: More Than Double Our Servings Per Day
● Partners: Be The Most Preferred Beverage Partner
● Planet: Global Industry Leadership In Sustainability
● Productivity: Manage For Greatest Effectiveness
5
Farrell Classified - Internal use

Realizing Our 2020 Vision
6

Our Long-Term Targets Remain Appropriate
• Long-Term and Sustainable
• Meet or Exceed the Targets
• Remain Constructively Discontent
Volume Net Revenue OI EPS
3-4%
5-6%
6-8%
Note: Long-Term Growth Targets are Comparable Currency Neutral
Our Beliefs
High Single Digit
• Share Gains
• Consistent Revenue Growth
• Expanding Operating Margins
• Healthy Cash Flows
Our Metrics
7

2006 2007 2008 2009 20102006 2007 2008 2009 2010
Unit Case Volume Growth
2 Comparable Currency Neutral
Operating Income Growth
8%
6% Long-Term Growth Target
10% 8% 11% 5% 6% 4% 3%
4%
3%
7%
Long-Term Growth Target
5% 11%
1 Excluding the Benefit of New Cross-Licensed Brands
1
2
Delivering Consistent, Quality Results
8

1 DPS = Dividends Per Share
2006 2007 2008 2009 2010
$1.8 $1.1
$1.5
Providing Solid Returns to Shareowners $27.4B Cash Returned to Shareowners 2006 - 2010 US $ in Billions (Other than Dividend Per Share amounts)
$5.4 $4.9
$4.6
Dividends Share Repurchase
$ 1.52 $ 1.24 $ 1.36
$2.5
$5.3
$ 1.64 DPS1
• 49th Consecutive Year of Annual Dividend Increases
• $2 - $2.5B Share Repurchase in 2011
$ 1.76
$7.2
$3.1
9 9

10
Advancing From a Position of Strength

A Global Business System Like No Other
11
Servings Every Day 20 Million
Customers Every Week Billion
Global Bottling Partners 300 Nearly

The World’s Greatest Brands . . .
12
Billion Dollar Brands … and More to Come!
Sparkling Beverages
#1 Ready to Drink
Teas
#1 Juices and Juice
Drinks
#1 Ready to Drink
Coffees
#1

Innovating for Today
13
Heinz PlantBottle
PlantBottle
Minute Maid Nimbu Fresh
Hugo
Mini Can
Cappy Sherbet
I LOHAS
Maaza Milky
Minute Maid Pulpy Super Milky
vitaminwater Stur-D
FSC Label
HFC Free Coolers
Freestyle
Dogadan RTD Tea innocent
NFC Juices & Recyclable
Carafes 1.25 Liter
Where Will Happiness Strike Next?

Connecting with Our Consumers
15

16
Driving Results in Latin America

Advancing Our Momentum in Latin America
17
Mexico 43% of Group Unit Cases
675 Per Capita
17
Brazil 26% of Group Unit Cases
229 Per Capita
Argentina 7% of Group Unit Cases
318 Per Capita
17
Latin America • 28% of Total Company Unit Cases • 28% of Total Company Operating Income • 40% of Population Under Age 21 • Adding an Average of 175 MM Sparkling
Unit Cases Every Year Since 2000

Brazil: Well Positioned for Ongoing Success
18
• 1.9 Billion Unit Cases
• KO’s 4th Largest Market
• KO Growing 2.3X Faster than Brazil’s GDP1
• 3.4 Times Larger than Nearest Competitor
Coca-Cola Brazil FY 2010
1 2005-2010 CAGR
Sparkling Beverages
#1
Teas / Mates
#1
Juices / Juice Drinks
#1
Bottled Waters
#1

19
Driving Results in the Pacific
19

20
Advancing Our Momentum in the Pacific
20
China 41% of Group Unit Cases
34 Per Capita
Japan 21% of Group Unit Cases
178 Per Capita
Philippines 12% of Group Unit Cases
144 Per Capita
20
Pacific • 18% of Total Company Unit Cases • 24% of Total Company Operating Income • Nearly 5% Compounded GDP Growth Through 2020 • Almost 35% of the Next Decade’s Global GDP Growth

China: A Long-Term Growth Story
21
2003 2010
KO Volume
2.9X
2003 2010
2.7X
NARTD Industry
LOOKING BACK: LOOKING FORWARD:
• Expanding Distribution Scale
• Investing Across Channels
• Innovating and Introducing Greater Variety
• Over 100 Million Incremental Unit Cases Added Each Year
• Outperformed the Industry for Past 7 Years

Helping Japan Recover
22
• Donated 7 Million Bottles of Beverages
• Established Coca-Cola Japan Reconstruction Fund to Assist in Relief and Rebuilding; Focused on Helping Children
• Outside the Hardest Hit Region, Our Operations Had Limited Impact
• Some Warehouses and Sales Offices Damaged and a Small Percentage of Vending Machines Lost
• Bottlers are Collaborating and Leveraging Unique Coca-Cola Global Supplier Relationships to Meet Customer and Consumer Needs
Our Support
Our Business

Japan: Executing to Win Across Categories
23
Coca-Cola Trademark: Sustainable Growth 2006-2010 CAGR
+7% +2% +27%
Georgia Coffee: Connecting with Consumers
Standard Bito (Low Calorie)
Black

24
Driving Results in Eurasia & Africa

Advancing Our Momentum in Eurasia & Africa
25 25
Russia 10% of Group Unit Cases
69 Per Capita
India 13% of Group Unit Cases
11 Per Capita
South Africa 13% of Group Unit Cases
254 Per Capita
25
Eurasia & Africa Group • 16% of Total Company Unit Cases • 12% of Total Company Operating
Income • Nearly 70% of World’s Population
Growth by 2020 • 45% of Global Urban Growth and
Global Middle Class Growth by 2020

India: A Strong Growth Story
26
2006 2007 2008 2009 2010
Per Capita
6
Per Capita
11
Total KO Volume
4 of Top 5 Sparkling Brands Owned by The Coca-Cola Company
2010 Volume Growth
+17%

27
Driving Results in Europe
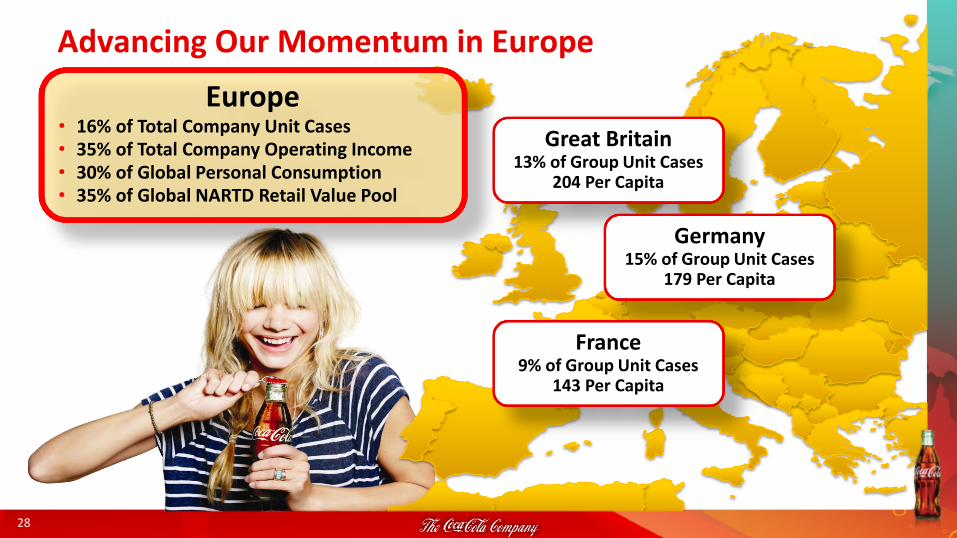
Advancing Our Momentum in Europe
28 28
Great Britain 13% of Group Unit Cases
204 Per Capita
Germany 15% of Group Unit Cases
179 Per Capita
France 9% of Group Unit Cases
143 Per Capita
28
Europe • 16% of Total Company Unit Cases • 35% of Total Company Operating Income • 30% of Global Personal Consumption • 35% of Global NARTD Retail Value Pool

Great Britain: Gearing Up for 2012 Olympics
29
Q4 2010 Sparkling Growth
Coca-Cola +2%
Sprite +5%
Fanta +5%
• New Recyclable PET Carafes
• New Package Size Options for Smoothies

Germany: Restoring Sustainable Growth
30
2010 NARTD Performance
• Volume
• Volume Share
• Value Share
Success Drivers
• Recruiting Teens
• Engaging New Consumers
• Building New Brands
• Working as One

31
Driving Results in North America
Steve Cahillane President & CEO Coca-Cola Refreshments

Advancing Our Momentum in North America
32
North America • 22% of Total Company Unit Cases • 18% of Total Company Operating Income • 3rd Largest Teen Population by 2020 • Growing Urbanization • Culture of Innovation and Entrepreneurship • Largest Source of NARTD Profit Canada
6% of Group Unit Cases 236 Per Capita
United States 94% of Group Unit Cases
394 Per Capita

US: Well Positioned for Success
33

Bottling Investments Group
Our Business Model Had to Evolve
34
CCE North America Operations
Philly Coke
Foodservice
Minute Maid
Odwalla
Commercial Leadership & Group Functions
• Consistent with 2020 Vision
• Strategically Advances Our Franchise System
• Annual Synergies of ~$350 Million
— 80% Cost Synergies
— 20% Revenue Synergies
CCNA Supply Chain
Operations
Coca-Cola North America
Coca-Cola Enterprises

Building the Best Brand, Sales and Customer Service Company
• Translating Brand Value into Customer Value
• Developing an Advantaged Go-To-Market Approach
• Earning Price and Growing Share
• Living Positively in All We Do
35

US: Revitalizing Sparkling Beverages
36
STRONGER BRANDS. . .
FAVORITE BRAND VS. NEAREST COMPETITOR1
6.0x 2.0x 1.7x 2.5x 4.3x
. . .LEAD TO STRONGER RESULTS!
1 USA B-CUBED, 12MM Dec 10 (Total Population)

US: Still Beverage Portfolio Momentum
37
• Largest Juice/Juice Drink Company
• Simply: 2010 Volume Growth +23%
• Powerade: Gaining Share for 9 Consecutive Quarters
• vitaminwater: the #1 Enhanced Water Brand. . . and Growing

Translating Brand Value into Customer Value
38
Category Leadership
One Coca-Cola Experience
One Coca-Cola Voice

1
Segmented Look of Success “Inspiration at the Point of Purchase”
39
2
3
4
5
6
7
8
9
8
Beverage Aisles
Lobby/ 1st Position Display
Checkout/Self Checkout Coolers
Promotional Endcap
5
Perimeter Display Rack
5 Portfolio Endcap, SSD/Still Endcap
6
1
4
Meal Rack/Display
Snack Rack/Display
Still Perimeter Display
9 2
7
3
Right Execution Daily

Developing an Advantaged Go-To-Market Approach
40
• Inventory Reduction “and” On-Time In Full Deliveries
• Cost Control “and” Superior Quality
• Successful Launches “and” Decreased Breakage, Damage and Loss
• Sustainability Improvement “and” Lower Cost
• Associate Engagement “and” Operational Excellence
Destination: World Class Demand-Driven Product Supply System
Living Positively in All We Do
41

Destination: Winning in North America
42

43
The Opportunity is Abundant

The Opportunity is Abundant
44
Farrell
Classified - Internal use
2010 2012 2014 2016 2018 2020
KO System Net Revenues (US$ currency neutral)
Implied By KO’s
Long-Term Growth Model
44

We Are 125 Years Young
45

46
Q & A