Embed Size (px)
Citation preview

SponSored by
WWW.PHARMAMANUFACTURING.COM
Advancing Solid Dose Pharmaceutical Manufacturing

22
In Pursuit of Wet Granulation Optimization page 3
Preventing Filming, Sticking of Cohesive Compounds page 8
Understanding Modified Release Technologies page 13
Tablet Evaluation Using Ultrasound page 16Transmission Measurement
Five Musts for Dust page 21
contents
www.pharmamanufacturing.comADvAncing Solid doSe Pharmaceutical manufacturing
CLICK ON ARTICLE
3
IN PuRsuIT Of WET GRANuLATION
OPTImIzATION
by Tim Freeman, managing director, Freeman Technology
dynamic powder testing in process assures tablet CQAs
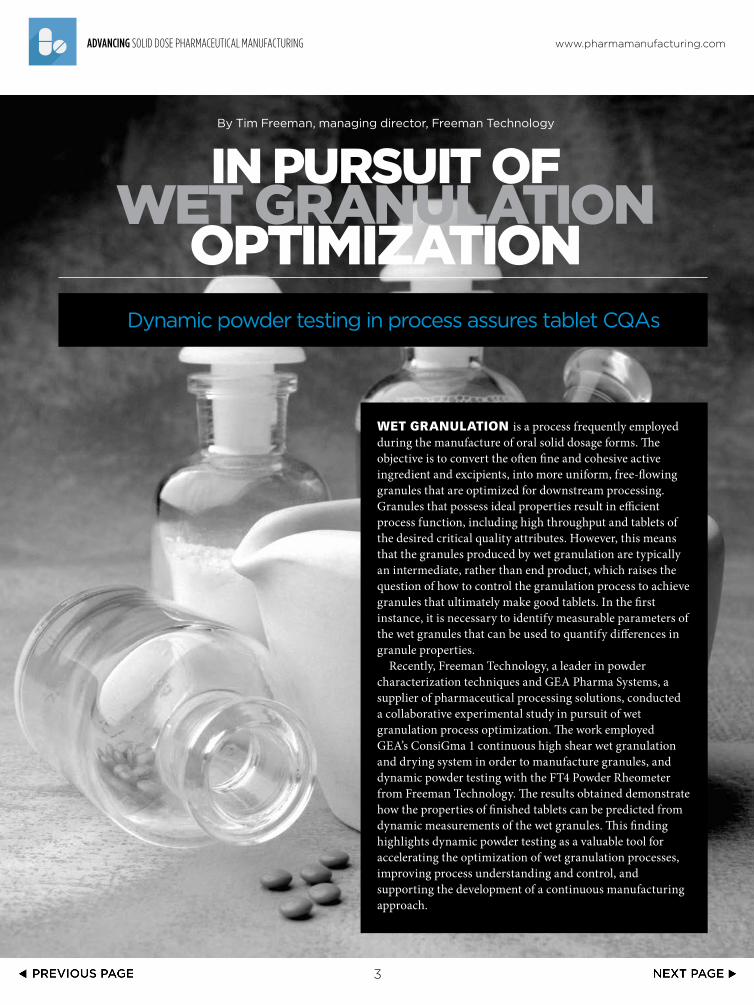
Wet granulation is a process frequently employed during the manufacture of oral solid dosage forms. The objective is to convert the often fine and cohesive active ingredient and excipients, into more uniform, free-flowing granules that are optimized for downstream processing. Granules that possess ideal properties result in efficient process function, including high throughput and tablets of the desired critical quality attributes. However, this means that the granules produced by wet granulation are typically an intermediate, rather than end product, which raises the question of how to control the granulation process to achieve granules that ultimately make good tablets. In the first instance, it is necessary to identify measurable parameters of the wet granules that can be used to quantify differences in granule properties.
Recently, Freeman Technology, a leader in powder characterization techniques and GEA Pharma Systems, a supplier of pharmaceutical processing solutions, conducted a collaborative experimental study in pursuit of wet granulation process optimization. The work employed GEA’s ConsiGma 1 continuous high shear wet granulation and drying system in order to manufacture granules, and dynamic powder testing with the FT4 Powder Rheometer from Freeman Technology. The results obtained demonstrate how the properties of finished tablets can be predicted from dynamic measurements of the wet granules. This finding highlights dynamic powder testing as a valuable tool for accelerating the optimization of wet granulation processes, improving process understanding and control, and supporting the development of a continuous manufacturing approach.
www.pharmamanufacturing.comADvAncing Solid doSe Pharmaceutical manufacturing

4
Figure 1: Basic schematic of the FT4 Powder Rheometer operation. Measuring the resistance the
blade (or impeller) experiences as it moves through the sample quantifies the bulk flow properties
of the granules or powder under test.
Table 1: Four different processing conditions used to make two distinct groups of granules.
Process Parameters Granule Properties
ConditionScrew Speed (rpm)
Powder Feed Rate
(kg/hr)
Liquid Feed Rate
(g/min)
Moisture (%)
BFE - Wet Mass (mJ)
BFE - Dry
Granules (mJ)
BFE -Milled
Granules (mJ)
BFE - Lubricated Granules
(mJ)
1 450 11.25 15.0 8.0 2217 1623 1283 1526
2 750 20.0 36.7 11.0 2133 1973 1463 1417
3 450 6.0 20.0 20.0 3172 4610 2268 1761
4 750 9.0 30.0 20.0 3342 4140 1951 1795
www.pharmamanufacturing.comADvAncing Solid doSe Pharmaceutical manufacturing
Wet granulationWet granulation is employed to en-hance the characteristics of a tableting blend such that the granules possess optimal properties for processing through a tablet press and into tablets with all the desired attributes. The aim is to produce homogeneous granules that enable high throughput on the press and result in tablets that have the target critical quality attri-butes, namely assay, weight, hardness and disintegration, for example.
During wet granulation, the active ingredient and excipient components of the blend are combined, along with water, to form granules with a homogeneous composition. These agglomerates, or granules, then undergo further processing —
drying, milling and lubrication — to produce an optimal feed material for the tablet press. The properties of the feed material can be controlled through manipulation of a number of processing parameters, including those at the granulation step, where water content, powder feed rate and screw speed are likely to be influential. By altering one or more of these variables, granule properties can be adjusted to ensure optimal performance in the tablet press.
However, to produce granules with specific properties, it is necessary to understand how those critical process parameters will have an impact on the properties of the granules. Equally important is to understand the correlation between
granule properties and the quality of the finished tablet. The experimental work described below shows how dynamic powder testing can be helpful in meeting these objectives.
ProCeSSing ParaMeterSThe Freeman Technology/GEA Pharma Systems study was designed to determine whether or not the dynamic flow properties of granules from a wet granulation process could be correlated with tablet hardness, a common critical quality attri-bute (CQA) of tablets. Trials were completed using a ConsiGma1, a lab-based version of GEA’s ConsiGma 25 continuous, high-shear granula-tion and drying concept. The system consists of a patented continuous high-shear granulator and dryer ca-pable of running samples from a few hundred grams up to 5kg or more. Research performed on the system allows for very efficient product and process development, with system residence times of less than 30 sec-onds. Characterization of the wet and dried granules produced using the ConsiGma1 was carried out using an FT4 Powder Rheometer (see Figure 1).
In the first stage of the experimental program, trials were undertaken to evaluate the properties of granules produced when the granulation conditions — water content, powder feed rate and granulator screw speed — were varied. Two model powder formulations, based on paracetamol (APAP) and dicalcium phosphate (DCP), were tested. Process parameters were systematically changed and the BFE of the resulting wet granules was measured. Figure 2 illustrates how the BFE of the APAP formulation granules produced at different screw speeds varies as a function of water content.
The data gathered for the APAP formulation show that increasing water content results in a higher BFE

5
Figure 3: The BFE of granules produced for the DCP formulation increases significantly as the feed
rate is reduced.
Figure 2: The BFE of granules produced for the APAP formulation increases with increasing water
content and decreasing screw speed.
www.pharmamanufacturing.comADvAncing Solid doSe Pharmaceutical manufacturing
if the screw speed is kept constant. Lower screw speeds also produce granules with a higher BFE, for com-parable water content. Both trends are to be expected since higher water content and lower screw speeds, which results in higher work input, tend to produce larger, denser, more adhesive granules that present rela-tively high resistance to blade move-ment. The data also indicate that at a water content of 11% and screw speed of 600 rpm, the granules produced have a very similar BFE to those generated using a screw speed of 450 rpm and a water content of 8%. This suggests that granules with similar properties can be produced under different operating conditions.
Figure 3 shows how, at a constant water content of 15% and a fixed screw speed of 600 rpm, the BFE of granules produced for the DCP formulation substantially increases as the dry powder feed rate to the granulator is reduced. Additional data show that granules with the same BFE can be made at lower water contents by reducing the feed rate. For example, granules with 15% water content produced at a feed rate of about 18kg/hr have similar properties to granules containing 25% water made at a feed rate of 25kg/hr. As with the studies on the APAP blend, these results show how granules that are identical in terms of a specific powder property can be produced from multiple combinations of processing conditions.
Table 1 shows the different process parameters used to manufacture two pairs of granules with different properties. Conditions 1 and 2 generated BFE values for the wet mass of approximately 2200mJ, while conditions 3 and 4 resulted in BFE values of around 3200mJ. The BFE of the granules was also measured after each of the following process steps. These include drying, milling and lubrication to improve processability,
where the flow additive in this study was magnesium stearate. Throughout these stages, the relative BFE values remain consistently grouped, with the BFE values of 3 and 4 consistently higher than 1 and 2.
Figure 4 plots the flow properties of the granules at each stage of the manufacturing process. Conditions
3 and 4 show an increase in BFE following drying, due to the granules’ large relative size, higher density and higher mechanical strength, compared to those manufactured under conditions 1 and 2. Following milling, particle sizes are more similar, although differences in granule density, shape and stiffness

6
Figure 4: BFE changes significantly during the different stages of granulation, but a distinct differ-
ence still exists between granule groups.
Figure 5: A strong correlation is found between the BFE of the granules and final tablet hardness.
www.pharmamanufacturing.comADvAncing Solid doSe Pharmaceutical manufacturing
still exist and rationalize the ob-served differences in BFE. These differences are retained following lu-brication with noticeable distinctions between conditions 1-2 and 3-4.
These results clearly show that it is possible to produce granules with specific flow properties, as measured by BFE, using a range
of different process conditions. Such work demonstrates how BFE values can be employed for product and process development of wet granulation operations. However, they also invite the question as to whether BFE values can be further utilized to predict in-press behavior and, importantly, whether BFE can
be related directly to a tablet critical quality attribute?
The four batches of wet granules were subject to drying, milling and lubrication before being run under identical settings on the tablet press. The hardness of the resulting tablets was then measured. Figure 5 shows how tablet hardness correlates with the f low properties of the granules at each stage.
The results show that BFE and tablet hardness are strongly correlated, with particularly good differentiation for the wet mass and dried granules. Correlations for the wet mass and lubricated granules are reasonable, although slightly weaker than those of the dried and milled granules. The poorer differentiation and correlation observed for the lubricated granules is attributed to the overwhelming effect of the magnesium stearate.
This data has shown that there is a direct relationship between the flow properties of the granules at each stage of manufacture — as characterized by BFE — and a critical quality attribute of the final tablet, in this case hardness. This means that once a specific BFE has been linked to optimal tablet hardness, it can be used to drive the optimization of a wet granulation process. These results suggest that, providing the wet granules attain the target BFE, the quality of the end tablet, as measured by hardness will be assured. This offers opportunities to streamline product and process development as well as providing a route to better process control during either batch or continuous granulation.
Today, the traditional batch process approach to manufacturing remains dominant, however, in the coming years many within the industry anticipate that continuous manufacture will be adopted for a substantial share of products.

7
VISIT US AT INTERPACK HALL 16 / B13
Fette Compacting America, Inc.400 Forge WayRockaway, N.J. 07866, USAPhone +1 973-586-8722Fax +1 973-586-0450
www.fetteamerica.com
1025-Fette-Pharma-mfg-7.875x10_5-efficiency-ad.indd 1 4/16/14 4:10 PM
www.pharmamanufacturing.comADvAncing Solid doSe Pharmaceutical manufacturing
8
Figure 1.
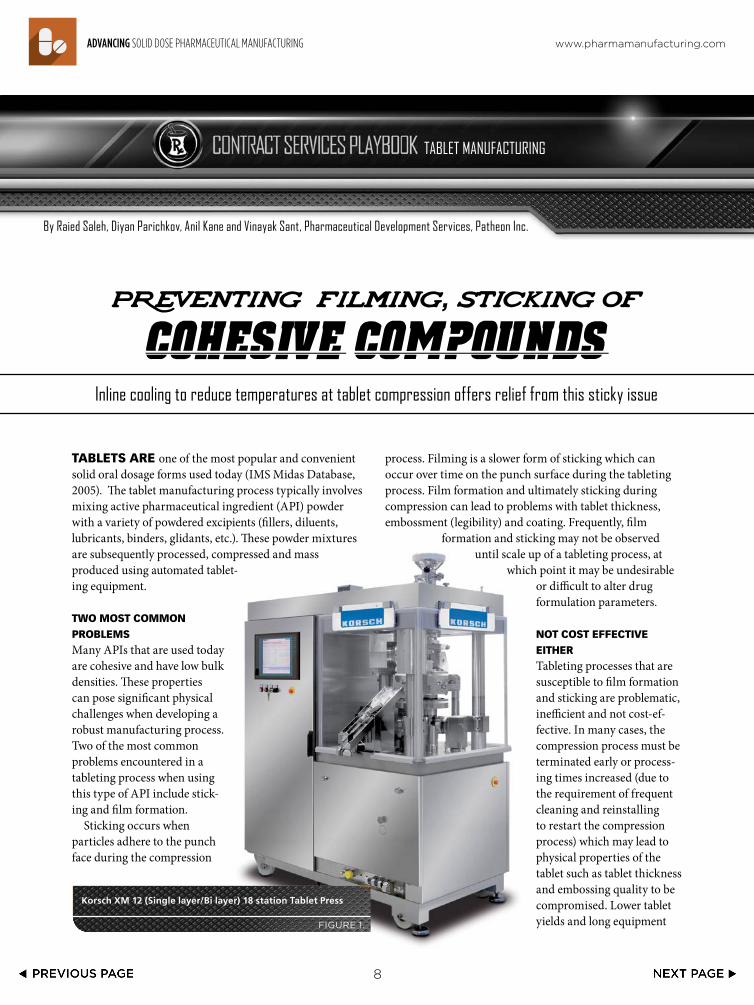
Korsch XM 12 (Single layer/Bi layer) 18 station Tablet Press
www.pharmamanufacturing.comADvAncing Solid doSe Pharmaceutical manufacturing
tabletS are one of the most popular and convenient solid oral dosage forms used today (IMS Midas Database, 2005). The tablet manufacturing process typically involves mixing active pharmaceutical ingredient (API) powder with a variety of powdered excipients (fillers, diluents, lubricants, binders, glidants, etc.). These powder mixtures are subsequently processed, compressed and mass produced using automated tablet-ing equipment. tWo MoSt CoMMon ProbleMSMany APIs that are used today are cohesive and have low bulk densities. These properties can pose significant physical challenges when developing a robust manufacturing process. Two of the most common problems encountered in a tableting process when using this type of API include stick-ing and film formation.
Sticking occurs when particles adhere to the punch face during the compression
process. Filming is a slower form of sticking which can occur over time on the punch surface during the tableting process. Film formation and ultimately sticking during compression can lead to problems with tablet thickness, embossment (legibility) and coating. Frequently, film
formation and sticking may not be observed until scale up of a tableting process, at
which point it may be undesirable or difficult to alter drug formulation parameters.
not CoSt eFFeCtiVe eitHerTableting processes that are susceptible to film formation and sticking are problematic, inefficient and not cost-ef-fective. In many cases, the compression process must be terminated early or process-ing times increased (due to the requirement of frequent cleaning and reinstalling to restart the compression process) which may lead to physical properties of the tablet such as tablet thickness and embossing quality to be compromised. Lower tablet yields and long equipment

Figure 2.
Vortex cooler internal air flow
Hot Air Vent
Hot Air Vent
Compressed Air
9
TAbleT MAnuFACTuring
Figure 3.
Vortex cooler
downtimes can substantially increase manufacturing costs and reduce product profit margins.
The goal of the current study was to develop methods to reduce the likelihood of film formation and sticking during compression using a highly cohesive, hydrophobic API in a tableting process. The use of Vortex coolers that reduced and controlled the temperature of tableting equipment during compression substantially reduced film formation and sticking, eliminated equipment downtime and improved tablet yields by 50% without impacting tablet properties/quality.
tableting MoDS Won’t PreVent itFilm formation and sticking can occur when excess moisture or under-lubrication occurs during compres-sion of a tableting mixture. Modification of a tableting process can sometimes reduce or eliminate film forma-tion or sticking during compression without making any drug formulation changes. To test this possibility, modifications including changes to pre-compression force, compression force and tableting turret dwell time/speed were implemented during tableting of a hy-drophobic API using a small scale rotary press (Korsch
XM 12 Single layer / Bilayer 18 station Tablet Press). Tableting was conducted at turret punch temperatures ranging from 25 degrees Celsius to 34 degrees Celsius.
Varying pre-compression (0.0KN- 2.0KN), compression forces (7.0KN-13KN), turret dwell time (0.10msec-0.30msec) and speed (800-1,200 tab/min) failed to eliminate or reduce film formation and sticking. An inspection of tablets produced from three separate batches revealed decreased tablet thickness and illegible embossments that resulted from film formation and sticking. In fact, each of the three batches had to be prematurely terminated (after 50% of the run) because of product filming and sticking on tableting tooling. In each case, tableting equipment had to be disassembled, cleaned, reassembled and compression restarted. About 1,500 tablets per punch were successfully compressed in each run prior to batch stoppages.
VorteX CoolerS: laboratorY SCaleIt is well established that hydrophobic interactions tend to strengthen as the temperature of a process increases. Interestingly, the tableting experiments described above were conducted using turret/punch tip temperatures ranging from 25 C to 34 C. This suggested that reducing the
www.pharmamanufacturing.comADvAncing Solid doSe Pharmaceutical manufacturing

10
100
80
60
40
20
0
Time Points (min)
Mea
n R
elea
se (
%)
Vortex Coolers Control
Figure 4.
Impact of Vortex Cooling During Compression on Tablet Dissolution
temperature at which compression is performed may help to reduce or eliminate film formation and stick-ing during tableting of hydrophobic drug mixtures.
The effect of lower temperatures on tablet compression was first assessed by lowering turret/punch tip temperature of a Korsch XM 12 Single layer/Bilayer 18 station Tablet Press (Figure 1) to 18 C to 20 C by using Vortex coolers (manufacturer details required) (Figures 3 and 4). Turret/punch tip temperatures were reduced to 18 C and maintained between 18 C to 20 C (monitored via an IR thermometer) during the four-hour tableting run.
www.pharmamanufacturing.comADvAncing Solid doSe Pharmaceutical manufacturing

11
Cooling of the turret/punch tips during tableting resulted in a 50% increase in tablet yield and a 100% batch completion rate. Moreover, tablet thickness was maintained at 4.56mm - 4.57mm and there were no embossing problems (embossments were fully legible according to Level II AQL testing requirements) or coating issues with tablets manufactured using the vortex-cooled, small-scale tableting machine. Finally, tableting at the lower temperatures eliminated film formation and sticking and allowed batch completion without any downtime.
CoMMerCial SCale uPThe successful application of Vortex coolers to a small-scale tableting pro-cess prompted additional experiments involving the device and a larger commercial scale tableting machine. Because of the larger size of commer-
cial presses as compared with small scale machines, it was necessary to add an additional vortex cooler to the Stokes D34 (34 station) Tablet Press to cool turret/punch tips to 18 C to 20 C during tableting runs.
Results from these experiments were consistent with those obtained during compression using the vortex-cooled small scale tableting press. Vortex cooling of the commercial press resulted in substantial increases in tablet throughput and batch completion without any equipment downtime. Likewise, tablet thickness and embossments were significantly improved as compared with tablets manufactured using non-vortex cooled tableting presses.
VorteX Cooling iMPaCtS tablet DiSSolutionWhile vortex cooling improved the compression process, it was pos-sible that compression cooling may have altered dissolution properties of the finished tablet. This was assessed by comparing the dissolu-tion rates of tablets manufactured without vortex cooling with those produced using vortex-cooled small scale or commercial tableting presses in standard tablet dissolu-tion tests. Dissolution rates were determined by the amount of API released from the tablet over time in aqueous solutions.
The results from these tests (Figure 4) showed that there were no significant differences in the dissolution properties (percent release) of tablets manufactured using either method.
Increasingly, many new molecule entities destined for solid dosage formulation are poorly soluble or hydrophobic and susceptible to filming and sticking during the tableting process. The results from
this study show that filming and sticking of a hydrophobic API during tableting can be overcome by the use of vortex coolers. The coolers offer a low cost and easily scalable option to improve tablet compression without the need for formulation changes prior to tableting.
Vortex coolers have the potential to be used to improve other manufacturing processes including automated encapsulation, roller compaction and hot melt extrusion in which film formation and sticking may be problems. Additional studies will be necessary to determine a role for vortex cooling in these processes.
References1. IMS Midas Database, 2005. IMS Health, CT, USA.2. Zheng, J. (2009). Formulation and ana-lytical development for low-dose oral drug products. Hoboken, N.J.: John Wiley & Sons
www.pharmamanufacturing.comADvAncing Solid doSe Pharmaceutical manufacturing

12
T H E W O R L D L E A D E R I N C L E A N A I R S O L U T I O N S
BETTER AIR IS OUR BUSINESS®www.aafintl.com
Air filtration is the key difference between success and failure in protecting your people and processes. Technological advancements in filtration media
now offer higher durability resulting in reduced contamination risk.
AIR FILTRATION
Your first line of defense
Cita Conf ad PharmaManuf.indd 1 3/5/14 1:54 PM
www.pharmamanufacturing.comADvAncing Solid doSe Pharmaceutical manufacturing www.pharmamanufacturing.comADvAncing Solid doSe Pharmaceutical manufacturing

Understanding Modified release
technologiesPAT-based analysis methodologies help see, qualify
and quantify subtle changes in dosage forms
By Emil W. Ciurczak, Contributing Editor
13
There are numerous mechanisms for delivering a drug to a patient. Whether tablets or capsules, sublingual solid doses or patches, injectables or suppositories, when it comes to drug delivery solutions, all may be modified for time of API release into the bloodstream. Among these, tablet-based dosage forms have particu-lar complexities which, depending on formulation, can grow exponentially — depending on the modified release (MR) strategy chosen to correctly adminis-ter the tablet’s therapeutic dose over time. Process analytical technologies (PAT), fortunately, can help drug makers better understand the choices they make and provide the data they need to better understand MR mechanisms relative to formulation and support a robust and effective QA/QC effort.
There are numerous definitions of MR. Modified release can be defined to mean any “un-natural” mechanisms used to change the bioavailability or rate of uptake of the API by a body. As a baseline, consider a mixture of API, excipients (bulking agents), lubricants and flow agents as the “natural” mode for tablets. That is, no chemical is added to modify the solubility of the API, in any manner.
When a dosage form is modified, it may be to either speed up or slow down the release from the matrix (all the non-active ingredients). The nearest analogy may be a military missile: a standard tablet may be seen as a ballistic artillery shell; the modified dosage form is a guided missile. A number of popular approaches will
be covered with suggested techniques that could be used (in a PAT program) to assure proper parameters.
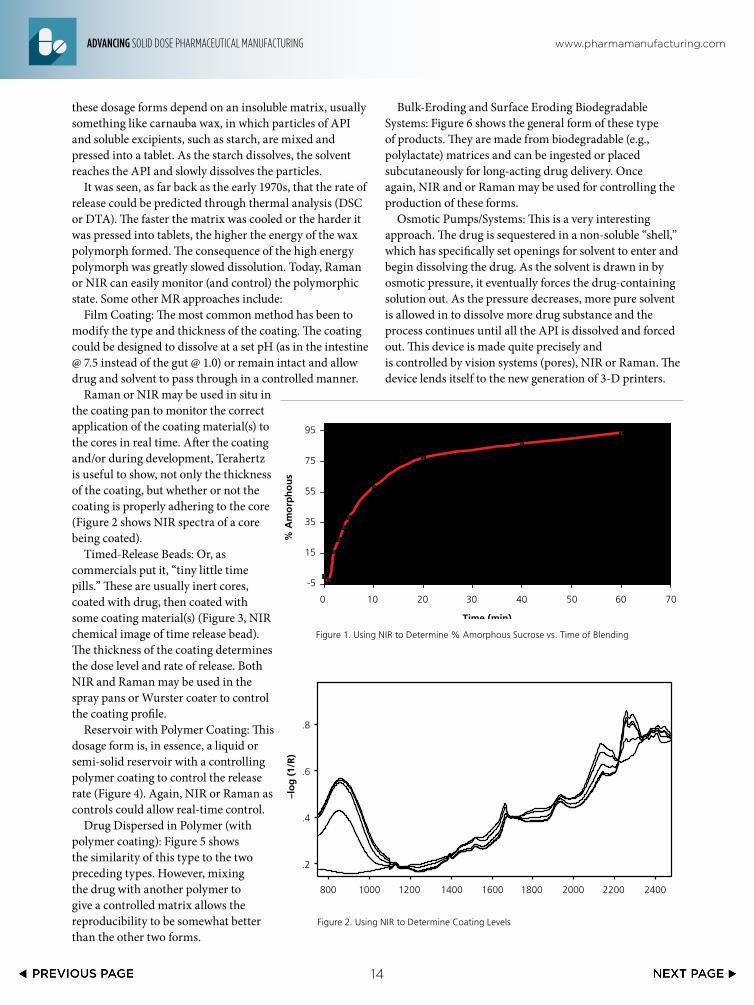
aCCelerateD aPi bioaVailabilitYA number of APIs are known to have low or slow solubility in vivo. Physical and chemical modifications to both the API and matrix may be made to speed up the transport to the drug to the blood. One common approach is to keep the API in an amorphous state to aid in its solubility (Figure 1 shows the % crystallin-ity, followed through a blending process). In this case, a Raman or NIR scan during the granulation and pressing of the tablet can assure that the API was not converted to a more crystalline form.
Another approach is to add a solubilizing material, such as a surfactant, disintegrant or both. Again, a simple NIR approach may be used: a mere reflection spectrum to assure rations or chemical imaging to show distribution of materials.
ControlleD releaSe (DelaYeD)A number of drugs are administered around the clock to maintain effective blood levels. In the “classic” ap-proach, a tablet or capsule may be administered three or four times a day. This assumes patient compliance and, while effective, blood level graphs may resemble a roller coaster ride. To assure more even blood levels, continuous release dosage forms have been developed.
Entero-Coated Tablets: available since the 1960s,
www.pharmamanufacturing.comADvAncing Solid doSe Pharmaceutical manufacturing
14
–lo
g (
1/R
)
Wavelength (nm)800 1000 1200 1400 1600 1800 2000 2200 2400
.8
.6
.4
.2
% A
mo
rph
ou
s
Time (min)
0 10 20 30 40 50 60 70
95
75
55
35
15
-5
Membrane
Drug Reservoir
Drug Dispersed in Polymer
Remaining Polymer “Ghost”
Time = t
Figure 1. Using NIR to Determine % Amorphous Sucrose vs. Time of Blending
–lo
g (
1/R
)
Wavelength (nm)800 1000 1200 1400 1600 1800 2000 2200 2400
.8
.6
.4
.2
% A
mo
rph
ou
s
Time (min)
0 10 20 30 40 50 60 70
95
75
55
35
15
-5
Membrane
Drug Reservoir
Drug Dispersed in Polymer
Remaining Polymer “Ghost”
Time = t
Figure 2. Using NIR to Determine Coating Levels
these dosage forms depend on an insoluble matrix, usually something like carnauba wax, in which particles of API and soluble excipients, such as starch, are mixed and pressed into a tablet. As the starch dissolves, the solvent reaches the API and slowly dissolves the particles.
It was seen, as far back as the early 1970s, that the rate of release could be predicted through thermal analysis (DSC or DTA). The faster the matrix was cooled or the harder it was pressed into tablets, the higher the energy of the wax polymorph formed. The consequence of the high energy polymorph was greatly slowed dissolution. Today, Raman or NIR can easily monitor (and control) the polymorphic state. Some other MR approaches include:
Film Coating: The most common method has been to modify the type and thickness of the coating. The coating could be designed to dissolve at a set pH (as in the intestine @ 7.5 instead of the gut @ 1.0) or remain intact and allow drug and solvent to pass through in a controlled manner.
Raman or NIR may be used in situ in the coating pan to monitor the correct application of the coating material(s) to the cores in real time. After the coating and/or during development, Terahertz is useful to show, not only the thickness of the coating, but whether or not the coating is properly adhering to the core (Figure 2 shows NIR spectra of a core being coated).
Timed-Release Beads: Or, as commercials put it, “tiny little time pills.” These are usually inert cores, coated with drug, then coated with some coating material(s) (Figure 3, NIR chemical image of time release bead). The thickness of the coating determines the dose level and rate of release. Both NIR and Raman may be used in the spray pans or Wurster coater to control the coating profile.
Reservoir with Polymer Coating: This dosage form is, in essence, a liquid or semi-solid reservoir with a controlling polymer coating to control the release rate (Figure 4). Again, NIR or Raman as controls could allow real-time control.
Drug Dispersed in Polymer (with polymer coating): Figure 5 shows the similarity of this type to the two preceding types. However, mixing the drug with another polymer to give a controlled matrix allows the reproducibility to be somewhat better than the other two forms.
Bulk-Eroding and Surface Eroding Biodegradable Systems: Figure 6 shows the general form of these type of products. They are made from biodegradable (e.g., polylactate) matrices and can be ingested or placed subcutaneously for long-acting drug delivery. Once again, NIR and or Raman may be used for controlling the production of these forms.
Osmotic Pumps/Systems: This is a very interesting approach. The drug is sequestered in a non-soluble “shell,” which has specifically set openings for solvent to enter and begin dissolving the drug. As the solvent is drawn in by osmotic pressure, it eventually forces the drug-containing solution out. As the pressure decreases, more pure solvent is allowed in to dissolve more drug substance and the process continues until all the API is dissolved and forced out. This device is made quite precisely and is controlled by vision systems (pores), NIR or Raman. The device lends itself to the new generation of 3-D printers.
www.pharmamanufacturing.comADvAncing Solid doSe Pharmaceutical manufacturing

15
Figure 4. Drug Reservoir MR Dosage Form
–lo
g (
1/R
)
Wavelength (nm)800 1000 1200 1400 1600 1800 2000 2200 2400
.8
.6
.4
.2
% A
mo
rph
ou
s
Time (min)
0 10 20 30 40 50 60 70
95
75
55
35
15
-5
Membrane
Drug Reservoir
Drug Dispersed in Polymer
Remaining Polymer “Ghost”
Time = t
Figure 5. A Drug-Polymer Core, surrounded
with a controlling polymer coating
–lo
g (
1/R
)
Wavelength (nm)800 1000 1200 1400 1600 1800 2000 2200 2400
.8
.6
.4
.2
% A
mo
rph
ou
s
Time (min)
0 10 20 30 40 50 60 70
95
75
55
35
15
-5
Membrane
Drug Reservoir
Drug Dispersed in Polymer
Remaining Polymer “Ghost”
Time = t
Figure 3. Cross-Sectional NIR Chemical Image
of Time-Release Bead
20 40 60 80 100 120 140 160
20
40
60
80
100
120
140
160
Pixels
Transdermal Devices: Sometimes referred to as “patches,” transdermal devices can be quite sophisticated. Figure 7 shows how a well-designed device looks in a cut-away picture. Of course, there are as many variables in skin as in gastric systems, so this device is often limited to drugs that could cause gastric distress or are poorly soluble in the gut and intestine.
MultiVariate CorrelationS oF iViVC anD online MeaSureMentSThe correlation of in vitro or lab results (usually dissolu-tion) with in vivo or clinical results needs to be dem-onstrated before an NDA or ANDA is approved by the appropriate Agency (FDA, EMA, etc.). When an appropri-ate dissolution method is approved for product release, then the company has a tool for both release and stability. However, since the dissolution method often takes between eight and 12 hours, it is hardly an appropriate method for a PAT or QbD program.
To perform in-process measurements (and modifications/corrections), a rapid and, preferably, non-destructive method needs to be found. What is needed is for the PAT group to find a method (i.e., near-infrared, Raman, light-induced fluorescence, terahertz) that will see, qualify and quantify subtle changes in dosage forms as they are produced. These (subtle) changes then need to be correlated with the approved release/stability methodology. To do this, multivariate algorithms, properly handled by a Chemometrican, need to be employed.
What must be done very, very carefully, is not to find a quick and easy correlation and assume it is appropriate. It is likely that this second-tier correlation will take far more samples from far more lots to assure both QA and the FDA (EMA, etc) that what we are reading is true.
These dosage forms are essential for many of the newer drug substances, yet, unless the manufacturing process is made better than the traditional four sigma approach to tablets, the costs will place them beyond most patients. The well-run QbD approach will make these clever, inventive products safe and effective.
!
(a)
(b)
Occlusive Backing
Drug Reservior
Contact Adhesive
Protective Liner
Rate-controllingMembrane
Figure 6. Bulk-Eroding (a) and Surface-
Eroding (b) Biodegradable Systems
!
(a)
(b)
Occlusive Backing
Drug Reservior
Contact Adhesive
Protective Liner
Rate-controllingMembrane
Figure 7. A Transdermal MR Device
www.pharmamanufacturing.comADvAncing Solid doSe Pharmaceutical manufacturing

16
tHe MeCHaniCal properties of tablets are im-portant because they are related to their therapeutic response. Tablets have to be hard enough for later process stages such as coating and storage. Mechanical failures can originate from the compaction process as well. Known as capping and lamination, these issues can cause tablets to break during coating and packing and cause serious problems during the manufacturing process.
Traditionally, the mechanical properties of tablets have been determined using destructive test methods such as diametrical and bending tests. However, it’s been reported that the diametrical test method has its own limitations, providing an estimation of the crushing force of tablets.1 Because tablet hardness and capping and lamination issues are related to the mechanical properties of tablets, ultrasound (a commonly used test method used to determine the mechanical properties of test samples in different kinds of non-destructive testing applications) may be a useful tool for the non-destructive evaluation of tablets.
Ultrasound is a mechanical wave with a frequency higher than 20 kHz. In a medium, ultrasound waves propagate at the speed of sound. Ultrasound is generated using a transducer that normally transmits a pulse with a finite length. In addition, the pulse has a nominal center frequency. An example of an ultrasound pulse and its frequency spectrum is shown in Figure 1. An ultrasound pulse is generated via the pulser/receiver unit and the waveform is acquired using an oscilloscope.
The speed of sound of the material under investigation is calculated using the thickness of the sample and a
time-of-flight value obtained simply by dividing the sample’s thickness measurement with the time-of-flight value. The time-of-flight value is determined from a measured ultrasound signal and the time that it takes for the wave to travel through a given medium. In this study, time-of-flight was determined using the maximum value of the transmitted ultrasound signal.2 The maximum value of the ultrasound signal is obtained using the pulse envelope calculated using the Hilbert transformation and the corresponding time instant is the time-of-flight value (Figure 1).
Figure 1. Transmitted ultrasound signal measured using a stainless steel
sample (left) and its frequency spectrum (right). The dashed line is the pulse
envelope and the vertical line correspond the time-of-flight value.
Time [�s]
DCP MCC
Tensile strength [MPa] Tensile strength [MPa]
Frequency [MHz]
Am
plitu
de [V
]SO
S [m
/s]
SOS
[m/s
]A
mpl
itude
[a.u
]
1
0.8
0.6
0.4
0.2
0
-0.2
-0.4
3000
2800
2600
2400
2200
2000
1800
1800
1750
1700
1650
1600
1550
1500
1450
0.01
0.005
0
-0.005
-0.01
0.01
0.005
0
-0.005
-0.01
1 1.5 2 2.5 3
1 2 3 4 5 6 4.5 5 5.5 6 6.5 7 7.5 8
2 4 6 8 10 12
120
100
80
60
40
20
0
Loadcell
T
R
Tablet
Frame
Pulser Receiver
Oscilloscope SyncSignal
r2=0.9949 r2=0.9972
INTACT DEFECT
Time [�s] Time [�s]
Frequency [MHz] Frequency [MHz]
Am
plitu
de [V
]
Am
plitu
de [a
.u]
Am
plitu
de [V
]
Am
plitu
de [a
.u]
8
6
4
2
0
8
6
4
2
0
x 10-4 x 10-4
DCP MCC
13
12
11
10
9
8
7
6
5
4
3
12
11
10
9
8
7
6
52 2.5 3 3.5 4 4.5 5 5.5 2 2.5 3 3.5 4 4.5 5 5.5
Frequency [MHz] Frequency [MHz]
Att
enua
tion
[dB/
mm
]
Att
enua
tion
[dB/
mm
]
2 4 6 8 10 12
2 4 6 8 10 2 4 6 8 10
2 4 6 8 10 12
defectintact
defectintact
8765432
15000
10000
5000
0
Time [ms]400 450 500 550 600
Time [ms]400 450 500 550 600
Thic
knes
s [m
m]
Spee
d of
Sou
nd [m
/s]3500
3000
2500
2000
1500
8765432
Time [ms]400 450 500 550 600
Thic
knes
s [m
m]
Spee
d of
Sou
nd [m
/s]3500
3000
2500
2000
1500
Forc
e [N
]
15000
10000
5000
0
Time [ms]400 450 500 550 600
Forc
e [N
]
Ultrasound can be a useful PAT tool for evaluating the tensile strength of tablets
By Simo-Pekka Simonaho, School of Pharmacy, University of Eastern Finland
www.pharmamanufacturing.comADvAncing Solid doSe Pharmaceutical manufacturing

17
www.pharmamanufacturing.com
During its propagation through a medium, the ultrasound wave will be subject to the energy loss caused by absorption and scattering. The attenuation coefficient is a measure of these losses.3 The ultrasound attenuation coefficient value tells how much the signal attenuates per length, and it is normally given in dB/cm. The frequency-dependent attenuation coefficient “a” is calculated using the equation3:
a(f) =
Where h is the thickness of a tablet, A is the frequency spectrum of the ultrasound signal measured from the tablet; Aref is the frequency spectrum of the ultrasound signal measured from the reference sample (stainless steel in this study). The frequency spectrum of a signal is calculated using the Fourier transformation. In addition, the thickness of the tablet is used in the calculation of the ultrasound attenuation.
tenSile StrengtH eValuationTwo commonly used pharmaceutical excipient powders, microcrystalline cellulose (MCC) Avicel PH101 and dibasic calcium phosphate dehydrate (DCP) were used to com-press tablets with only one ingredient. The powders were used as received. Before compaction, a helium pycnometer was used to measure the apparent particle density result-ing 1.5307 g/cm3 and 2.380 g/cm3 for MCC and DCP, respectively. Tablets were directly compressed using a compaction simulator with 10 mm, flat-faced punches. The compaction profile was a single-sided triangle for the upper punch and a stationary lower punch. Tablet weight was set at 350 mg for all the tablets, but five different compression force values were used to compress test samples to produce tablets with different tensile strengths. Each compression force value had 10 parallel samples, so for both excipients a total number of 50 tablets were produced.
The ultrasound measurements were made using a measurement set-up shown in Figure 2. The speed of sound was measured using a pair of 10-MHz contact ultrasound transducers. The tablet was placed between the transducers and a force of 12 N was applied to ensure proper acoustical coupling between the transducers and the tablet. The speed-of-sound values were calculated using the measured time-of-flight value and the thickness of the tablet. After the ultrasound measurements, the crushing force of the tablet F was determined using a mechanical tester and the tensile strength values were calculated using the equation4
a = 2F/(nDh)
where D and h are the diameter and the height of the tablet, respectively.
As shown in Table 1, the speed of sound increases with the tensile strength of tablets. Next, statistical tests were made to investigate the relationship between the speed of sound and tensile strength values. The speed of sound values were divided in five groups (see Table 1) and the statistical difference between the groups was tested using the Mann-Whitney U-test. As a result, all groups are statistically different from each other (p<0.05) for both MCC and DCP tablets. To visualize this relationship, the speed of sound is plotted as a function of the tensile strength (Figure 3). As shown in Figure 3, the speed of sound is linearly increasing with the tensile strength. The Figure 2. Measurement set up for the ultrasound measurements.
Figure 3. Speed of sound values as a function of the tensile strength of
DCP and MCC tablets in (a) and (b), respectively. The error bars show the
standard deviation and solid lines are the linear fits.
Time [�s]
DCP MCC
Tensile strength [MPa] Tensile strength [MPa]
Frequency [MHz]
Am
plitu
de [V
]SO
S [m
/s]
SOS
[m/s
]A
mpl
itude
[a.u
]
1
0.8
0.6
0.4
0.2
0
-0.2
-0.4
3000
2800
2600
2400
2200
2000
1800
1800
1750
1700
1650
1600
1550
1500
1450
0.01
0.005
0
-0.005
-0.01
0.01
0.005
0
-0.005
-0.01
1 1.5 2 2.5 3
1 2 3 4 5 6 4.5 5 5.5 6 6.5 7 7.5 8
2 4 6 8 10 12
120
100
80
60
40
20
0
Loadcell
T
R
TabletFram
e
Pulser Receiver
Oscilloscope SyncSignal
r2=0.9949 r2=0.9972
INTACT DEFECT
Time [�s] Time [�s]
Frequency [MHz] Frequency [MHz]
Am
plitu
de [V
]
Am
plitu
de [a
.u]
Am
plitu
de [V
]
Am
plitu
de [a
.u]
8
6
4
2
0
8
6
4
2
0
x 10-4 x 10-4
DCP MCC
13
12
11
10
9
8
7
6
5
4
3
12
11
10
9
8
7
6
52 2.5 3 3.5 4 4.5 5 5.5 2 2.5 3 3.5 4 4.5 5 5.5
Frequency [MHz] Frequency [MHz]
Att
enua
tion
[dB/
mm
]
Att
enua
tion
[dB/
mm
]
2 4 6 8 10 12
2 4 6 8 10 2 4 6 8 10
2 4 6 8 10 12
defectintact
defectintact
8765432
15000
10000
5000
0
Time [ms]400 450 500 550 600
Time [ms]400 450 500 550 600
Thic
knes
s [m
m]
Spee
d of
Sou
nd [m
/s]3500
3000
2500
2000
1500
8765432
Time [ms]400 450 500 550 600
Thic
knes
s [m
m]
Spee
d of
Sou
nd [m
/s]3500
3000
2500
2000
1500
Forc
e [N
]
15000
10000
5000
0
Time [ms]400 450 500 550 600
Forc
e [N
]Time [�s]
DCP MCC
Tensile strength [MPa] Tensile strength [MPa]
Frequency [MHz]
Am
plitu
de [V
]SO
S [m
/s]
SOS
[m/s
]A
mpl
itude
[a.u
]
1
0.8
0.6
0.4
0.2
0
-0.2
-0.4
3000
2800
2600
2400
2200
2000
1800
1800
1750
1700
1650
1600
1550
1500
1450
0.01
0.005
0
-0.005
-0.01
0.01
0.005
0
-0.005
-0.01
1 1.5 2 2.5 3
1 2 3 4 5 6 4.5 5 5.5 6 6.5 7 7.5 8
2 4 6 8 10 12
120
100
80
60
40
20
0
Loadcell
T
R
Tablet
Frame
Pulser Receiver
Oscilloscope SyncSignal
r2=0.9949 r2=0.9972
INTACT DEFECT
Time [�s] Time [�s]
Frequency [MHz] Frequency [MHz]
Am
plitu
de [V
]
Am
plitu
de [a
.u]
Am
plitu
de [V
]
Am
plitu
de [a
.u]
8
6
4
2
0
8
6
4
2
0
x 10-4 x 10-4
DCP MCC
13
12
11
10
9
8
7
6
5
4
3
12
11
10
9
8
7
6
52 2.5 3 3.5 4 4.5 5 5.5 2 2.5 3 3.5 4 4.5 5 5.5
Frequency [MHz] Frequency [MHz]
Att
enua
tion
[dB/
mm
]
Att
enua
tion
[dB/
mm
]
2 4 6 8 10 12
2 4 6 8 10 2 4 6 8 10
2 4 6 8 10 12
defectintact
defectintact
8765432
15000
10000
5000
0
Time [ms]400 450 500 550 600
Time [ms]400 450 500 550 600
Thic
knes
s [m
m]
Spee
d of
Sou
nd [m
/s]3500
3000
2500
2000
1500
8765432
Time [ms]400 450 500 550 600
Thic
knes
s [m
m]
Spee
d of
Sou
nd [m
/s]3500
3000
2500
2000
1500
Forc
e [N
]
15000
10000
5000
0
Time [ms]400 450 500 550 600
Forc
e [N
]
www.pharmamanufacturing.comADvAncing Solid doSe Pharmaceutical manufacturing
18
www.pharmamanufacturing.com
Porosity Weight [mg] Height [mm] Diameter [mm]Crushing force
[N]Tensile strength
[MPa]Speed of Sound
[m/s]
MCC
1 21.2±0.3 349.6±0.8 3.681±0.006 10.019±0.001 274.4±4.3 4.74±0.08 1483±16
2 18.6±0.3 350.2±0.3 3.573±0.013 10.014±0.002 311.4±5.3 5.54±0.11 1570±12
3 16.4±0.1 350.0±0.6 3.480±0.005 10.010±0.001 343.0±3.3 6.27±0.06 1640±15
4 14.4±0.1 350.6±0.5 3.405±0.005 10.008±0.001 378.7±5.3 7.08±0.10 1703±21
5 12.5±0.1 350.1±0.6 3.329±0.005 10.005±0.001 409.8±5.4 7.83±0.10 1784±14
DCP
1 20.8±0.2 351.1±0.3 2.331±0.009 10.068±0.010 55.8±4.1 1.51±0.12 1866±42
2 19.0±0.3 350.7±0.3 2.278±0.008 10.065±0.001 74.3±4.1 2.06±0.12 2062±28
3 17.5±0.4 350.2±1.1 2.232±0.010 10.067±0.001 95.6±7.3 2.71±0.21 2249±46
4 15.6±0.3 350.5±0.2 2.183±0.006 10.069±0.001 130.1±8.2 3.77±0.25 2494±40
5 13.1±0.2 350.7±0.2 2.121±0.004 10.071±0.001 172.6±11.7 5.15±0.34 2839±48
Table 1. Calculated porosities, dimensions (weight, height and diameter), crushing forces, tensile strength and speed of sound of tablets and
their standard deviations.
Compaction force [N] Porosity [%] Thickness [mm] Weight [mg]
MCC (intact) 30221±761 17.084±0.361 3.244±0.014 596.3±4.7
MCC (defect) 30327±1502 17.692±0.556 3.299±0.037 602.0±9.1
DCP (intact) 28186±1599 19.871±0.538 3.124±0.034 800.0±13.7
DCP (defect) 29621±291 20.365±0.149 3.169±0.010 806.9±3.1
Table 2. The mean values and standard deviations of compression force, porosity, thickness, and weigh of the MCC and DCP tablets.
www.pharmamanufacturing.comADvAncing Solid doSe Pharmaceutical manufacturing
calculation of the correlation coefficient between the speed of sound and tensile strength yielded the values of r2= 0.9972 and r2= 0.9949 for MCC and DCP, respectively.
However, the high tensile strength value does not indicate the high speed of sound value in general. This is seen when comparing the MCC and DCP groups. The DCP tablets have the higher speed of sound value than MCC tablets, but their tensile strength values are lower than that of MCC. This means that the speed of sound value is suitable for detecting changes in the tensile strength, not the absolute values.
tablet integritY teSt uSing ultraSounDThe same excipient powders as in the previous case are used in this case to compress tablets with only one ingredient. Now there are two set of tablets; one set consists of intact tablets and the other set has tablets with defects. The intact tablets were compressed using the compaction simulator with 13 mm punches (Table
2). The powder masses were 600 mg and 800 mg for MCC and DCP, respectively. The defective tablets were compressed as follows. First, half of the powder was poured into the die, and after that, a small piece of a parchment paper was carefully placed on the top of the powder bed. The size of the paper was 10 mm x 10 mm with the thickness of 92 µm. Next, the rest of the powder was poured over the paper to fill the die. This way, the size of a defect is the same in every defective tablet. The total number of the intact tablets was 6 and 10 for MCC and DCP, respectively, while the number of the defective tablets was 8 and 11 for MCC and DCP, respectively.
The ultrasound measurements were made using a pair of 10-mm instrumented punches with ultrasound transducers inside.
The instrumented punches were inserted in an eccentric single-station tablet press. Because tablet diameter was 13 mm, the die had to be removed before the measurements. The tablet was placed between the

19
www.pharmamanufacturing.com
Figure 5. Ultrasound attenuation values as a function of frequency for DCP and MCC tablets. The
error bars show the standard deviation.
Time [�s]
DCP MCC
Tensile strength [MPa] Tensile strength [MPa]
Frequency [MHz]
Am
plitu
de [V
]SO
S [m
/s]
SOS
[m/s
]A
mpl
itude
[a.u
]
1
0.8
0.6
0.4
0.2
0
-0.2
-0.4
3000
2800
2600
2400
2200
2000
1800
1800
1750
1700
1650
1600
1550
1500
1450
0.01
0.005
0
-0.005
-0.01
0.01
0.005
0
-0.005
-0.01
1 1.5 2 2.5 3
1 2 3 4 5 6 4.5 5 5.5 6 6.5 7 7.5 8
2 4 6 8 10 12
120
100
80
60
40
20
0
Loadcell
T
R
Tablet
Frame
Pulser Receiver
Oscilloscope SyncSignal
r2=0.9949 r2=0.9972
INTACT DEFECT
Time [�s] Time [�s]
Frequency [MHz] Frequency [MHz]
Am
plitu
de [V
]
Am
plitu
de [a
.u]
Am
plitu
de [V
]
Am
plitu
de [a
.u]
8
6
4
2
0
8
6
4
2
0
x 10-4 x 10-4
DCP MCC
13
12
11
10
9
8
7
6
5
4
3
12
11
10
9
8
7
6
52 2.5 3 3.5 4 4.5 5 5.5 2 2.5 3 3.5 4 4.5 5 5.5
Frequency [MHz] Frequency [MHz]
Att
enua
tion
[dB/
mm
]
Att
enua
tion
[dB/
mm
]
2 4 6 8 10 12
2 4 6 8 10 2 4 6 8 10
2 4 6 8 10 12
defectintact
defectintact
8765432
15000
10000
5000
0
Time [ms]400 450 500 550 600
Time [ms]400 450 500 550 600
Thic
knes
s [m
m]
Spee
d of
Sou
nd [m
/s]3500
3000
2500
2000
1500
8765432
Time [ms]400 450 500 550 600
Thic
knes
s [m
m]
Spee
d of
Sou
nd [m
/s]3500
3000
2500
2000
1500
Forc
e [N
]
15000
10000
5000
0
Time [ms]400 450 500 550 600
Forc
e [N
]
Figure 4. Measured ultrasound signals from an intact and a defective DCP tablet and their
frequency spectra.
Time [�s]
DCP MCC
Tensile strength [MPa] Tensile strength [MPa]
Frequency [MHz]
Am
plitu
de [V
]SO
S [m
/s]
SOS
[m/s
]A
mpl
itude
[a.u
]1
0.8
0.6
0.4
0.2
0
-0.2
-0.4
3000
2800
2600
2400
2200
2000
1800
1800
1750
1700
1650
1600
1550
1500
1450
0.01
0.005
0
-0.005
-0.01
0.01
0.005
0
-0.005
-0.01
1 1.5 2 2.5 3
1 2 3 4 5 6 4.5 5 5.5 6 6.5 7 7.5 8
2 4 6 8 10 12
120
100
80
60
40
20
0
Loadcell
T
R
Tablet
Frame
Pulser Receiver
Oscilloscope SyncSignal
r2=0.9949 r2=0.9972
INTACT DEFECT
Time [�s] Time [�s]
Frequency [MHz] Frequency [MHz]
Am
plitu
de [V
]
Am
plitu
de [a
.u]
Am
plitu
de [V
]
Am
plitu
de [a
.u]
8
6
4
2
0
8
6
4
2
0
x 10-4 x 10-4
DCP MCC
13
12
11
10
9
8
7
6
5
4
3
12
11
10
9
8
7
6
52 2.5 3 3.5 4 4.5 5 5.5 2 2.5 3 3.5 4 4.5 5 5.5
Frequency [MHz] Frequency [MHz]
Att
enua
tion
[dB/
mm
]
Att
enua
tion
[dB/
mm
]
2 4 6 8 10 12
2 4 6 8 10 2 4 6 8 10
2 4 6 8 10 12
defectintact
defectintact
8765432
15000
10000
5000
0
Time [ms]400 450 500 550 600
Time [ms]400 450 500 550 600
Thic
knes
s [m
m]
Spee
d of
Sou
nd [m
/s]3500
3000
2500
2000
1500
8765432
Time [ms]400 450 500 550 600
Thic
knes
s [m
m]
Spee
d of
Sou
nd [m
/s]3500
3000
2500
2000
1500
Forc
e [N
]
15000
10000
5000
0
Time [ms]400 450 500 550 600
Forc
e [N
]
The speed of sound increases with the compression force and it reaches the maximum value at the same time as the compression force.
www.pharmamanufacturing.comADvAncing Solid doSe Pharmaceutical manufacturing
instrumented punches and the force of 210 N was applied and the transmitted ultrasound signal was measured. An example of the mea-sured ultrasound signals and their frequency spectra for DCP tablets is shown in Figure 4.
The ultrasound attenuation was calculated using the equation1. In the case of defective tablets, the amplitude of the ultrasound signal is smaller than in the case of intact tablets. This means that ultrasound attenuates more in defective tablets than in intact tablets (Figure 5).
MeaSureMentS During CoMPreSSionA binary mixture of MCC and paracetamol (PRC) was prepared by mixing of MCC and 30% (w/w) of PRC with a mixer. Before mixing, the powder’s mass was weighed with an analytical balance. The mixing time was 10 minutes at 22 rpm after which the magnesium stearate (MS) was added in the mixture and mixed again for 2 minutes at 22 rpm. Then the mixture was poured in the feed shoe of the tablet press. Ten tablets were com-pacted with the eccentric single station press using two compression forces (7500 N and 14800 N) and 10-mm instrumented punches. Ultrasound measurements, synchronized with the compaction force and displacement measurements, were made during the compression at an interval of 8 ms.
During compression, the thickness of the powder bed and compression force on the upper and lower punches were measured. The speed of sound is calculated using the measured thickness. The speed of sound values as a function of time are shown together with the measured compression forces for the upper and lower punches in Figure 6.
The speed of sound increases with the compression force and it

20
www.pharmamanufacturing.com
Figure 6. Speed of sound as a function of the compression time (top) and compression forces of
the upper (solid lines) and the lower punches (dashed lines) (bottom). The blue lines show the
thickness of the powder bed during compression. The area between the red lines is the dwell time.
Time [�s]
DCP MCC
Tensile strength [MPa] Tensile strength [MPa]
Frequency [MHz]
Am
plitu
de [V
]SO
S [m
/s]
SOS
[m/s
]A
mpl
itude
[a.u
]
1
0.8
0.6
0.4
0.2
0
-0.2
-0.4
3000
2800
2600
2400
2200
2000
1800
1800
1750
1700
1650
1600
1550
1500
1450
0.01
0.005
0
-0.005
-0.01
0.01
0.005
0
-0.005
-0.01
1 1.5 2 2.5 3
1 2 3 4 5 6 4.5 5 5.5 6 6.5 7 7.5 8
2 4 6 8 10 12
120
100
80
60
40
20
0
Loadcell
T
R
Tablet
Frame
Pulser Receiver
Oscilloscope SyncSignal
r2=0.9949 r2=0.9972
INTACT DEFECT
Time [�s] Time [�s]
Frequency [MHz] Frequency [MHz]
Am
plitu
de [V
]
Am
plitu
de [a
.u]
Am
plitu
de [V
]
Am
plitu
de [a
.u]
8
6
4
2
0
8
6
4
2
0
x 10-4 x 10-4
DCP MCC
13
12
11
10
9
8
7
6
5
4
3
12
11
10
9
8
7
6
52 2.5 3 3.5 4 4.5 5 5.5 2 2.5 3 3.5 4 4.5 5 5.5
Frequency [MHz] Frequency [MHz]
Att
enua
tion
[dB/
mm
]
Att
enua
tion
[dB/
mm
]
2 4 6 8 10 12
2 4 6 8 10 2 4 6 8 10
2 4 6 8 10 12
defectintact
defectintact
8765432
15000
10000
5000
0
Time [ms]400 450 500 550 600
Time [ms]400 450 500 550 600
Thic
knes
s [m
m]
Spee
d of
Sou
nd [m
/s]3500
3000
2500
2000
1500
8765432
Time [ms]400 450 500 550 600
Thic
knes
s [m
m]
Spee
d of
Sou
nd [m
/s]3500
3000
2500
2000
1500
Forc
e [N
]
15000
10000
5000
0
Time [ms]400 450 500 550 600
Forc
e [N
]
With the aid of punches, speed of sound values can be calculated as a function of the compression
time during the tablet compression.
www.pharmamanufacturing.comADvAncing Solid doSe Pharmaceutical manufacturing
reaches the maximum value at the same time as the compression force (Figure 6). After that the speed of sound value decreases until the con-tact between the tablet and punches is lost. The change of the speed of sound value during the dwell time (Figure 6), the time when the punches are immobile, means that the mechanical properties of the tablet changes and this continues until the signal is lost. It was observed that the force of 3000 N is needed to get a proper ultra-sound signal through the powder bed. The end point of the ultrasound measurement was found to be when the upper punch has moved about 0.1 mm up to the minimum value. This means that the time window for ultrasound measurements is between 440-590 ms. Of course, this will de-pend on the tablet press and the ma-terials used. The measurement time window and interval are adjustable, making the measurement system flexible and suitable for monitoring the different phases of the compres-sion process.
Ultrasound was found to be sensitive to changes in the mechanical properties of tablets. The speed of sound value correlates with the tensile strength value of tested tablets. Thus, ultrasound might be used as a non-destructive test method for evaluating possible changes in the tensile strength. Artificial defects inside tablets increased the ultrasound attenuation value compared with the intact ones. Defective and intact tablets can be classified using the measured ultrasound value. Ultrasound measurements can be made during compression by implementing ultrasound transducers inside the upper and lower punches. With the aid of these punches, the speed of sound values can be calculated as a
function of the compression time during the tablet compression.
Author’s Note:Part of this article was published in 20105 and 20116 in the International Journal of Pharmaceutics.
reFerenCeS1 Morisseau, K.M., Rhodes, C.T., 1997. Near-
infrared spectroscopy as a non-destructive alternative to conventional tablet hardness testing. Pharm. Res. 14, 108-111.
2 Ragozzino, M., 1981. Analysis of the error in measurement of ultrasound speed in tissue due to waveform deformation by frequency-dependent attenuation. Ultrasonics 19, 135–138.
3 Cobbold, R.S.C, 2007. Foundations of Biomedical Ultrasound, Oxford Univer-sity Press, New York. Chapter 1.8 pp. 69-87
4 Fell, J.T., Newton, J.M., 1970. Determina-tion of tablet strength by the diametrical compression test, J. Pharm. Sci. 59, 688-691.
5 Leskinen, J.T.T., Simonaho, S.-P., Haku-
linen, M., Ketolainen, J., 2010. In-line ul-trasound measurement system for detecting tablet integrity, Int. J. Pharm. 400, 104-113.
6 Simonaho S.-P., Takala T.A., Kuosmanen M., Ketolainen J., 2011. Ultrasound transmission measurements for tensile strength evaluation of tablets, Int. J. Pharm. 409, 104-110.
equiPMentUltrasound pulser-receiver unit: 5077PR, Olympus- NDT Inc., Waltham, MAOscilloscope: LeCroy Wavesurfer 42Xs-A (LeCroy Corp., NYHelium pycnometer: MVP-1: Quantachrome, Syosset, NYCompaction simulator: PCS-1 Puuman Oy, Kuopio, FinlandContact ultrasound transducers: Olympus model V112Mechanical tester: CT-5, Engineering sys-tems, Nottingham, UKSingle-station tablet press: EK-0, Korsch AG, BerlinAnalytical balance: A200S, Sartorius, Goettingen, Germany

21
ContaineD DuSt collection equipment is used in pharmaceutical facilities for a variety of reasons, from en-vironmental compliance and employee health and safety to preventing cross-contamination of materials in multi-product manufacturing facilities. Given these concerns, and the fact that many pharmaceutical dusts are potent and/or hazardous, contained dust collection systems are found in the majority of pharmaceutical processing facilities today. Such systems typically use safe-change containment for both the filter cartridges (bag-in/bag-out) and the discharge system underneath the collector (continuous liner technology).
Following are five important tips for designing and selecting a contained dust collection system — pointers that should give pharmaceutical professionals a general overview of the process to make sure all their bases are covered when approaching dust collection system design.
1) Conduct a risk assessment to identify and prioritize goals. The dust collector must often satisfy many masters with varied agendas. The NFPA is concerned with explo-sion protection; the FDA with delivering safe products to consumers; OSHA with indoor environmental and safety issues; and the EPA with outdoor air quality. Pharma-ceutical facility managers are tasked with satisfying all these entities while also meeting internal goals of product quality, operational efficiency and cost control.
great eXPeCtationSWhat are the expectations for the dust collection system? A risk assessment is needed to help identify safety and performance goals for the dust collector and how to achieve them. It is best to involve a professional engineer who can commission appropriate explosibility and bench testing to determine other properties and characteristics of the dust, as well as surrogate testing as appropriate to determine appropriate system design.
2) Consider surrogate testing. Used as part of the risk as-sessment, surrogate testing can provide useful performance information prior to installation to help determine if the planned dust collection system will meet environmental and safety goals. Surrogate testing involves the use of a substitute or surrogate compound to simulate an API and predict real-world performance. Test conditions should mimic work-place operations as closely as possible without incurring the expense or health concerns of handling the API.
In a typical test, the surrogate dust is fed to the collection system on a pre-determined schedule. Operators equipped with air sampling devices perform bag-in/bag-out filter change-outs and contained discharge system clean-outs under conditions that simulate shift-equivalent operations. A combination of air, surface wipe and personal samples are taken at specified intervals during the test period to evaluate performance.
www.pharmamanufacturing.comADvAncing Solid doSe Pharmaceutical manufacturing

22
If samples are found to be below established thresholds, the manufacturer will accept the surrogate test as evidence that the contained dust collection system as designed can be expected to provide the required level of emission control performance under real-world operating conditions. By validating equipment performance during the engineering phases, it is thereby possible to reduce costs while ensuring proper equipment design and selection.
3) Incorporate a Risk-MaPP ap-proach to cross-contamination control. Cross-contamination is a major concern that can result in a facility shutdown by the FDA. For multi-product facilities concerned with preventing this occurrence, Risk-MaPP (Risk-Based Manufacture of Pharmaceutical Products) provides a useful guide to managing risk. In-troduced in 2010, this ISPE baseline guide provides a scientific approach to managing cross-contamination in new and renovated facilities that are tasked with complying with FDA requirements. One of the main goals of Risk-MaPP is to achieve a balance between product quality, operator safety and manufacturing costs.
There are several ways that cross-contamination occurs. These include airborne transfer, the airborne migration of particulate contaminants from one manufacturing space to another; and mechanical transfer, which occurs when particulate is carried from one processing area to another on the shoes or clothing of operators and/or via equipment that is operated in more than one location. A contained dust collector can address both problems by capturing airborne particles while simultaneously minimizing the
build-up of surface dust that can be transferred mechanically from one place to another.
How does a facility ensure that Product A is not contaminating Product B? Sampling is critical and should include both surface sampling and airborne concentrations. Surrogate testing and sampling are addressed in section 2 above, but with a focus on environment, health and safety. When we look at cross-contamination testing, the methodology is similar but the end goal is product quality rather than operator safety. It is important not to confuse the two: i.e., be cautious about using industrial hygiene data for cross-contamination purposes. The two goals are different, and the quality thresholds of one program may be more — or less — strict than the other.
Surrogate testing can help with quality control programs by providing real-world test results to the FDA that indicate how the planned engineering controls will be expected to perform. Testing and sampling can also help pharmaceutical manufacturers to identify the most cost-efficient equipment for a given application. Some engineering controls relating to dust collection can add significant cost to a project. There is a balancing act between what will work and what will be economically feasible, and a scientific test-based approach will be far more accurate than guesswork in striking the right balance.
4. Determine if there is a combus-tible dust issue and what types of explosion protection technologies to apply. The first step in this process
A pharmaceutical dust collection system equipped with passive and active controls. The Ventex
valve on the outlet of the collector is a passive control that prevents a deflagration from traveling
back into the facility. The active controls include a chemical suppression system mounted on the
dust collector and a chemical isolation system mounted on the inlet duct. Triggered by a pressure/
flame detector, it will extinguish a deflagration inside the dust collector and prevent a flame front
passing through the inlet pipe before it goes back into the plant. An active mechanical isolation
device (shown at the far left) can be used in lieu of the chemical isolation option.
www.pharmamanufacturing.comADvAncing Solid doSe Pharmaceutical manufacturing

23
is to determine whether the process dust is combustible. It is important to know that under the latest NFPA standards, any dust above 0 Kst is now considered to be explosive, and the majority of pharmaceutical dusts fall into this category. The only way to be sure is to commission explo-sion testing available from many commercial test laboratories. If an initial basic test on the dust sample is positive, then the explosive index (Kst) and the maximum pressure rise (Pmax) of the dust should be determined by ASTM E 1226-12a, Standard Test Method for Explosibil-ity of Dust Clouds.
A dust collection equipment supplier experienced in combustible dust issues can use these values to apply the relevant NFPA standards and to correctly select and size explosion protection equipment. The relevant standards for pharmaceutical professionals include NFPA 654 — Standard for the Prevention of Fire and Dust Explosions from the Manufacturing, Processing and Handling of Combustible Particulate Solids; NFPA 68 — Standard on Explosion Protection by Deflagration Venting; and NFPA 69 — Standard on Explosion Prevention Systems.
The devices and systems used for compliance fall into two general categories: passive and active. The goal of a passive system is to control an explosion to keep operators safe and minimize equipment damage. One of the most cost-effective — and therefore widely used — passive devices is the explosion vent, which is designed to open when predetermined pressures are reached inside the collector.
An active system, by contrast, actually prevents an explosion from occurring. It may be the system of choice if the collector is located inside the manufacturing facility or
Operators perform a bag-in/bag-out (BIBO) filter change designed to simulate real-world operating
conditions.
DuSt ColleCtor Filter total CoSt oF oWnerSHiPSAMPle DATA ColleCTIon WorKSHeeT
How many days will the system operate per year? 355 days
How many hours will the system operate per day? 24 hours
What is the volume of air required to operate the system? 3,500 cfm
How much does a kilowatt-hour cost? $0.26 per kWh
What is the cost of no production for one hour? $0
What is the cost of Filter A? $80
What is the expected service life of Filter A? 4 months
What is the cost of Filter B? $80
What is the expected service life of Filter B? 8 months
How many filter cartridges are in the dust collector? 16
What is the shipping cost per filter? $20
What is the labor and overhead rate for one hour? $80
How much does it cost to dispose of a filter? $20
How much does a variable frequency drive (VFD) cost? $2,600
What is the current interest rate? 4.5%
How many hours would you like to analyze? 8,064 hours
Will there be a VFD operating the system? Yes
A Total Cost of Ownership (TCO) worksheet can be used to compare the costs of operating a dust
collector with different filter types to determine which filter is best for the application.
www.pharmamanufacturing.comADvAncing Solid doSe Pharmaceutical manufacturing

24
This system is designed
for cost-efficient installation:
Contained dust collectors, explosion
protection devices, fans, controls, ductwork
and other components are pre-assembled on a
single skid for ease of shipping and installation.
www.pharmamanufacturing.comADvAncing Solid doSe Pharmaceutical manufacturing
if the unit is collecting hazardous or potent material that cannot be released directly to the outside environment. An active system involves much more costly technology and typically requires recertification every three months.
One example is a chemical isolation system, which can be installed in inlet and/or outlet ducting. It reacts within milliseconds of detecting an explosion, creating a chemical barrier that suppresses the explosion within the ducting. A chemical suppression system is similar in concept, except it is designed to protect the dust collector itself as opposed to the ducting. Sometimes used in tandem with isolation, a chemical suppression system detects an explosion hazard and releases a chemical agent to extinguish the flame before an explosion can occur.
5. Consider the functional acceptability of the equipment. Even if it’s determined that a dust collection system will meet applicable emis-sion and combustible dust standards, it is still not a good choice if it performs unreliably or if it is prohibitively costly to install, operate and maintain. So the final step in the selection process is to make sure the system is designed for optimum functionality. A thorough implementation review should include seeking answers to the following questions:
Where will the dust collector be located? If possible, locate the dust collector either outdoors or in an indoor maintenance or mechanical area adjacent to the Good Manufacturing Practice (GMP) space. Either way, you will need to establish the best overall installation scheme and the best way to run ducting to the outdoor location or adjacent room, taking explosion isolation devices into consideration as required.
If it is necessary to locate the dust collector within the GMP space, compliance with FDA requirements will impose tight controls on the collector as with all equipment within the processing area. If a combustible dust is involved, chemical suppression and isolation will usually be the default technologies, and these are typically the most costly methods for explosion protection.
Is it designed for energy-efficient performance? This will depend on a variety of factors, including the sizing of the equipment, air-to-cloth ratio and type of filters used. Also, the use of a variable frequency drive (VFD) can help control dust collector fan speed. This electrical control method is highly efficient in maintaining desired airf low/static pressure, while greatly decreasing energy consumption.
What will be the Total Cost of Ownership (TCO)? Though the initial cost of the
system is important to know, lifecycle cost (also known as TCO) is far more significant. There are three main components of TCO: energy, consumables and maintenance and disposal. Your equipment supplier should be able to generate a worksheet
that predicts the TCO over time for the proposed dust collection system. This mathematical calculation can be used to compare the cost of two or three different filter types to determine which one is best for the application. For example, a premium filter may carry a higher initial cost but will save money over time through longer service life, reduced change-out and disposal costs, and lower average pressure drop resulting in reduced energy consumption.
about tHe autHorDavid Steil is pharmaceutical market manager at Camfil Air Pollution Control (APC), where his responsibili-ties include global sales and marketing to the pharma-ceutical/nutraceutical industries. He previously spent 12 years with a major pharmaceutical company in the corporate Environment, Health and Safety group. Steil is a member of the International Society for Pharmaceu-tical Engineering (ISPE) and the American Industrial Hygiene Association (AIHA).


![Encyclopedia of Pharmaceutical Technology - mcc … Granulation/Wet Granulation - End-Point... · Encyclopedia of Pharmaceutical Technology ... Probe vibration analysis[21,22] requires](https://img.pdfslide.net/doc/110x75/5ab6d1b07f8b9a156d8e3299/encyclopedia-of-pharmaceutical-technology-mcc-granulationwet-granulation.jpg)