Embed Size (px)
Citation preview
Preventive Medicine 49 (2009) 129–132
Contents lists available at ScienceDirect
Preventive Medicine
j ourna l homepage: www.e lsev ie r.com/ locate /ypmed
Advancing the hypothesis that geographic variations in risk factors contributerelatively little to observed geographic variations in heart disease andstroke mortality
George Howard a,⁎, Mary Cushman b, Ronald J. Prineas c, Virginia J. Howard d, Claudia S. Moy e,Lisa M. Sullivan f, Ralph B. D'Agostino Sr. e, Leslie A. McClure a, LeaVonne Pulley g, Monika M. Safford h
a Department of Biostatistics, School of Public Health, University of Alabama at Birmingham, Birmingham, AL, USAb Department of Medicine, University of Vermont College of Medicine, Burlington, VT, USAc Division of Public Health Sciences, Wake Forest University School of Medicine, Winston Salem, NC, USAd Department of Epidemiology, School of Public Health, University of Alabama at Birmingham, Birmingham, AL, USAe National Institute of Neurological Disorders and Stroke, National Institutes of Health, Bethesda, MD, USAf Department of Biostatistics and the Framingham Study, Boston, MA, USAg Department of Health Behavior, University of Arkansas Health Science University, Little Rock, AK, USAh Deep South Center on Effectiveness at the Birmingham VA Medical Center and the Division of Preventive Medicine, Department of Medicine University of Alabama at Birmingham,Birmingham, AL, USA
Abbreviations: AL, Alabama; AR, Arkansas; BRFSS, Blance System; CDC, Centers for Disease Control and Predisease; ECG, Electrocardiogram; FCRS, Framingham corFSRS, Framingham stroke risk score; GA, Georgia; LInfarction; MS, Mississippi; NC, North Carolina; NHANESExamination Surveys; REGARDS, REasons for GeograpStroke; SC, South Carolina; TIA, Transient ischemic attac⁎ Corresponding author. Department of Biostatistics,
University Blvd, University of Alabama at Birmingham, BE-mail address: [email protected] (G. Howard).
0091-7435/$ – see front matter © 2009 Elsevier Inc. Aldoi:10.1016/j.ypmed.2009.03.004
a b s t r a c t
a r t i c l e i n f oAvailable online 11 March 2009
Keywords:StrokeCoronary heart diseaseGeographyRisk factorsMortality
Purpose. Geographic variation in risk factors may underlie geographic disparities in coronary heartdisease (CHD) and stroke mortality.
Methods. Framingham CHD Risk Score (FCRS) and Stroke Risk Score (FSRS) were calculated for 25,770stroke-free and 22,247 CHD-free participants from the REasons for Geographic And Racial Differences inStroke cohort. Vital statistics provided age-adjusted CHD and stroke mortality rates. In an ecologic analysis,the age-adjusted, race–sex weighted, average state-level risk factor levels were compared to state-levelmortality rates.
Results. There was no relationship between CHD and stroke mortality rates (r=0.04; p=0.78), but therewas between CHD and stroke risk scores at the individual (r=0.68; pb0.0001) and state (r=0.64,pb0.0001) level. There was a stronger (pb0.0001) association between state-level FCRS and state-level CHDmortality (r=0.28, p=0.18), than between FSRS and stroke mortality (r=0.12, p=0.56).
Conclusions.Weak associations between CHD and stroke mortality and strong associations between CHDand stroke risk scores suggest that geographic variation in risk factors may not underlie geographic variationsin stroke and CHD mortality. The relationship between risk factor scores and mortality was stronger for CHDthan stroke.
© 2009 Elsevier Inc. All rights reserved.
Introduction
There is a substantial geographic variation in heart disease andstroke mortality, with higher stroke mortality in the Southeastern US(the “Stroke Belt”) (Lanska, 1993; Howard et al., 1995) and higher
ehavioral Risk Factor Surveil-vention; CHD, Coronary heartonary heart disease risk score;A, Louisiana; MI, Myocardial, National Health and Nutritionhic And Racial Differences ink; TN, Tennessee.School of Public Health, 1665irmingham, AL, USA.
l rights reserved.
coronary heart disease (CHD) mortality along the Ohio–MississippiRiver Basin (the “Coronary Valley”) (Pickle et al., 1999). Of thenumerous hypothesized reasons for these geographic variations instroke and CHD mortality (Howard, 1999; Perry and Roccella, 1998),the most obvious are geographic variations in the contributing riskfactors. While some have accepted this “risk factor hypothesis” as thecause for the geographic disparities in mortality, there are scant dataexamining this association.
Several publications have addressed the “risk factor hypothesis” ofthe geographic variation in stroke mortality using data from theNational Health and Nutrition Examination Surveys (NHANES).NHANES was primarily designed to provide national estimates, butcan also provide important information describing differencesbetween regions (Centers for Disease Control, 2004). Some reportssuggest that there may be a higher prevalence of hypertension, the

Table 1Components risk factors included in the calculation of the Framingham Risk Scores forstroke and coronary heart disease.
Risk factor FSRSa FCRSb
Age X XSex X XHx of heart disease XSystolic blood pressure X XDiastolic blood pressure XUse of anti-hypertensive medications XDiabetes X XCurrent cigarette smoking X XAtrial fibrillation XLeft ventricular hypertrophy XTotal cholesterol XHDL cholesterol X
a Framingham Stroke Risk Score — excludes individuals with history of stroke.b Framingham Coronary Heart Disease Score — excludes individuals with history of
CHD.
Table 2REGARDS sample size for 25 states with at least 15 participants in each race–sex group,with a total sample size of 28,534 (includes both those with stroke and CHD, who weresubsequently deleted in the calculations of the FCRS and FSRS).
All Black females Black males White females White males
Alabama 1639 505 287 463 384Arkansas 794 158 89 261 286California 2337 733 376 642 586Florida 1060 225 181 305 349Georgia 3038 838 498 931 771Illinois 854 332 224 128 170Indiana 325 80 62 91 92Kentucky 229 44 31 72 82Louisiana 2143 618 367 573 585Maryland 619 183 167 98 171Massachusetts 219 29 19 75 96Michigan 1063 392 272 187 212Mississippi 1216 319 190 341 366Missouri 449 123 86 98 142New Jersey 232 67 46 57 62New York 891 312 197 181 201North Carolina 3437 730 382 1250 1075Ohio 1106 335 245 244 282Oklahoma 172 40 24 47 61Pennsylvania 624 179 108 150 187South Carolina 3186 665 324 1217 980Tennessee 1289 277 157 443 412Texas 847 257 178 172 240Virginia 430 95 84 105 146Wisconsin 335 54 44 113 124
130 G. Howard et al. / Preventive Medicine 49 (2009) 129–132
most potent stroke risk factor, in the southeastern US for some race–sex strata (Obisesan et al., 2000; Hall et al., 1997; Jones et al., 1999),supporting the hypothesis that geographic variation in hypertensionmay contribute to the geographic variation in stroke mortality.
Under the “risk factor hypothesis,” states with a higher averagecardiovascular risk factor profile should have a higher cardiovasculardisease mortality. Heart disease and stroke are diseases that sharemost, but not all, risk factors. Therefore, a significant correlationshould exist between the average CHD and stroke risk factor burdenacross states; that should in turn underlie a high correlation betweenCHD and stroke mortality.
In this paper we assess the “risk factor hypothesis” by: 1)describing the agreement between heart disease and stroke mortalityat the state level, 2) examining the agreement between heart diseaseand stroke risk factor scores at the state level using data from theREasons for Geographic And Racial Differences in Stroke (REGARDS)study, and 3) assessing the association of the geographic variation instate-level average risk factor scores and the geographic variation instate-level heart disease and stroke mortality rates.
Methods
State-level stroke (ICD-10 codes I60–I69) and ischemic heart disease (ICDcodes I20–I25) age-adjusted (2000 US standard population) mortality ratesfor the population over age 45 for years 2003–2005 (inclusive) werecalculated using the vital statistics assessed through the CDC Wonder System(CDC, 2008).
Risk factor data were from the REGARDS study, a national community-based longitudinal cohort study of 30,228 black and white individuals overage 45 years, recruited between January 2003 and October 2007. Twentypercent of the sample was selected from the “buckle” of the Stroke Belt(coastal plain region of NC, SC and GA), 30% from the Stroke Belt states(remainder of NC, SC, and GA, plus AL, MS, TN, AR, and LA), and theremaining 50% from other 40 contiguous states. Participants were recruitedusing a combination of mail and telephone contact, and medical and riskfactor history was obtained by computer-assisted telephone interview.Physical measures were subsequently collected at an in-home examinationincluding blood pressure, blood and urine samples, and electrocardiogram.Although not employed in the current report, participants were followed bytelephone at six-month intervals for surveillance of incident stroke andcoronary heart disease. Study methods were reviewed and approved by theInstitutional Review Boards at the collaborating institutions. Additionalmethodological details are provided elsewhere (Howard et al., 2005).
As of March 2008, data were available on 30,198 study participants. TheFramingham Stroke Risk Score (FSRS) (Wolf et al., 1991; D'Agostino et al.,1994) and the Framingham Coronary Heart Disease Risk Score (FCRS)(D'Agostino et al., 2001; Wilson et al., 1998) were calculated as summaryindices of the risk factor profile for stroke and CHD respectively. The FSRSestimates the probability of stroke during the next 10-year period and isdefined only for stroke-free individuals (not calculated for 1920 participantswith self-reported stroke, and 101 participants unsure of previous stroke). Of
the remaining 27,982 participants, 2212 (7.9%) were excluded as they hadmissing data on one or more of the factors included in the FSRS (see Table 1),providing FSRS scores for 25,770 participants. The FCRS, which estimates the10-year risk of incident CHD, is defined only for CHD-free individuals (notcalculated for 6,14 participants who have a history of CHD defined as self-reported myocardial infarction, or MI by ECG, or a previous coronary arteryby-pass, or a previous coronary angioplasty or stent). Of the remaining 23,289participants, an additional 1042 (4.5%) were excluded as they had missingdata on one or more of the FCRS components (see Table 1), providing FCRSscores for 22,247 participants. The relationship between the FCRS and theFSRS was calculated among 20,254 individuals for whom both scores could becalculated.
The state-level stroke and CHD mortality rates are age-adjusted, butreflect the distribution of race and sex represented in each state. Therefore,we calculated the average FSRS and FCRS adjusting for age and weighting therace–sex strata to achieve proportionate representation by race and sex forcomparison to published mortality rates. Twenty-five states with at least 15REGARDS participants in each race–sex group (black females — BF, blackmales — BM, white females — WF, and white males — WM) were included inthe analysis. These select states had a total of at least 172 REGARDSparticipants (see Table 2), a sample size that provides an estimated standarderror of mean Framingham scores of 0.76. Linear regression was used toproduce an age-adjusted average risk factor score for each race–sex stratumfor each state (i.e., least squares means). Then the average FSRS and FCRSwere calculated for each state as a weighted average of the four age-adjustedmeans for each race–sex stratum, where weights were proportional to thestate population in each of the four race–sex strata.
The result of these calculations were four measures, state-level measuresof mortality for both CHD and stroke, and state-level, age-adjusted, race–sexweighted measures of risk factor levels as assessed by the FSRS and FCRS. It isreasonable to assess the relationships between these four measures since,both for both mortality and average risk factor levels, the relative ranking ofthe states is remarkably stable over time. For example, despite changes fromICD-9 to ICD-10 coding, the Spearman correlation of state stroke mortalityrates in 2003–2005 (used in this report) with rates a decade earlier (1993–1995) is 0.84 (pb0.0001), and the correlation with rates two decades earlier(1983–1985) is 0.85 (pb0.0001). Likewise, the Spearman correlation ofischemic heart disease mortality rates in 2003–2005 (used in this report)with rates a decade earlier was 0.76 (pb0.0001), and with rates two decadesearlier was 0.49 (p=0.0003). Hence, despite changes in ICD coding that couldhave a larger impact on heart disease rates than stroke, those states with highrates in the current report have been consistent over time. Because risk factor
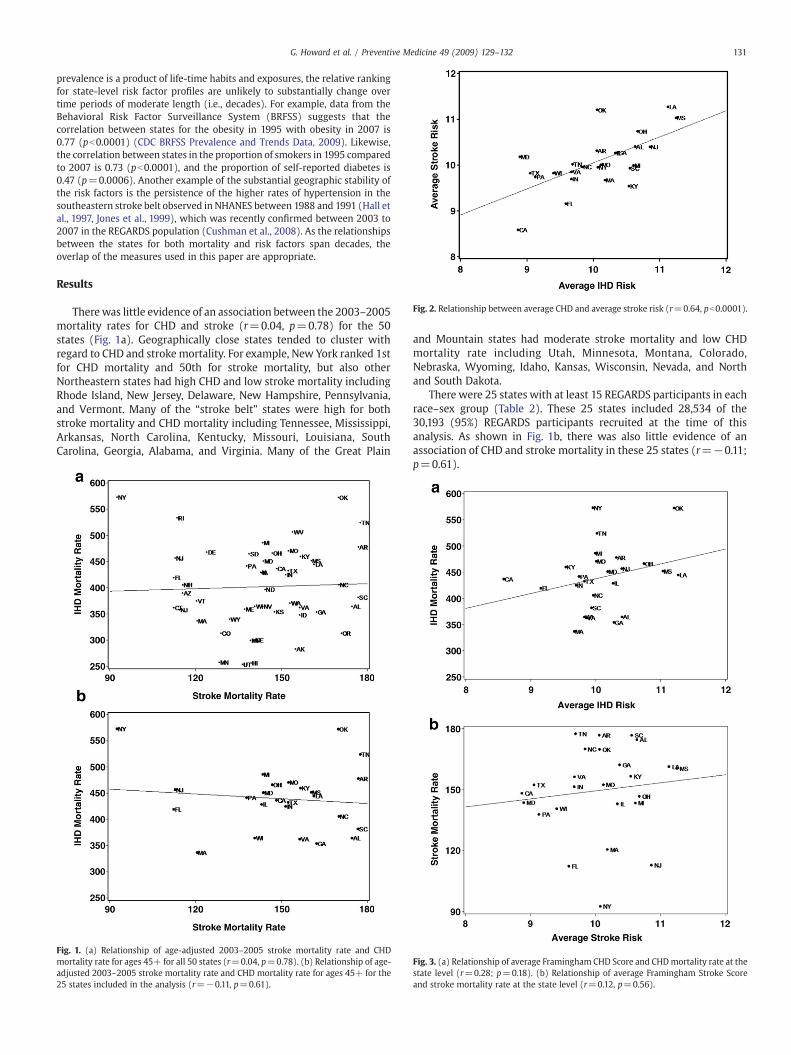
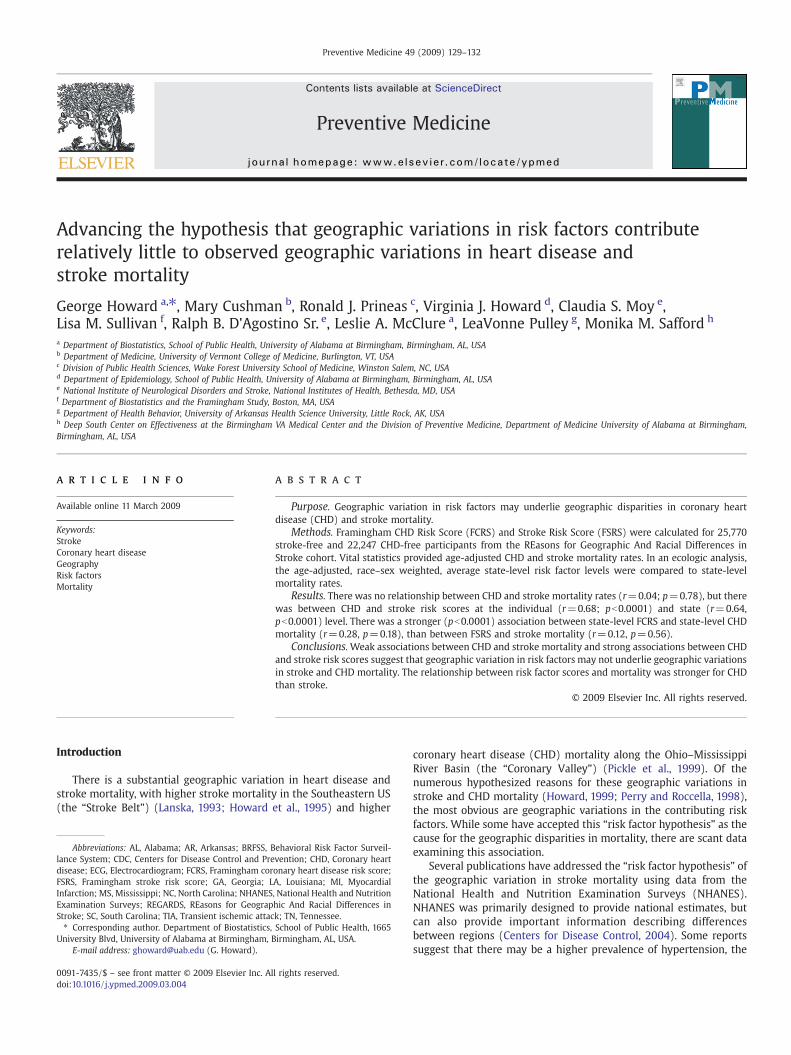
Fig. 2. Relationship between average CHD and average stroke risk (r=0.64, pb0.0001).
131G. Howard et al. / Preventive Medicine 49 (2009) 129–132
prevalence is a product of life-time habits and exposures, the relative rankingfor state-level risk factor profiles are unlikely to substantially change overtime periods of moderate length (i.e., decades). For example, data from theBehavioral Risk Factor Surveillance System (BRFSS) suggests that thecorrelation between states for the obesity in 1995 with obesity in 2007 is0.77 (pb0.0001) (CDC BRFSS Prevalence and Trends Data, 2009). Likewise,the correlation between states in the proportion of smokers in 1995 comparedto 2007 is 0.73 (pb0.0001), and the proportion of self-reported diabetes is0.47 (p=0.0006). Another example of the substantial geographic stability ofthe risk factors is the persistence of the higher rates of hypertension in thesoutheastern stroke belt observed in NHANES between 1988 and 1991 (Hall etal., 1997, Jones et al., 1999), which was recently confirmed between 2003 to2007 in the REGARDS population (Cushman et al., 2008). As the relationshipsbetween the states for both mortality and risk factors span decades, theoverlap of the measures used in this paper are appropriate.
Results
Therewas little evidence of an association between the 2003–2005mortality rates for CHD and stroke (r=0.04, p=0.78) for the 50states (Fig. 1a). Geographically close states tended to cluster withregard to CHD and stroke mortality. For example, New York ranked 1stfor CHD mortality and 50th for stroke mortality, but also otherNortheastern states had high CHD and low stroke mortality includingRhode Island, New Jersey, Delaware, New Hampshire, Pennsylvania,and Vermont. Many of the “stroke belt” states were high for bothstroke mortality and CHD mortality including Tennessee, Mississippi,Arkansas, North Carolina, Kentucky, Missouri, Louisiana, SouthCarolina, Georgia, Alabama, and Virginia. Many of the Great Plain
Fig. 1. (a) Relationship of age-adjusted 2003–2005 stroke mortality rate and CHDmortality rate for ages 45+ for all 50 states (r=0.04, p=0.78). (b) Relationship of age-adjusted 2003–2005 stroke mortality rate and CHD mortality rate for ages 45+ for the25 states included in the analysis (r=−0.11, p=0.61).
and Mountain states had moderate stroke mortality and low CHDmortality rate including Utah, Minnesota, Montana, Colorado,Nebraska, Wyoming, Idaho, Kansas, Wisconsin, Nevada, and Northand South Dakota.
There were 25 states with at least 15 REGARDS participants in eachrace–sex group (Table 2). These 25 states included 28,534 of the30,193 (95%) REGARDS participants recruited at the time of thisanalysis. As shown in Fig. 1b, there was also little evidence of anassociation of CHD and stroke mortality in these 25 states (r=−0.11;p=0.61).
Fig. 3. (a) Relationship of average Framingham CHD Score and CHDmortality rate at thestate level (r=0.28; p=0.18). (b) Relationship of average Framingham Stroke Scoreand stroke mortality rate at the state level (r=0.12, p=0.56).

132 G. Howard et al. / Preventive Medicine 49 (2009) 129–132
There was a substantial correlation of FCRS and the FSRS amongREGARDS participants, where after normalization of distributions bytaking the log of each score, the correlation of the two scores was 0.68(pb0.0001); hence, in general individuals at high risk for stroke werealso at high risk of CHD. After age adjustment and race–sex weighting,the correlation between state-level average FCRS and FSRS wassubstantial (Fig. 2; r=0.64; pb0.0001).
The association between state-level age-adjusted and race–sexweighted average risk scores and the state-level mortality rate for the25 included states are shown for CHD in Fig. 3a and for stroke in Fig. 3b.For CHD, the correlation between state-level average FCRS and state-levelmortalitywasmoderate, but not statistically significant (r=0.28;p=0.18), while the association between the state-level average FSRSand the state-level stroke mortality was somewhat less (r=0.12;p=0.56). The difference between the correlation between CHD riskand mortality as compared to stroke risk and mortality was estimatedby bootstrap methods (1000 replications) to be 0.142±0.007, with73% of replications having a larger correlation for CHD than for stroke,indicating that the correlation between risk and mortality rates wassignificantly (pb0.0001) larger for CHD than for stroke.
Discussion
These data suggest that it is likely that the “risk factor hypothesis”explains only a modest amount of the geographic variation in heartdiseasemortality, and a smaller portion of the geographic variation forstrokemortality. It is surprising that there was no association betweenthe state-level CHD and stroke mortality rates, especially given thestrong association between individual and state-level CHD and strokerisk factor levels. These findings suggest that it is unlikely thatgeographic variations in average level of risk factors are the primarycontributor to geographic variation in both heart disease and strokemortality.
We observed a moderate association between the state-levelvariation in CHD risk score and CHD mortality, but a weakerassociation between stroke risk score and stroke mortality. Hence, itseems more likely that geographic variation in traditional CHD riskfactors underlie geographic variation in CHD mortality, and thatgeographic variation in traditional stroke risk factors play a smallerrole in the geographic variation in stroke mortality.
There could be many alternative explanations for the lack ofassociation between state-level stroke risk factor levels and strokemortality; however, while a wealth of alternative hypotheses havebeen proposed (including differences in gene frequencies, novel riskfactors, infection rates, socioeconomic status, lifestyle choices such asdiet or exercise, case fatality rates, differential cause of mortalityfollowing an initial stroke or CHD event) (Howard, 1999; Perry et al.,1998), there is a dearth of data to assess these hypotheses. REGARDS isamong the currently funded studies working to provide these data,and further insights are forthcoming.
There are several strengths and weaknesses of these analyses.REGARDS offers a large sample of community-dwelling residents overage 45, an age that places them at risk for stroke and heart disease.REGARDS has a sample size approximately three times larger thanNHANES III for this age range. However, unlike NHANES, REGARDSincludes only African American and white participants, so it cannotassess questions for other race–ethnic strata. In addition, theFramingham Risk Scores (both CHD and stroke) were developed inlargely white populations in the Northeast, and our analyses are basedon the assumption that these risk functions are appropriate in AfricanAmericans and residents of other regions. As proposed by theFramingham study, the FSRS is calculated only for those individualswho are stroke-free, while the FCRS is calculated only for thoseindividuals who are free of CHD. It is possible that the stroke or CHDrisk function with these individuals included could show a strongerrelationship with mortality. Importantly, we are correlating the risk
score data with the state-level mortality rates, and we cannot be surethat those individuals at high risk for CHD and stroke are the sameindividuals who die of CHD and stroke; that is, assuming causation inthis ecologic analysis is problematic. NHANES also has clearadvantages over REGARDS in the establishment of sample weightsthat allow more precise and unbiased estimates of the prevalence ofrisk factors at the national level. Finally, it is possible that the strongerrelationship between CHD risk and mortality (as compared to theassociation between stroke risk and mortality) could be because of apotential higher predictive performance in the CHD risk assessment.We are unaware of any analyses that assess the relative predictiveperformance of these two indices.
Our current data suggest that differences in established risk factorsare more likely to underlie the geographic variations in CHDmortalitythan stroke mortality. Lack of association between stroke and CHDmortality at the state level is surprising, particularly given thesubstantial observed association between stroke and CHD risk scoresboth in individuals and at the state level. This pattern supports theconclusion: it is unlikely that differences in risk factors underlie boththe geographic variations in CHD and stroke mortality. There is acontinuing need to assess alternative causes for geographic variationin stroke mortality.
Conflict of interest statementThe authors declare that there are no conflicts of interest.
Acknowledgments
The research reported in this article was supported by cooperativeagreement NS 041588 from the National Institute of NeurologicalDisorders and Stroke.
References
Centers for Disease Control, National Health and Nutrition Examination Survey(NHANES) 1999–2002. http://www.cdc.gov/nchs/nhanes.htm 2004.
Centers for Disease Control. CDC BRFSS Prevalance and Trends Data, Source: http://apps.nccd.cdc.gov/BRFSS/index.asp. Retrieved February 2009.
CDC Wonder System, http://wonder.cdc.gov/mortSQL.html. Retrieved June 2008.Cushman, M., Cantrell, R.A., McClure, L.A., et al., 2008. Estimated 10-year stroke risk by
region and race in the United States. Ann. Neurol. 4, 507–513.D'Agostino, R.B., Wolf, P.A., Belanger, A.J., Kannel, W.B., 1994. Stroke risk profile:
adjustment for antihypertensive medication. The Framingham Study. Stroke 25 (1),40–43.
D'Agostino, S., Grundy, S., Sullivan, L.M., Wilson, P., for the CHD Risk Prediction Group,2001. Validation of the Framingham coronary heart disease prediction scores:results of a multiple ethnic groups investigation. JAMA 286 (2), 180–187.
Hall, W.D., Ferraro, C.M., Moore, M.A., Roccella, M.A., et al., 1997. Roccella EJ.Hypertension-related morbidity and mortality in the Southeastern United States.Am. J. Med. Sci. 313, 195–209.
Howard, G., 1999. Why do we have a stroke belt in the Southeastern United States? Areview of unlikely and uninvestigated potential causes. Am. J. Med. Sci. 317,160–167.
Howard, G., Evans, G.W., Pearce, K., et al., 1995. Is the stroke belt disappearing? Ananalysis of racial, temporal and age effects. Stroke 26, 1153–1158.
Howard, V.J., Cushman M Pulley, L.V., Gomez, C.R., et al., 2005. The REasons forGeographic and Racial Differences in Stroke (REGARDS) Study: objectives anddesign. Neuroepidemiology 25, 135–143.
Jones, D., Basile, J., Cushman, W., et al., 1999. Managing hypertension in theSoutheastern United States: applying the guidelines from the Sixth Report of theJoint National Committee on Prevention, Detection, Evaluation and Treatment ofHigh Blood Pressure (JNC VI). Am. J. Med. Sci. 318, 357–364.
Lanska, D.J., 1993. Geographic distribution of stroke mortality in the United States:1939–1941 to 1979 to 1981. Neurology 43, 1839–1851.
Obisesan, T.O., Vargas, C.M., Gillum, R.F., 2000. Geographic variation in stroke risk in theUnited States. Region, urbanization, and hypertension in the Third National Healthand Nutrition Examination Survey. Stroke 31, 19–25.
Perry, H.M., Roccella, E.J., 1998. Conference report on stroke mortality in theSoutheastern United States. Hypertension 31, 1206–1215.
Pickle, L.W., Gillum, R.F., 1999. Geographic variation in cardiovascular disease mortalityin US blacks and whites. J. Nat. Med. Ass. 91, 545–556.
Wilson, P.W.F., D'Agostino, R.B., Levy, D., Belanger, A.M., Silbershatz, H., Kannel, W.B.,1998. Prediction of coronary heart disease using risk factor categories. Circulation97 (18), 1837–1847.
Wolf, P.A., D'Agostino, R.B., Belanger, A.J., Kannel, W.B., 1991. Probability of stroke: a riskprofile from the Framingham Study. Stroke 22 (3), 312–318.