Embed Size (px)
Citation preview
ADVANCING THE RAIL INDUSTRY

ADVANCING THE RAIL INDUSTRY
• Tony Carney - National Sector Manager Rail• Industry Capability Network – ICN• ICN rail directory• Rail Industry – today’s focus

Rail Industry Development StrategyBruce Griffiths, Rail Supplier AdvocateIndustry BriefingsBrisbane 28 May; Sydney 29 May; Melbourne 30 May
Role of Rail Supplier Advocate
• Appointed in November 2009 by the Australian Government.
• Provide leadership and coordination to improve industry competitiveness and maximise opportunities for Australian rail suppliers.
• Build on existing industry and government programs such as Industry Capability Network, Enterprise Connect and Austrade.
Rail Industry Development Strategy• Pursuing activities that build a long term strategy for a
sustainable and prosperous future for the Australian Rail Industry.
• An action program of 7 key projects to address challenges, drive competitiveness and maximise opportunities.
• There is no silver bullet. The matrix of activities are interdependent and need to be driven concurrently.
• I am leading these initiatives to facilitate a coordinated industry approach, to maximise current and future industry support.
• Important to demonstrate industry’s leadership and collaboration.

Industry Development Strategy – 7 key platforms:• Supplier Continuous Improvement Program
• Rail Industry Roadmap
• Forecasting domestic demand for passenger rolling stock
• Harmonisation of rolling stock specifications
• Rail statistics project
• Promoting capability and business matching
• Increasing international business opportunities

Rail Industry Briefing May 28‐30, 2012 –
Brisbane, Sydney, Melbourne
Tom Wood ANU Edge
[email protected] +61 2 6125 8134
Rail Industry Briefing May 28‐30, 2012 –
Brisbane, Sydney, Melbourne
Tom Wood ANU Edge
[email protected] +61 2 6125 8134
0
VISION
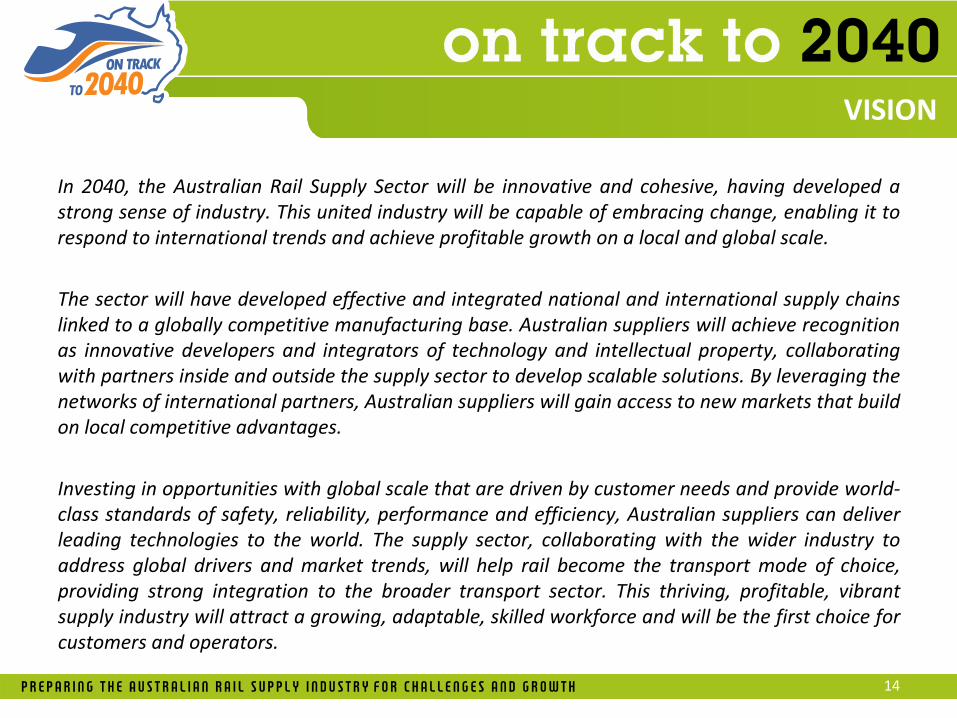
In 2040, the Australian Rail Supply Sector will be innovative and cohesive, having developed a
strong sense of industry. This united industry will be capable of embracing change, enabling it to
respond to international trends and achieve profitable growth on a local and global scale.
1

OUTLINE
• Rationale – Global Trends• What is Roadmapping?
– Collaboration– Industry Participation
• Outcomes:– 3 Technological Priority Areas
• 18 Priority Opportunities– 6 Enabling Action Areas
• 22 Recommendations
• What Next?
2

GLOBAL TRENDS
3

PREPARING for CHALLENGES & GROWTH
4

PROCESS
5

Current Short Medium Long
WHAT is a ROADMAP?
6
WHERE DO WE WANT TO BE?
WHERE ARE WENOW?
HOW DO WEGET THERE?
Technologies &CapabilitiesTechnologies &Capabilities
Trends & DriversTrends & Drivers
OpportunitiesOpportunities
What external factors influence the Australian rail industry and how are these evolving?What external factors influence the Australian rail industry and how are these evolving?
What domestic and international opportunities do these trends and drivers present? What domestic and international opportunities do these trends and drivers present? VISIONVISION
Enabling ActionsEnabling Actions What’s being done?What’s being done?
What additional capability and technology needs to be developed? What are the gaps and barriers that will prevent opportunities from being realised?
What additional capability and technology needs to be developed? What are the gaps and barriers that will prevent opportunities from being realised?
How can gaps and barriers be addressed to achieve opportunities?How can gaps and barriers be addressed to achieve opportunities?
What competitive advantages can the industry exploit to help realise these opportunities?
What competitive advantages can the industry exploit to help realise these opportunities?
2012 2020 2030 2040+

PEOPLE | PENS | POST‐ITs
7
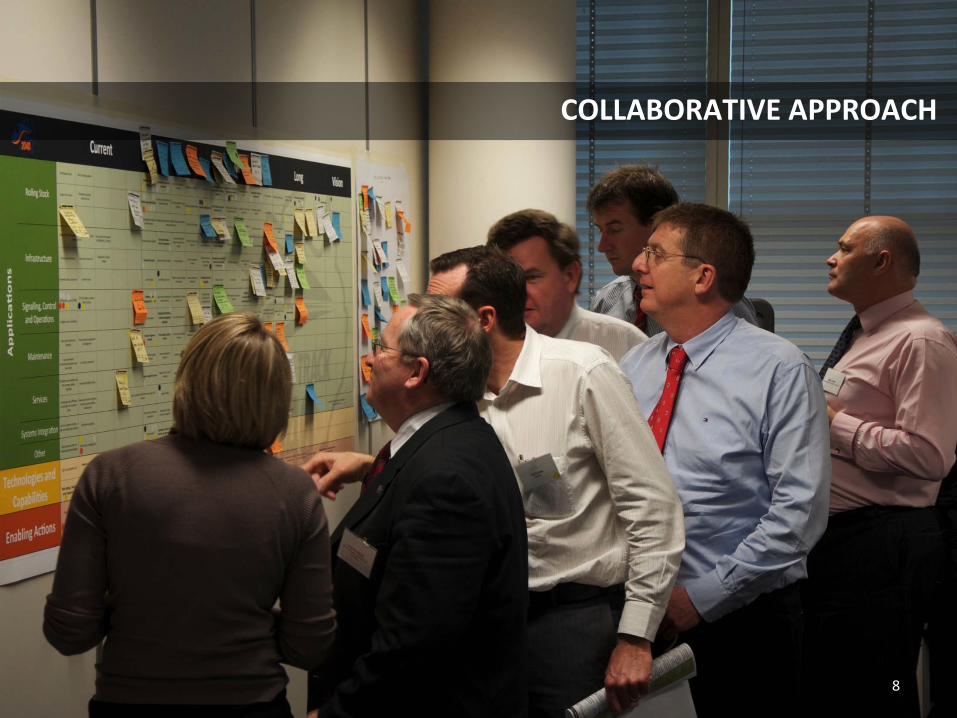
COLLABORATIVE APPROACH
8
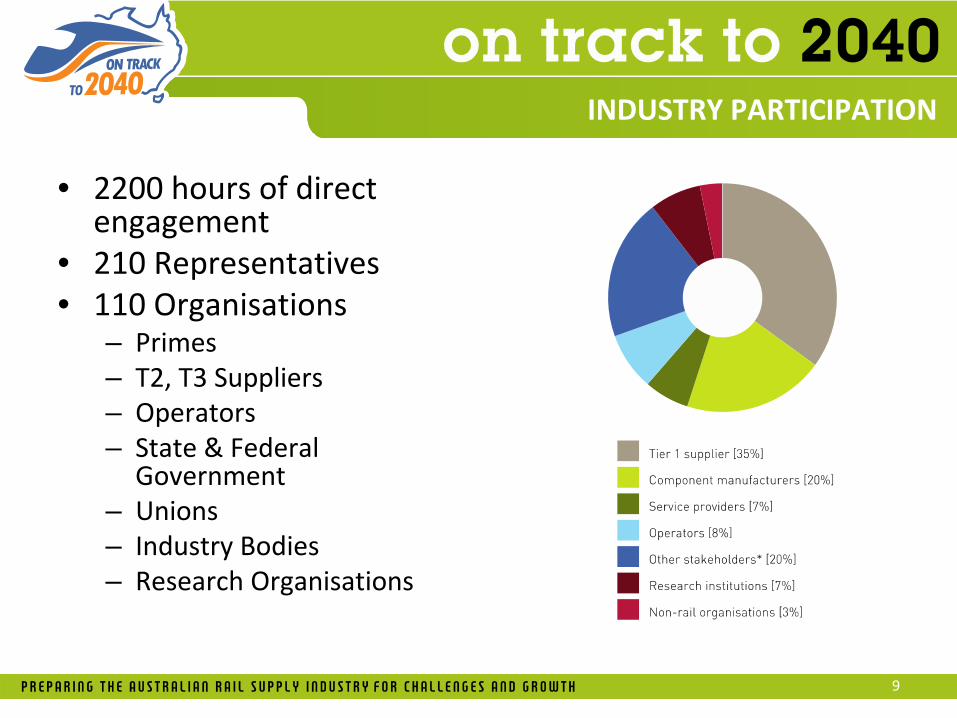
INDUSTRY PARTICIPATION
• 2200 hours of direct engagement
• 210 Representatives• 110 Organisations
– Primes– T2, T3 Suppliers– Operators– State & Federal
Government– Unions– Industry Bodies– Research Organisations
9

10
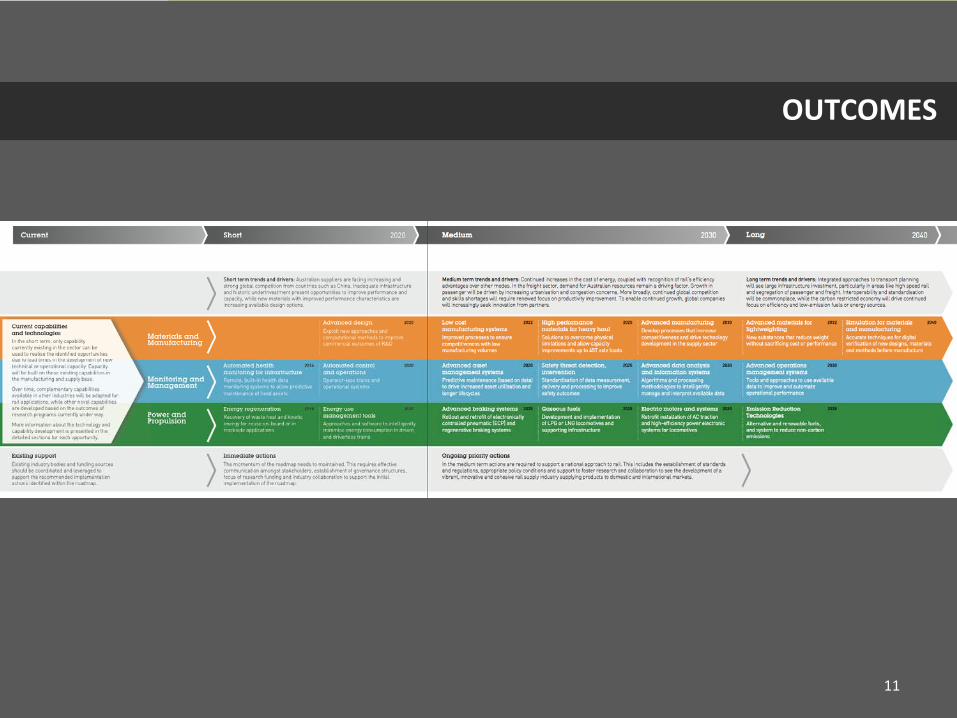
OUTCOMES
• 3 Technological Priority Areas:
– 18 Priority Opportunities
• 6 Enabling Action Areas:
– 22 Recommendations
• Available: ANU Edge, DIISRTE, ARA, States
11
OUTCOMES

12
TRENDS, DRIVERS and VISION

TRENDS AND DRIVERS
13
VISION
In
2040,
the
Australian
Rail
Supply
Sector
will
be
innovative
and
cohesive,
having
developed
a
strong sense of industry. This united industry will be capable of embracing change, enabling it to
respond to international trends and achieve profitable growth on
a local and global scale.
The sector will have developed effective and integrated national
and
international
supply
chains
linked to a globally competitive manufacturing base. Australian suppliers will achieve recognition
as
innovative
developers
and
integrators
of
technology
and
intellectual
property,
collaborating
with partners inside and outside the supply sector to develop scalable solutions. By leveraging the
networks of international partners, Australian suppliers will gain access to new markets that build
on local competitive advantages.
Investing in opportunities with global scale that are driven by customer needs and provide world‐
class
standards
of
safety,
reliability,
performance
and
efficiency,
Australian
suppliers
can
deliver
leading
technologies
to
the
world.
The
supply
sector,
collaborating
with
the
wider
industry
to
address
global
drivers
and
market
trends,
will
help
rail
become
the
transport
mode
of
choice,
providing
strong
integration
to
the
broader
transport
sector.
This
thriving,
profitable,
vibrant
supply industry will attract a growing, adaptable, skilled workforce and will be the first choice for
customers and operators.
14

EVALUATION CRITERIA
15

16
OPPORTUNITIES
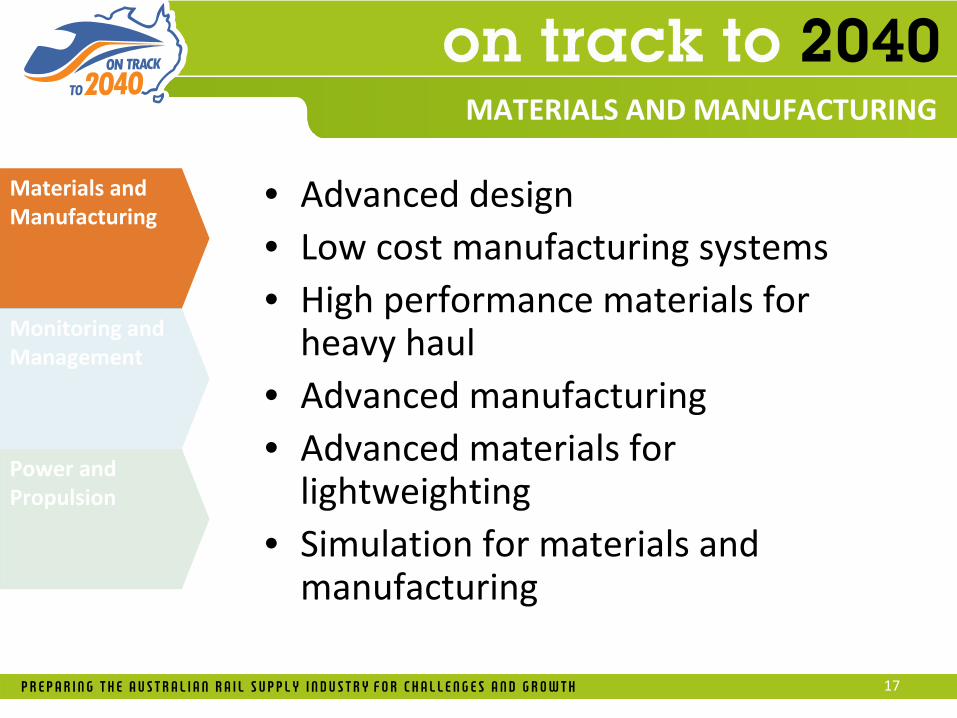
MATERIALS AND MANUFACTURING
• Advanced design • Low cost manufacturing systems • High performance materials for
heavy haul • Advanced manufacturing • Advanced materials for
lightweighting • Simulation for materials and
manufacturing
17
Materials and
Manufacturing
Monitoring and
Management
Power and
Propulsion
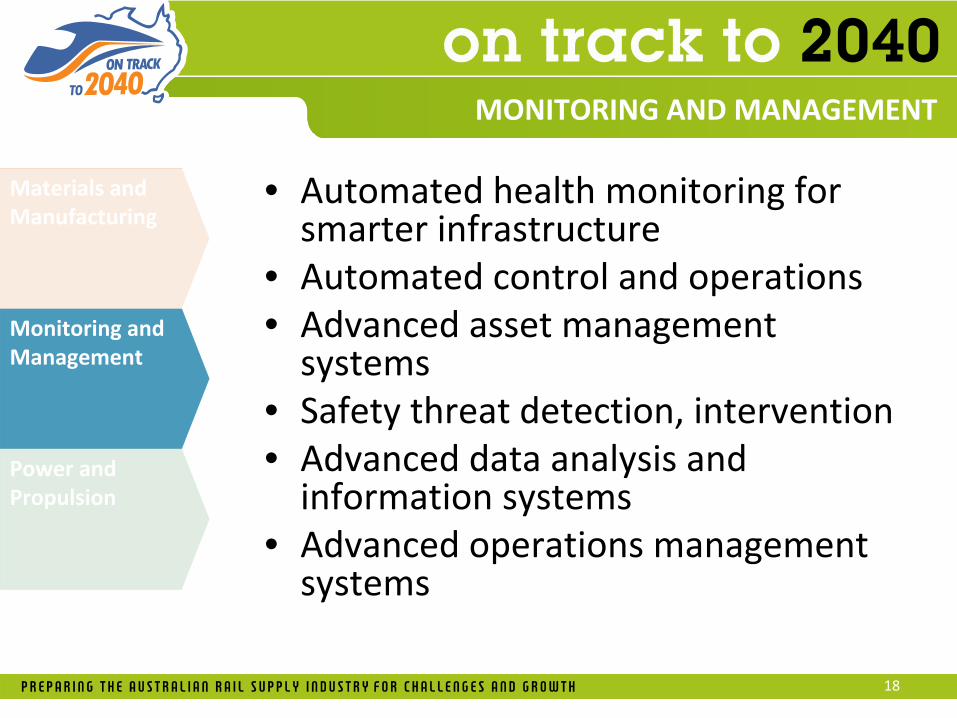
MONITORING AND MANAGEMENT
• Automated health monitoring for smarter infrastructure
• Automated control and operations • Advanced asset management
systems • Safety threat detection, intervention • Advanced data analysis and
information systems • Advanced operations management
systems
18
Materials and
Manufacturing
Monitoring and
Management
Power and
Propulsion
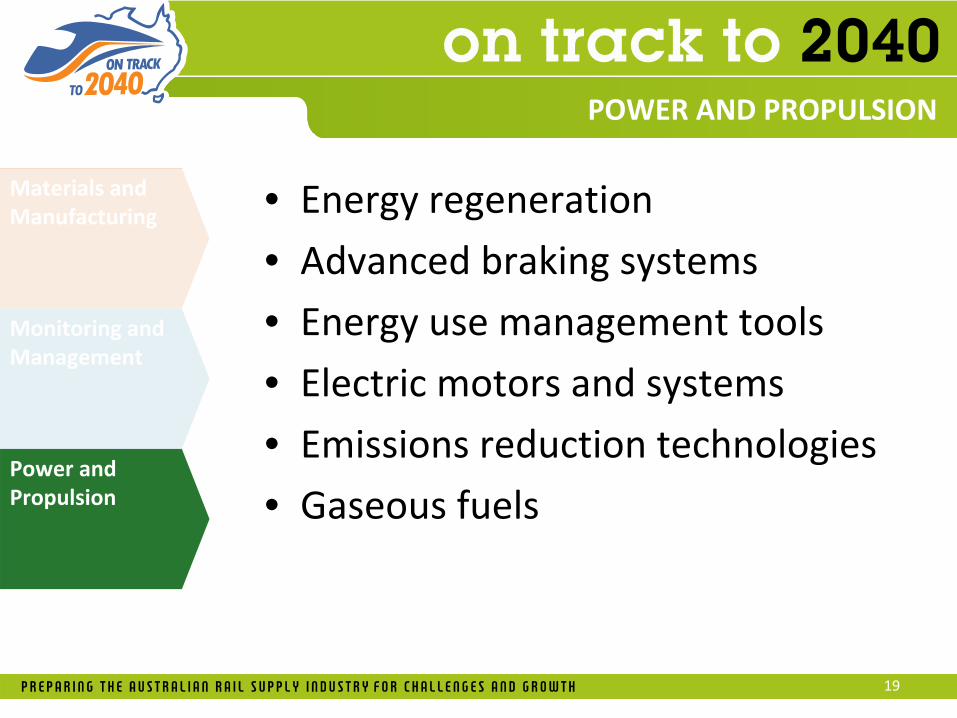
POWER AND PROPULSION
• Energy regeneration • Advanced braking systems
• Energy use management tools
• Electric motors and systems
• Emissions reduction technologies
• Gaseous fuels
19
Materials and
Manufacturing
Monitoring and
Management
Power and
Propulsion
20

21

22
TRENDS, DRIVERS and VISION

SIX STRATEGIC PRIORITY AREAS
• Governance
• Standardisation and Regulation
• Funding
• Collaboration
• Research
• Policy
23

SIX STRATEGIC PRIORITY AREAS
Governance
1.Fund an industry steering committee to facilitate collaboration
2.Identify and appoint a rail supply industry champion
3.Promote the outcomes of the roadmap and publicise them
throughout supplier, operator and state and federal networks.
Standardisation and Regulation
1.Identify the benefits of standardisation and where
appropriate define and catalogue national industry standards
2.Coordinate a national body to oversee the definition and
enforcement of future national rail standards.
3.Provide funding to support standardisation within the industry.
24

SIX STRATEGIC PRIORITY AREAS
Funding1.Create, maintain and publicise a
map of accessible funding sources2.Aggregate and consolidate funding
sources to improve accessibility3.Prioritise technologies identified in
the On Track to 2040 roadmap when considering where to invest or offer
funding.
Collaboration1.Undertake market research and
develop a business case for all the priority
opportunities.2.Establish an appropriate national
facility for the development, testing and demonstration of new rail
technology. 3.Provide access, via a nationally
agreed framework, to currently captured dat.
4.Establish a software platform based on open architecture.
25
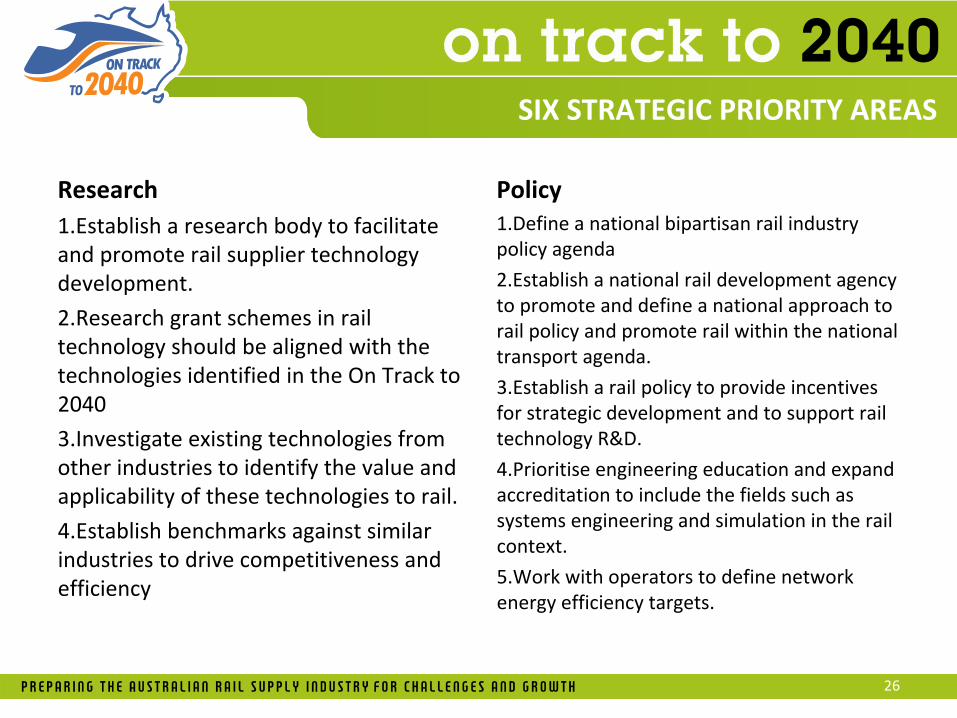
SIX STRATEGIC PRIORITY AREAS
Research1.Establish a research body to facilitate
and promote rail supplier technology
development.
2.Research grant schemes in rail
technology should be aligned with the
technologies identified in the On Track to
2040
3.Investigate existing technologies from
other industries to identify the value and
applicability of these technologies to rail.
4.Establish benchmarks against similar
industries to drive competitiveness and
efficiency
Policy1.Define a national bipartisan rail industry
policy agenda
2.Establish a national rail development agency
to promote and define a national approach to
rail policy and promote rail within the national
transport agenda.
3.Establish a rail policy to provide incentives
for strategic development and to support rail
technology R&D.
4.Prioritise engineering education and expand
accreditation to include the fields such as
systems engineering and simulation in the rail
context.
5.Work with operators to define network
energy efficiency targets.
26

27

WHAT’S NEXT?
28
29
GET A COPY
anuedge.com
| innovation.gov.au/supplieradvocatesanuedge.com
| innovation.gov.au/supplieradvocates

The Future of Australian Passenger RollingstockA Framework for Coordinated National
Demand and SupplyOrion Advisory & JS Murray
May 2012
1
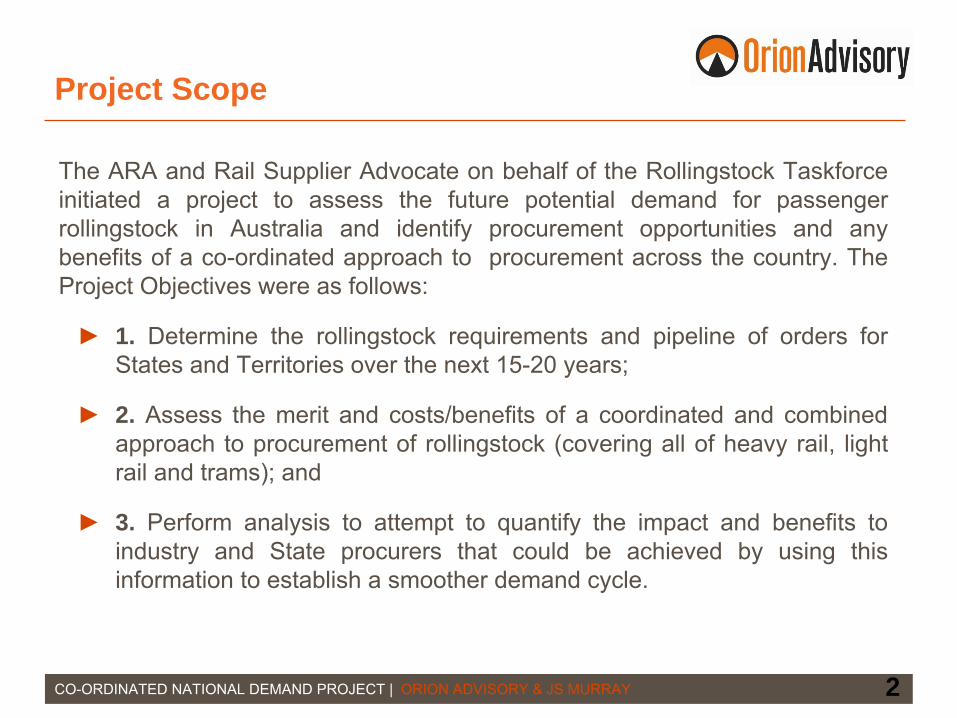
Project Scope
CO-ORDINATED NATIONAL DEMAND PROJECT | ORION ADVISORY & JS MURRAY 2
The ARA and Rail Supplier Advocate on behalf of the Rollingstock
Taskforce initiated a project to assess the future potential demand for passenger
rollingstock in Australia and identify procurement opportunities
and any benefits of a co-ordinated approach to procurement across the country. The Project Objectives were as follows:
►
1. Determine the rollingstock requirements and pipeline of orders for States and Territories over the next 15-20 years;
►
2. Assess the merit and costs/benefits of a coordinated and combined approach to procurement of rollingstock (covering all of heavy rail, light rail and trams); and
►
3. Perform analysis to attempt to quantify the impact and benefits to industry and State procurers that could be achieved by using this information to establish a smoother demand cycle.
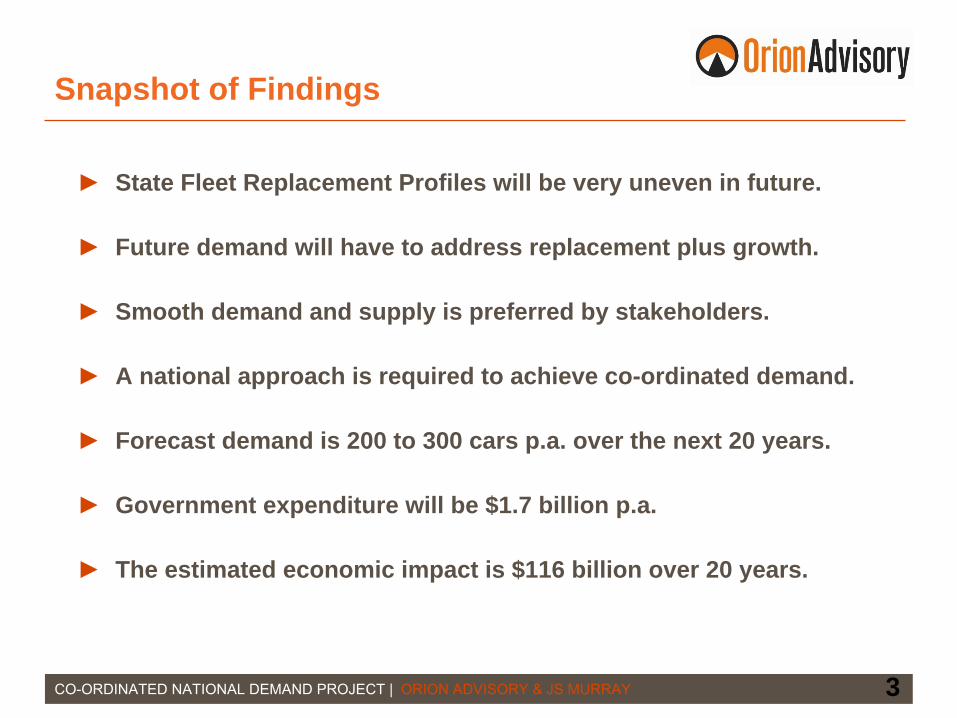
Snapshot of Findings
CO-ORDINATED NATIONAL DEMAND PROJECT | ORION ADVISORY & JS MURRAY 3
►
State Fleet Replacement Profiles will be very uneven in future.
►
Future demand will have to address replacement plus growth.
►
Smooth demand and supply is preferred by stakeholders.
►
A national approach is required to achieve co-ordinated demand.
►
Forecast demand is 200 to 300 cars p.a. over the next 20 years.
►
Government expenditure will be $1.7 billion p.a.
►
The estimated economic impact is $116 billion over 20 years.
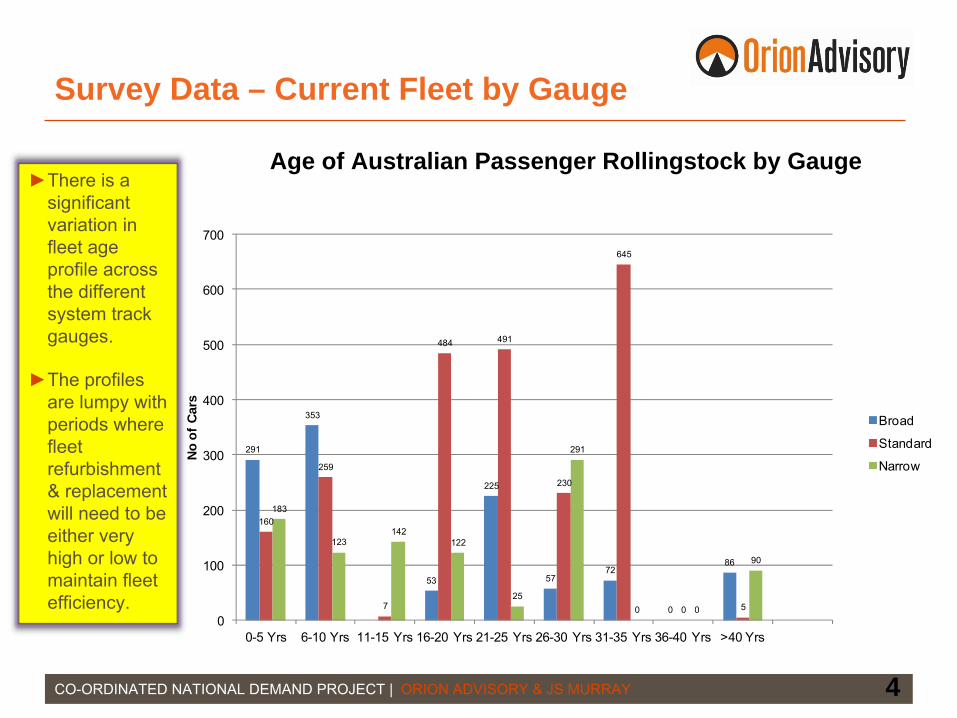
Survey Data – Current Fleet by Gauge
CO-ORDINATED NATIONAL DEMAND PROJECT | ORION ADVISORY & JS MURRAY 4
►There is a significant variation in fleet age profile across the different system track gauges.
►The profiles are lumpy with periods where fleet refurbishment & replacement will need to be either very high or low to maintain fleet efficiency.
291
353
53
225
5772
0
86
160
259
7
484 491
230
645
0 5
183
123142
122
25
291
0 0
90
0
100
200
300
400
500
600
700
0-5 Yrs 6-10 Yrs 11-15 Yrs 16-20 Yrs 21-25 Yrs 26-30 Yrs 31-35 Yrs 36-40 Yrs >40 Yrs
No
of C
ars
Broad
Standard
Narrow
Age of Australian Passenger Rollingstock by Gauge

Forecasting the Demand – The Inputs
CO-ORDINATED NATIONAL DEMAND PROJECT | ORION ADVISORY & JS MURRAY 5
►
The retirement of passenger rolling stock based on a 30-35 year operational life.
►
Growth in public transport demand based on:
Population growth
Gross Domestic Product growth
Public Transport mode share growth
►
Three scenarios for growth developed.
►
Infrastructure required to support additional public transport services is outside the scope of the Project.
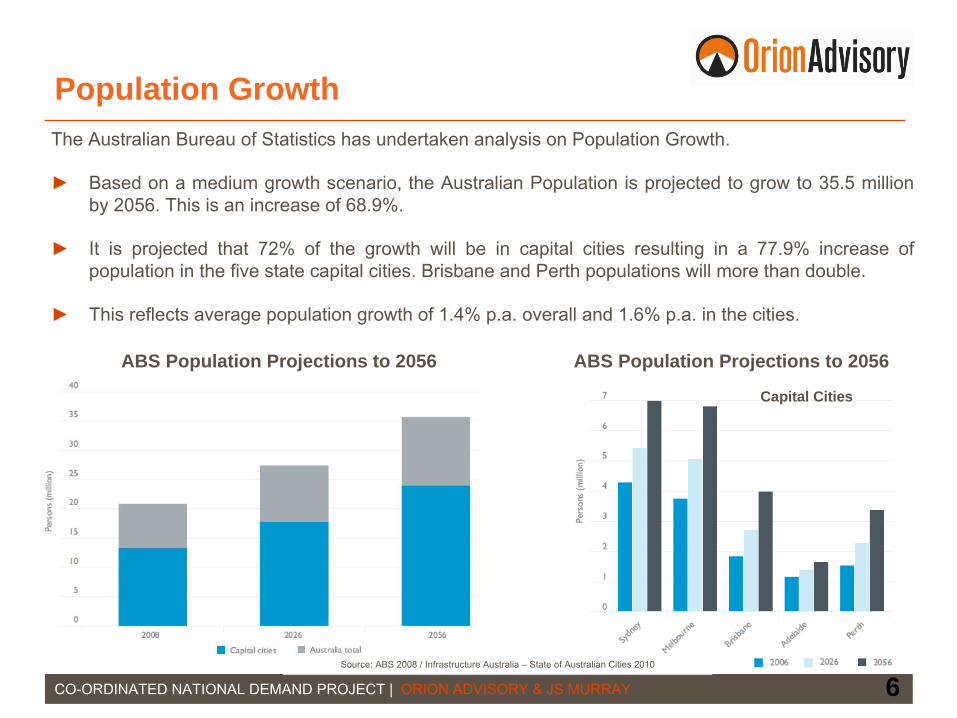
Population Growth
CO-ORDINATED NATIONAL DEMAND PROJECT | ORION ADVISORY & JS MURRAY 6
The Australian Bureau of Statistics has undertaken analysis on Population Growth.
►
Based on a medium growth scenario, the Australian Population is projected to grow to 35.5 million by 2056. This is an increase of 68.9%.
►
It is projected that 72% of the growth will be in capital cities
resulting in a 77.9% increase of population in the five state capital cities. Brisbane and Perth populations will more than double.
►
This reflects average population growth of 1.4% p.a. overall and
1.6% p.a. in the cities.
ABS Population Projections to 2056
Source: ABS 2008 / Infrastructure Australia –
State of Australian Cities 2010
ABS Population Projections to 2056
Capital Cities
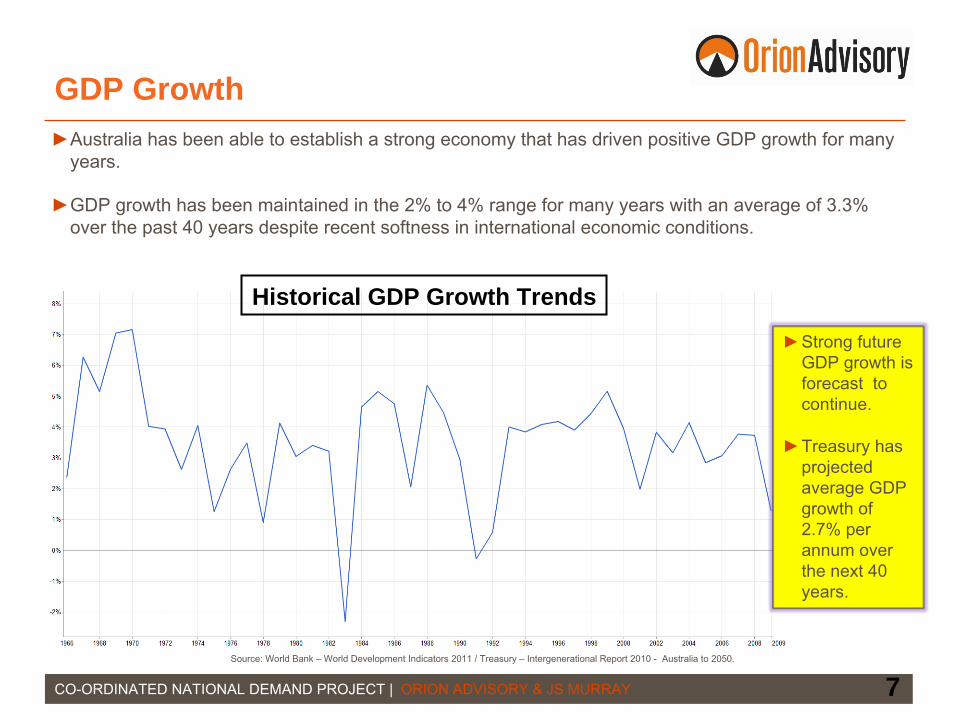
GDP Growth
CO-ORDINATED NATIONAL DEMAND PROJECT | ORION ADVISORY & JS MURRAY 7
►Strong future GDP growth is forecast to continue.
►Treasury has projected average GDP growth of 2.7% per annum over the next 40 years.
Historical GDP Growth Trends
Source: World Bank –
World Development Indicators 2011 / Treasury –
Intergenerational Report 2010 -
Australia to 2050.
►Australia has been able to establish a strong economy that has driven positive GDP growth for many years.
►GDP growth has been maintained in the 2% to 4% range for many years with an average of 3.3% over the past 40 years despite recent softness in international economic conditions.

CO-ORDINATED NATIONAL DEMAND PROJECT | ORION ADVISORY & JS MURRAY 8
Capital Cities Motorised Mode Share of Travel
Source: BITRE –
Information Sheet 31 –
Urban Passenger Transport 2009.
►Since 1980, the mode share of vehicles and UPT (urban public transport) have stayed relatively constant.
►The mode share of cars is 90% and UPT is 10%.
►UPT mode share increases to 16% in terms of commuter travel alone.
Future National Passenger Task The future demand for the rail passenger task in major capital cities will be driven by the Government policy settings and infrastructure investments that will drive commuter decision making and relative mode shares.
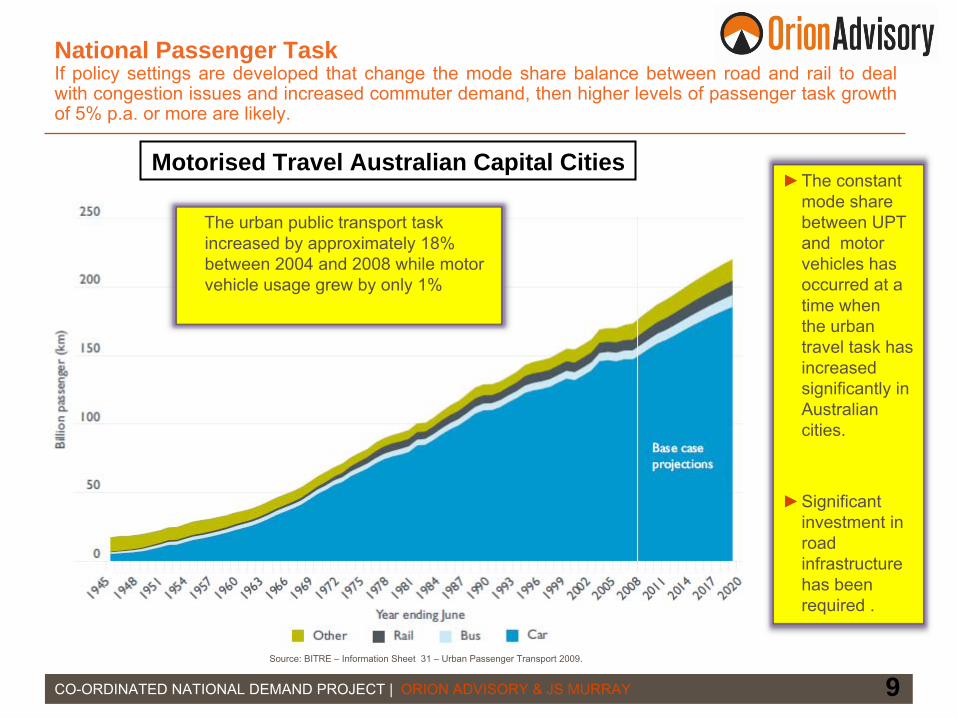
National Passenger Task If policy settings are developed that change the mode share balance between road and rail to deal with congestion issues and increased commuter demand, then higher levels of passenger task growth of 5% p.a. or more are likely.
CO-ORDINATED NATIONAL DEMAND PROJECT | ORION ADVISORY & JS MURRAY 9
►The constant mode share between UPT and motor vehicles has occurred at a time when the urban travel task has increased significantly in Australian cities.
►Significant investment in road infrastructure has been required .
Motorised Travel Australian Capital Cities
Source: BITRE –
Information Sheet 31 –
Urban Passenger Transport 2009.
The urban public transport task increased by approximately 18% between 2004 and 2008 while motor vehicle usage grew by only 1%

National Passenger Demand Forecast – Growth Options
CO-ORDINATED NATIONAL DEMAND PROJECT | ORION ADVISORY & JS MURRAY 10
►Using different growth rate assumptions, a range of potential demand scenarios emerge.
►Pop’n Rate -
Growth of 1.6%
►GDP Rate –
Growth of 2.7%
► Task Growth –
Growth of 5%
Demand Forecast Growth Rate Impacts
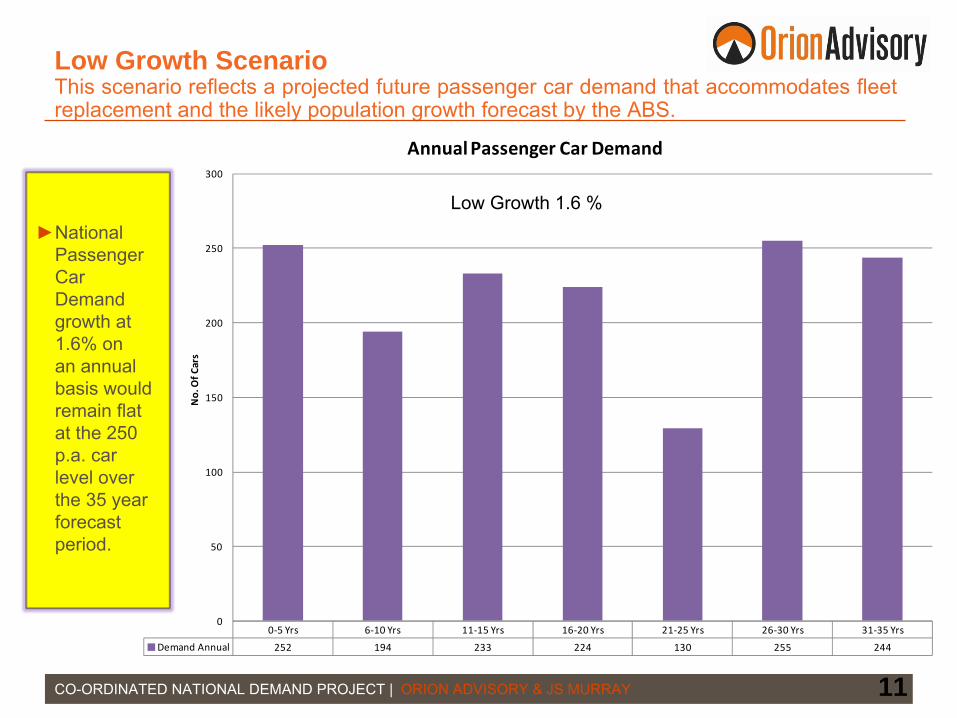
0‐5 Yrs 6‐10 Yrs 11‐15 Yrs 16‐20 Yrs 21‐25 Yrs 26‐30 Yrs 31‐35 Yrs
Demand Annual 252 194 233 224 130 255 244
0
50
100
150
200
250
300
No. Of C
ars
Annual Passenger Car Demand
Low Growth Scenario This scenario reflects a projected future passenger car demand that accommodates fleet replacement and the likely population growth forecast by the ABS.
CO-ORDINATED NATIONAL DEMAND PROJECT | ORION ADVISORY & JS MURRAY 11
►National Passenger Car Demand growth at 1.6% on an annual basis would remain flat at the 250 p.a. car level over the 35 year forecast period.
Low Growth 1.6 %

0‐5 Yrs 6‐10 Yrs 11‐15 Yrs 16‐20 Yrs 21‐25 Yrs 26‐30 Yrs 31‐35 Yrs
Demand Annual 305 259 312 319 243 391 405
0
50
100
150
200
250
300
350
400
450No. Of C
ars
Annual Passenger Car Demand
Median Growth Scenario This scenario reflects a projected future passenger car demand that accommodates the existing fleet replacement and the likely future GDP growth forecast.
CO-ORDINATED NATIONAL DEMAND PROJECT | ORION ADVISORY & JS MURRAY 12
►National Passenger Car Demand growth at 2.7% on an annual basis would start at a 300 p.a. car level and expand to the 400 p.a. car level in 35 years.
Median Growth 2.7%
0‐5 Yrs 6‐10 Yrs 11‐15 Yrs 16‐20 Yrs 21‐25 Yrs 26‐30 Yrs 31‐35 Yrs
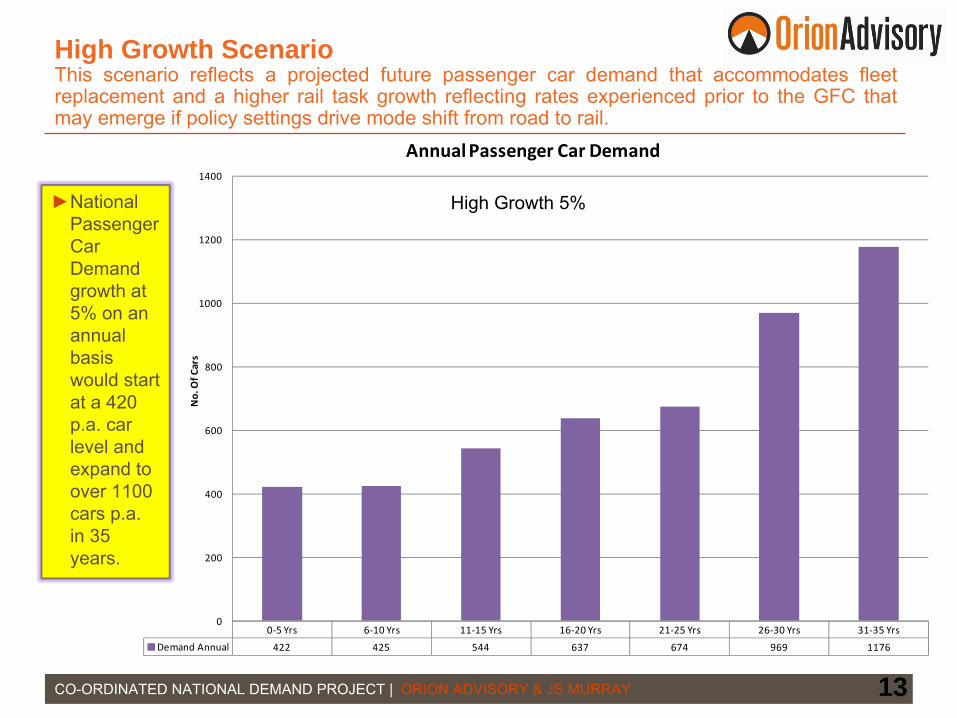
Demand Annual 422 425 544 637 674 969 1176
0
200
400
600
800
1000
1200
1400
No. Of C
ars
Annual Passenger Car Demand
CO-ORDINATED NATIONAL DEMAND PROJECT | ORION ADVISORY & JS MURRAY 13
►National Passenger Car Demand growth at 5% on an annual basis would start at a 420 p.a. car level and expand to over 1100 cars p.a. in 35 years.
High Growth 5%
High Growth Scenario This scenario reflects a projected future passenger car demand that accommodates fleet
replacement and a higher rail task growth reflecting rates experienced prior to the GFC that may emerge if policy settings drive mode shift from road to rail.

Passenger Car Demand When breaking down the composition of the national fleet profile, it becomes apparent that future replacement will have to address the large discrete fleet orders of the past as highlighted on page 4.
CO-ORDINATED NATIONAL DEMAND PROJECT | ORION ADVISORY & JS MURRAY 14
►Even with the additional cars based on fleet growth requirements, national forecast demand is uneven due to profiles of historical orders.
► To examine whether an alternative demand profile was possible, each of the 60 car classes was assessed in terms of age and spread of delivery into service.
0
200
400
600
800
1000
1200
1400
0 to 5 5 to 10 10 to 15 15 to 20 20 to 25 25 to 30
Cars
Years
Total DemandNo Adjustment
Broad Standard Narrow Growth
Low Growth –
1.6%
Rail Car Gauge

Fleet Demand Forecast The extreme fluctuations of replacement demand across the different states as depicted by their gauges results in the need to adopt a national approach
to achieve a smoother future order demand for rollingstock suppliers.
CO-ORDINATED NATIONAL DEMAND PROJECT | ORION ADVISORY & JS MURRAY 15
►The variability in demand is clearly demonstrated on a fleet by fleet basis.
►Smoothing demand completely is considered to be impractical.
►Achieving an 80% smoothing in demand would deliver benefits to rail operators and industry
Low Growth –
1.6%Low Growth -
Scenario
0
100
200
300
400
500
600
0 to 5 5 to 10 10 to 15 15 to 20 20 to 25 25 to 30
Cars
Years
Passenger Car Demand by System Gauge
Broad Gauge Standard Gauge Narrow Gauge Growth

Fleet Demand Low Forecast – Smoothed Profile
CO-ORDINATED NATIONAL DEMAND PROJECT | ORION ADVISORY & JS MURRAY 16
► Through a combination of accelerating, deferring or splitting the potential replacement trigger points, a smoother national demand profile could be achieved.
► This results in a minimum requirement of 1000 cars each 5 year period or 200 cars p.a. over the 30 year forecast period.
0
200
400
600
800
1000
1200
0 to 5 5 to 10 10 to 15 15 to 20 20 to 25 25 to 30
Cars
Years
Total Forecast Passenger Car Demand Smoothed Adjustment
Low Growth –
1.6%

Fleet Demand Median Forecast – Profile Breakdown
CO-ORDINATED NATIONAL DEMAND PROJECT | ORION ADVISORY & JS MURRAY 17
►Higher growth rates would result in a minimum initial annual demand of 240 cars p.a. This would increase approximately 350 cars p.a. over 35 years.
►A larger base consisting of both replacement and increasingly growth demand provides a base for future passenger car supply on a national basis.
Median Growth –
2.7%
0
200
400
600
800
1000
1200
1400
1600
1800
2000
0 to 5 5 to 10 10 to 15 15 to 20 20 to 25 25 to 30
Cars
Years
Total Demand Smoothed Adjustment
Broad Standard Narrow GrowthRail Car Gauge

Fleet Demand High Forecast – Profile Breakdown
CO-ORDINATED NATIONAL DEMAND PROJECT | ORION ADVISORY & JS MURRAY 18
►Using a high growth rate of 5% that could result from Government policy initiatives to address congestion and achieve a higher rail mode share produces a demand scenario ranging from 450 cars p.a. to 800 cars p.a. over the 35 year forecast period.
High Growth –
5%
0
500
1000
1500
2000
2500
3000
3500
4000
4500
0 to 5 5 to 10 10 to 15 15 to 20 20 to 25 25 to 30
Cars
Years
Total Demand Smoothed Adjustment
Broad Standard Narrow GrowthRail Car Gauge

Future Industry Opportunity and Impact
CO-ORDINATED NATIONAL DEMAND PROJECT | ORION ADVISORY & JS MURRAY 19
Potential Industry Value of Smoothed Car Demand and Supply►
Based on an assumption of a $2 million capital cost per passenger car and a $3.5 million whole of life maintenance cost per car¹, the Project estimated the value of the industry over the next 20 years. Core assumptions include:
20 Year Car Demand Median
Forecast $ Billion
Capital Equipment Costs $12
Maintenance Costs – WOL $21
Total Government Expenditure $33
Local Content 70% $23
Multiplier Effect Low ‐
5x $116
Multiplier Effect High ‐
8x $1851 Bombardier Transportation Australia –
Response to VCEC Inquiry 2011.
-
300 cars p.a. or $1.7 billion p.a. -
6000 cars over 20 years-
70% Local Content
-
$2 million capital expenditure per car -
$3.5 million whole of life maintenance cost -
Multiplier Effect of 5x or 8x on local content.

Passenger Rollingstock Survey
CO-ORDINATED NATIONAL DEMAND PROJECT | ORION ADVISORY & JS MURRAY 20
Major Survey Findings
►
Large batch deliveries of passenger cars are difficult to manage.
►
Key Benefits of smoothed demand and supply were identified as:
Improved Project Management
Smoother testing and acceptance
Streamlined regulatory obligations
More manageable fleet integration activities
Potential greater local content
Synergies with mandatory local maintenance tasks
Retention of skilled workforces

Passenger Rollingstock Forecast
CO-ORDINATED NATIONAL DEMAND PROJECT | ORION ADVISORY & JS MURRAY 21
Major Forecast Findings
►
Governments have large expenditures due in the future to meet the fleet replacement requirements and growth in the passenger rail task.
►
A smoother rollingstock demand and supply profile is possible.
►
To achieve a smoother demand profile, cooperation would be required between the State and Federal Governments to co-ordinate national demand.
►
Co-ordinated National Demand is likely to assist the retention of a local manufacturing capability, development and retention of staff, enable synergies with car maintenance and increase local content levels.
►
Core Project Conclusion:
Co-ordinated national demand is worth proceeding with as a core objective of national rail industry policy.

Key Project Findings
CO-ORDINATED NATIONAL DEMAND PROJECT | ORION ADVISORY & JS MURRAY 22
►
Passenger Car Fleet and Future Demand
The national passenger car fleet which is an aggregation of the state owned fleets is aging with significant replacements required over the next 20 years. This replacement demand plus growth requirements will result in a demand for 200 to 300 cars per annum to be procured over the next 20 plus years. This fleet can be manufactured in Australia or imported.
►
Government Expenditure and Industry Impact
The forecast demand plus whole of life maintenance will require Government expenditure of $1.7 billion per annum. Over the next 20 years, this will result in Government expenditure of $33 billion. Assuming a local content of 70% as has been achieved in some recent Australian passenger rollingstock manufacturing projects and applying a multiplier of 5 times to the local content of the project expenditure, the investment benefits to suppliers, sub-contractors, service providers and the community would be in the range of $116 billion over the 20 year period.
Key Project Findings
CO-ORDINATED NATIONAL DEMAND PROJECT | ORION ADVISORY & JS MURRAY 23
►
Smoothed Demand and Supply
The nature of historical fleet acquisitions by States will drive
an inconsistent and fluctuating rollingstock
demand and hence supply profile. Most project stakeholders covering Operators, Owners and Suppliers identified a range of potential benefits and expressed a desire to have a smoother demand and supply profile.
Australian manufacture of passenger cars is less likely to occur without a smooth demand profile.
►
Coordinated Demand
Accessing the potential benefits from a smooth demand and supply
profile will only be able to be achieved if a framework is established that coordinates the passenger rollingstock
procurement task on a national basis.

Rail Suppliers Industry Association
Update
Garry Whiting
General Manager Suppliers Australasian Railway Association
May 2012

Australian Rail Suppliers Industry Strategic Plan 2009‐2014
Initial Contributors
• AMWU
• ICNL, Federal Industry Department
• Victorian Industry Department and ICN Vic
• Queensland Industry Department
• Bombardier, United Group Rail, Downer Rail, Alstom Australia,
Bradken Rail, Ansaldo STS, Seimens Australia,
• ARIC
Clear Long Term Demand Profile
Harmonised National Product Specifications,
Policy & Standards
Strong CustomerPartnerships
Innovative &Technology Savvy
Internationally Competitive& Strong Export Market
Skilled, Capable &Renewed Workforce
Cohesive Industry With A Single Voice
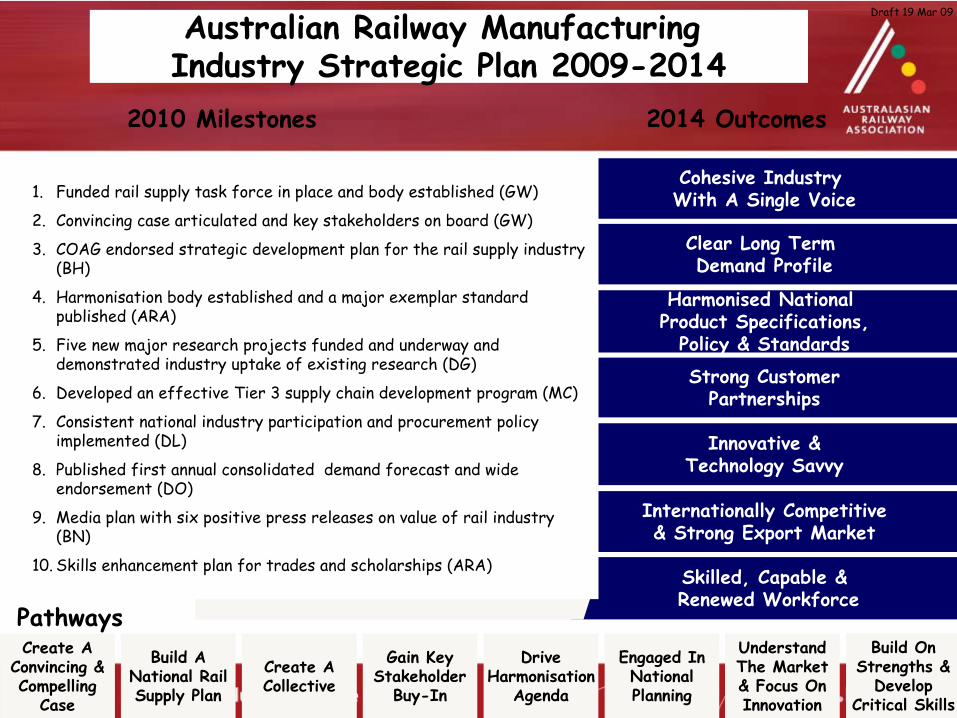
Australian Railway Manufacturing Industry Strategic Plan 2009-2014
2014 Outcomes
Pathways
2010 Milestones
1.
Funded rail supply task force in place and body established (GW)
2.
Convincing case articulated and key stakeholders on board (GW)
3.
COAG endorsed strategic development plan for the rail supply industry (BH)
4.
Harmonisation body established and a major exemplar standard published (ARA)
5.
Five new major research projects funded and underway and demonstrated industry uptake of existing research (DG)
6.
Developed an effective Tier 3 supply chain development program (MC)
7.
Consistent national industry participation and procurement policy implemented (DL)
8.
Published first annual consolidated demand forecast and wide endorsement (DO)
9.
Media plan with six positive press releases on value of rail industry (BN)
10.
Skills enhancement plan for trades and scholarships (ARA)
Create AConvincing &Compelling
Case
Build ANational RailSupply Plan
Create ACollective
Gain KeyStakeholder
Buy-In
DriveHarmonisation
Agenda
Engaged InNationalPlanning
UnderstandThe Market& Focus OnInnovation
Build OnStrengths &
DevelopCritical Skills
Draft 19 Mar 09

1.Funded rail supply task force in place and body established (GW)
2.Convincing case articulated and key stakeholders on board (GW)
3.COAG endorsed strategic development plan for the rail supply industry (BH)
4.Harmonisation body established and a major exemplar standard published (ARA)
5.Five new major research projects funded and underway and demonstrated industry uptake of existing research (DG)
6.Developed an effective Tier 3 supply chain development program (MC)
7.Consistent national industry participation and procurement policy implemented (DL)
8.Published first annual consolidated demand forecast and wide endorsement (DO)
9.Media plan with six positive press releases on value of rail industry (BN)
10.Skills enhancement pl
an for trades and scholarships (ARA)
2010 Milestones

Clear Long Term Demand ProfileClear Long Term Demand Profile
Harmonised National Product Specifications, Policy & StandardsHarmonised National Product Specifications, Policy & Standards
Strong Customer PartnershipsStrong Customer Partnerships
Innovative & Technology SavvyInnovative & Technology Savvy
Internationally Competitive & Strong Export MarketInternationally Competitive & Strong Export Market
Skilled, Capable & Renewed WorkforceSkilled, Capable & Renewed Workforce
Cohesive Industry With A Single VoiceCohesive Industry With A Single Voice
2014 Outcomes

November 2009 this became Rail Supplier Advocate Program
• Industry development strategy• Current industry metrics• Supply chain improvement program• Rail domain specialist• Demand forecasting• Harmonisation of component harmonisation• Technology road mapping• International Opportunities

Rail Manufacturers Group
• Peter Borden, Chief Executive Officer, Downer Rail (Chair)
• Bryan Nye, Chief Executive Officer, ARA
• Dan Osborne, Managing Director, Bombardier Transport
• Andy Summers, Chief Executive Officer, United Group Limited
• Jean De‐La‐Chappelle, Managing Director, Alstrom Transport
• Paul Bennett, Vice President, Siemens Transport
• Steve Cantwell, General Manager, Bradken Rail
• Lindsay Reid, General Manager, OneSteel Rail
• Jamie McDyre, General Manager Products, Invensys Rail.
• Garry Whiting, General Manager Suppliers ARA
RMG Current Priorities
• ARA to develop a target audience and key messages for RMG.
• ARA to draft a scope of work for local content position paper.
• ARA to draft an industry message paper for external stakeholder. This is to pick up on the item number
1,5,6,7 of the 2014 Outcomes.• ARA to develop a scope of work for the product
approval process.
ARIC and ARA Service Agreement
Partnership Highlights
• Significant progress on the RSA Agenda
• Export initiatives to; Taiwan, Europe, Hong Kong and Malaysia
• Good state and federal government support
• Between 80 to 100 companies involved and strong business results achieved
• Dedicated Supplier Conference (2009, 2010), plus rejuvenated AusRAIL Stream (2010,
2011)
• Many other member forums
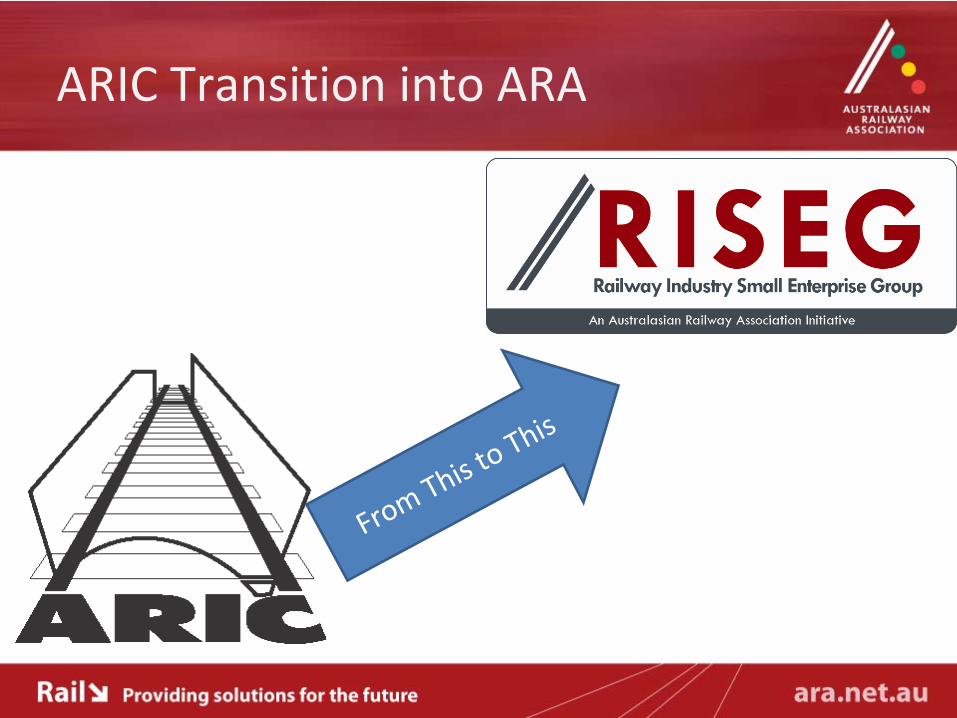
ARIC Transition into ARA
From T
his to T
his
RISEG (Railway Industry Small Enterprise Group)
• Steve Boshier, Regional Director Rail, Hyder Consulting PL (Chair)
• Bryan Nye, Chief Executive Officer, ARA
• Bill Hartmann, CEO, TrakBlaze
• Bryan Pieper, Marketing Manager, Pacific Rail
• Dale Coleman, Managing Director, TTG Transport Technology
• James McLeod, Executive Director Australasia, OEM Technology Solutions
• Mark Carling, Managing Director Faiveley Transport
• Garry Whiting, General Manager Suppliers ARA

RISEG Current Priorities
• Export Program expanded to encompass:‐
• Develop an Industry Capability Brochure focusing on export markets
• Undertake target market analysis and develop a three year Rolling trade
show plan reviewed and updated at RISEG meetings.• Develop and run 3 SME forums for 2012
– Rail Suppliers Conference
– Specific SME forum details to be developed by RISEG
– RISEG Stream at AusRail 2012
– Engage Supplier Advocate and National Sector Manager Rail in small to medium
sized agenda • Establish partnerships to fund and progress the Supplier Industry Metrics building on
the work completed by DIISR on Manufacturing Sector metrics.
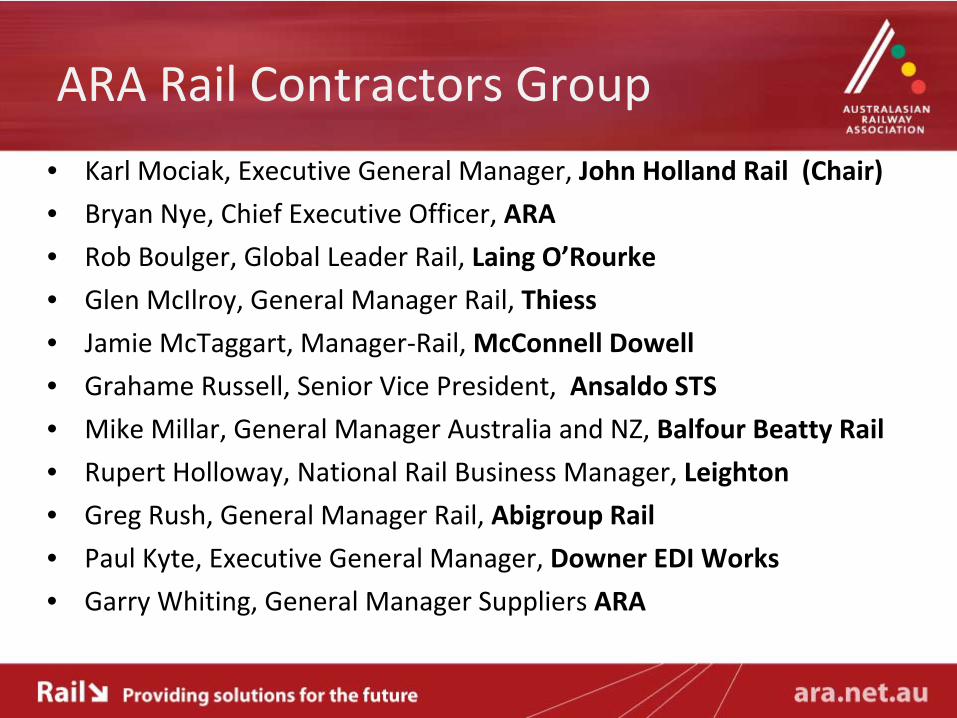
ARA Rail Contractors Group
• Karl Mociak, Executive General Manager, John Holland Rail (Chair)
• Bryan Nye, Chief Executive Officer, ARA
• Rob Boulger, Global Leader Rail, Laing O’Rourke
• Glen McIlroy, General Manager Rail, Thiess
• Jamie McTaggart, Manager‐Rail, McConnell Dowell
• Grahame Russell, Senior Vice President, Ansaldo STS
• Mike Millar, General Manager Australia and NZ, Balfour Beatty Rail
• Rupert Holloway, National Rail Business Manager, Leighton
• Greg Rush, General Manager Rail, Abigroup Rail
• Paul Kyte, Executive General Manager, Downer EDI Works
• Garry Whiting, General Manager Suppliers ARA
RCG Current Priorities
• Develop a position on national type approval process for rail equipment and adoption of new innovation.
• Influence imported labour condition used for rail infrastructure projects.
• Develop a position to influence level of local content in rail infrastructure project.
• Influence the long term planning on rail infrastructure needs within Australia. This has been
noticed as an important issue but it is not able to be affectively actioned.
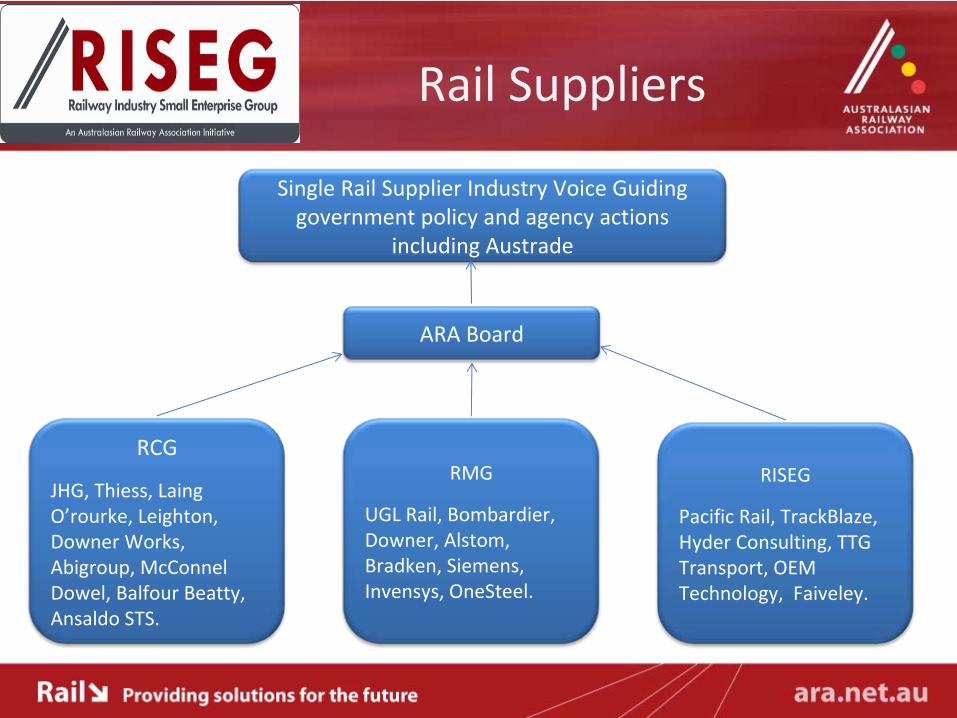
Rail Suppliers
Single Rail Supplier Industry Voice Guiding
government policy and agency actions
including Austrade
ARA Board
RCG
JHG, Thiess, Laing
O’rourke, Leighton,
Downer Works,
Abigroup, McConnel
Dowel, Balfour Beatty,
Ansaldo STS.
RMG
UGL Rail, Bombardier,
Downer, Alstom,
Bradken, Siemens,
Invensys, OneSteel.
RISEG
Pacific Rail, TrackBlaze,
Hyder Consulting, TTG
Transport, OEM
Technology, Faiveley.
Australian Rail Supplier Mission China & Hong Kong: Opportunities and Lessons Learnt
Bruce Griffiths, Rail Supplier AdvocateIndustry BriefingsBrisbane 28 May; Sydney 29 May; Melbourne 30 May

Industry Mission to China and Hong Kong• Rail Supplier Advocate led mission to China 5-17 March 2012
• Delegation visited 20 companies, suppliers and research institutions in nine cities, including state owned Ministry of Railway and headquarters of CNR and CSR which dominate rail manufacturing industry in China.
– Business development opportunities
– Exposed Australian suppliers to best practice
– Learnt new competitive practices
– Developed international partnerships
– Identified new technologies and innovations
• Supported by DIISRTE, Austrade, Enterprise Connect, ICN, ARIC and the Queensland Government.

Industry Mission to China and Hong Kong - continued• China is looking for ground breaking technologies and innovation• Potential CNR & CSR joint venture partnerships opportunities through their
subsidiaries to support technical integration• Products that assists “greening” or “leaning” – i.e. low weighting, energy
saving, automation• Infrastructure technology – i.e. automated track maintenance, ticketing,
electrification• Expertise associated with safety improvements or urban planning , i.e.
integration of road and rail • Potential Joint ventures in China and Australia.
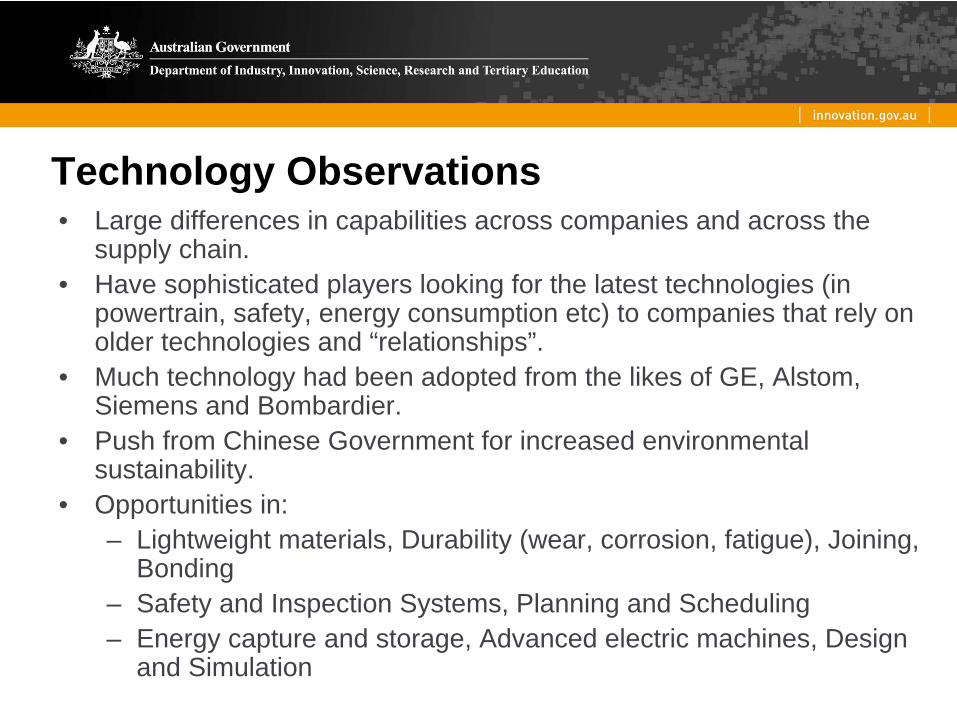
Technology Observations• Large differences in capabilities across companies and across the
supply chain.• Have sophisticated players looking for the latest technologies (in
powertrain, safety, energy consumption etc) to companies that rely on older technologies and “relationships”.
• Much technology had been adopted from the likes of GE, Alstom, Siemens and Bombardier.
• Push from Chinese Government for increased environmental sustainability.
• Opportunities in:– Lightweight materials, Durability (wear, corrosion, fatigue), Joining,
Bonding– Safety and Inspection Systems, Planning and Scheduling– Energy capture and storage, Advanced electric machines, Design
and Simulation

Best Practice ObservationsStrategy Deployment• Long term, ambitious plans were developed • Plans regularly reviewed • Both operational aims (double business in four years) and technical goals (engineer
300km/h trains) • Plans were specific, based on reliable growth data from the government
Leadership• Strong leadership • Leadership well communicated • Strong desire for partnerships and collaboration • A clear and consistent intentions • They had a clearly defined reason for them to be in business
Employee Engagement• Engagement plans varied between Chinese organisations • “There is strong evidence of clear direction and encouragement”• Strong top-down engagement, weak bottom-up engagement

Best Practice Observations - continuedEnvironment and Safety• Range of competencies in OH&S• Some companies terrible: no safety glasses when welding or grinding, power chords in water• Some companies good: “generally better than the average Australian manufacturing facility”• They would display safety certifications, but not practise them
Innovation• Innovation most apparent in CSR and CNR. • Innovation pushed by MoR, and MoR ‘helps’ CSR and CNR (sometimes working together)• A low carbon footprint was at the centre of most innovation, AC traction, wind farms • MoR help suppliers innovation by providing guidance and suggesting partnerships
Quality Systems• All toured companies were dedicated to QMSs and IRIS accreditations (how real were
these?) • CNR & CRC in particular is “at or near world’s best practice”• Performance indicators on display, but future targets were same as present ones (maintain
level of productivity rather than continuous improvement)

Questions?

Rail Industry Support Program
Sam McNaughtonNational ManagerContinuous Improvement Network
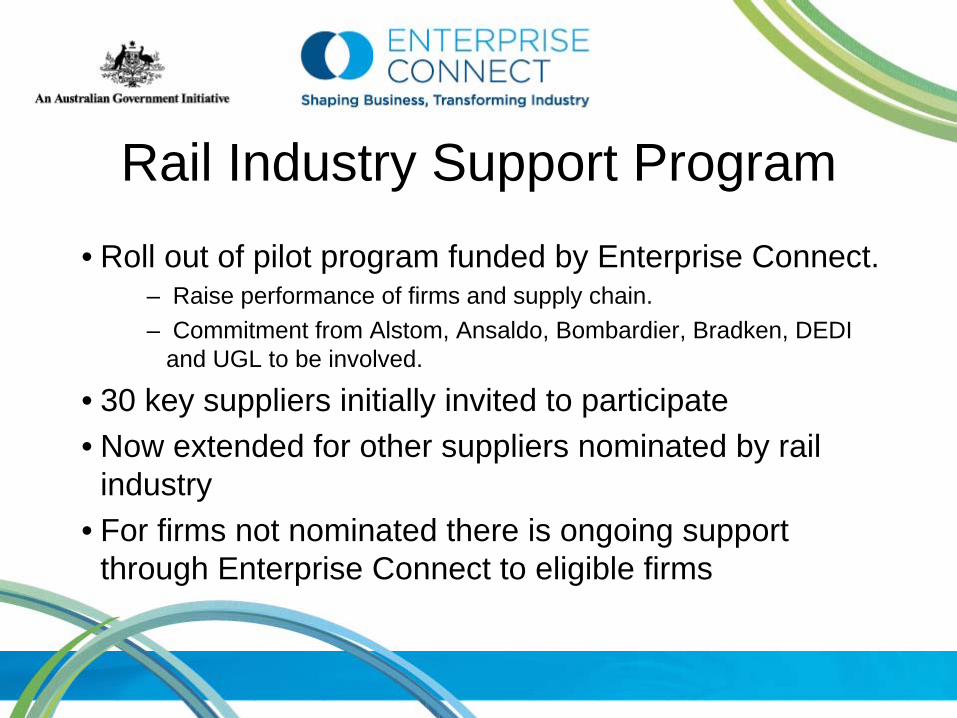
Rail Industry Support Program• Roll out of pilot program funded by Enterprise Connect.
– Raise performance of firms and supply chain.– Commitment from Alstom, Ansaldo, Bombardier, Bradken, DEDI
and UGL to be involved.
• 30 key suppliers initially invited to participate• Now extended for other suppliers nominated by rail
industry• For firms not nominated there is ongoing support
through Enterprise Connect to eligible firms

Business Review:• A diagnostic review of a business• Uses analytical and benchmarking tools• Business Adviser will work with a firm to:
– Understand its strategy and business operations– Identify strengths and opportunities– Identify problems and the root cause– Assess potential for innovation, improvement and growth– Assist firms to access world-class business tools, processes and
technology– Agree specific action plans
• Business Adviser maintains an ongoing relationship with the firm

Award metricsContinuous Sustainable Improvement Plan
Quality certificationBusiness group formation
Step 4RECOGNITION
Step 3CSIP
Step 2DIAGNOSTICS
Step 1CUSTOMER
ENGAGEMENT
Metrics alignment
Relationships
Business Excellence
OperationalExcellence Industry recognition
Code of practice
Kanban
Materials ProcessesPeople
JobStandardisation
Visual Controls
Set-up Reduction
5 ‘s’ Housekeeping
7 Wastes and SPC / Quality Tools
Supplier Continuous Improvement Program
2 Months
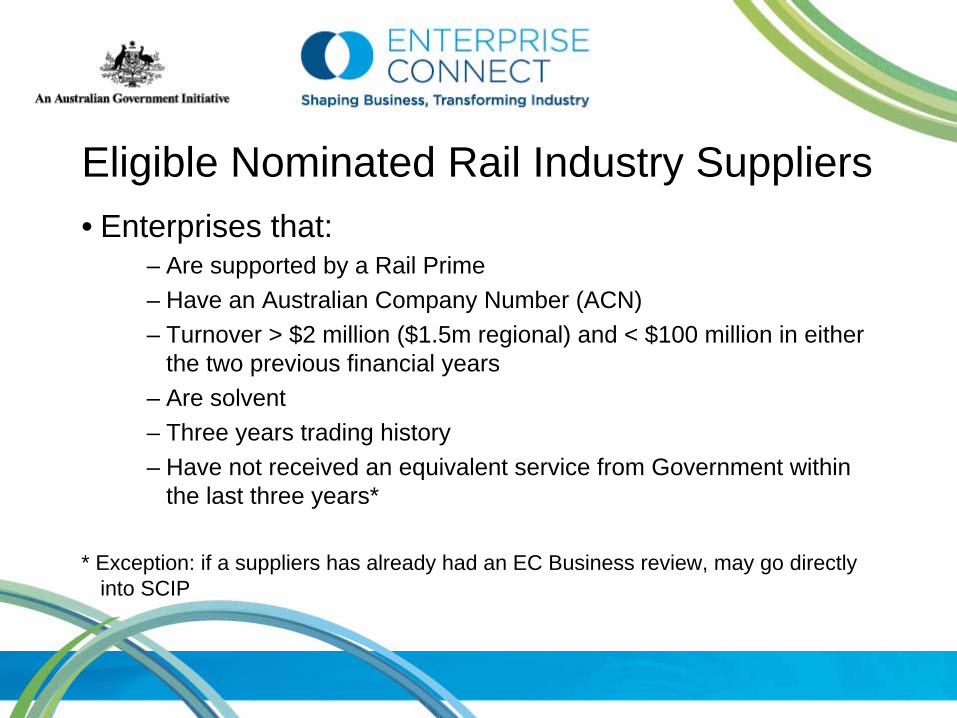
Eligible Nominated Rail Industry Suppliers• Enterprises that:
– Are supported by a Rail Prime– Have an Australian Company Number (ACN)– Turnover > $2 million ($1.5m regional) and < $100 million in either
the two previous financial years– Are solvent– Three years trading history– Have not received an equivalent service from Government within
the last three years*
* Exception: if a suppliers has already had an EC Business review, may go directly into SCIP

Status• Actco Pickering• Austbreck• Australian Rail Technology• Australian Rollforming • Cablex• Chess Engineering• CP Engineering• Faiveley Transport Australia• Glassform• Marciano Industries• McConnell Seats
• Medina Engineering• Melvelle Equipment Corp• Morris Engineering• OEM Technology Solutions• OGIS Engineering• RPC Technologies• Schaffler• SMC Manufacturing• Uneek• Vulcanite

Supplier Continuous Improvement Program
• National– Sam McNaughton– 0420 960 934– [email protected]
• Victoria– Mal Clark– 0428 328 228– [email protected]
• NSW– John Mills– 0400 662 083– [email protected]
• Queensland – Richard Tooher– 0400 662 583– [email protected]
Faiveley Transport Australia and SCIP A Suppliers Perspective
Mark Carling, Managing DirectorFaiveley Transport Australia Ltd
May 2012
+ + + + + + + + ++ + + + + + + + ++ + + + + + + + ++ + + + + + + + ++ + + + + + + + ++ + + + + + + + +
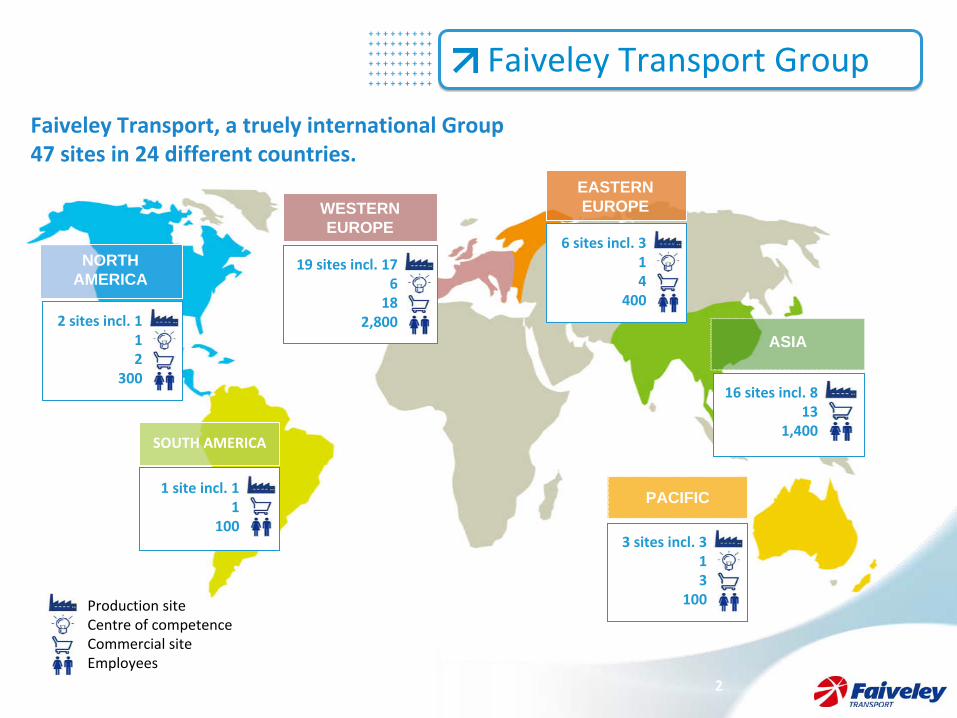
Faiveley Transport Group
Faiveley Transport, a truely international Group47 sites in 24 different countries.
NORTH AMERICA
SOUTH AMERICA
WESTERNEUROPE
EASTERN EUROPE
PACIFIC
ASIA
6 sites incl. 3 14
400
16 sites incl. 8 13
1,400
3 sites incl. 3 13
100
19 sites incl. 17 6
182,800
1 site incl. 1 1
100
2 sites incl. 1 12
300
Production siteCentre of competenceCommercial siteEmployees
2
+ + + + + + + + ++ + + + + + + + ++ + + + + + + + ++ + + + + + + + ++ + + + + + + + ++ + + + + + + + +
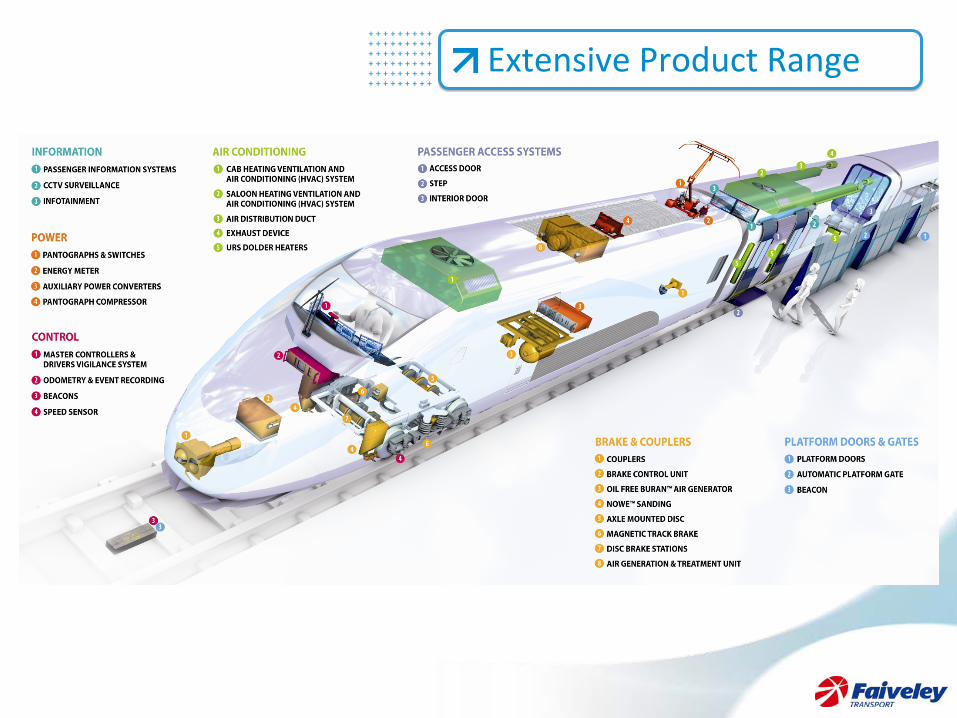
Extensive Product Range
+ + + + + + + + ++ + + + + + + + ++ + + + + + + + ++ + + + + + + + ++ + + + + + + + ++ + + + + + + + +
Why Participate in SCIP?
• Faiveley Transport is focussed on Continuous Improvement and continual learning, as well as constantly developing it’s competitive
advantage and connections to the industry.
• Despite a mature internal management system being in place, there is always something new to learn.
• Basis for SCIP already fits very well with the Faiveley Transport Australia approach (Business and Operational Excellence, FMS, Continuous
Improvement Program etc.)
• Opportunity to benchmark performance against the best organisations from other industries.
• Opportunity to further engage with key customers in developing our relationships.
• Opportunity to further our engagement with the industry as a whole.
• Opportunity to engage with organisations outside of the industry, for further learning opportunities.
+ + + + + + + + ++ + + + + + + + ++ + + + + + + + ++ + + + + + + + ++ + + + + + + + ++ + + + + + + + +
Our Journey So Far…
• Early adopters of the SCIP Program, with involvement from the outset.
• A collective Management Team approach, with direct involvement from the MD, rather than defer responsibility for the program to lower levels.
• Excellent fit between SCIP and programs and projects already in place at Faiveley Transport Australia.
• Undertaken extensive Business and Operational Excellence Reviews
and identified areas for improvement and put improvement plans in place.
Many improvements identified have already been put in place.
• Undertaken Relationship Management Meetings with strong support from key customers (Bombardier, Bradken, United Group Ltd Rail) and begun to map and develop strategically important connections and
set
clear improvement goals.
• Created networks with non‐rail based organisations and shared ideas, concepts and ways of working, learned a lot from these organisations and implemented in our own plants.
+ + + + + + + + ++ + + + + + + + ++ + + + + + + + ++ + + + + + + + ++ + + + + + + + ++ + + + + + + + +
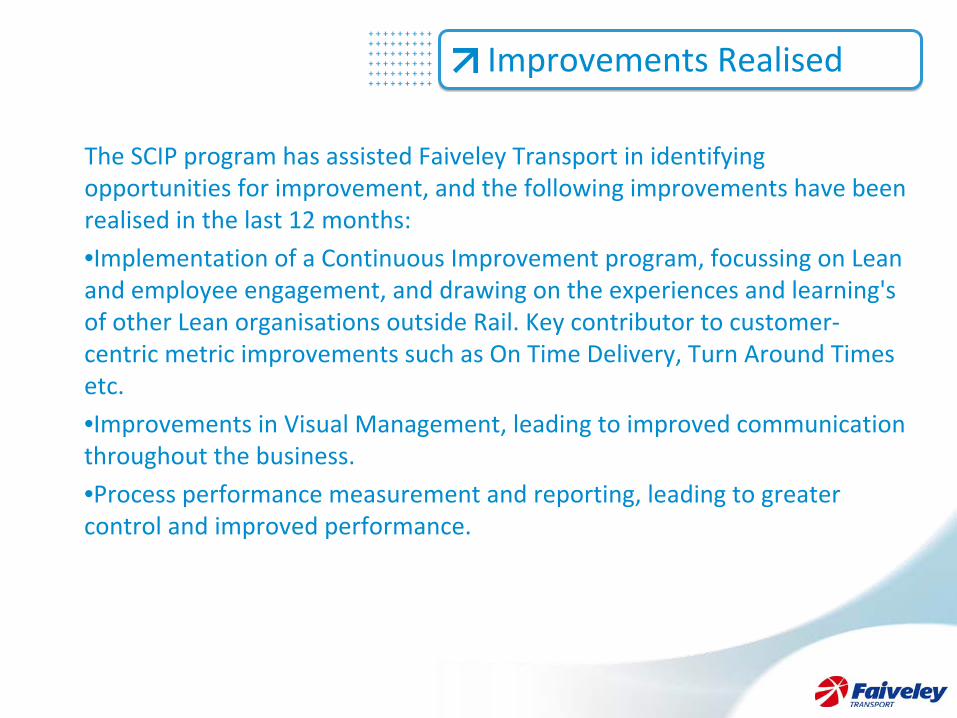
Improvements Realised
The SCIP program has assisted Faiveley Transport in identifying opportunities for improvement, and the following improvements have been
realised in the last 12 months:
•Implementation of a Continuous Improvement program, focussing on
Lean and employee engagement, and drawing on the experiences and learning's of other Lean organisations outside Rail. Key contributor to customer‐
centric metric improvements such as On Time Delivery, Turn Around Times etc.
•Improvements in Visual Management, leading to improved communication throughout the business.
•Process performance measurement and reporting, leading to greater control and improved performance.

+ + + + + + + + ++ + + + + + + + ++ + + + + + + + ++ + + + + + + + ++ + + + + + + + ++ + + + + + + + +
Improvements Realised
Continuous Improvement Meeting in Sydney

+ + + + + + + + ++ + + + + + + + ++ + + + + + + + ++ + + + + + + + ++ + + + + + + + ++ + + + + + + + +
Improvements Realised
Visual Management Centre for Production

+ + + + + + + + ++ + + + + + + + ++ + + + + + + + ++ + + + + + + + ++ + + + + + + + ++ + + + + + + + +
Where Next?
• Implement action plans and review benefits achieved.
• Return to the beginning of the Business and Operational Excellence Review cycle, carry out follow‐up assessments, determine opportunities
for further improvement and define next action plans.
• Continue to drive the RMM process which has begun with key customers. Continue to develop the process and approach and invite
other customers to join the process. Continually identify ways to improve customer related performance.

+ + + + + + + + ++ + + + + + + + ++ + + + + + + + ++ + + + + + + + ++ + + + + + + + ++ + + + + + + + +
Lessons Learned
• When Continuous Improvement, Business Excellence and Continuous Learning are core to the management of your business, adopting the
SCIP program is natural fit.
• The program has to be seen a leadership‐led tool for improvement of competitiveness in the business. It cannot be deferred to someone else
for management and implementation.
• Customers are willing to participate in the RMM process and will
give strong, honest and open feedback. Given their workload and the
complexity of their organisations, they cannot be expected to drive the RMM process. That is the responsibility of the supplier.
• Engagement in the process can open many opportunities for collaboration both inside and outside the industry, as well as opportunities to learn and develop.

Faiveley
Transport Australia and SCIP A Suppliers Perspective
Thank You

NEXT STEPS
Bruce Griffiths, Rail Supplier AdvocateIndustry BriefingsBrisbane 28 May; Sydney 29 May; Melbourne 30 May

Supplier Advocate Update/Next Steps
• There are a number of next steps requiring action in the next 6 months:
• Establish appropriate linkages with industry, industry associations, research institutions and government agencies to ensure outcomes of On Track to 2040 Roadmap are followed up and achieved.
• Promote benefits of outcomes of the demand forecasting project with key stakeholders to ensure they can be realised. This will include considering the analysis and different funding models.
• Ensuring key stakeholders (primes, suppliers, state transport departments and federal government agencies) are involved in actioning the outcomes of a project to harmonise target rolling stock specifications to help assess and deliver potential cost savings to industry and customers.
Next Steps continued
• Develop rail industry capability teams to prospect opportunities and in bidding for projects.
• Promote the benefits of SCIP to encourage increased involvement.
• Undertake Australian rail industry improvement benchmarking for SCIP participants.
• Undertake a strategic review workshop with all key stakeholders in late 2012 to identify next steps in industry development strategy.
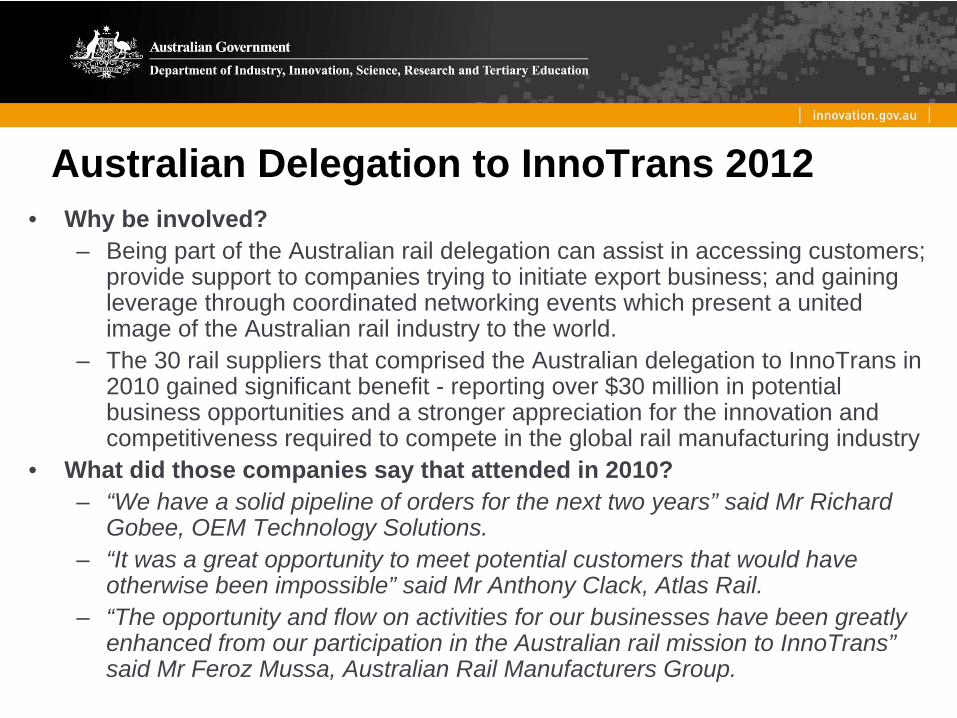
Australian Delegation to InnoTrans 2012• Why be involved?
– Being part of the Australian rail delegation can assist in accessing customers; provide support to companies trying to initiate export business; and gaining leverage through coordinated networking events which present a united image of the Australian rail industry to the world.
– The 30 rail suppliers that comprised the Australian delegation to InnoTrans in 2010 gained significant benefit - reporting over $30 million in potential business opportunities and a stronger appreciation for the innovation and competitiveness required to compete in the global rail manufacturing industry
• What did those companies say that attended in 2010?– “We have a solid pipeline of orders for the next two years” said Mr Richard
Gobee, OEM Technology Solutions.– “It was a great opportunity to meet potential customers that would have
otherwise been impossible” said Mr Anthony Clack, Atlas Rail.– “The opportunity and flow on activities for our businesses have been greatly
enhanced from our participation in the Australian rail mission to InnoTrans” said Mr Feroz Mussa, Australian Rail Manufacturers Group.
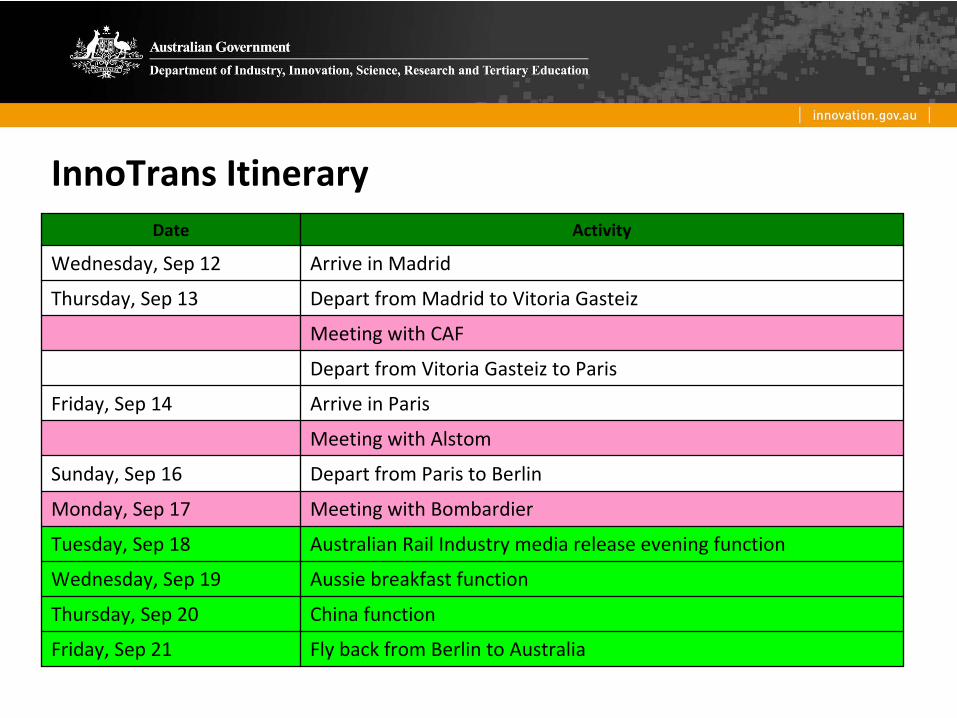
InnoTrans
ItineraryDate Activity
Wednesday, Sep 12 Arrive in Madrid
Thursday, Sep 13 Depart from Madrid to Vitoria Gasteiz
Meeting with CAF
Depart from Vitoria Gasteiz
to Paris
Friday, Sep 14 Arrive in Paris
Meeting with Alstom
Sunday, Sep 16 Depart from Paris to Berlin
Monday, Sep 17 Meeting with Bombardier
Tuesday, Sep 18 Australian Rail Industry media release evening function
Wednesday, Sep 19 Aussie breakfast function
Thursday, Sep 20 China function
Friday, Sep 21 Fly back from Berlin to Australia

Australian Delegation to InnoTrans 2012Australian Stand• The Australian Government will host a large, high tech design stand to
showcase Australian capability and also provide a hub for Australian companies to engage in networking functions and targeted meetings.
Australian DVD• The ARA is coordinating a DVD to showcase the Australian rail industry. Networking Functions• The Australian Government, together with ICN and the ARA, will host a number
of networking sessions on the standTargeted meetings organised by the Department of Innovation and ICN• The Department, together with ICN are organising targeted meetings with
international primes (including CAF in Spain, Alstom in Paris and Bombardier in Berlin.)
Australian Rail Directory• ICN are developing a directory which will include the information of all
companies participating on the stand. This information will be available on a memory stick which can be handed out at the Show.


Questions?
Close & Networking

Further information at:www.innovation.gov.au/supplieradvocates
Bruce GriffithsRail Supplier [email protected]
Government contactRichard SamuelsDepartment of Industry, Innovation, Science, Research and Tertiary Education [email protected]+ 61 (0)2 6213 7525
Industry Capability Network contact Tony Carney – National Sector Manager [email protected]+ 61 (0) 418 353 718