Embed Size (px)
Citation preview
iihs.org
Advancing vehicle safety at the Insurance Institute for Highway Safety in 2016 (and beyond)
crash.tech 2016Munich, GermanyApril 19, 2016
Adrian LundPresident, IIHS and HLDI
IIHS is an independent, nonprofit scientific and
educational organization dedicated to reducing the losses
— deaths, injuries and property damage — from crashes on the nation’s roads (since 1959).
HLDI shares this mission by analyzing insurance
data representing human and economic losses from
crashes and other events related to vehicle ownership (since 1972).
Both organizations are wholly supported by auto insurers.
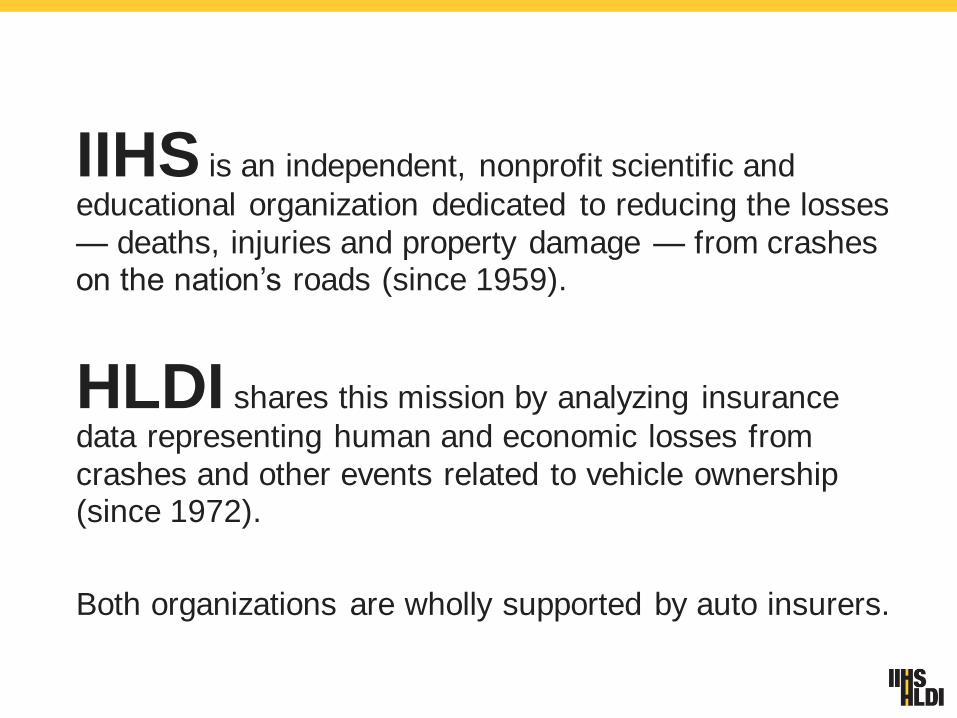
Motor vehicle crash deaths in the US and deaths per billion vehicle miles traveled
30,000
35,000
40,000
45,000
50,000
55,000
60,000
1950 1960 1970 1980 1990 2000 20100
10
20
30
40
50
60
70
80
Motor vehiclecrash deaths
Crash deaths perbillion vehicle miles traveled
201410.8 per billion
32,675 deaths
1950-2014
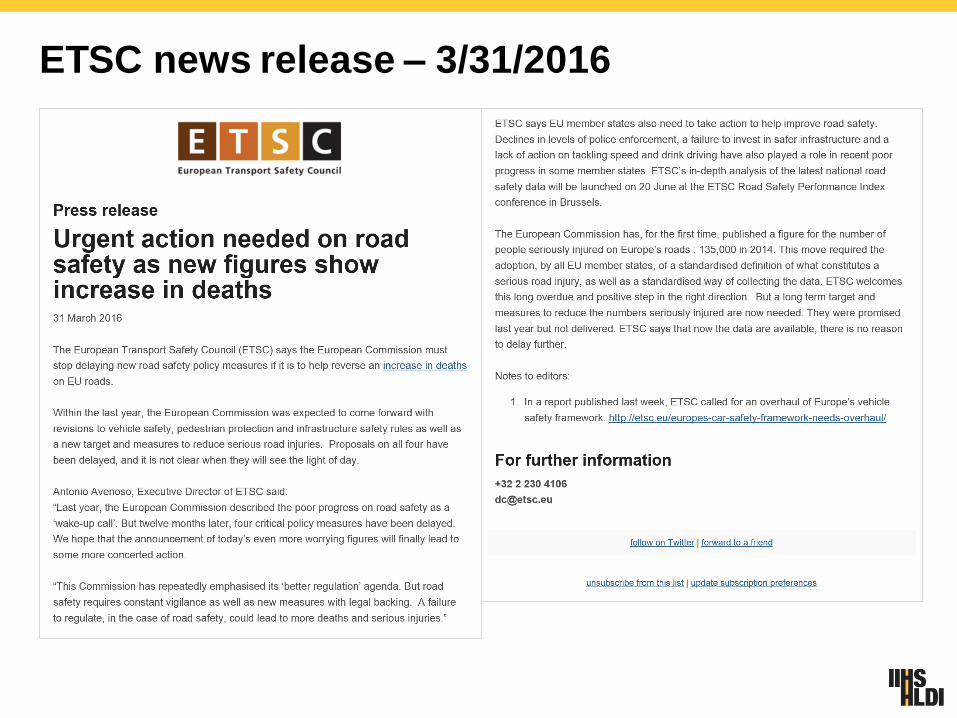
ETSC news release – 3/31/2016

It’s the economy …
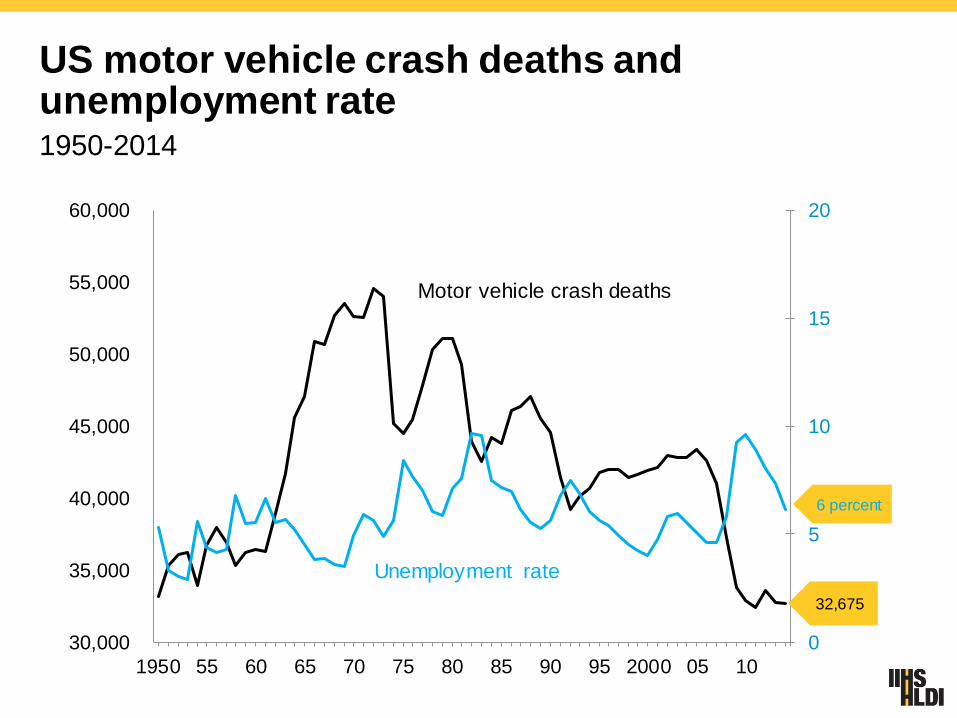
US motor vehicle crash deaths and unemployment rate1950-2014
0
5
10
15
20
30,000
35,000
40,000
45,000
50,000
55,000
60,000
1950 55 60 65 70 75 80 85 90 95 2000 05 10
Motor vehicle crash deaths
Unemployment rate
6 percent
32,675
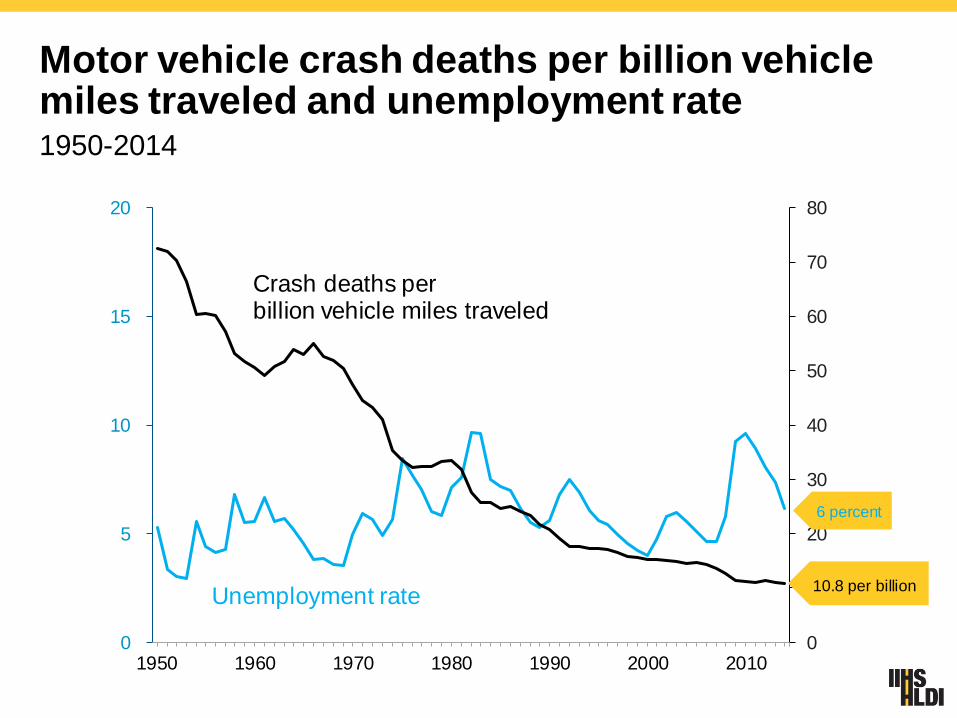
Motor vehicle crash deaths per billion vehicle miles traveled and unemployment rate1950-2014
0
10
20
30
40
50
60
70
80
0
5
10
15
20
1950 1960 1970 1980 1990 2000 2010
Unemployment rate
Crash deaths perbillion vehicle miles traveled
10.8 per billion
6 percent
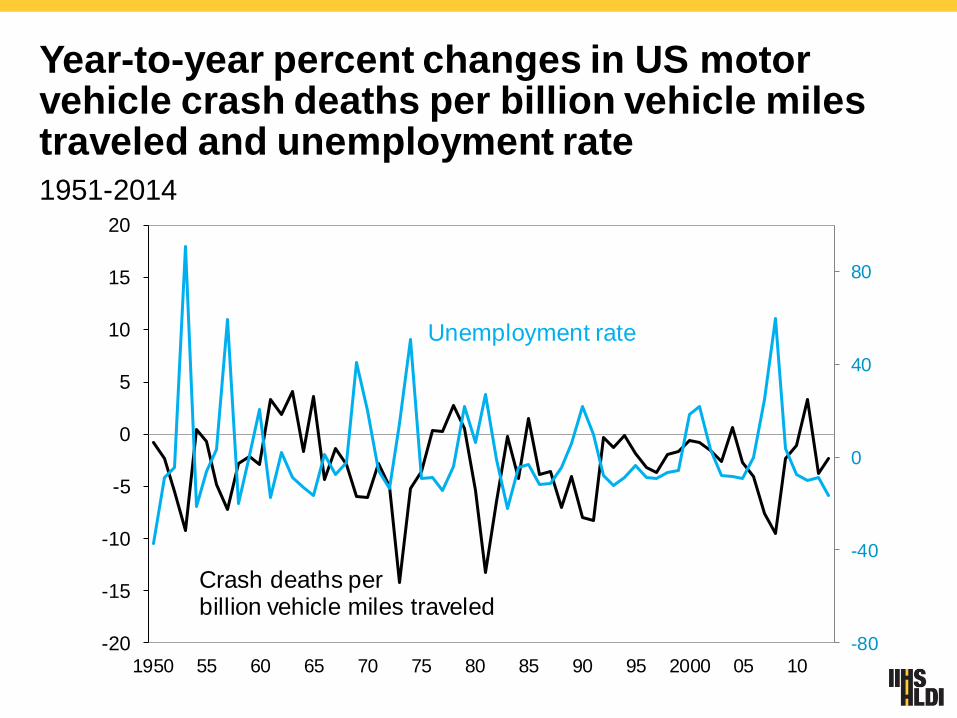
Year-to-year percent changes in US motor vehicle crash deaths per billion vehicle miles traveled and unemployment rate1951-2014
-80
-40
0
40
80
-20
-15
-10
-5
0
5
10
15
20
1950 55 60 65 70 75 80 85 90 95 2000 05 10
Crash deaths perbillion vehicle miles traveled
Unemployment rate
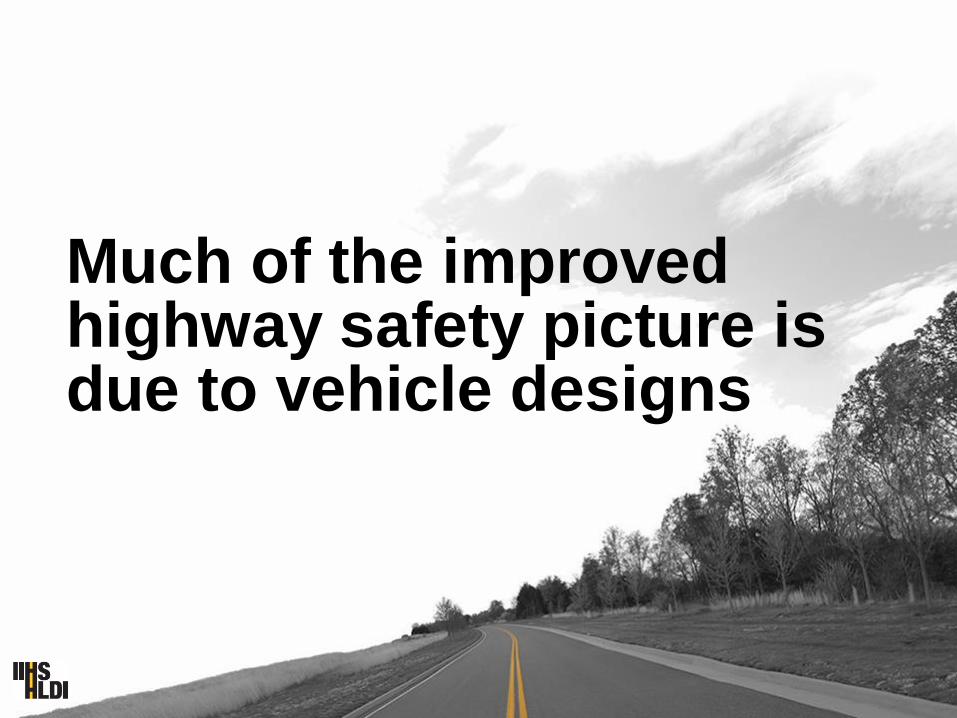
Much of the improved highway safety picture is due to vehicle designs
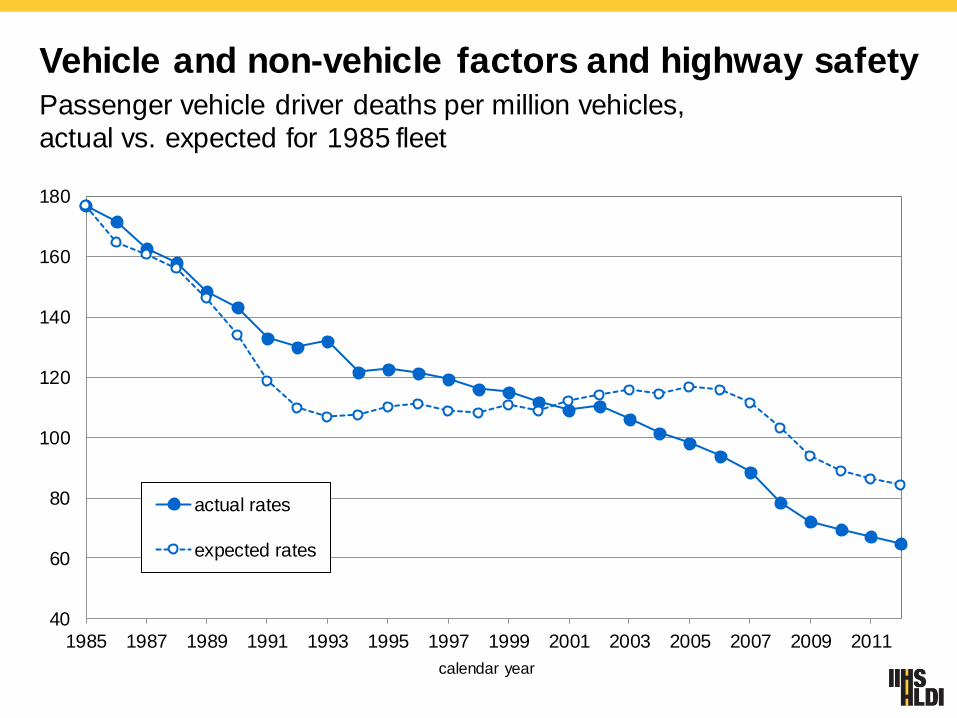
Vehicle and non-vehicle factors and highway safetyPassenger vehicle driver deaths per million vehicles,
actual vs. expected for 1985 fleet
40
60
80
100
120
140
160
180
1985 1987 1989 1991 1993 1995 1997 1999 2001 2003 2005 2007 2009 2011
calendar year
actual rates
expected rates
IIHS efforts to improve vehicle safety design
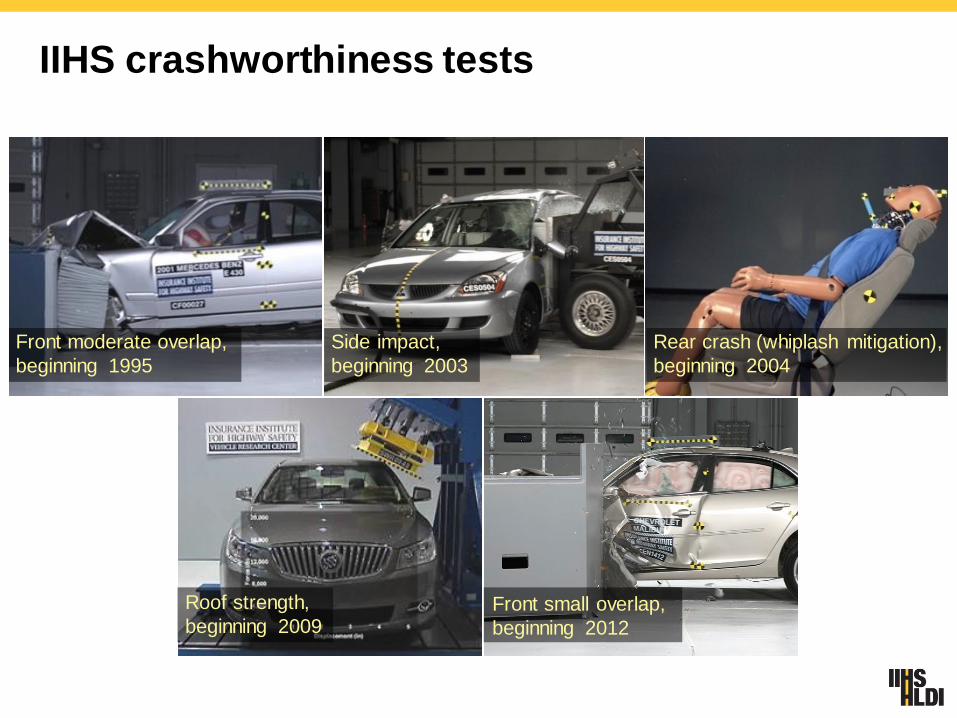
IIHS crashworthiness tests
Front small overlap,
beginning 2012
Front moderate overlap,
beginning 1995
Side impact,
beginning 2003
Rear crash (whiplash mitigation),
beginning 2004
Roof strength,
beginning 2009
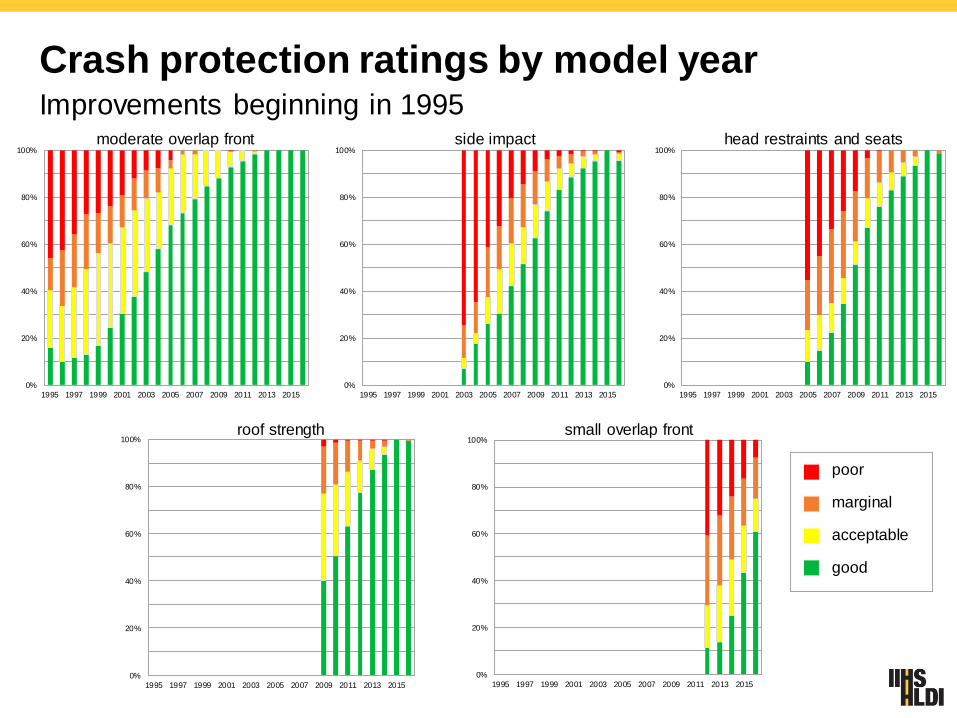
Crash protection ratings by model yearImprovements beginning in 1995
0%
20%
40%
60%
80%
100%
1995 1997 1999 2001 2003 2005 2007 2009 2011 2013 2015
0%
20%
40%
60%
80%
100%
1995 1997 1999 2001 2003 2005 2007 2009 2011 2013 2015
0%
20%
40%
60%
80%
100%
1995 1997 1999 2001 2003 2005 2007 2009 2011 2013 2015
0%
20%
40%
60%
80%
100%
1995 1997 1999 2001 2003 2005 2007 2009 2011 2013 2015
0%
20%
40%
60%
80%
100%
1995 1997 1999 2001 2003 2005 2007 2009 2011 2013 2015
moderate overlap front
roof strength small overlap front
side impact head restraints and seats
poor
marginal
acceptable
good
Death and injury reductionsGood versus poor in IIHS tests
Front offset with moderate overlap test
– Fatality risk in head-on crashes is 46 percent lower
Side impact crash test
– Fatality risk in side impact crashes 70 percent lower
– In addition to the benefit of adding side airbag protection for the head
Rear impact test (seat only)
– Neck injury risk in rear crashes is 15 percent lower
– Risk of neck injury requiring 3+ months treatment is 35 percent lower
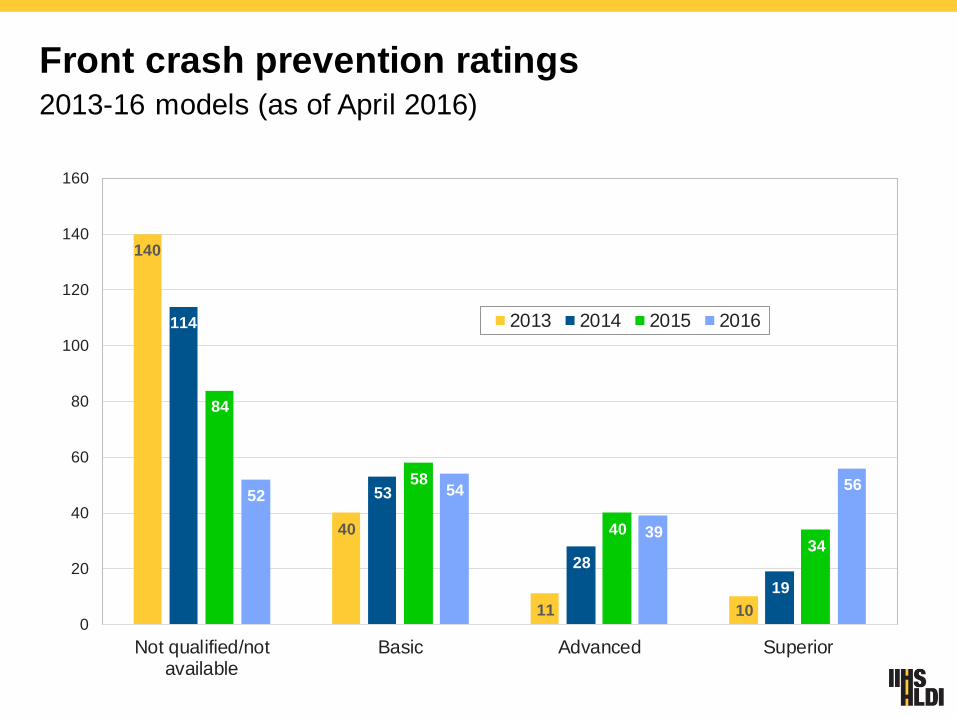
Front crash prevention ratings2013-16 models (as of April 2016)
140
40
11 10
114
53
28
19
84
58
4034
52 54
39
56
0
20
40
60
80
100
120
140
160
Not qualified/notavailable
Basic Advanced Superior
2013 2014 2015 2016
Front crash prevention systems are preventing crashes reported to insurersSystems intended to prevent front to rear crashes
10 percent reduction, on average, in property damage liability
claims for vehicles with forward collision warning
14 percent reduction, on average, in PDL claims when FCW
includes emergency autobrake
19 percent reduction in bodily injury claims for vehicles with FCW
and autobrake
If every vehicle had had FCW with autobrake in 2014, we estimate
there would have been more than 700 thousand fewer PDL claims
and more than 200 thousand fewer injury claims.
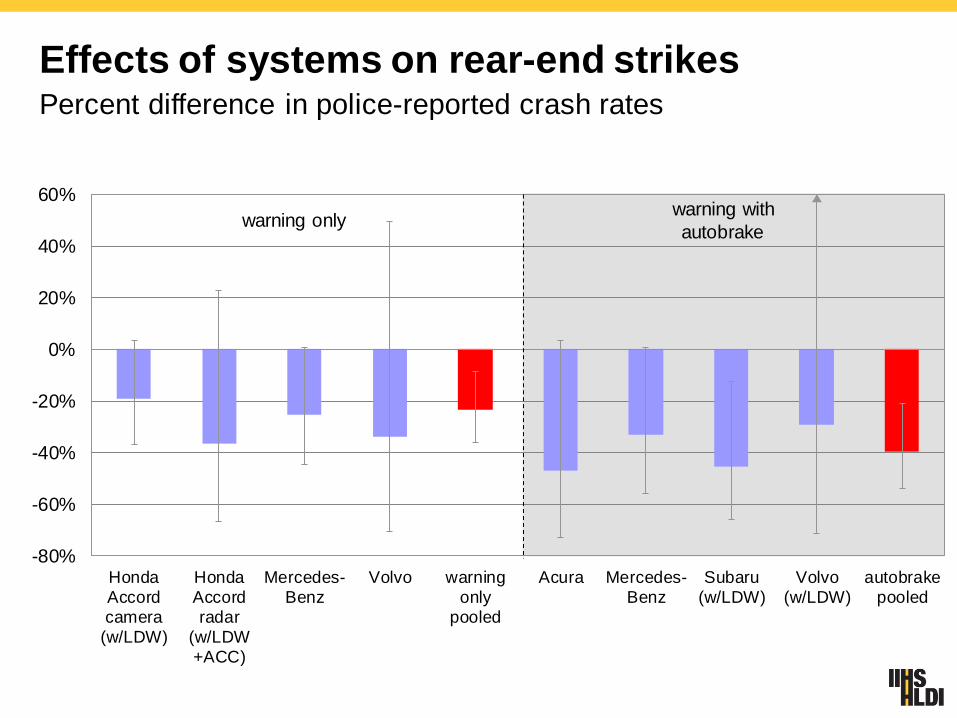
Effects of systems on rear-end strikesPercent difference in police-reported crash rates
-80%
-60%
-40%
-20%
0%
20%
40%
60%
Honda
Accord
camera(w/LDW)
Honda
Accord
radar(w/LDW+ACC)
Mercedes-
Benz
Volvo warning
only
pooled
Acura Mercedes-
Benz
Subaru
(w/LDW)
Volvo
(w/LDW)
autobrake
pooled
warning onlywarning with
autobrake
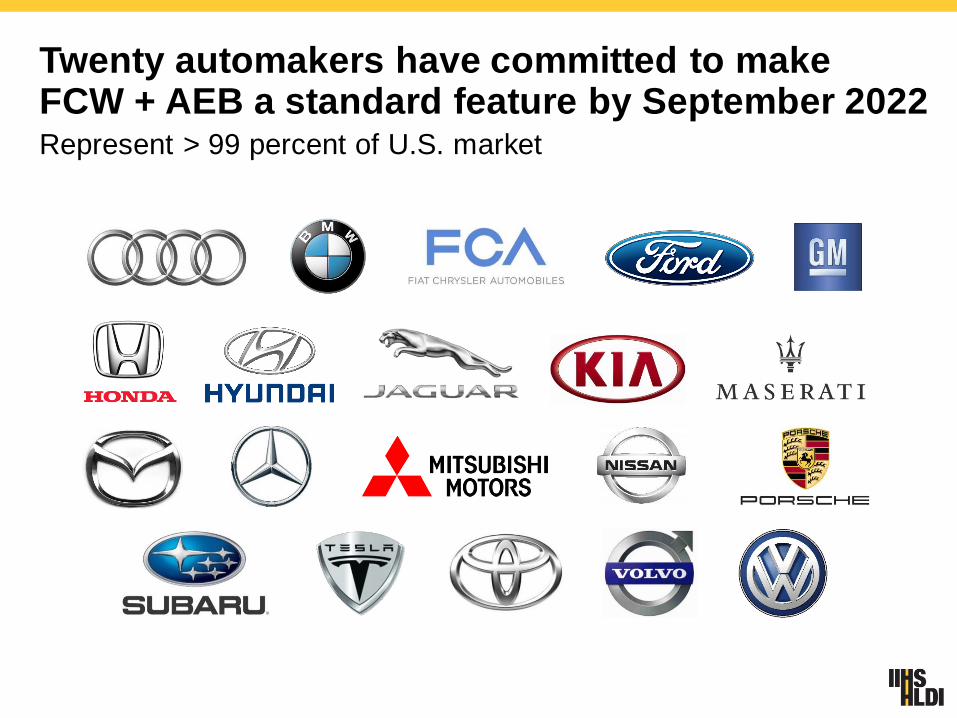
Twenty automakers have committed to makeFCW + AEB a standard feature by September 2022Represent > 99 percent of U.S. market
Are autonomous vehicles the “next big thing?”
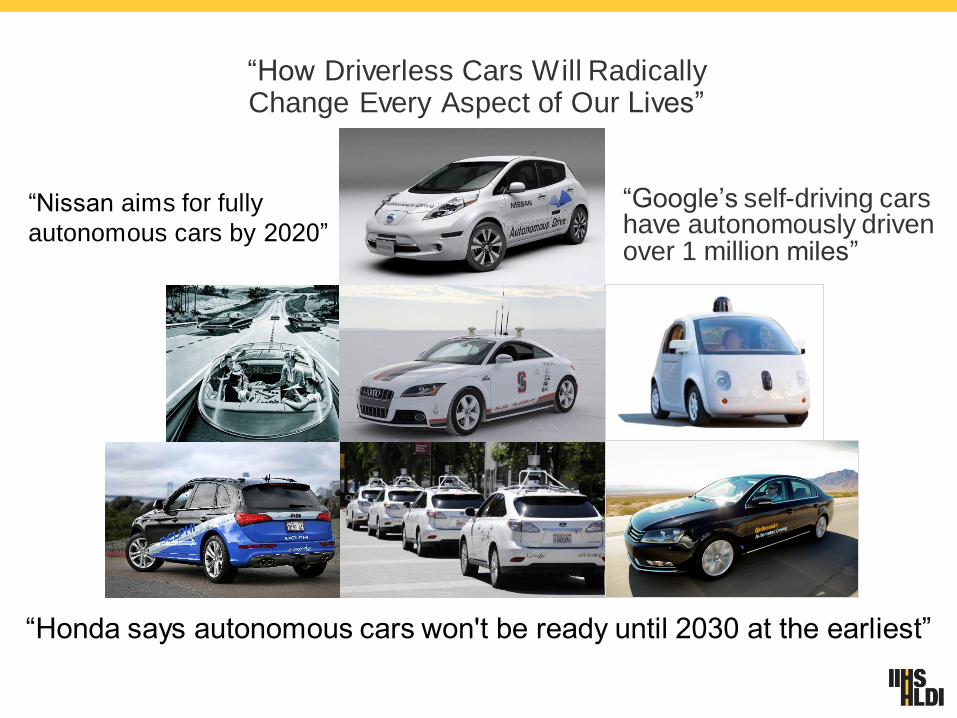
“How Driverless Cars Will RadicallyChange Every Aspect of Our Lives”
“Google’s self-driving cars have autonomously driven over 1 million miles”
“Honda says autonomous cars won't be ready until 2030 at the earliest”
“Nissan aims for fully
autonomous cars by 2020”
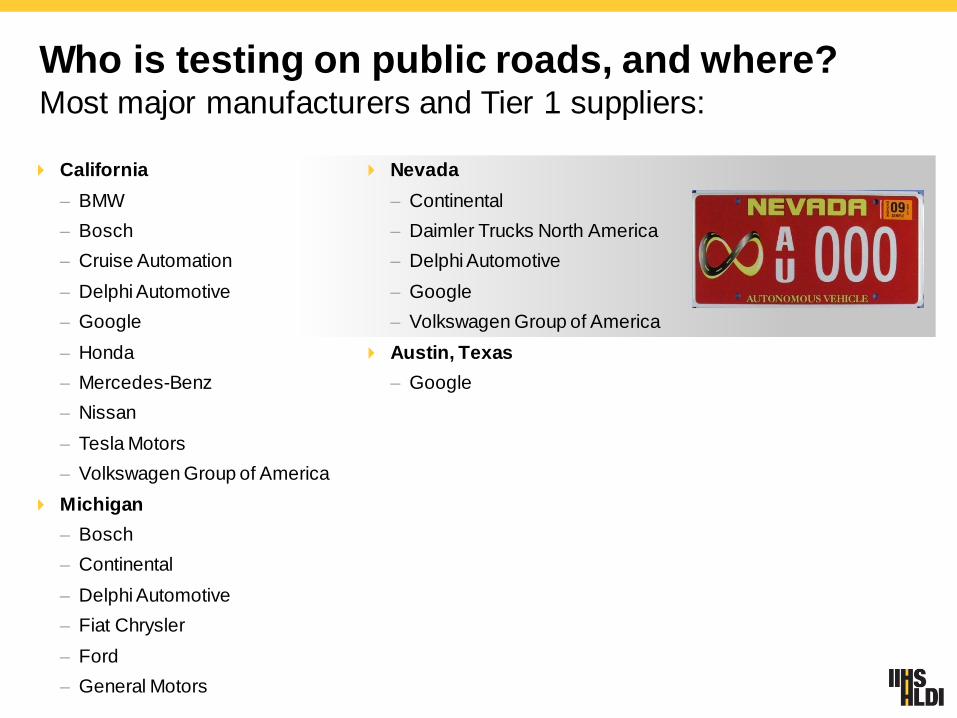
Who is testing on public roads, and where?Most major manufacturers and Tier 1 suppliers:
California
– BMW
– Bosch
– Cruise Automation
– Delphi Automotive
– Honda
– Mercedes-Benz
– Nissan
– Tesla Motors
– Volkswagen Group of America
Michigan
– Bosch
– Continental
– Delphi Automotive
– Fiat Chrysler
– Ford
– General Motors
Nevada
– Continental
– Daimler Trucks North America
– Delphi Automotive
– Volkswagen Group of America
Austin, Texas
14
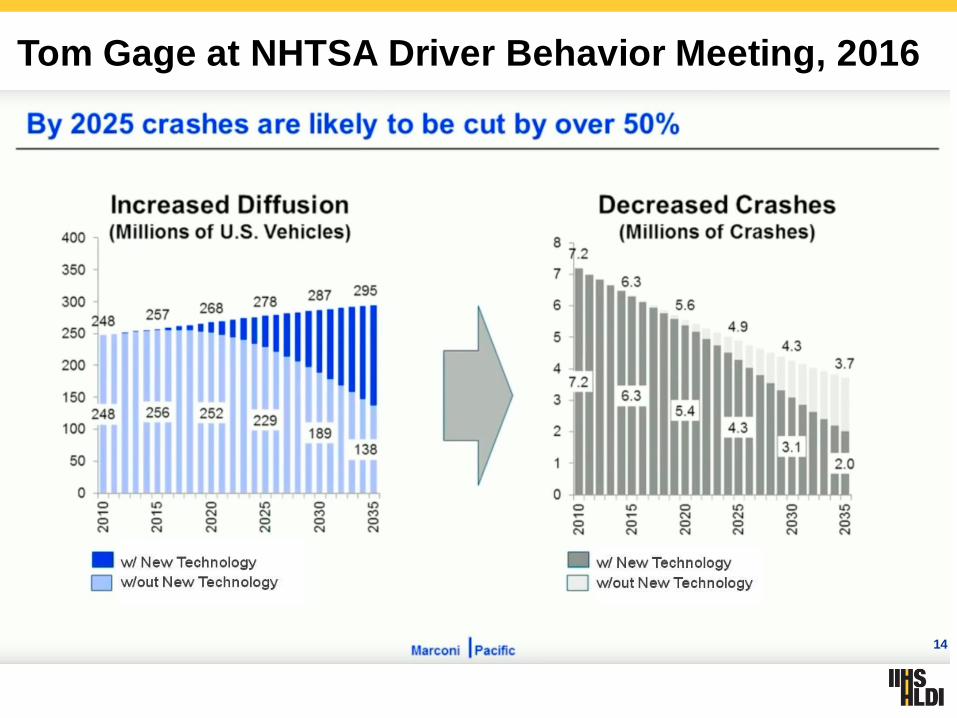
Tom Gage at NHTSA Driver Behavior Meeting, 2016
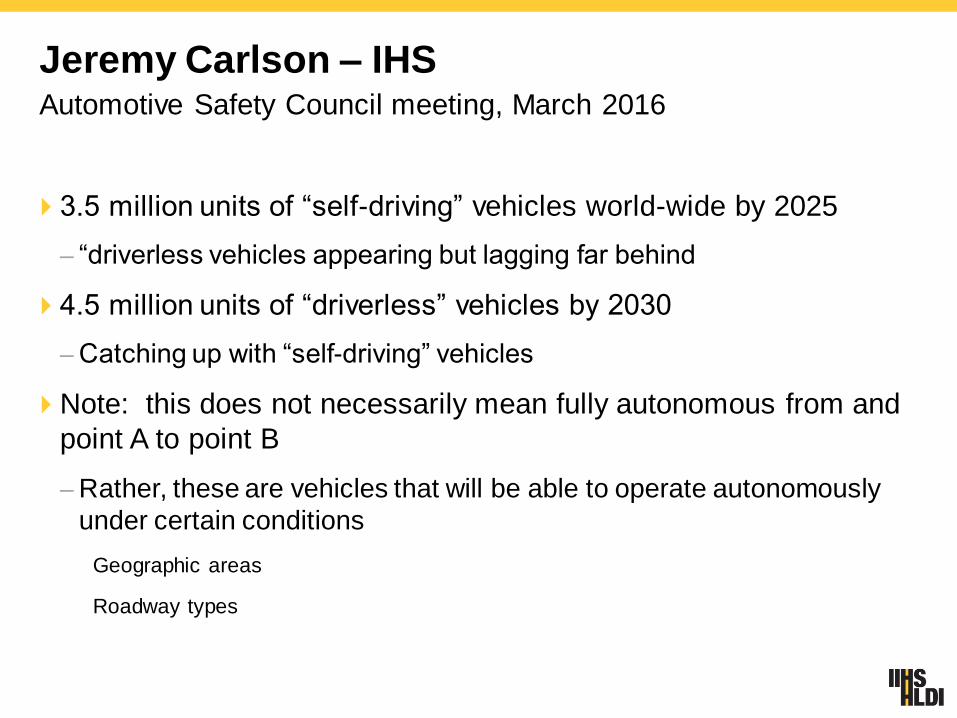
Jeremy Carlson – IHS Automotive Safety Council meeting, March 2016
3.5 million units of “self-driving” vehicles world-wide by 2025
– “driverless vehicles appearing but lagging far behind
4.5 million units of “driverless” vehicles by 2030
– Catching up with “self-driving” vehicles
Note: this does not necessarily mean fully autonomous from and
point A to point B
– Rather, these are vehicles that will be able to operate autonomously
under certain conditions
Geographic areas
Roadway types
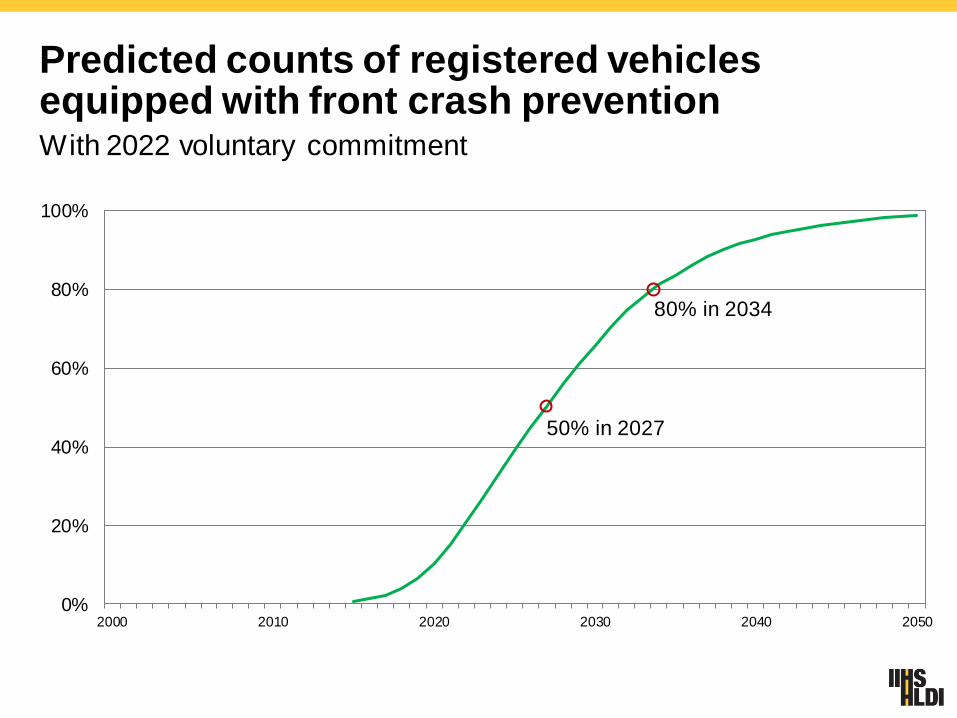
0%
20%
40%
60%
80%
100%
2000 2010 2020 2030 2040 2050
50% in 2027
80% in 2034
Predicted counts of registered vehicles equipped with front crash preventionWith 2022 voluntary commitment

Next steps incrash avoidance
Headlight rating system
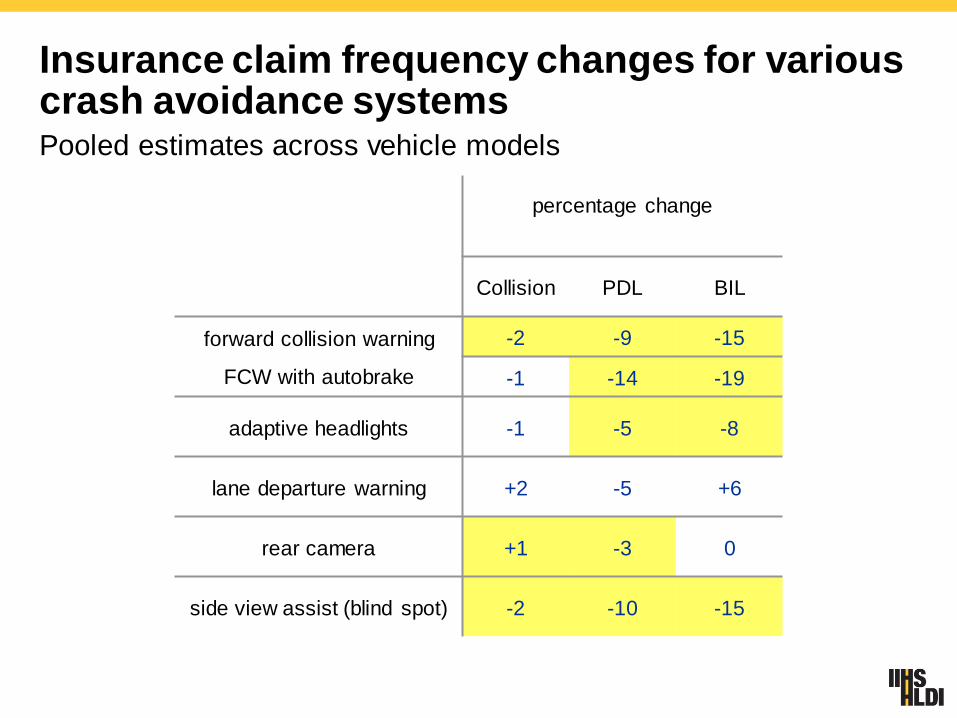
percentage change
Collision PDL BIL
forward collision warning
FCW with autobrake
-2 -9 -15
-1 -14 -19
adaptive headlights -1 -5 -8
lane departure warning +2 -5 +6
rear camera +1 -3 0
side view assist (blind spot) -2 -10 -15
Insurance claim frequency changes for various crash avoidance systemsPooled estimates across vehicle models
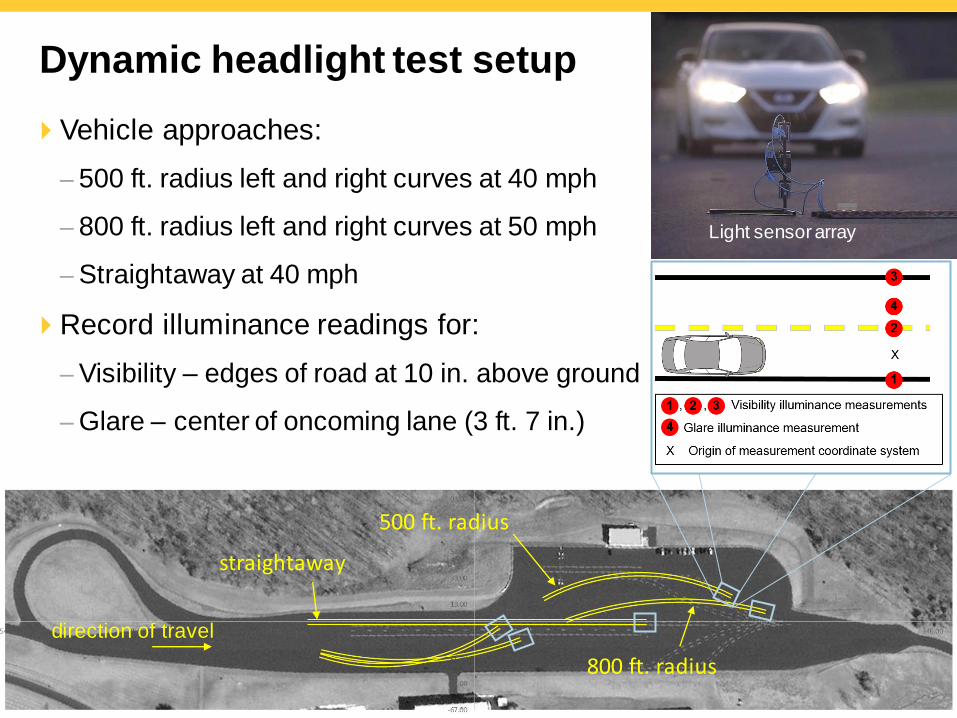
Vehicle approaches:
– 500 ft. radius left and right curves at 40 mph
– 800 ft. radius left and right curves at 50 mph
– Straightaway at 40 mph
Record illuminance readings for:
– Visibility – edges of road at 10 in. above ground
– Glare – center of oncoming lane (3 ft. 7 in.)
Dynamic headlight test setup
800 ft. radius
500 ft. radius
straightaway
direction of travel
Light sensorarray
Translating test results to ratings
Rating based on distance at which illumination is 5 lux:
– Straightaway and curves (weighting roughly 60/40)
– Low and high beams (weighting roughly 75/25)
– Acceptable glare (marginal is best rating possible for system with glare)
Bonus given for automatic high beams (“high beam assist”)
Results of all tests combined into an overall demerit score with
rating boundaries applied
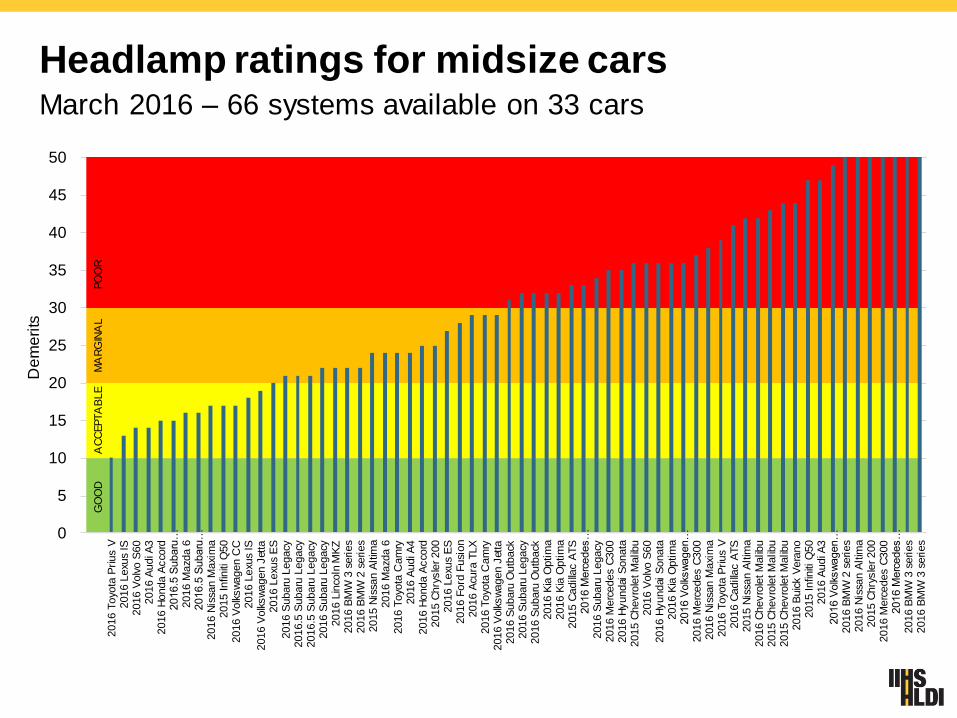
Headlamp ratings for midsize carsMarch 2016 – 66 systems available on 33 cars
0
5
10
15
20
25
30
35
40
45
50
2016 T
oyo
ta P
rius V
2016 L
exu
s IS
2016 V
olv
o S
60
2016 A
udi A
32016 H
onda A
cco
rd2016.5
Subaru
…2016 M
azd
a 6
2016.5
Subaru
…2016 N
issa
n M
axi
ma
2015 Infin
iti Q
50
2016 V
olk
sw
agen C
C2016 L
exu
s IS
2016 V
olk
sw
agen J
etta
2016 L
exu
s E
S2016 S
ubaru
Legacy
2016.5
Subaru
Legacy
2016.5
Subaru
Legacy
2016 S
ubaru
Legacy
2016 L
inco
ln M
KZ
2016 B
MW
3 s
eries
2016 B
MW
2 s
eries
2015 N
issa
n A
ltim
a2016 M
azd
a 6
2016 T
oyo
ta C
am
ry2016 A
udi A
42016 H
onda A
cco
rd2015 C
hry
sle
r 200
2016 L
exu
s E
S2016 F
ord
Fusi
on
2016 A
cura
TLX
2016 T
oyo
ta C
am
ry2016 V
olk
sw
agen J
etta
2016 S
ubaru
Outb
ack
2016 S
ubaru
Legacy
2016 S
ubaru
Outb
ack
2016 K
ia O
ptim
a2016 K
ia O
ptim
a2015 C
adill
ac A
TS
2016 M
erc
edes…
2016 S
ubaru
Legacy
2016 M
erc
edes C
300
2016 H
yundai
Sonata
2015 C
hevro
let M
alib
u2016 V
olv
o S
60
2016 H
yundai
Sonata
2016 K
ia O
ptim
a2016 V
olk
sw
agen…
2016 M
erc
edes C
300
2016 N
issa
n M
axi
ma
2016 T
oyo
ta P
rius V
2016 C
adill
ac A
TS
2015 N
issa
n A
ltim
a2016 C
hevro
let M
alib
u2015 C
hevro
let M
alib
u2015 C
hevro
let M
alib
u2016 B
uic
k V
era
no
2015 Infin
iti Q
50
2016 A
udi A
32016 V
olk
sw
agen…
2016 B
MW
2 s
eries
2016 N
issa
n A
ltim
a2015 C
hry
sle
r 200
2016 M
erc
edes C
300
2016 M
erc
edes…
2016 B
MW
3 s
eries
2016 B
MW
3 s
eries
De
me
rits
AC
CEPTA
BLE
MA
RG
INA
LPO
OR
GO
OD
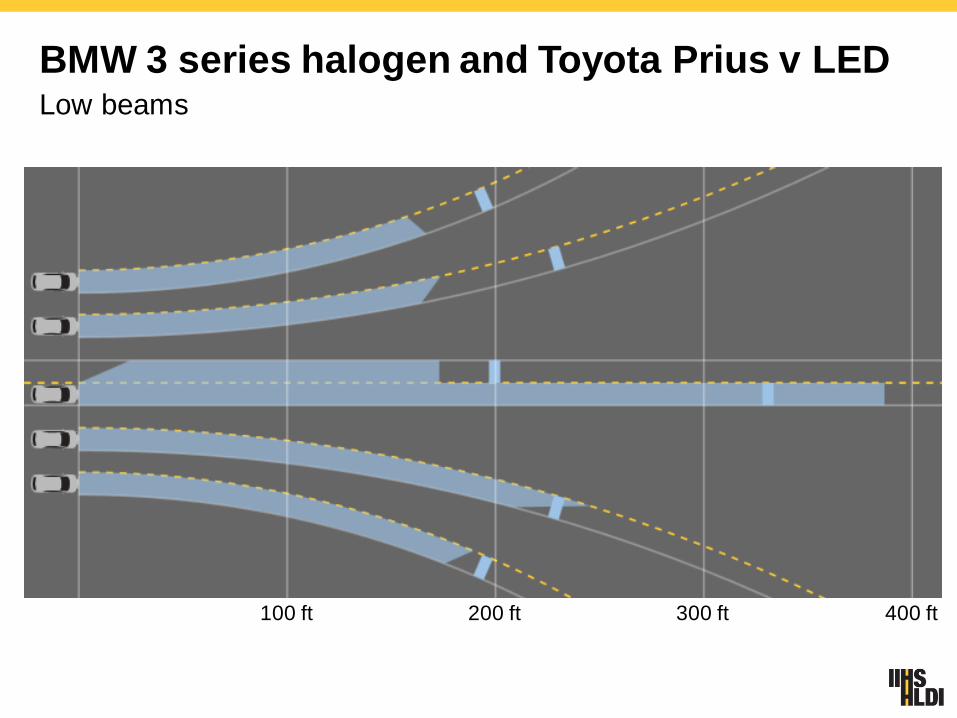
BMW 3 series halogen and Toyota Prius v LED Low beams
100 ft 200 ft 300 ft 400 ft
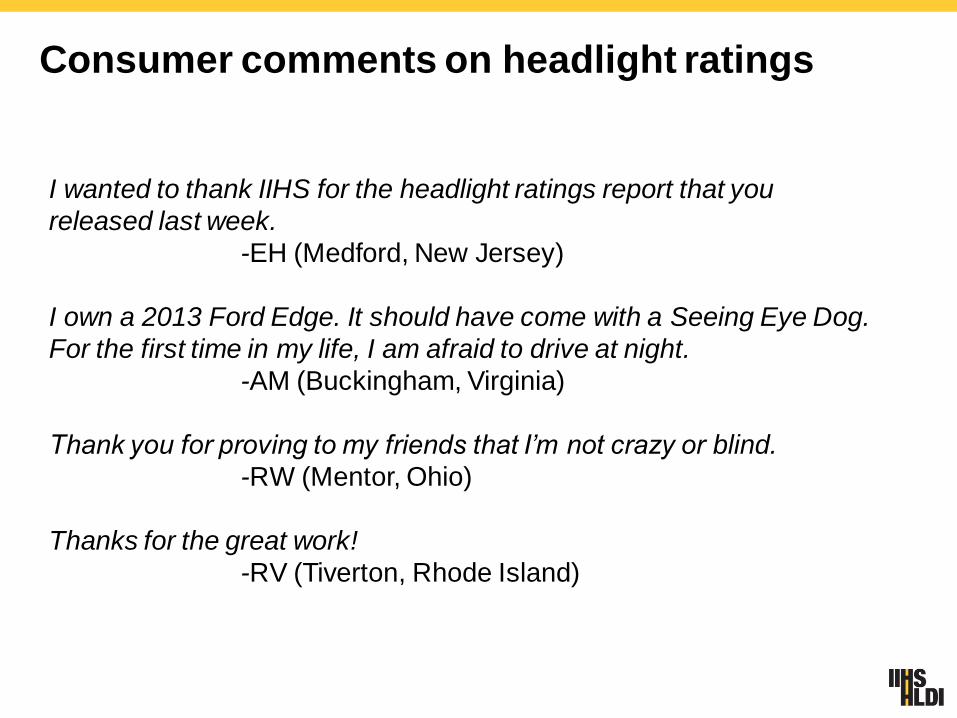
Consumer comments on headlight ratings
I wanted to thank IIHS for the headlight ratings report that you
released last week.
-EH (Medford, New Jersey)
I own a 2013 Ford Edge. It should have come with a Seeing Eye Dog.
For the first time in my life, I am afraid to drive at night.
-AM (Buckingham, Virginia)
Thank you for proving to my friends that I’m not crazy or blind.
-RW (Mentor, Ohio)
Thanks for the great work!
-RV (Tiverton, Rhode Island)
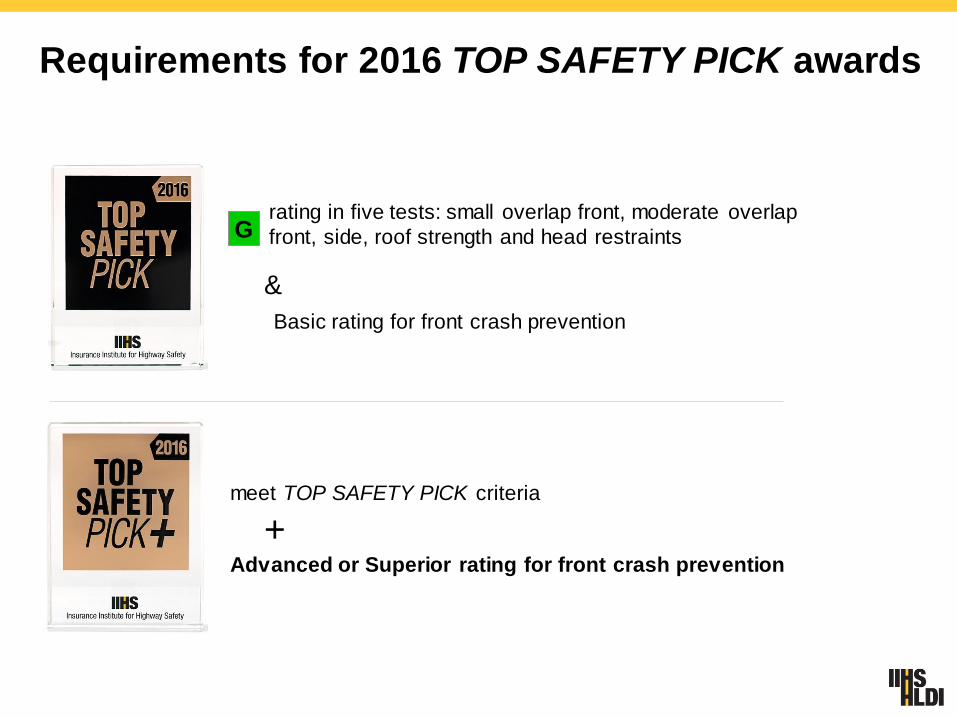
Requirements for 2016 TOP SAFETY PICK awards
rating in five tests: small overlap front, moderate overlap
front, side, roof strength and head restraintsG
meet TOP SAFETY PICK criteria
+Advanced or Superior rating for front crash prevention
&
Basic rating for front crash prevention
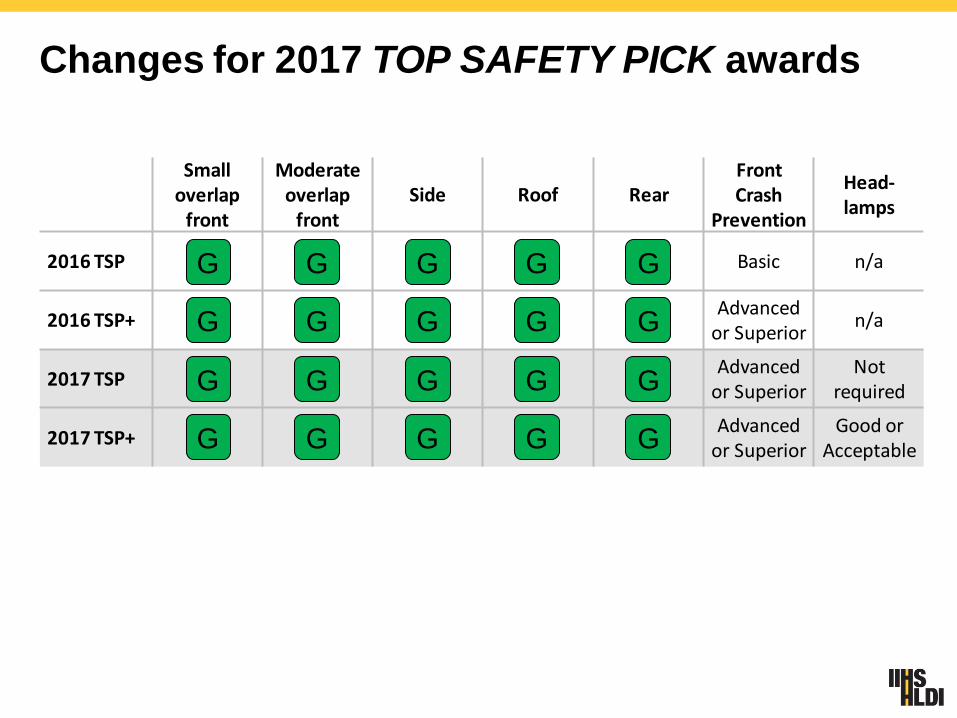
Changes for 2017 TOP SAFETY PICK awards
Small overlap
front
Moderate overlap
frontSide Roof Rear
FrontCrash
Prevention
Head-lamps
2016 TSP Basic n/a
2016 TSP+Advanced
or Superiorn/a
2017 TSPAdvanced
or SuperiorNot
required
2017 TSP+Advanced
or SuperiorGood or
Acceptable
G
G
G
G
G
G
G
G
G
G
G
G
G
G
G
G
G
G
G
G
Rear crash prevention
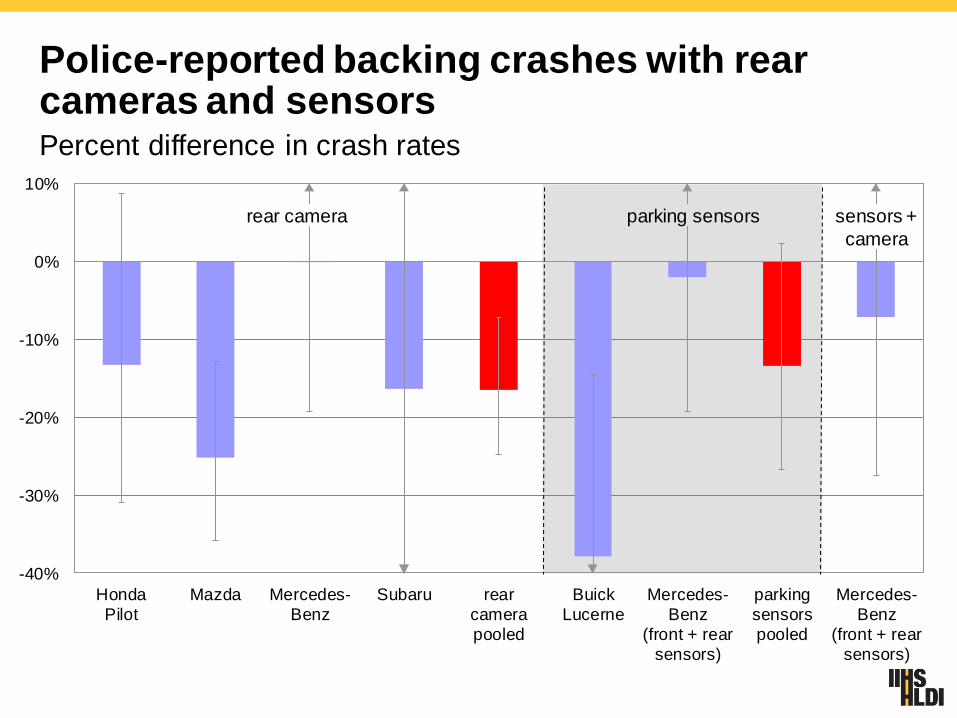
-40%
-30%
-20%
-10%
0%
10%
HondaPilot
Mazda Mercedes-Benz
Subaru rearcamerapooled
BuickLucerne
Mercedes-Benz
(front + rearsensors)
parkingsensorspooled
Mercedes-Benz
(front + rearsensors)
Police-reported backing crashes with rear cameras and sensorsPercent difference in crash rates
rear camera parking sensors sensors +
camera
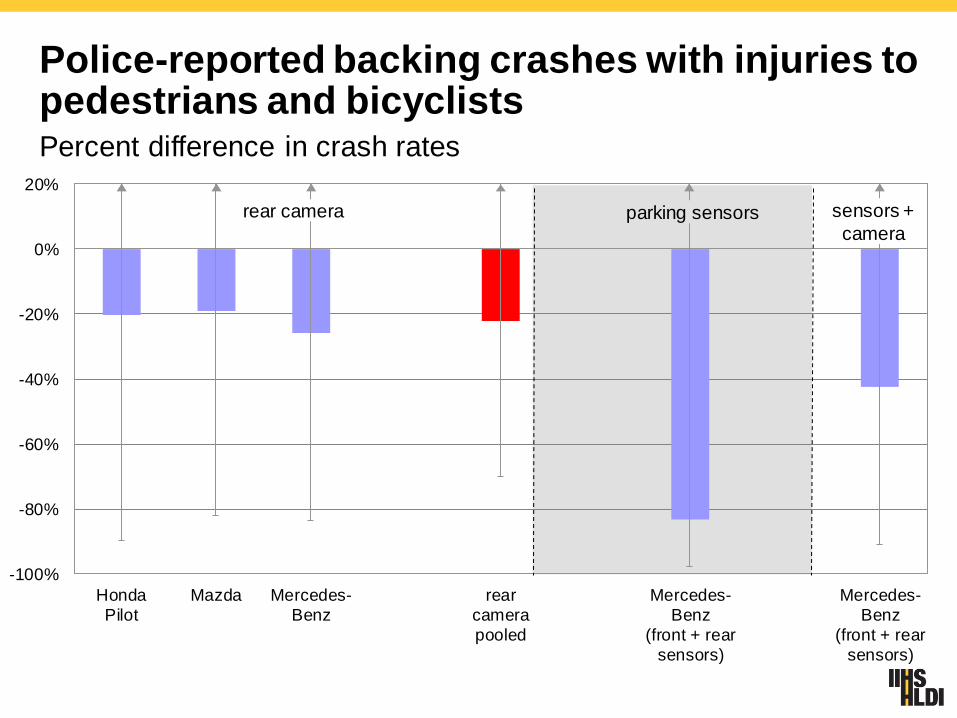
-100%
-80%
-60%
-40%
-20%
0%
20%
Honda
PilotMazda Mercedes-
Benzrear
camerapooled
Mercedes-
Benz(front + rear
sensors)
Mercedes-
Benz(front + rear
sensors)
Police-reported backing crashes with injuries to pedestrians and bicyclistsPercent difference in crash rates
rear camera parking sensors sensors +
camera
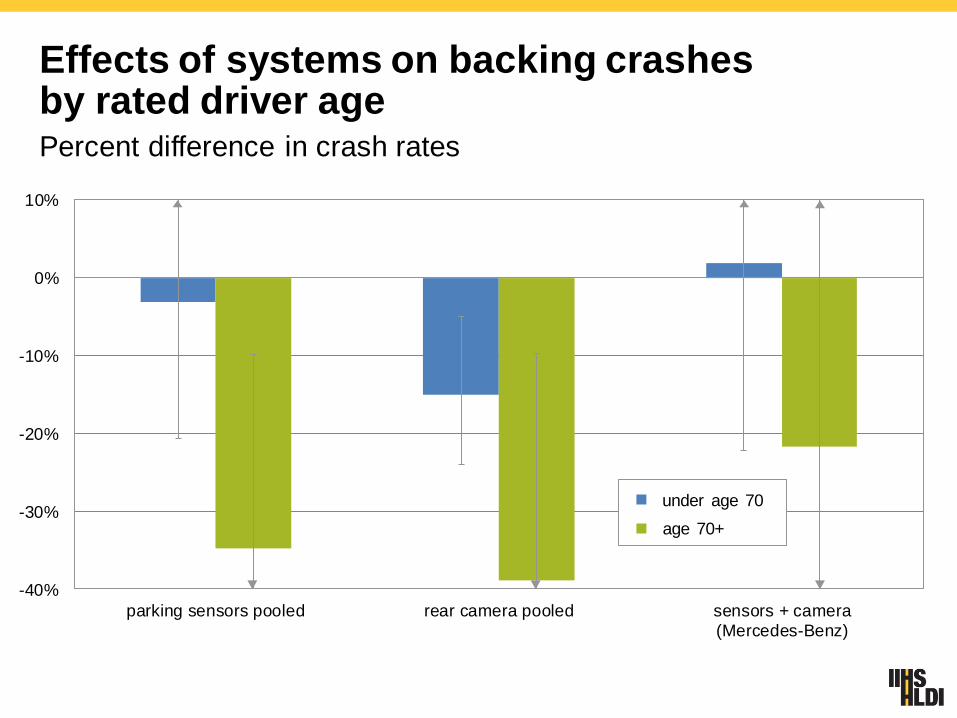
Effects of systems on backing crashes by rated driver agePercent difference in crash rates
-40%
-30%
-20%
-10%
0%
10%
parking sensors pooled rear camera pooled sensors + camera(Mercedes-Benz)
under age 70
age 70+
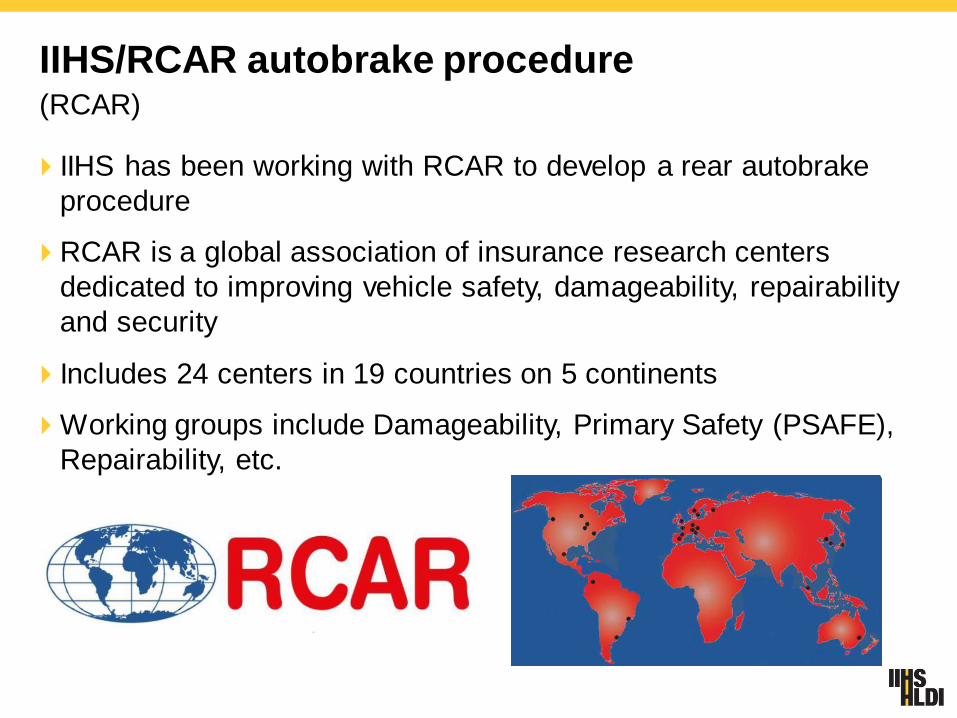
IIHS/RCAR autobrake procedure(RCAR)
IIHS has been working with RCAR to develop a rear autobrake
procedure
RCAR is a global association of insurance research centers
dedicated to improving vehicle safety, damageability, repairability
and security
Includes 24 centers in 19 countries on 5 continents
Working groups include Damageability, Primary Safety (PSAFE),
Repairability, etc.
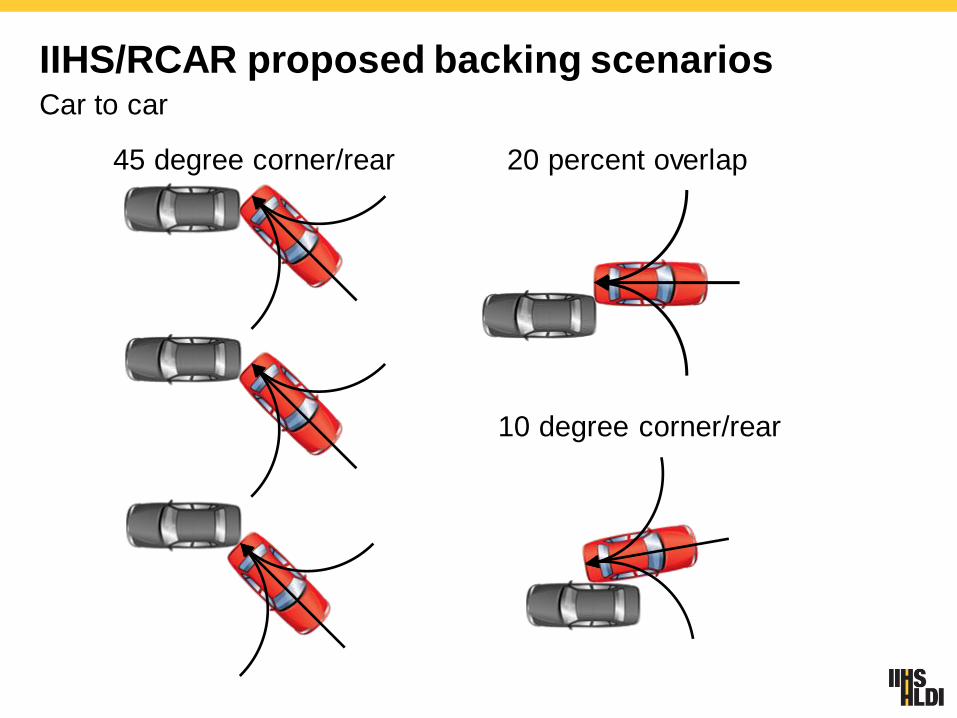
IIHS/RCAR proposed backing scenariosCar to car
10 degree corner/rear
20 percent overlap45 degree corner/rear
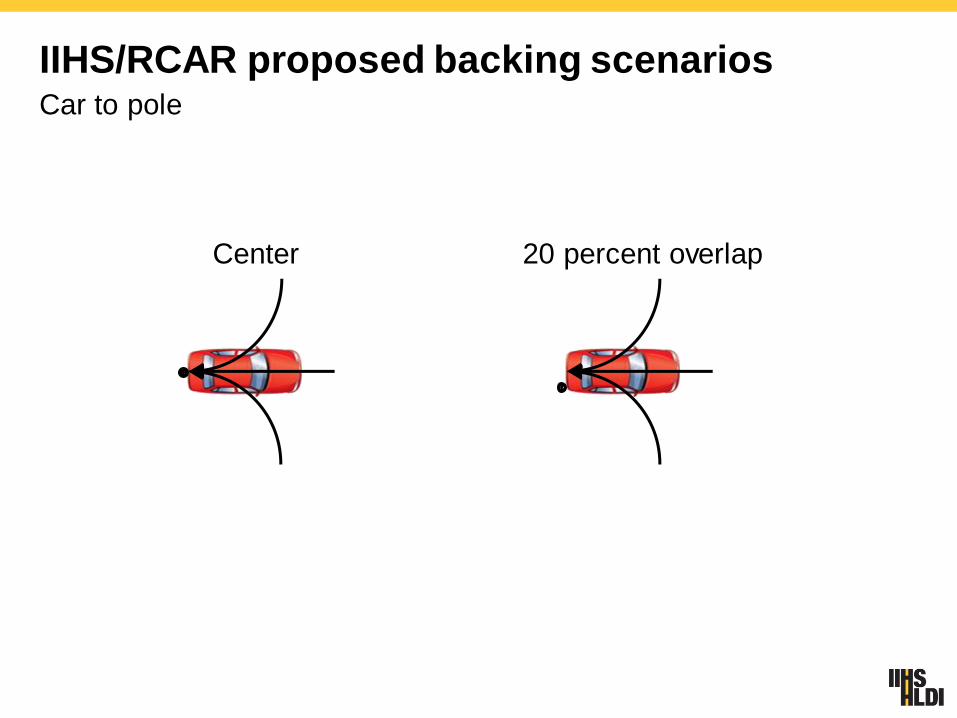
IIHS/RCAR proposed backing scenariosCar to pole
20 percent overlapCenter
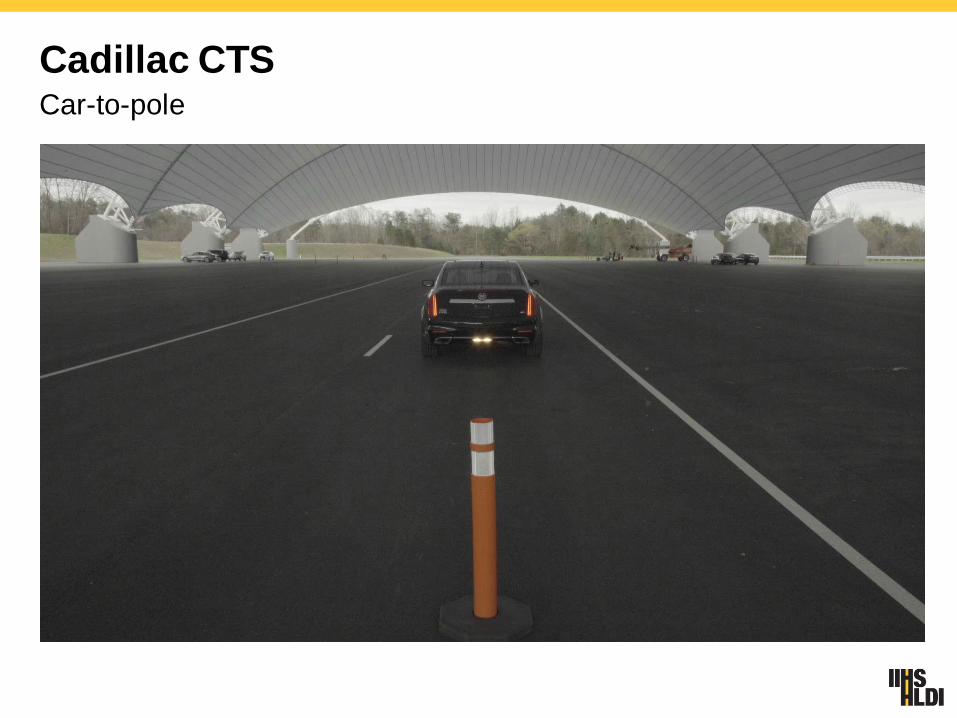
Cadillac CTSCar-to-pole
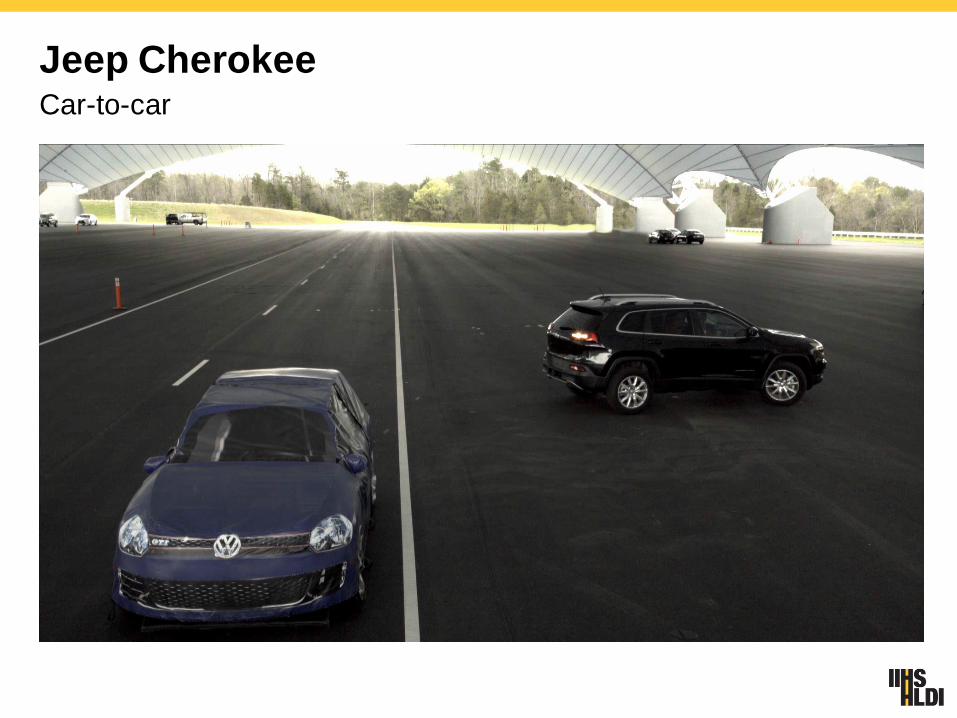
Jeep CherokeeCar-to-car
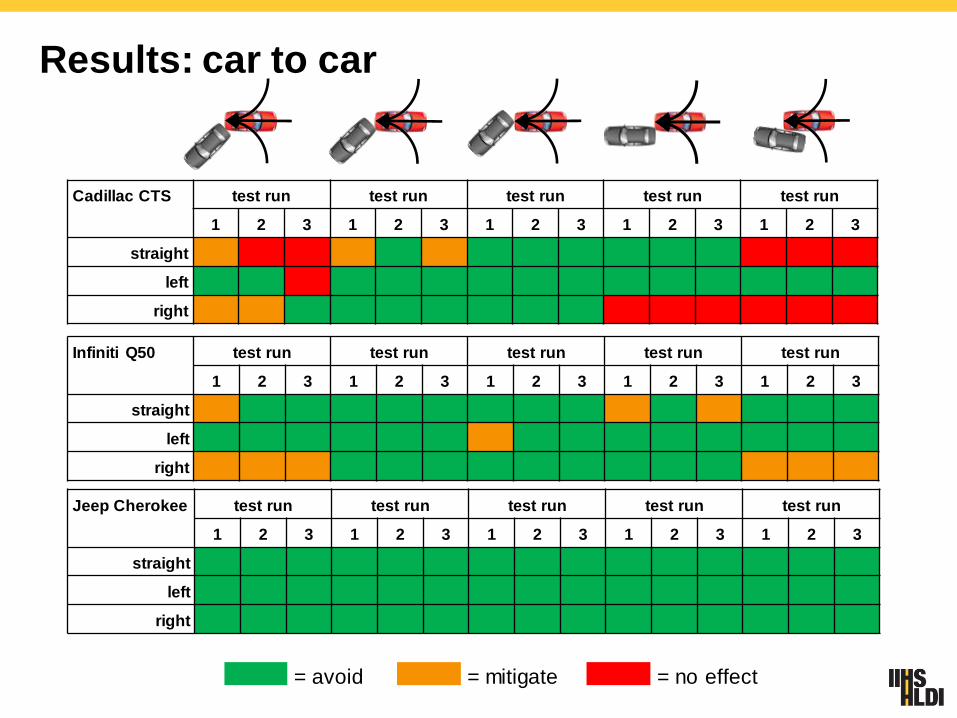
Results: car to car
Cadillac CTS test run test run test run test run test run
1 2 3 1 2 3 1 2 3 1 2 3 1 2 3
straight
left
right
Infiniti Q50 test run test run test run test run test run
1 2 3 1 2 3 1 2 3 1 2 3 1 2 3
straight
left
right
Jeep Cherokee test run test run test run test run test run
1 2 3 1 2 3 1 2 3 1 2 3 1 2 3
straight
left
right
= avoid = mitigate = no effect
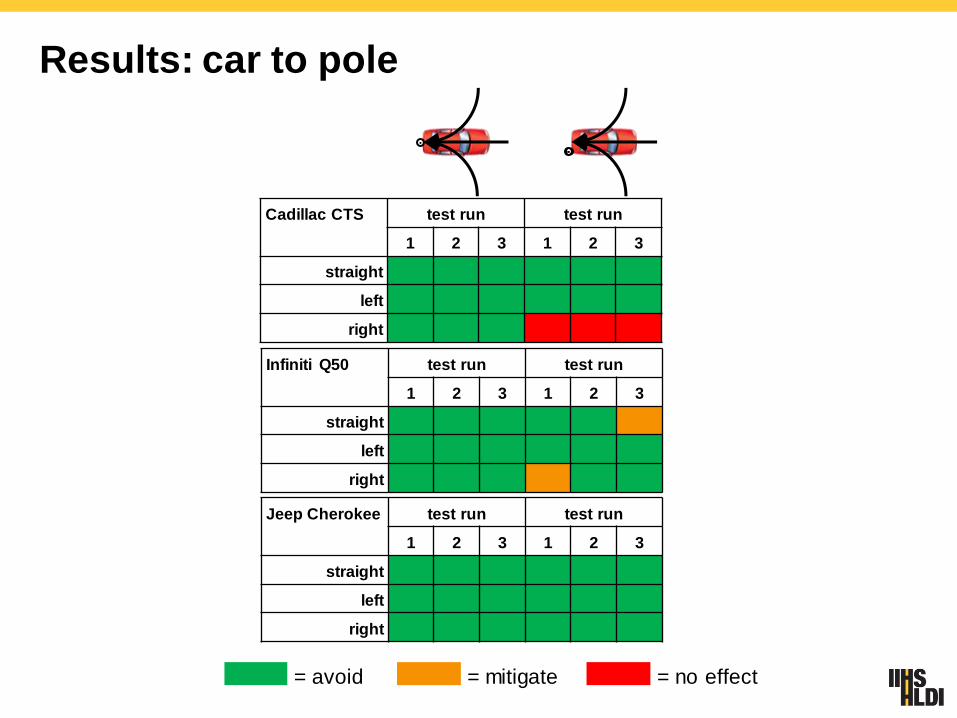
Results: car to pole
Cadillac CTS test run test run
1 2 3 1 2 3
straight
left
right
Infiniti Q50 test run test run
1 2 3 1 2 3
straight
left
right
Jeep Cherokee test run test run
1 2 3 1 2 3
straight
left
right
= avoid = mitigate = no effect
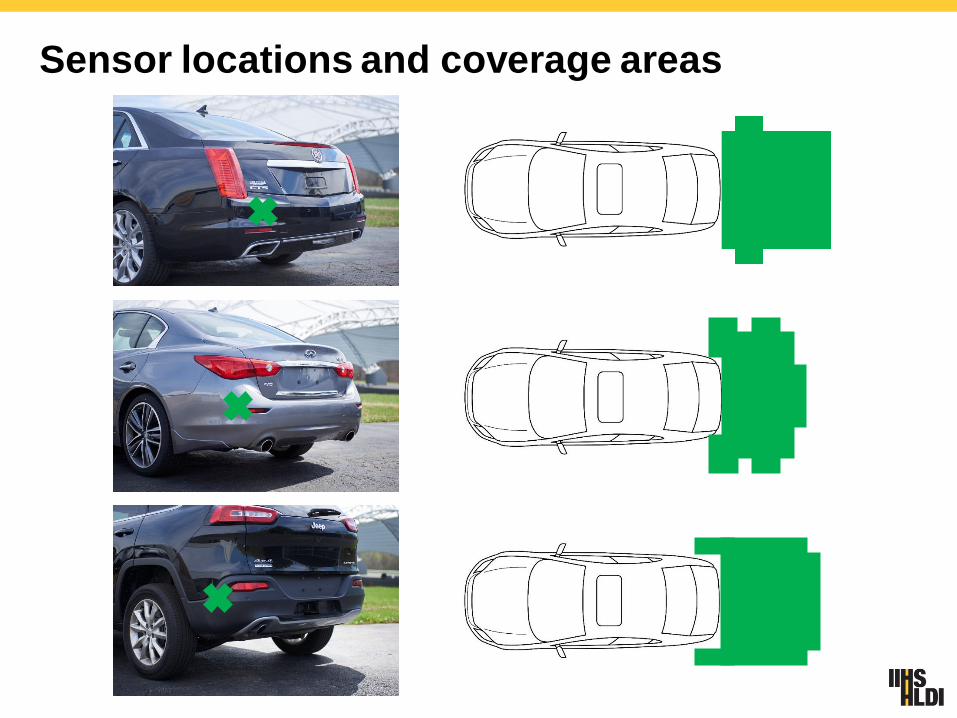
Sensor locations and coverage areas
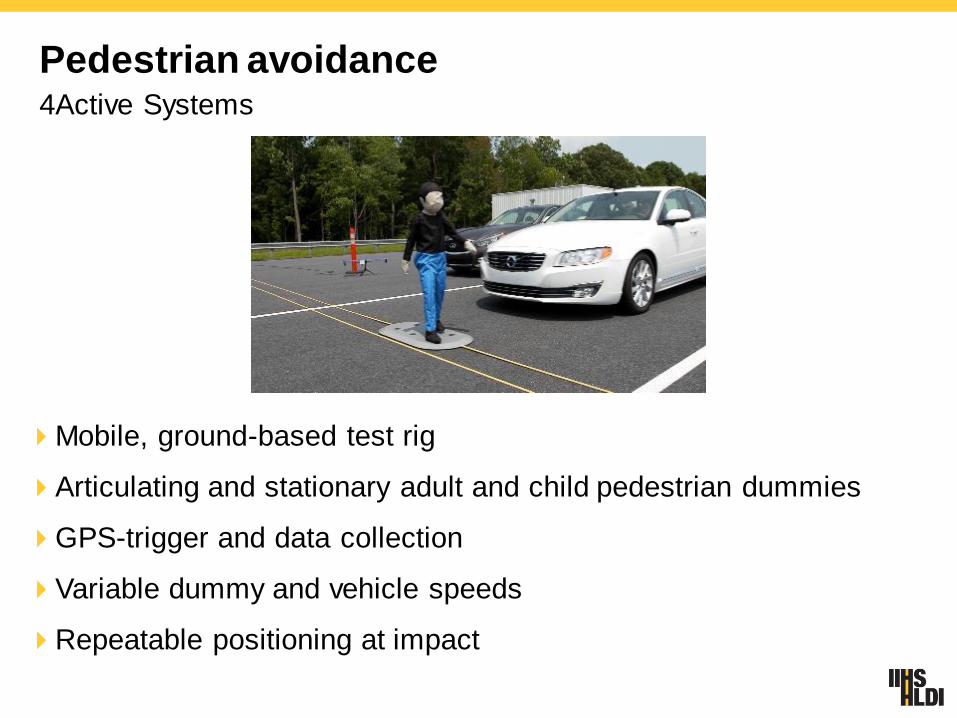
Pedestrian avoidance4Active Systems
Mobile, ground-based test rig
Articulating and stationary adult and child pedestrian dummies
GPS-trigger and data collection
Variable dummy and vehicle speeds
Repeatable positioning at impact
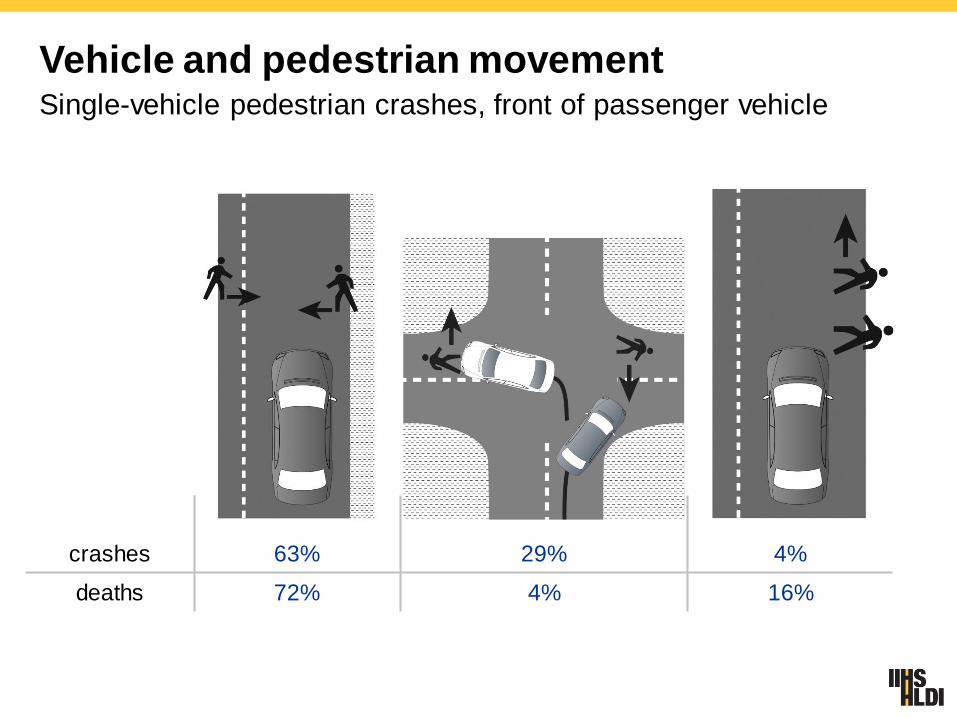
Vehicle and pedestrian movementSingle-vehicle pedestrian crashes, front of passenger vehicle
crashes 63% 29% 4%
deaths 72% 4% 16%
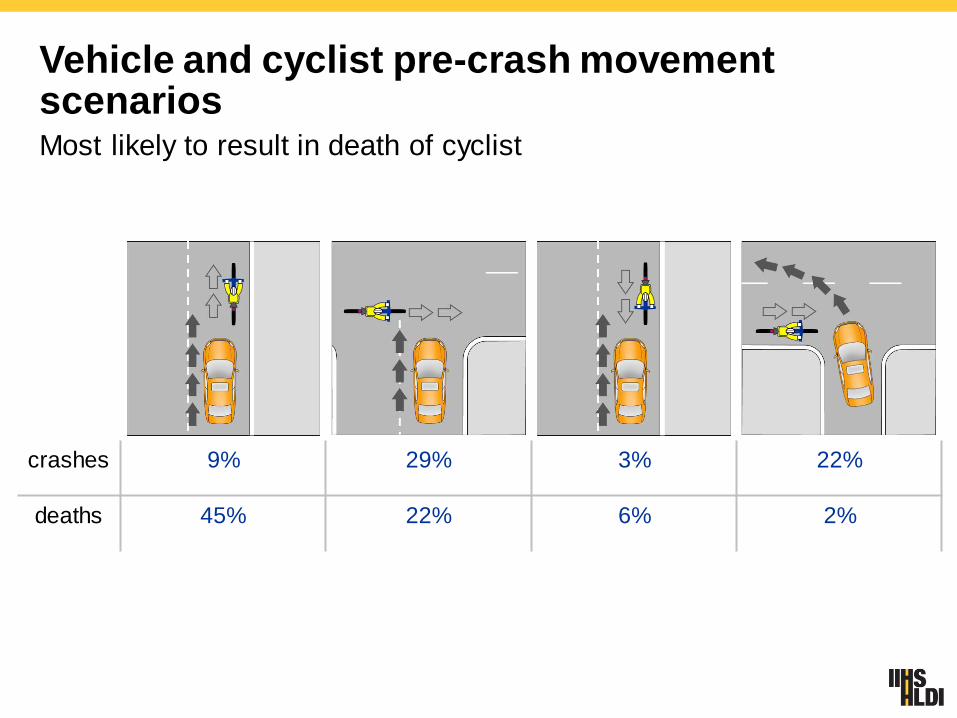
Vehicle and cyclist pre-crash movement scenariosMost likely to result in death of cyclist
crashes 9% 29% 3% 22%
deaths 45% 22% 6% 2%

Crashworthiness

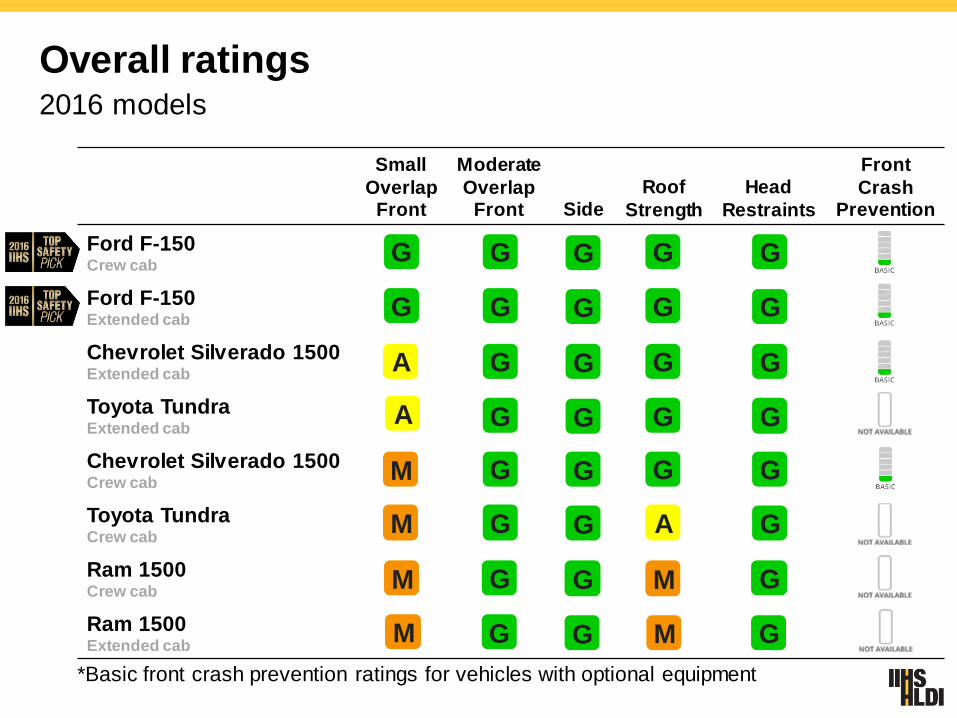
Overall ratings2016 models
Small
Overlap Front
Moderate
Overlap Front Side
Roof
Strength
Head
Restraints
Front
CrashPrevention
Ford F-150Crew cab
Ford F-150Extended cab
Chevrolet Silverado 1500Extended cab
Toyota TundraExtended cab
Chevrolet Silverado 1500Crew cab
Toyota TundraCrew cab
Ram 1500Crew cab
Ram 1500Extended cab
G G G G G
G G G G G
G G G G
G G G G
G G G G
G G G
G G G
G G G
A
M
A
AM
M
M
M
M
*Basic front crash prevention ratings for vehicles with optional equipment
Passenger-sidesmall overlap testing
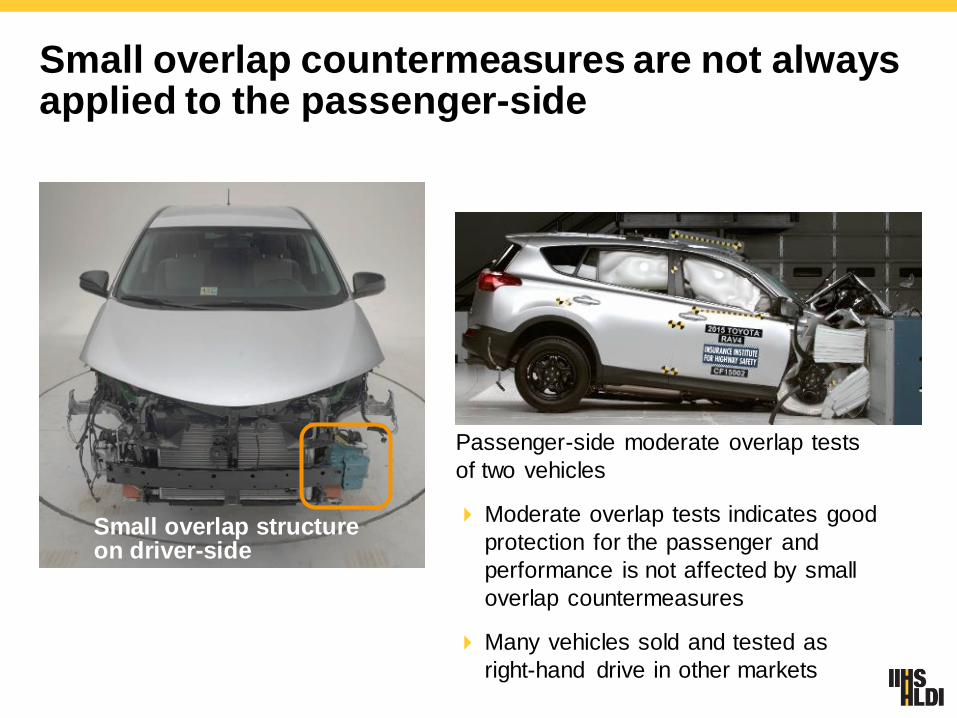
Small overlap countermeasures are not always applied to the passenger-side
Passenger-side moderate overlap tests
of two vehicles
Moderate overlap tests indicates good
protection for the passenger and
performance is not affected by small
overlap countermeasures
Many vehicles sold and tested as
right-hand drive in other markets
Small overlap structure on driver-side
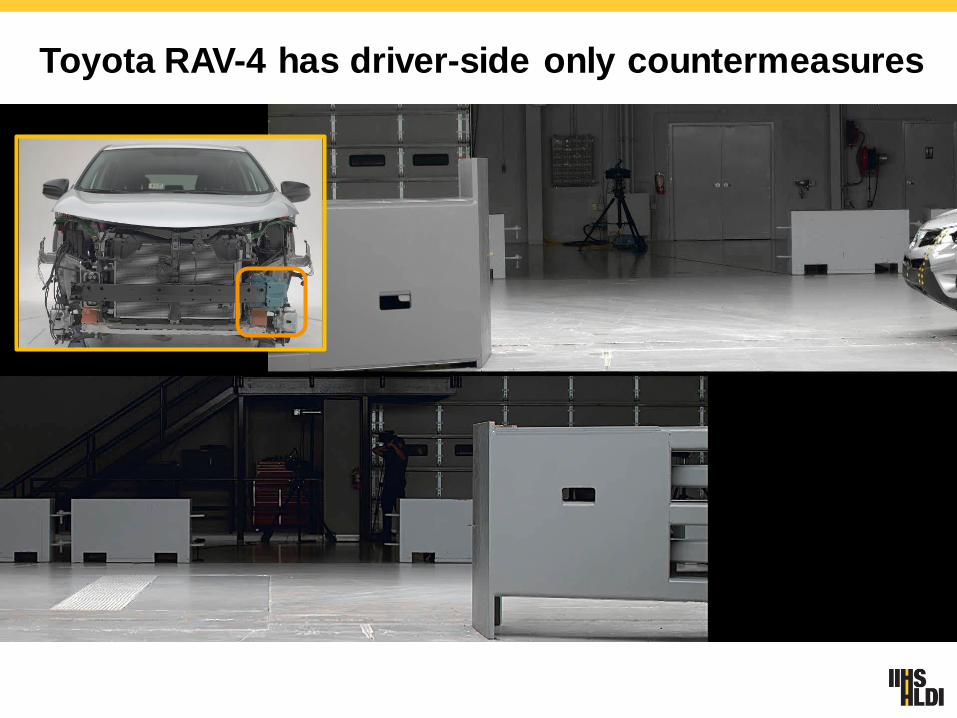
Toyota RAV-4 has driver-side only countermeasures
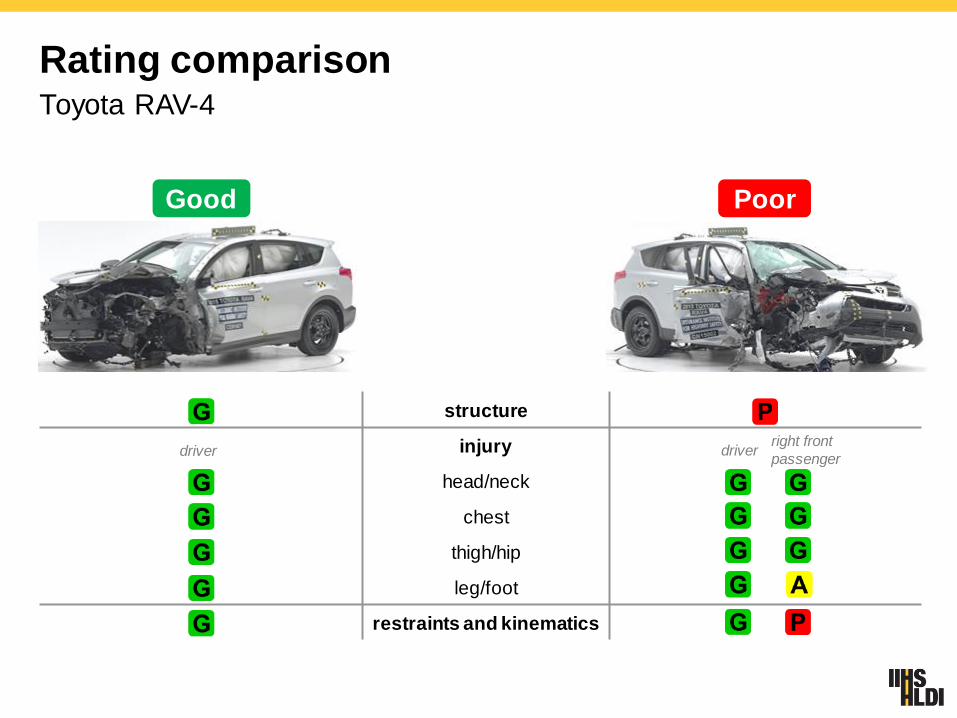
Rating comparisonToyota RAV-4
structure
injury
head/neck
chest
thigh/hip
leg/foot
restraints and kinematics
Good Poor
driverright front
passengerdriver
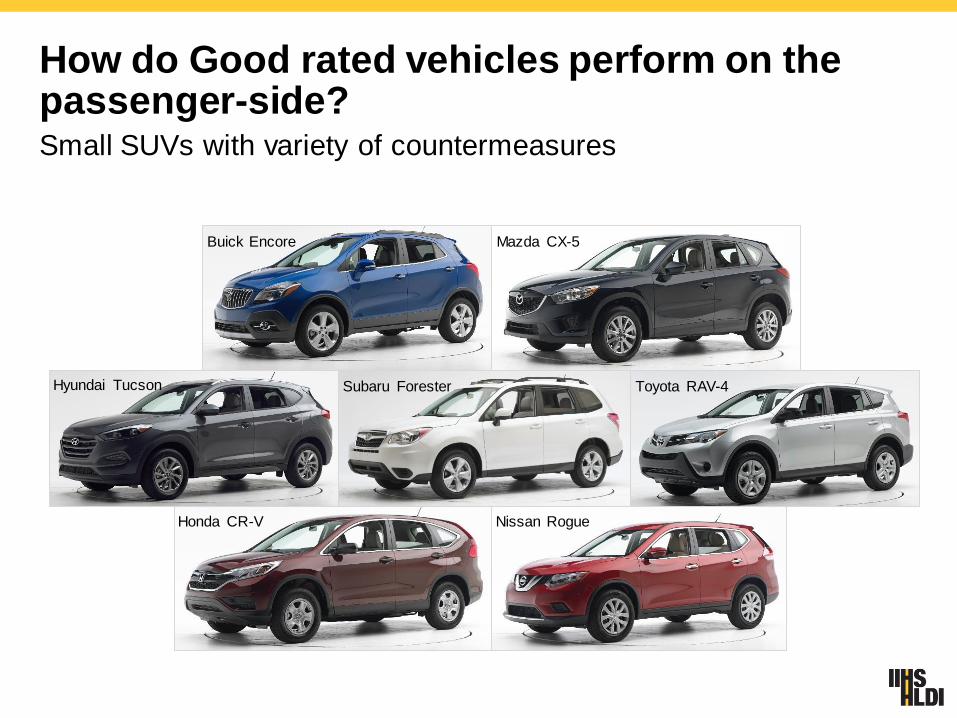
How do Good rated vehicles perform on the passenger-side?Small SUVs with variety of countermeasures
Buick Encore Mazda CX-5
Hyundai Tucson Subaru Forester Toyota RAV-4
Honda CR-V Nissan Rogue
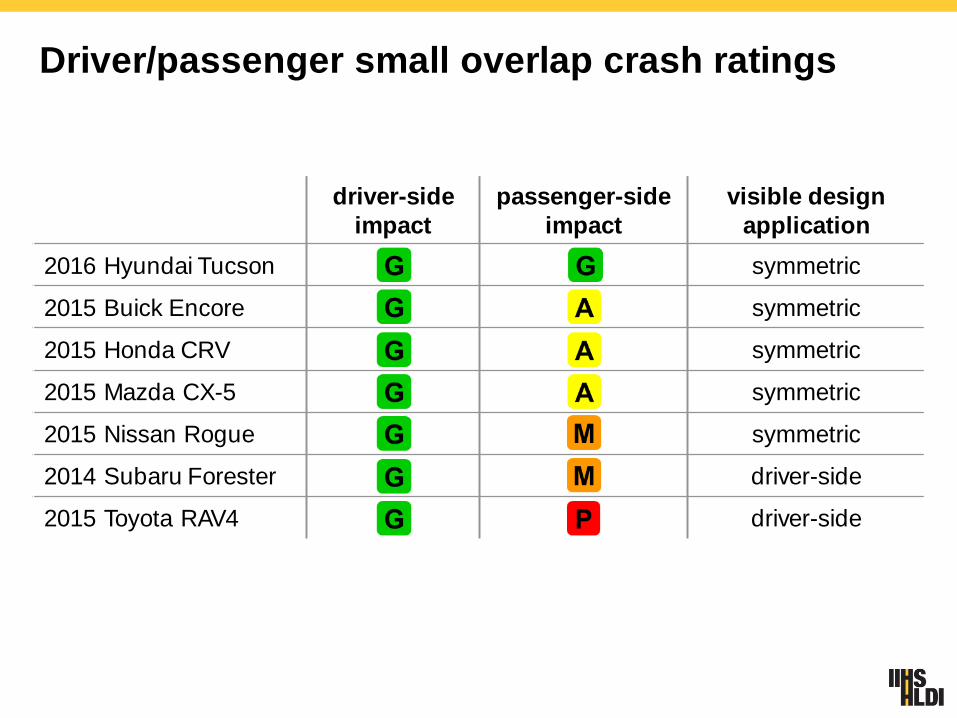
Driver/passenger small overlap crash ratings
driver-side
impact
passenger-side
impact
visible design
application
2016 Hyundai Tucson symmetric
2015 Buick Encore symmetric
2015 Honda CRV symmetric
2015 Mazda CX-5 symmetric
2015 Nissan Rogue symmetric
2014 Subaru Forester driver-side
2015 Toyota RAV4 driver-side
Manufacturers already responding topassenger-side small overlap research tests
Manufacturers and testing facilities have requested a
passenger-side testing protocol and have run in-house
passenger-side tests
5 manufacturers have committed to symmetric designs in all
small overlap vehicle designs
5 manufacturers with at least one driver-side only design
indicated designs will be updated to symmetric for future
generations
Next steps for passenger-side small overlap crashes
Paper summarizing results to be published at IRCOBI in
September 2016
Continue to follow automaker strategies
– Additional research tests may be conducted on a different vehicle class
– Passenger-side small overlap rating protocol available Summer 2016
Possible rating in 2017 based on one of two options
– Based on automaker self-testing
– Passenger side test for models with good driver side rating
– A ratings test could become part of TSP as early as 2018

Side impact research
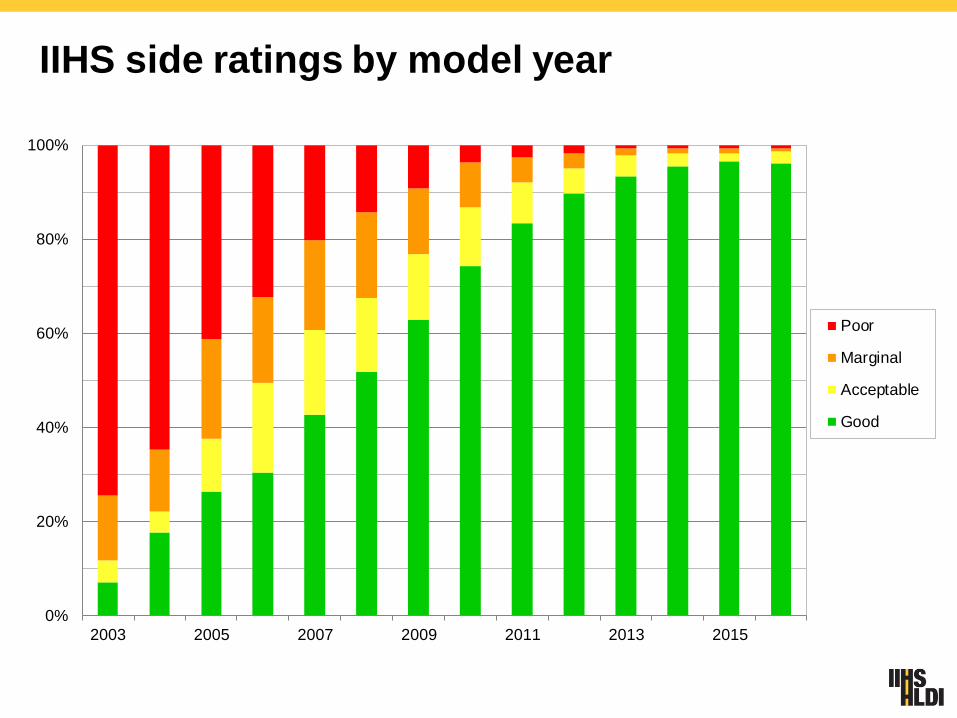
IIHS side ratings by model year
0%
20%
40%
60%
80%
100%
2003 2005 2007 2009 2011 2013 2015
Poor
Marginal
Acceptable
Good
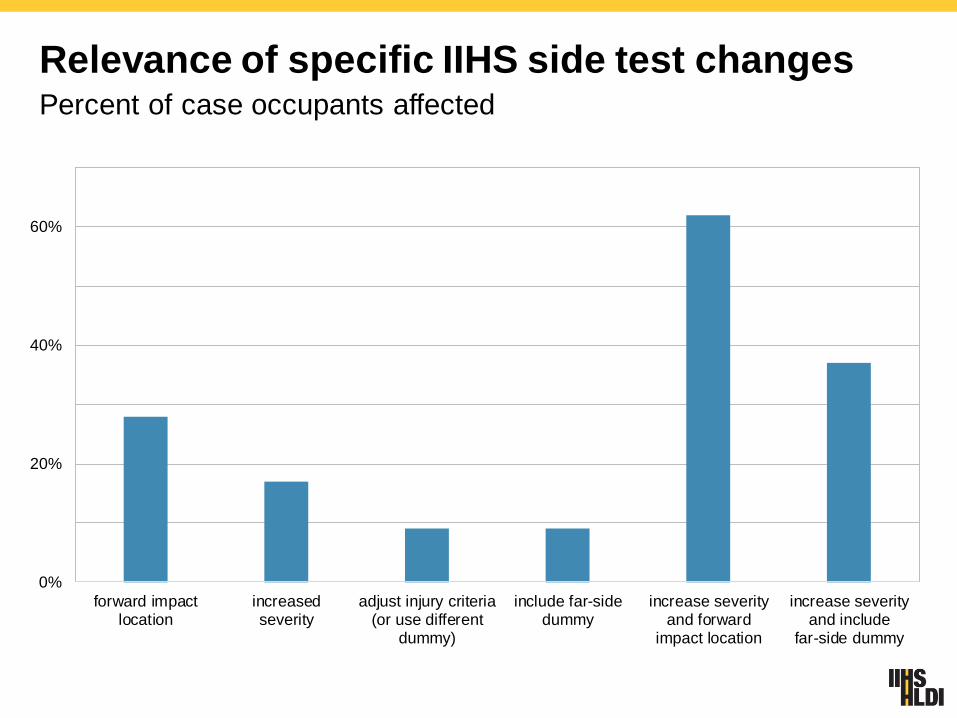
Relevance of specific IIHS side test changesPercent of case occupants affected
0%
20%
40%
60%
forward impactlocation
increasedseverity
adjust injury criteria(or use different
dummy)
include far-sidedummy
increase severityand forward
impact location
increase severityand include
far-side dummy
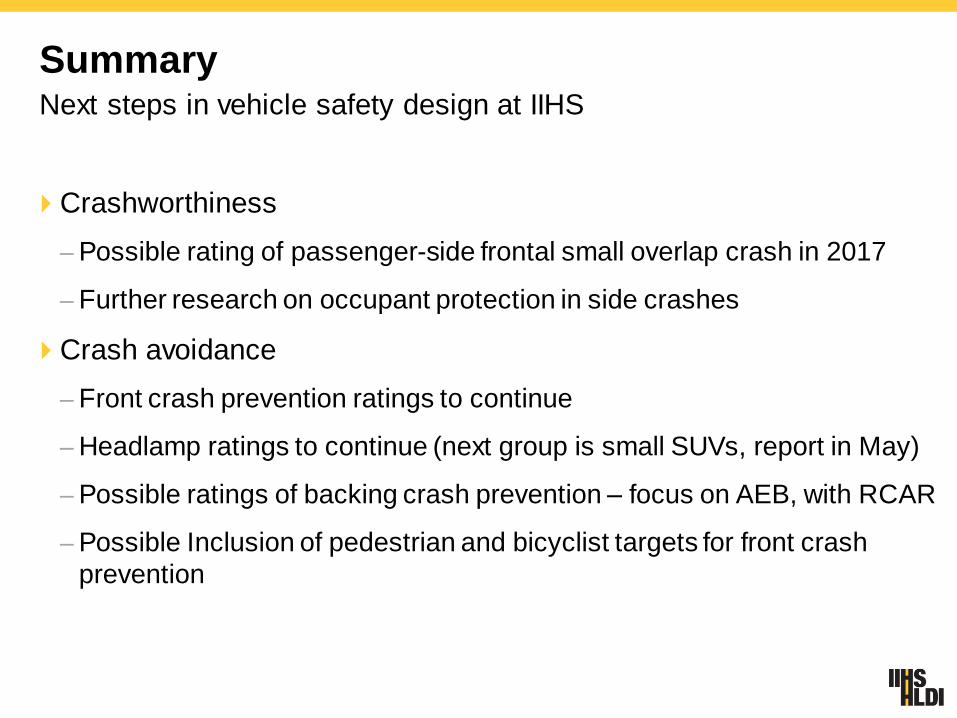
SummaryNext steps in vehicle safety design at IIHS
Crashworthiness
– Possible rating of passenger-side frontal small overlap crash in 2017
– Further research on occupant protection in side crashes
Crash avoidance
– Front crash prevention ratings to continue
– Headlamp ratings to continue (next group is small SUVs, report in May)
– Possible ratings of backing crash prevention – focus on AEB, with RCAR
– Possible Inclusion of pedestrian and bicyclist targets for front crash
prevention
iihs.org
More information and links to our YouTube channeland Twitter feed at iihs.org
Adrian LundPresident, IIHS & [email protected]