Embed Size (px)
Citation preview

Advantages of the implementation of Service Desk based on ITIL
framework in telecommunication industry
Anel Tanovic*, Asmir Butkovic **, Fahrudin Orucevic***, Nikos Mastorakis****
* American University in Bosnia and Herzegovina
Mije Kerosevica Guje 3, Tuzla 75000, Bosnia and Herzegovina
** College of Computer Science and Business Communications eMPIRICA
Bulevar mira bb, Brcko District 76100 Bosnia and Herzegovina
*** Faculty of Electrical Engineering
Zmaja od Bosne bb, Sarajevo 71000, Bosnia and Herzegovina
**** Technical University of Sofia
St.Kliment Ohridski Boulevard, Sofia 1756, Bulgaria
[email protected], [email protected], [email protected], [email protected]
Abstract: - This paper describes the significance of the implementation of Service Desk based on ITIL
framework. For the reference model is taken a Service Desk in Telecom operator which solves hundreds of
users incidents, problems and requests during a one day. The aim of the paper is to compare the results of
normal working a Service Desk before the implementation of ITIL and after the implementation of ITIL. The
result of this comparison should show that a Service Desk with the implemented ITIL processes has achieved a
better results than a Service Desk which doesn't contain processes from ITIL. For the implementation of ITIL
Service Desk are chosen all processes which are dealing with users: Service Level Management, Supplier
Management, Change Management, Event Management, Incident Management, Request Fulfillment and
Problem Management. This paper gives a focus to the implementation of Service Desk solutions based on ITIL
framework in any business environment in order to increase the business productivity.
Key-Words: - ITIL, Service Desk, Service Level Management, Supplier Management, Change Management,
Event Management, Incident Management, Request Fulfillment, Problem Management.
1 Introduction Service Desk plays an important role for the
normal work of each organization. Today every
organization must have some Service Desk solution
which is responsible for solving users requests,
incidents and problems. Service Desk software
solutions take key activities for the implementation
of its processes from various number of IT Service
Management (ITSM) frameworks which include:
CobiT, eTOM, ITIL, ISO/IEC 20000 etc. All these
ITSM frameworks contain processes which are
responsible for dealing and solving users requests,
incidents and problems. By implementing all these
solutions organizations get recommendations from
these ITSM frameworks how to implement these
strategic processes.
For this paper and the implementation of Service
Desk is taken ITIL 2011 framework. ITIL is the
most popular framework for the management of IT
services. It contains five phases in which are placed
26 processes. For each process ITIL gives a set of
key activities which are important for the
implementation and a set of key performance
indicators which are important for the measurement
of processes. This paper is divided in two parts: the
first one is just the measurement of key performance
indicators in the old model of Service Desk. The
second one is the description of the implementation
of ITIL Service Desk by describing key activities
for seven ITIL processes which are used for this
model and by the measurement of the same key
performance indicators as in the first part of the
paper. For the implementation of this ITIL Service
Desk model are taken seven processes which are
also the part of any sophisticated ITSM solution:
Service Level Management, Supplier Management,
Change Management, Event Management, Incident
Management, Request Fulfillment, Problem
Management.
This paper is divided in six chapters. The second
chapter describes a test environment and a
methodology used for this research. The third
chapter shows results of the measurement of the old
model of Service Desk solution. The fourth chapter
shows the implementation of a ITIL Service Desk
model by describing the realisation of key activities
for seven ITIL processes. The fifth chapter shows
results of the measurement of the new model of
Service Desk solution. The sixth chapter of the
Recent Researches in Electrical Engineering
ISBN: 978-960-474-392-6 165

paper is the conclusion of the paper which shows
the advantage of the new model of Service Desk
which is based on ITIL 2011 framework.
2 Reference model and research
methodology For the reference model is taken Service Desk in
one Telecom operator in Bosnia and Herzegovina.
Telecom operator contains all main services which
include: fixed telephony, mobile telephony, IPTV,
VoIP, Internet, Hosting and E-mail. Before the
implementation of this project, Telecom operator
has the old software Service Desk solution which
was not compatible with any of IT Service
Management frameworks and standards. The
process of solving users incidents and problems was
too slow especially on services connected to the IP
network: IPTV, VoIP, Internet, Hosting and E-mail.
Some everyday users requests and problems which
appear on Service Desk are: termination of
telephone device, the loss of TV picture, stop
working of internet on cell phones, stop working of
cell phones, changing password for internet,
changing PIN for IPTV, excessive bills for services,
inability to purchase video content on Video on
Demand service, inability to record content on TV
channels, the request for the replacement of terminal
equipment, creating of new e-mail addresses,
creating a new domain on hosting service, loss of
codes for mobile phones, long time for solving
problems between departments within Telecom
operators etc. Figure 1. shows Service Desk and
departments inside a Telecom operator which all
have installed a Service Desk application.
The methodology of this paper contains two
basic steps. The first step are measurements of the
implemented Service Desk by using a predefined set
of key performance indicators. The second step is
the implementation of Service Desk by using ITIL
recommendations for seven processes and finally
making measurements for all seven ITIL processes.
For the measurement of results is taken a technique
called Gap Analysis.
Gap analysis is a business assessment tool
enabling an organization to compare where it is
currently and where it wants to go in the future. This
provides the organization with insight to areas that
have room for improvement. The process involves
determining, documenting and approving the
variance between business requirements and current
capabilities. Gap analysis naturally flows from
benchmarking or other assessments such as service
or process maturity assessments. This comparison
becomes the gap analysis, which can be performed
at the strategic, tactical or operational level of an
organization. Gap analysis provides a foundation for
how much effort in time, money and human
resources is required to achieve a particular goal.
3 Measurement results on Service
Desk before the implementation of
ITIL processes Table I. shows the result of the implementation
for each key performance indicator for Service
Level Management process, the value of critical
success factor and the percentage of the successful
implemented key performance indicators. The final
result of the successful implemented key
performance indicators for this process is 74%.
Table II. shows the result of the implementation
for each key performance indicator for Supplier
Management process, the value of critical success
factor and the percentage of the successful
implemented key performance indicators. The final
result of the successful implemented key
performance indicators for this process is 69.60%.
Table III. shows the result of the implementation
for each key performance indicator for Change
Management process, the value of critical success
factor and the percentage of the successful
implemented key performance indicators. The final
result of the successful implemented key
performance indicators for this process is 71.80%.
Table IV. shows the result of the implementation
for each key performance indicator for Event
Management process, the value of critical success
factor and the percentage of the successful
implemented key performance indicators. The final
result of the successful implemented key
performance indicators for this process is 77%.
Table V. shows the result of the implementation
for each key performance indicator for Incident
Management process, the value of critical success
factor and the percentage of the successful
implemented key performance indicators. The final
result of the successful implemented key
performance indicators for this process is 78.40%.
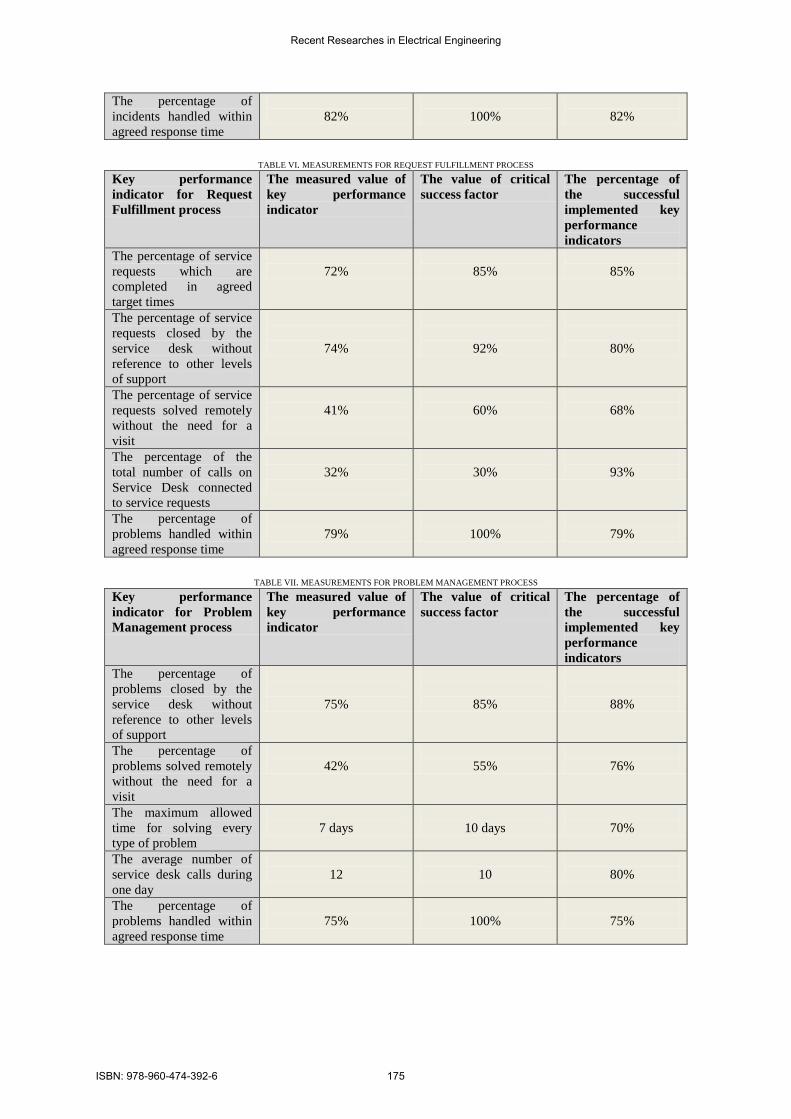
Table VI. shows the result of the implementation
for each key performance indicator for Request
Fulfillment process, the value of critical success
factor and the percentage of the successful
implemented key performance indicators. The final
result of the successful implemented key
performance indicators for this process is 81%.
Table VII. shows the result of the
implementation for each key performance indicator
for Problem Management process, the value of
critical success factor and the percentage of the
Recent Researches in Electrical Engineering
ISBN: 978-960-474-392-6 166
successful implemented key performance indicators.
The final result of the successful implemented key
performance indicators for this process is 77.80%.
Table VIII. shows a brief summary of results of
the implementation for each ITIL process before the
implementation of ITIL Service Desk solution. The
final result of the successful implemented key
performance indicators for all ITIL processes before
the implementation of these processes is 75.65%.
4 Implementation of Service Desk
based on ITIL framework
Service Desk based on ITIL has been developed
on University on Sarajevo (Faculty of Electrical
Engineering) in laboratory for IT Service
Management. This Service Desk contains seven
processes which are all connected with suppliers,
clients and internal processes. This developed
Service Desk is user friendly and adaptive for
learning to all employees in company. ITIL
processes which are integrated in this solution are:
Service Level Management, Supplier Management,
Change Management, Event Management, Incident
Management, Request Fulfillment and Problem
Management. For all these processes will be shown
key activities which are used for the implementation
of this software solution. Figure 2. shows user
interface of the developed Service Desk solution.
Key activities with Service Level Management
process should include:
Determining, negotiating and documenting
requirements for new and changed services
in SLA contracts, and managing and
reviewing them through the service lifecycle
Monitoring and measuring service
performance achievements of all operational
services against targets in SLAs
Producing service reports
Conducting service reviews, identifying
improvement opportunities for inclusion
Collating, measuring and improving
customer satisfaction in cooperation with
business relationship management
Reviewing and revising SLAs and OLAs
Developing and documenting contacts and
relationships with the business, customers
and stakeholders in cooperation with
business relationship management process
Logging and managing complaints and
compliments in cooperation with business
relationship management.
Key activities for Supplier Management process
should include:
Definition of new supplier and contract
requirements: identify business need and
prepare of the business case
Evaluation of new supplier and contracts:
identify method of purchase and
procurement, establish evaluation criteria
and negotiate contracts and targets
Categorization of suppliers and contracts:
assess and reassess the supplier and
contract, ensure changes progressed and
categorization of suppliers
Establishment of new suppliers and
contracts: setting the supplier service and
contract, transitioning the service and
establishing contacts and relationships
Supplier, contract and performance
management: manage and control the
operation and delivery of service, monitor
and report and manage the supplier and the
relationship.
Key activities for Change Management process
include:
Planning and controlling changes
Change and release scheduling
Communications
Making change decisions and authorization
of change
Ensuring that remediation plans are in place
Measurement and control
Management reporting
Understanding the impact of the change
Continual improvement.
Key activities for Event Management process
include:
Event occurs – Everybody involved in
designing, developing, managing and
supporting IT services understand what type
of event need to be detected
Event notification – A general principle of
event notification is that the more
meaningful data it contains and the more
targeted the audience, the easier is to make
decisions about the event.
Event detection – Once and event
notification has been generated, it will be
detected by an agent running on the same
system, or transmitted directly to a
Recent Researches in Electrical Engineering
ISBN: 978-960-474-392-6 167
management tool specifically designed to
read and interpret the meaning of the event.
Event logged – The event can be logged as
an event record in the event management
tool.
First level event correlation and filtering –
The purpose is to decide whether to
communicate the event to a management
tool or to ignore it. In that case the event
will be usually recorded in a log file on the
device and no further action will be taken.
Significance of events – Every organization
will have its own organization of the
significance of an event but it is suggested
that at least these three broad categories be
represented.
Second level event correlation – If it is a
warning event, a decision has to be made
about exactly what the significance is and
what actions need to be taken to deal with it.
A correlation engine is programmed
according to the performance standards
created during service design.
Further action needed – If the second level
correlation activity recognizes the event, a
response will be required. There are many
different types of responses, each designed
specifically for the task it has to initiate.
Response selection – At this type of the
process, there are a number of respons
options available. Response options can be
taken in any combination. There are lot of
options like: auto response, alert and human
intervention, incident, problem, or change,
open an request for change, open an
incident record and open or a link to a
problem record.
Review actions – It is important to check
that any significant events or exceptions
have been handled and to track trends or
event types. In many cases it can be done
automatically. In cases where events have
initiated an incident, problem or change, the
action review should not duplicate any
reviews that have been done as part of those
processes.
Close event – Some events will remain open
until a certain action takes place, for
example an event that is linked to an open
incident. It is sometimes very difficult to
relate open and closed events if there are in
different formats.
Key activities for Incident Management process
include:
Incident identification – All key
components should be monitored so that
failures are detected early. This means that
this process can be started quickly.
Incident logging – All incidents must be
fully logged regardless it is raised through a
telephone call, automatically detected or
from other source.
Incident categorization – It is needed to
allocate suitable incident categorization so
that the exact type of incident is recorded.
This is very important because of incident
types.
Incident prioritization – Prioritization can
be normally determined by taking into
account the urgency of the incident and the
level of business impact it is causing. An
indication of impact is very often the
number of users affected.
Initial diagnosis – If the incident has been
routed via the service desk, the service desk
analyst must carry out initial diagnosis,
typically while the user is on telephone and
to try to discover the full symptoms of the
incident and to determine exactly what has
gone wrong and how to correct it.
Incident escalation – If the staff of Service
Desk is unable to resolve the incident, it
must be immediately escalated for further
support. Some incidents may require
multiple support groups to resolve. Support
groups may be internal and they may be
third parties like software suppliers or
hardware manufactures.
Investigation and diagnosis – All support
groups involved with the incident handling
will investigate and diagnose potential
problems and make the fully documentation
about it. The valuable time can often be lost
if investigation or diagnostic action is
performed serially. Such actions should be
performed in parallel to reduce overall
timescales.
Resolution and recovery – Any potential
resolution should be applied and tested. The
specific actions need to be undertaken. Even
when some resolution of incident is found,
sufficient testing must be performed to
ensure that recovery action is complete and
that normal state service has been restored.
Incident closiure – The service desk should
check that the incident is fully resolved and
Recent Researches in Electrical Engineering
ISBN: 978-960-474-392-6 168
that users are satisfied and agree that some
incident can be closed.
Rules for reopening incidents – There will
be occassions when incidents recur even
though they have been formally closed.
Because of such cases, it is wise to have
predefined rules about if and when an
incident can be reopened. It is very
disarable situation when some incidents are
solved in one working day after re-opening
of them. The exact time may vary between
individual organizations but clear rules
should be agreed and documented and
guidance given to all service desk staff so
that uniformity is applied.
Key activities for Request Fulfillment process
include:
Receiving a request – Fulfilment work on
service requests should not begin until a
formalized request has been received.
Service requests should mostly come from
the Service Desk.
Request logging and validation – All service
requests should be fully logged and timely
stamped, regardless is service request from
service desk, telephone call or e-mail.
Request categorization – Part of the initial
logging it is needed to allocate request
categorization so that the exact type of the
request is recorded.
Request prioritization – Another very
important step is to allocate an appropriate
prioritization code, and to determine how
the service request is handled by the Service
Desk staff.
Request authorization – All service requests
need to be properly authorized. Simple
authorizations can take place via Service
Desk. Service requests that can not be
properly authorized should be returned to
the requestor with the reason for the
rejection.
Request review – The request is reviewed to
determine the function that will fulfil it. As
requests are reviewed, the request records
should be updated to reflect the current
request status.
Request model execution – A request model
should be used that documents a standard
process flow, roles and responsibilities to
fulfill it. The appropriate request model
should be chosen based on the type of
service request. All service requests in the
real environment should also be authorized
through Change Management process.
Request closure – When service request
activities have been completed, the service
desk should be notified of the completion
status. The Service Desk should check that
the request has been fulfilled and that users
are satisfied and agree to close the service
request.
Key activities for Problem Management process
include:
Problem detection – There are multiple
ways of detecting problems that will exist in
all organizations. These can include triggers
for reactive and proactive problem
management.
Problem logging – All the relevant details
of the problem must be recorded so that a
full historic record exists. This must be date
and time stamped to allow suitable control
and escalation.
Problem categorization – Problems should
be categorized in the same way as incidents
so that the nature of the problem can be
easily traced in the future and meaningful
management information can be obtained.
Problem prioritization – Problems should be
prioritized in the same way as incidents.
The frequency and the impact of related
incidents should be also taken into account.
For the problem prioritization it is very
important the severity of the problems.
Severity explains how serious is the
problem from a service or customer
perspective.
Problem investigation and diagnosis – An
investigation should be conducted to try to
diagnose the root cause of the problem. The
speed and the nature of the investigation
will depend on the impact, severity and
urgency of the problem. There are a lot of
useful techniques that can be used to
diagnose and resolve problems.
Raising a known error record – This is
defined as a problem with a documented
root cause and workaround. The known
error record should identify the problem and
a status of document which status is
important for resolving the problem. In
some cases it may be advantageous to raise
a known error record even earlier in some
processes, even though a diagnosis it may
not be complete. This might be used for
Recent Researches in Electrical Engineering
ISBN: 978-960-474-392-6 169
information purposes or to identify some
workaround that appears to address the
problem that has not been fully completed.
Problem resolution – When a root cause has
been found and a solution to remove it has
been developed, it should be applied to
resolve the problem. If the problem is very
serious and some urgent fix is needed
because of business reasons, than an
emergency request for change should be
raised.
Problem closure – When a final resolution
has been applied, the problem record should
be formally closed. A check should be
performed at this time to ensure that a
record contains a full historical description
of all events.
Major problem review – After every major
problem, a review should be conducted to
learn any lessons for the future. Such
reviews can be used as part of the training
and awareness activities for support staff.
5 Measurement results on Service
Desk after the implementation of ITIL
processes Table IX. shows the result of the implementation
for each key performance indicator for Service
Level Management process, the value of critical
success factor and the percentage of the successful
implemented key performance indicators after the
implementation of ITIL Service Desk. The final
result of the successful implemented key
performance indicators for this process is 88.80%.
Table X. shows the result of the implementation
for each key performance indicator for Supplier
Management process, the value of critical success
factor and the percentage of the successful
implemented key performance indicators after the
implementation of ITIL Service Desk. The final
result of the successful implemented key
performance indicators for this process is 86.80%.
Table XI. shows the result of the implementation
for each key performance indicator for Change
Management process, the value of critical success
factor and the percentage of the successful
implemented key performance indicators after the
implementation of ITIL Service Desk. The final
result of the successful implemented key
performance indicators for this process is 82%.
Table XII. shows the result of the
implementation for each key performance indicator
for Event Management process, the value of critical
success factor and the percentage of the successful
implemented key performance indicators after the
implementation of ITIL Service Desk. The final
result of the successful implemented key
performance indicators for this process is 85.20%.
Table XIII. shows the result of the
implementation for each key performance indicator
for Incident Management process, the value of
critical success factor and the percentage of the
successful implemented key performance indicators
after the implementation of ITIL Service Desk. The
final result of the successful implemented key
performance indicators for this process is 90.20%.
Table XIV. shows the result of the
implementation for each key performance indicator
for Request Fulfillment process, the value of critical
success factor and the percentage of the successful
implemented key performance indicators after the
implementation of ITIL Service Desk. The final
result of the successful implemented key
performance indicators for this process is 87.60%.
Table XV. shows the result of the
implementation for each key performance indicator
for Problem Management process, the value of
critical success factor and the percentage of the
successful implemented key performance indicators
after the implementation of ITIL Service Desk. The
final result of the successful implemented key
performance indicators for this process is 88.80%.
Table XVI. shows a brief summary of results of
the implementation for each ITIL process after the
implementation of ITIL Service Desk solution. The
final result of the successful implemented key
performance indicators for all ITIL processes after
the implementation of these processes is 87.05%.
6 Conclusion Service Desk based on ITIL has achieved better
results of the implementation than the first model of
Service Desk. This new model has achieved a better
result for 11.40% than the previous model of
Service Desk. All seven processes from the Service
Desk based on ITIL have achieved better results of
the implementation: Service Level Management
(14.80%), Supplier Management (17.20%), Change
Management (10.20%), Event Management
(8.20%), Incident Management (11.80%), Request
Fulfillment (6.60%) and Problem Management
(11%).
Service Desk based on ITIL has performed all
processes in Telecom operator which are connected
to end users. This means that this Service Desk even
improves internal business processes inside the
organization and automatize some internal
processes. What’s the most important is that a new
Service Desk can be implemented in any business
Recent Researches in Electrical Engineering
ISBN: 978-960-474-392-6 170

organization and that this Service Desk contains
even seven processes responsible for solving user’s
requests, incidents and problems.
Future research is connected to the improvement
of the implemented Service Desk solution based on
ITIL. The aim is to improve it by adding some new
processes from ITIL which will include Service
Catalogue Management and Access Management.
Service Catalogue Management should be
responsible for providing and maintaining a single
source of consistent information of all operational
services. Access Management will be responsible
for providing the right for users to be able to use one
service or group of services.
References: [1] J. van Bon, A. de Jong, A. Kolthof, M.Pieper, R.
Tjassing, A. van der Veen, and T. Verheijen,
”Foundations of IT Service Management Based on
ITIL 2011”, The Office of Government Commerce,
September 2007.
[2] B. Orand and J. Villarreal, “Foundations of IT
Service Management: The ITIL Foundations Course
in a Book”, CreateSpace, June 2011.
[3] R. A. Steinberg, “Measuring ITIL: Measuring,
Reporting and Modeling – the IT Service
Management Metrics That Matter Most to IT Senior
Executives”, Trafford Publishing, January 2001.
[4] R. A. Steinberg,, “Servicing ITIL: A Handbook of IT
Services for ITIL Managers and Practitioners”,
Trafford Publishing, September 2007.
[5] R. A. Steinberg, “Architecting ITIL”, Trafford
Publishing, October 2008.
[6] R. A. Steinberg, “Implementing ITIL: Adapting
Your IT Organization to the Coming Revolution in
IT Service Management”, Trafford Publishing,
October 2005.
[7] G. Blokdijk and I. Menken, “Help Desk, Service
Desk Best Practice Handbook: Building, Running
and Managing Effective Support - Ready to use
supporting documents bringing ITIL Theory into
Practise ”, Emereo Publishing, August 2008.
[8] A. Tanovic, I. Androulidakis, and F. Orucevic,
“Development of a new improved model of the ITIL
V3 framework for the information system of
Telecom operator”, 11th WSEAS International
Conference on Data Networks, Communications,
Computers (DNCOCO ‘12), pp. 209-215, September
2012.
[9] A. Keller and T. Midboe, “Implementing a Service
Desk: A practioner’s perspective”, IEEE Network
Operations and Management Symposium (NOMS
2010), pp. 685-696, April 2010.
[10] A. Lahtela, M. Jantti, and J. Kaukola, “Implementing
an ITIL-Based IT Service Management
Measurement System”, 4th International Conference
on Digital Society (ICDS’10), pp. 249-254, February
2010.
[11] A. Tanovic and F. Orucevic, “Proposal of the
improvement of Actual ITIL Version based on
Comparative IT Service Management Methodologies
and Standards – The Improved Model of ITIL 2011
Framework”, 13th WSEAS International Conference
on Applied Informatics and Communications
(AIC'13), Valencia, August 2013.
[12] M. Spremic and H. Spremic, “Measuring IT
Governance Maturity – Evidences from using
regulation framework in the Republic Croatia”,
Proceedings of the European Computing Conference
(ECC ‘11), pp. 98-104, April 2011.
[13] J. J. Cusick and G. Ma, “Creating an ITIL inspired
Incident Management approach: Roots, response,
and results”, IEEE/IFIP Network Operations and
Management Symposium Workshops (NOMS
Wksps), pp. 142-148, April 2010.
[14] M. Jantti and A. Suhonen, “Improving Service Level
Management Practices: A Case Study in an IT
Service Provider Organization”, International
Conference on Advanced Applied Informatics, pp.
139-144, September 2012.
[15] S. Heikkinen and M. Jantti, “Identifying IT Service
Management Challenges: A Case Study in Two IT
Service Provider Companies”, 23rd International
Workshop on Database and Expert Systems
Applications (DEXA 2012), pp. 60-64, September
2012.
[16] L. Ruile, “Research on IT Service Management of
college or university campus network”, 7th
International Conference on Computer Science &
Education (ICCSE 2012), pp. 320-324, July 2012.
Recent Researches in Electrical Engineering
ISBN: 978-960-474-392-6 171

Figure 1. Service Desk and departments inside a Telecom operator
Figure 2. User interface for the developed Service Desk solution
Recent Researches in Electrical Engineering
ISBN: 978-960-474-392-6 172
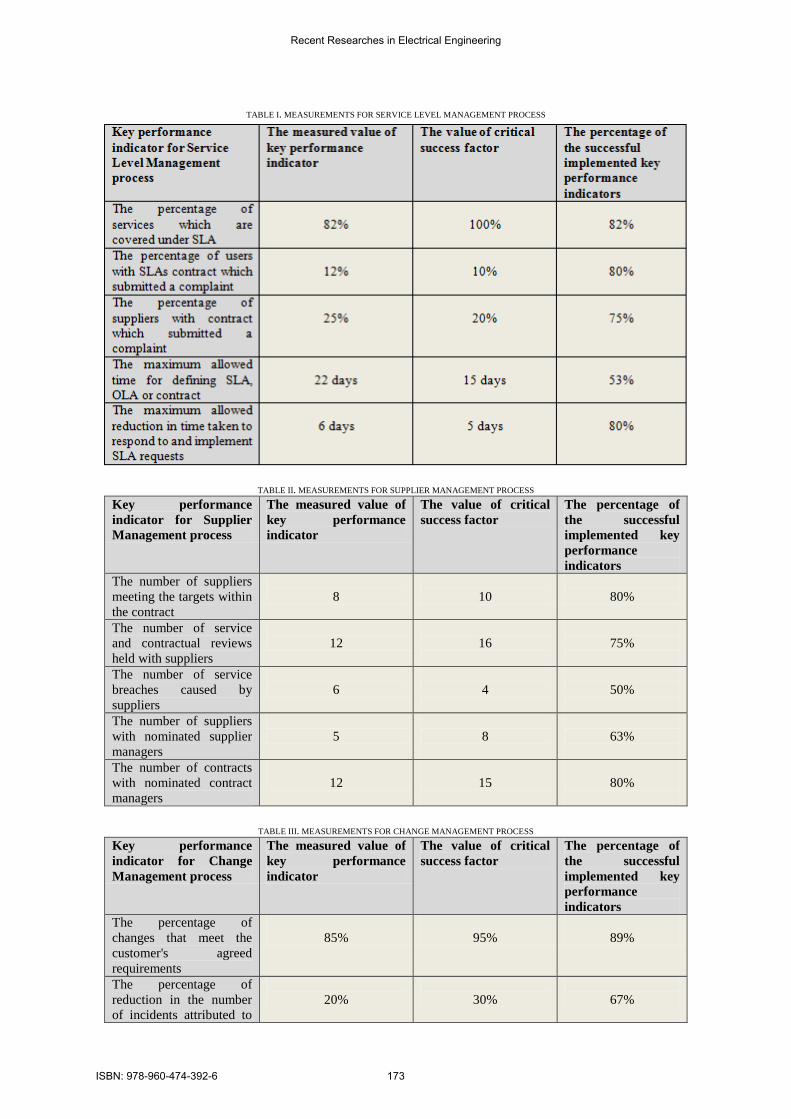
TABLE I. MEASUREMENTS FOR SERVICE LEVEL MANAGEMENT PROCESS
TABLE II. MEASUREMENTS FOR SUPPLIER MANAGEMENT PROCESS
Key performance
indicator for Supplier
Management process
The measured value of
key performance
indicator
The value of critical
success factor
The percentage of
the successful
implemented key
performance
indicators
The number of suppliers
meeting the targets within
the contract
8
10
80%
The number of service
and contractual reviews
held with suppliers
12
16
75%
The number of service
breaches caused by
suppliers
6
4
50%
The number of suppliers
with nominated supplier
managers
5
8
63%
The number of contracts
with nominated contract
managers
12
15
80%
TABLE III. MEASUREMENTS FOR CHANGE MANAGEMENT PROCESS
Key performance
indicator for Change
Management process
The measured value of
key performance
indicator
The value of critical
success factor
The percentage of
the successful
implemented key
performance
indicators
The percentage of
changes that meet the
customer's agreed
requirements
85%
95%
89%
The percentage of
reduction in the number
of incidents attributed to
20%
30%
67%
Recent Researches in Electrical Engineering
ISBN: 978-960-474-392-6 173

changes
The percentage of
reduction in the number
of unauthorized changes
identified
15%
25%
60%
The percentage of
reduction in the number
of changes with
incomplete change
specifications
18%
25%
72%
The percentage of
reduction in the number
of changes with
incomplete impact
assessments
12%
17%
71%
TABLE IV. MEASUREMENTS FOR EVENT MANAGEMENT PROCESS
Key performance
indicator for Event
Management process
The measured value of
key performance
indicator
The value of critical
success factor
The percentage of
the successful
implemented key
performance
indicators
The number of incidents
that occurred and which
are triggered without a
corresponding event
18
26
69%
The percentage of events
compared with the
number of incidents
60%
75%
80%
The percentage of events
caused by existing
problems or known errors
70%
85%
82%
The percentage of events
that resulted in incidents
or changes
65%
90%
72%
The percentage of events
indicating performanse
issues
72%
88%
82%
TABLE V. MEASUREMENTS FOR INCIDENT MANAGEMENT PROCESS
Key performance
indicator for Incident
Management process
The measured value of
key performance
indicator
The value of critical
success factor
The percentage of
the successful
implemented key
performance
indicators
The percentage of
incidents closed by the
service desk without
reference to other levels
of support
65%
82%
79%
The percentage of
incidents solved remotely
without the need for a
visit
43%
55%
78%
The maximum allowed
time for solving every
type of incident
30 hours
24 hours
75%
The average number of
service desk calls during
one day
147
120
78%
Recent Researches in Electrical Engineering
ISBN: 978-960-474-392-6 174
The percentage of
incidents handled within
agreed response time
82%
100%
82%
TABLE VI. MEASUREMENTS FOR REQUEST FULFILLMENT PROCESS
Key performance
indicator for Request
Fulfillment process
The measured value of
key performance
indicator
The value of critical
success factor
The percentage of
the successful
implemented key
performance
indicators
The percentage of service
requests which are
completed in agreed
target times
72%
85%
85%
The percentage of service
requests closed by the
service desk without
reference to other levels
of support
74%
92%
80%
The percentage of service
requests solved remotely
without the need for a
visit
41%
60%
68%
The percentage of the
total number of calls on
Service Desk connected
to service requests
32%
30%
93%
The percentage of
problems handled within
agreed response time
79%
100%
79%
TABLE VII. MEASUREMENTS FOR PROBLEM MANAGEMENT PROCESS
Key performance
indicator for Problem
Management process
The measured value of
key performance
indicator
The value of critical
success factor
The percentage of
the successful
implemented key
performance
indicators
The percentage of
problems closed by the
service desk without
reference to other levels
of support
75%
85%
88%
The percentage of
problems solved remotely
without the need for a
visit
42%
55%
76%
The maximum allowed
time for solving every
type of problem
7 days
10 days
70%
The average number of
service desk calls during
one day
12
10
80%
The percentage of
problems handled within
agreed response time
75%
100%
75%
Recent Researches in Electrical Engineering
ISBN: 978-960-474-392-6 175
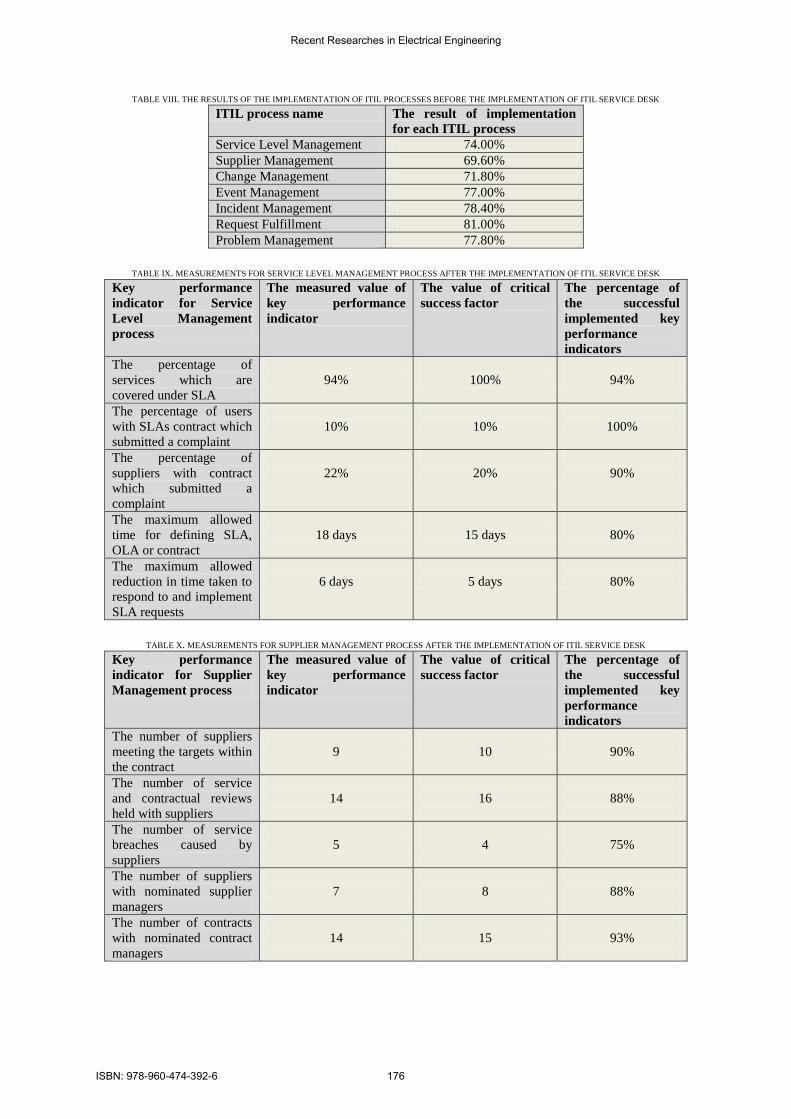
TABLE VIII. THE RESULTS OF THE IMPLEMENTATION OF ITIL PROCESSES BEFORE THE IMPLEMENTATION OF ITIL SERVICE DESK
ITIL process name The result of implementation
for each ITIL process
Service Level Management 74.00%
Supplier Management 69.60%
Change Management 71.80%
Event Management 77.00%
Incident Management 78.40%
Request Fulfillment 81.00%
Problem Management 77.80%
TABLE IX. MEASUREMENTS FOR SERVICE LEVEL MANAGEMENT PROCESS AFTER THE IMPLEMENTATION OF ITIL SERVICE DESK
Key performance
indicator for Service
Level Management
process
The measured value of
key performance
indicator
The value of critical
success factor
The percentage of
the successful
implemented key
performance
indicators
The percentage of
services which are
covered under SLA
94%
100%
94%
The percentage of users
with SLAs contract which
submitted a complaint
10%
10%
100%
The percentage of
suppliers with contract
which submitted a
complaint
22%
20%
90%
The maximum allowed
time for defining SLA,
OLA or contract
18 days
15 days
80%
The maximum allowed
reduction in time taken to
respond to and implement
SLA requests
6 days
5 days
80%
TABLE X. MEASUREMENTS FOR SUPPLIER MANAGEMENT PROCESS AFTER THE IMPLEMENTATION OF ITIL SERVICE DESK
Key performance
indicator for Supplier
Management process
The measured value of
key performance
indicator
The value of critical
success factor
The percentage of
the successful
implemented key
performance
indicators
The number of suppliers
meeting the targets within
the contract
9
10
90%
The number of service
and contractual reviews
held with suppliers
14
16
88%
The number of service
breaches caused by
suppliers
5
4
75%
The number of suppliers
with nominated supplier
managers
7
8
88%
The number of contracts
with nominated contract
managers
14
15
93%
Recent Researches in Electrical Engineering
ISBN: 978-960-474-392-6 176
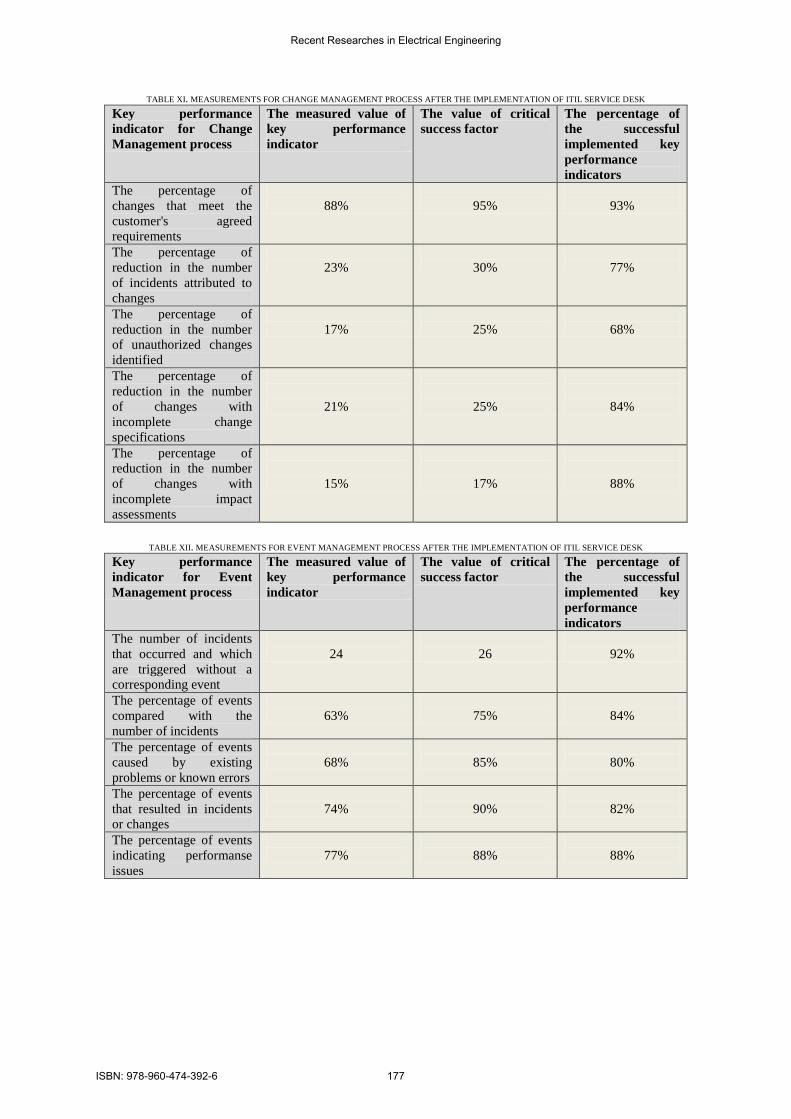
TABLE XI. MEASUREMENTS FOR CHANGE MANAGEMENT PROCESS AFTER THE IMPLEMENTATION OF ITIL SERVICE DESK
Key performance
indicator for Change
Management process
The measured value of
key performance
indicator
The value of critical
success factor
The percentage of
the successful
implemented key
performance
indicators
The percentage of
changes that meet the
customer's agreed
requirements
88%
95%
93%
The percentage of
reduction in the number
of incidents attributed to
changes
23%
30%
77%
The percentage of
reduction in the number
of unauthorized changes
identified
17%
25%
68%
The percentage of
reduction in the number
of changes with
incomplete change
specifications
21%
25%
84%
The percentage of
reduction in the number
of changes with
incomplete impact
assessments
15%
17%
88%
TABLE XII. MEASUREMENTS FOR EVENT MANAGEMENT PROCESS AFTER THE IMPLEMENTATION OF ITIL SERVICE DESK
Key performance
indicator for Event
Management process
The measured value of
key performance
indicator
The value of critical
success factor
The percentage of
the successful
implemented key
performance
indicators
The number of incidents
that occurred and which
are triggered without a
corresponding event
24
26
92%
The percentage of events
compared with the
number of incidents
63%
75%
84%
The percentage of events
caused by existing
problems or known errors
68%
85%
80%
The percentage of events
that resulted in incidents
or changes
74%
90%
82%
The percentage of events
indicating performanse
issues
77%
88%
88%
Recent Researches in Electrical Engineering
ISBN: 978-960-474-392-6 177
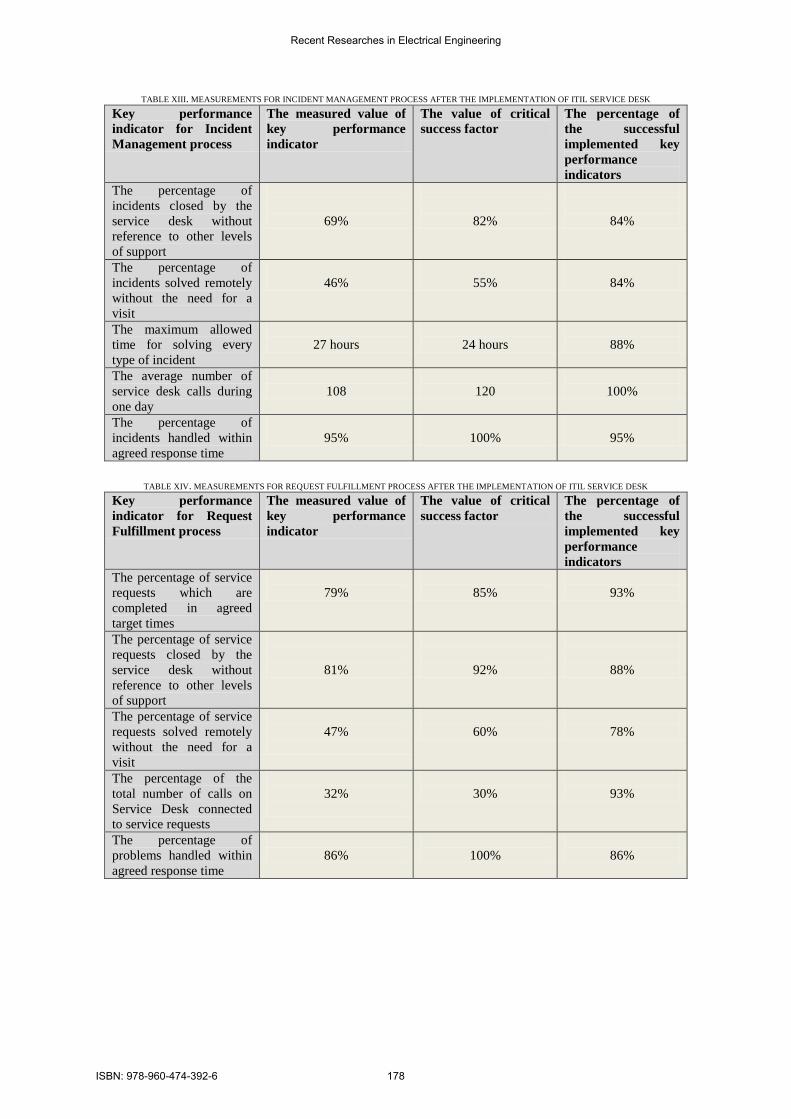
TABLE XIII. MEASUREMENTS FOR INCIDENT MANAGEMENT PROCESS AFTER THE IMPLEMENTATION OF ITIL SERVICE DESK
Key performance
indicator for Incident
Management process
The measured value of
key performance
indicator
The value of critical
success factor
The percentage of
the successful
implemented key
performance
indicators
The percentage of
incidents closed by the
service desk without
reference to other levels
of support
69%
82%
84%
The percentage of
incidents solved remotely
without the need for a
visit
46%
55%
84%
The maximum allowed
time for solving every
type of incident
27 hours
24 hours
88%
The average number of
service desk calls during
one day
108
120
100%
The percentage of
incidents handled within
agreed response time
95%
100%
95%
TABLE XIV. MEASUREMENTS FOR REQUEST FULFILLMENT PROCESS AFTER THE IMPLEMENTATION OF ITIL SERVICE DESK
Key performance
indicator for Request
Fulfillment process
The measured value of
key performance
indicator
The value of critical
success factor
The percentage of
the successful
implemented key
performance
indicators
The percentage of service
requests which are
completed in agreed
target times
79%
85%
93%
The percentage of service
requests closed by the
service desk without
reference to other levels
of support
81%
92%
88%
The percentage of service
requests solved remotely
without the need for a
visit
47%
60%
78%
The percentage of the
total number of calls on
Service Desk connected
to service requests
32%
30%
93%
The percentage of
problems handled within
agreed response time
86%
100%
86%
Recent Researches in Electrical Engineering
ISBN: 978-960-474-392-6 178
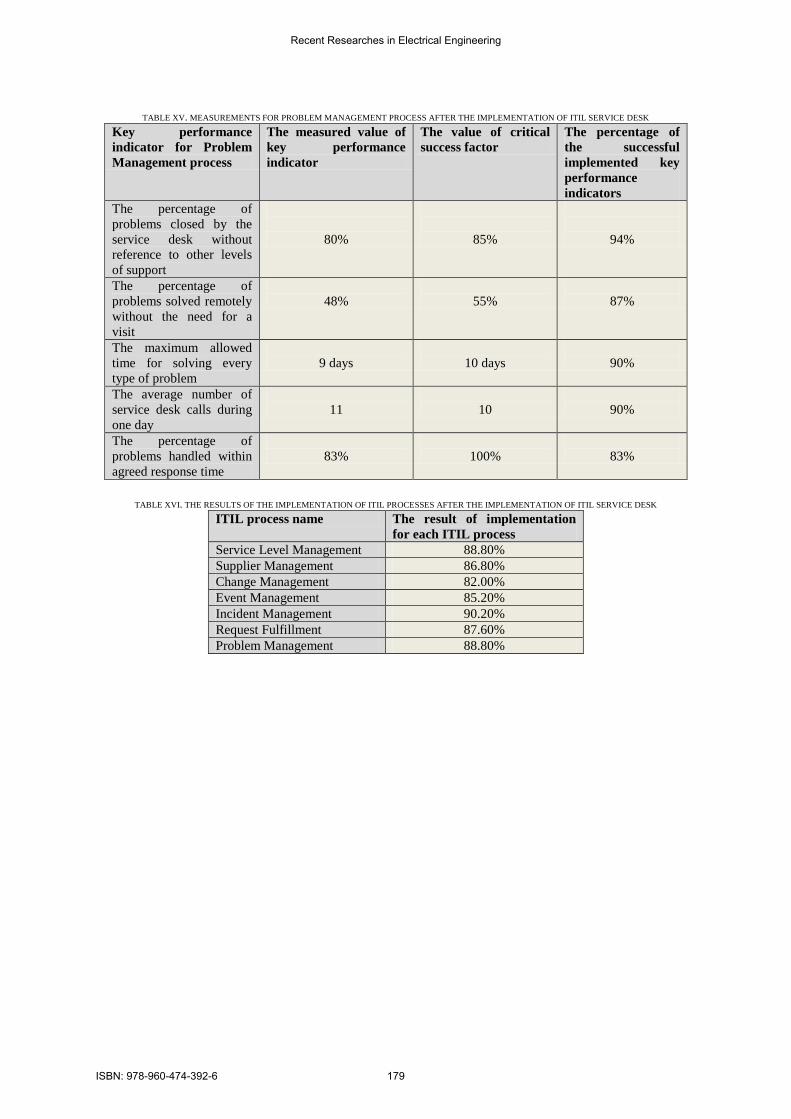
TABLE XV. MEASUREMENTS FOR PROBLEM MANAGEMENT PROCESS AFTER THE IMPLEMENTATION OF ITIL SERVICE DESK
Key performance
indicator for Problem
Management process
The measured value of
key performance
indicator
The value of critical
success factor
The percentage of
the successful
implemented key
performance
indicators
The percentage of
problems closed by the
service desk without
reference to other levels
of support
80%
85%
94%
The percentage of
problems solved remotely
without the need for a
visit
48%
55%
87%
The maximum allowed
time for solving every
type of problem
9 days
10 days
90%
The average number of
service desk calls during
one day
11
10
90%
The percentage of
problems handled within
agreed response time
83%
100%
83%
TABLE XVI. THE RESULTS OF THE IMPLEMENTATION OF ITIL PROCESSES AFTER THE IMPLEMENTATION OF ITIL SERVICE DESK
ITIL process name The result of implementation
for each ITIL process
Service Level Management 88.80%
Supplier Management 86.80%
Change Management 82.00%
Event Management 85.20%
Incident Management 90.20%
Request Fulfillment 87.60%
Problem Management 88.80%
Recent Researches in Electrical Engineering
ISBN: 978-960-474-392-6 179