Embed Size (px)
Citation preview
Advertising in Specialized Markets:Example from the U.S. Pharmaceutical Industry
Amrita Bhattacharyya∗†
Boston College
October 27, 2005
Abstract
This paper studies the usefulness of advertising to both consumers and ex-perts in specialized markets like the prescription drugs, travel and real-estatemarkets where the consumers’ purchasing decisions are influenced by the ex-perts (e.g., doctors, travel agents and real-estate agents). Inspired by the fea-tures of the prescription drugs market the study shows that direct-to-consumer-advertising (DTCA) does not substitute for advertising directed to physicianseven when physician-advertising is only persuasive in nature. Furthermore, thepaper analyzes possible advertising equilibriums in a two-firm setting and findsthat it is possible to have a sub-game perfect, non-symmetric Nash Equilibriumin which only one firm advertises to the consumers and the other firm becomesa free-rider when, (i) the number of patients who are aware of treatment isvery low, and (ii) there are very few patients who insist for a particular drug.Otherwise, for familiar diseases a non-advertising equilibrium is most likely. Fi-nally, consumer advertising can have welfare improving implications dependingon the disease types and patient characteristics.
∗Email:[email protected], Phone:(617)-552-6742†My sincerest acknowledgments are due to Prof. Hideo Konishi for his guidance. I also wish to
thank Prof. Frank Gollop and Prof. Ingela Alger for their valuable comments and suggestions.
1
1 Introduction
In market economies, for most products a consumer himself decides whetherand how much to buy of which brand. For some products, however, consumersare oblivious in the sense that they are not aware of their best consumptionchoice. Instead there are an agents or experts, who decide on behalf of theconsumers which product to purchase. Oblivious consumers either cannot ordo not fully control their own consumption decisions. Some examples of suchspecialized markets are the real-estate market, travel-agent market, prescriptiondrugs market and contractor market. In this paper we study advertising in suchspecialized markets. For example, whether advertisement should be directedto the consumers or to the experts? How should firms decide on consumeradvertising? What implications might consumer advertising have for socialwelfare?
A patient’s inability to choose his own medication has made direct-to-consumer-advertising (DTCA) of prescription drugs a highly controversial meansof promotion. The U.S. is one of the only two countries that allow DTCA ofprescription drugs. The rest of the world, with the exception of New Zealand,does not. This is why in this paper we specifically study the advertising in theU.S. prescription drugs market and analyze the different advertising strategiesand possible advertising equilibriums.
The interesting results that are common findings of the existing empiricalresearch (Rosenthal et al (2003), Berndt et al (1995)) state that DTCA
• significantly increases sales of an entire therapeutic class of drugs
• has no significant effect on market share within a therapeutic class
Question: If the benefits of DTCA by a brand is shared by the entire class ofdrugs, then why do only some brands take the burden of advertising? What canexplain the within-class variation of DTCA? We provide a theoretical answerto this question in this paper.
Economic studies of advertising of prescription drugs to physicians by Bondand Lean (1977), Hurwitz and Caves (1988), Leffer (1981), and Vernon (1981)suggested that this marketing was more “persuasive” than “informative” innature, although the distinction between the two was not unambiguous.
Our models differ from the set ups of the mentioned studies because weexplicitly model some distinctive features of the U.S. pharmaceutical adver-tising. In brief, our models capture the following characteristics of the U.S.prescription drugs market:
• Manufacturers can advertise to both doctors and consumers.
2
• Drug companies can influence the doctors’ preferences for different brandsby sending “benefits” in the form of advertisements.
• Even though patients cannot buy whatever medicine they like, patientscan strongly influence a doctor’s prescribing decision by insisting for par-ticular brands. Patients can get influenced by direct-to-consumer-advertising(DTCA) of prescription drugs.
• Some diseases or treatment-options are known to people more than others.
The theoretical models allow firms’ participation decisions to be qualitativelydifferent from the decision of how much to advertise.1
The paper then provides some economic intuition behind the pharmaceuticaladvertising strategies:
First we ask, within a class of drugs, why only some manufacturers bearthe burden of advertising when others become free riders? We analyze theadvertising equilibriums in the prescription drugs market and find that it ispossible to have a sub-game perfect non-symmetric Nash-equilibrium (whereboth firms advertise to doctors but only one firm bears the burden of advertisingto consumers and the other firm becomes a free-rider) when, (i)the numberof patients who are aware of treatment is very low, and (ii) there are veryfew patients who insist for a particular brand of drug. 2 These results arequite intuitive. If the medicine is for very unfamiliar disease, then unless thepatients see advertisements, they do not visit the doctor. Hence, if no firmadvertises, there is no market and all firms have zero profit. This gives incentiveto the advertising firm to continue advertising. On the other hand, the non-advertising firm is already sharing the market as a free-rider since DTCA has astrong public good feature. There are very few “stubborn” people (people whoinsist for particular brands after viewing an advertisement) and hence the non-advertising firm will not get any extra market share by starting DTCA. On topof that, some non-stubborn patients who already received advertisement fromthe other firm, will receive advertisements again which will be a waste (theywould see doctor anyway). Thus for the non-advertising firm, marginal cost ofadvertising becomes greater than the marginal benefit of advertising. Hence,we get the free-riding equilibrium.
1Empirical studies use sophisticated methods (e.g. two-stage models) to distinguish “whether”decisions from “how much” decisions. However, theoretical models generally assume the two to bequalitatively the same.
2Otherwise, for very familiar diseases a non-advertising equilibrium is most likely. That is, drugsbelonging to classes for which treatment is commonly known, do not advertise to consumers. Wealso find that, all competing brands in a class are likely to advertise to consumers if number ofinsisting patients are very high.
3
The second question is, when a firm decides to advertise to consumers,does it substitute doctor advertising with DTCA? We find that in this set uponce a firm decides to engage in DTCA, doctor and consumer advertisings arenot substitutes. When there are few stubborn patients, then most patientsrely on the doctor’s choice. Even when there are many stubborn patients,doctor advertising still remains important because once a stubborn patientsees advertisement for rival brands he becomes confused and relies on doctor’sjudgment entirely.
From our analysis we also get some economic insights on the following twoquestions: First, what could be the welfare improving implications of DTCA?When DTCA is done for unfamiliar diseases, more patients visit the doctor andget proper treatment because of increased awareness about the disease. As longas there are not many stubborn patients, doctor’s decisions are not distorteddue to DTCA.
And second, Why might DTCA be prohibited? When DTCA is done forvery familiar diseases, the only motivation for doing consumer advertising isstealing market share (when a stubborn patient views advertisement from onlyone brand and not from any rival). If we assume that doctor is the best judge forprescriptions, any distortion of the doctor’s judgment is socially undesirable.Also, when there are many stubborn patients then a symmetric advertisingequilibrium is most likely. As more firms advertise, more stubborn patientsview advertisements from rival brands and depend entirely on the doctor’sdecision as they would do in the first place if there was no DTCA. DTCA inthis case results in a waste of money without any real significance to any side.
The following section provides a brief overview of DTCA in the U.S. andsummarizes the literature related to this paper. Section 3 presents the theoret-ical models and results. Section 4 concludes.
2 History of DTCA and Related Literature
Direct-to-consumer-advertising(DTCA) of prescription drugs is a fairly newphenomenon in the U.S.. There was no interesting story to discuss even 20years ago. Physician advertisements in the forms of sampling, detailing andmedical journal entries were the traditional ways of advertising prescriptiondrugs. In recent years, however, the drug companies tripled their advertise-ment budget to acquaint American consumers with diseases like depression,erectile dysfunction, acid reflux disease and even toenail fungus. Especiallyafter the relaxation of advertising restriction on the broadcast media by theFood and Drug Administration in August 1997, direct-to-consumer-advertising
4
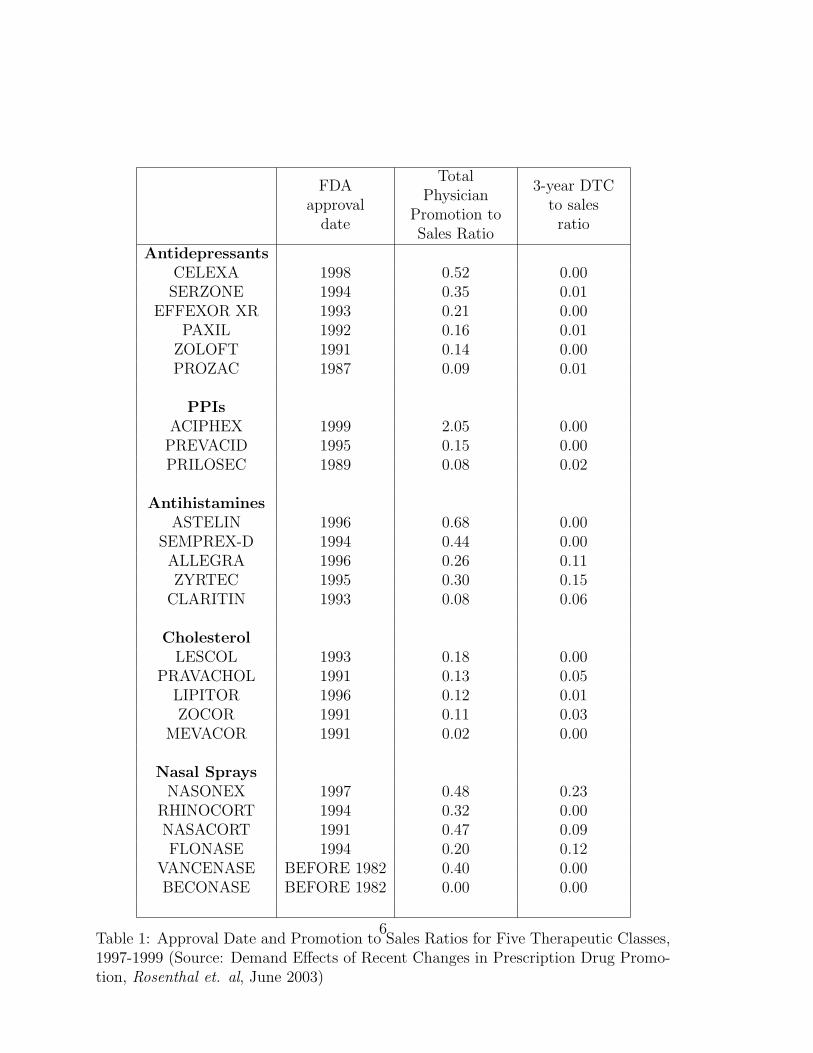
(DTCA) expenditure has skyrocketed. DTCA spending has increased both interms of dollar bills and as a percentage of total promotional spending. Theaverage annual growth rate in DTCA was 33 percent between 1996 and 2000,compared to a 14 percent growth rate for total promotional spending duringthe same period. In 2001, spending for DTCA ($2.7 billion) comprised 15 per-cent of total promotional spending, up from 8 percent ($800 million) in 19963.However, even though DTCA has grown disproportionately compared to otherforms of drug promotions over the last decade, physicians still remain the pri-mary focus of marketing efforts (85 percent of total promotional spending)4.It is a very interesting observation that DTCA is concentrated mostly amongfew therapeutic classes of drugs like Antidepressants, PPI’s, Antihistamines,Cholesterol reducers, Nasal Sprays etc. where as physician promotion is uni-versally accepted. Another even more striking observation is that, even in thesame therapeutic class, not all the major players engage in DTCA (Table 1).
Literature on advertising is plenty, economic researchers have also studiedmany aspects of the expert/specialized markets. But studies of advertising inthe specialized market is scarce and this paper takes a step forward to bridgethis gap. Advertisers face more complex choices in the specialized markets sim-ply because purchasing decisions are not made by purchasers. This is the age ofspecialization and the more specialized different markets become, the more wewill see scenarios where manufacturers are left with major marketing dilemmas.Our goal is to provide some theoretical justifications and guidance for such ad-vertising decisions. Economic studies of advertising of prescription drugs tophysicians by Bond and Lean (1977), Hurwitz and Caves (1988), Leffer (1981),and Vernon (1981) suggested that this marketing was more “persuasive” than“informative” in nature, although the distinction between the two was not un-ambiguous. There is literature on advertising that assumes that advertisingchanges consumer preferences (Kaldor 1950), or advertising that informs con-sumers about existence and price of a product (Butters 1977), or advertisingthat informs consumers about product characteristics and price (Stigler 1961).Empirical papers have studied aspects of DTCA of prescription drugs using USdata. Berndt et al(1995), Iizuka(2004), Wosinska(2002), Rosenthal et al(2003)are to name a few.
3A recent New York Time article (August 3, 2005: Drug Makers to Police Consumer Campaigns)reports that spending on DTCA in 2004 was 4 billion dollars
4source: Prescription Drugs Trends, a chartbook update by Kaiser Family Foundation, November2001.
5
FDAapproval
date
TotalPhysician
Promotion toSales Ratio
3-year DTCto salesratio
AntidepressantsCELEXA 1998 0.52 0.00SERZONE 1994 0.35 0.01
EFFEXOR XR 1993 0.21 0.00PAXIL 1992 0.16 0.01
ZOLOFT 1991 0.14 0.00PROZAC 1987 0.09 0.01
PPIsACIPHEX 1999 2.05 0.00PREVACID 1995 0.15 0.00PRILOSEC 1989 0.08 0.02
AntihistaminesASTELIN 1996 0.68 0.00
SEMPREX-D 1994 0.44 0.00ALLEGRA 1996 0.26 0.11ZYRTEC 1995 0.30 0.15
CLARITIN 1993 0.08 0.06
CholesterolLESCOL 1993 0.18 0.00
PRAVACHOL 1991 0.13 0.05LIPITOR 1996 0.12 0.01ZOCOR 1991 0.11 0.03
MEVACOR 1991 0.02 0.00
Nasal SpraysNASONEX 1997 0.48 0.23
RHINOCORT 1994 0.32 0.00NASACORT 1991 0.47 0.09FLONASE 1994 0.20 0.12
VANCENASE BEFORE 1982 0.40 0.00BECONASE BEFORE 1982 0.00 0.00
Table 1: Approval Date and Promotion to Sales Ratios for Five Therapeutic Classes,1997-1999 (Source: Demand Effects of Recent Changes in Prescription Drug Promo-tion, Rosenthal et. al, June 2003)
6
3 Models Demonstrating the Existence of
SPNEs:
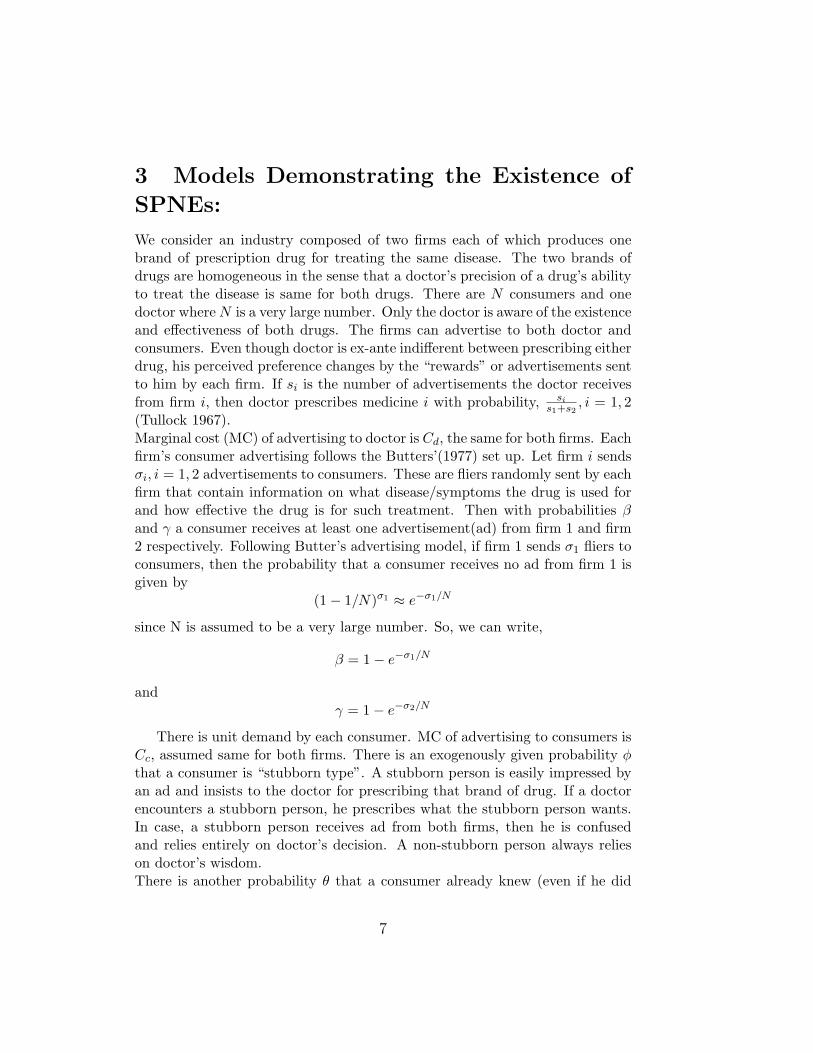
We consider an industry composed of two firms each of which produces onebrand of prescription drug for treating the same disease. The two brands ofdrugs are homogeneous in the sense that a doctor’s precision of a drug’s abilityto treat the disease is same for both drugs. There are N consumers and onedoctor where N is a very large number. Only the doctor is aware of the existenceand effectiveness of both drugs. The firms can advertise to both doctor andconsumers. Even though doctor is ex-ante indifferent between prescribing eitherdrug, his perceived preference changes by the “rewards” or advertisements sentto him by each firm. If si is the number of advertisements the doctor receivesfrom firm i, then doctor prescribes medicine i with probability, si
s1+s2, i = 1, 2
(Tullock 1967).Marginal cost (MC) of advertising to doctor is Cd, the same for both firms. Eachfirm’s consumer advertising follows the Butters’(1977) set up. Let firm i sendsσi, i = 1, 2 advertisements to consumers. These are fliers randomly sent by eachfirm that contain information on what disease/symptoms the drug is used forand how effective the drug is for such treatment. Then with probabilities βand γ a consumer receives at least one advertisement(ad) from firm 1 and firm2 respectively. Following Butter’s advertising model, if firm 1 sends σ1 fliers toconsumers, then the probability that a consumer receives no ad from firm 1 isgiven by
(1− 1/N)σ1 ≈ e−σ1/N
since N is assumed to be a very large number. So, we can write,
β = 1− e−σ1/N
andγ = 1− e−σ2/N
There is unit demand by each consumer. MC of advertising to consumers isCc, assumed same for both firms. There is an exogenously given probability φthat a consumer is “stubborn type”. A stubborn person is easily impressed byan ad and insists to the doctor for prescribing that brand of drug. If a doctorencounters a stubborn person, he prescribes what the stubborn person wants.In case, a stubborn person receives ad from both firms, then he is confusedand relies entirely on doctor’s decision. A non-stubborn person always relieson doctor’s wisdom.There is another probability θ that a consumer already knew (even if he did
7
not receive any ad) about the existence of this disease and that the diseasewas treatable by visiting the doctor. 5 We assume that every consumer is apotential patient if he knows about the symptoms and treatment possibility.
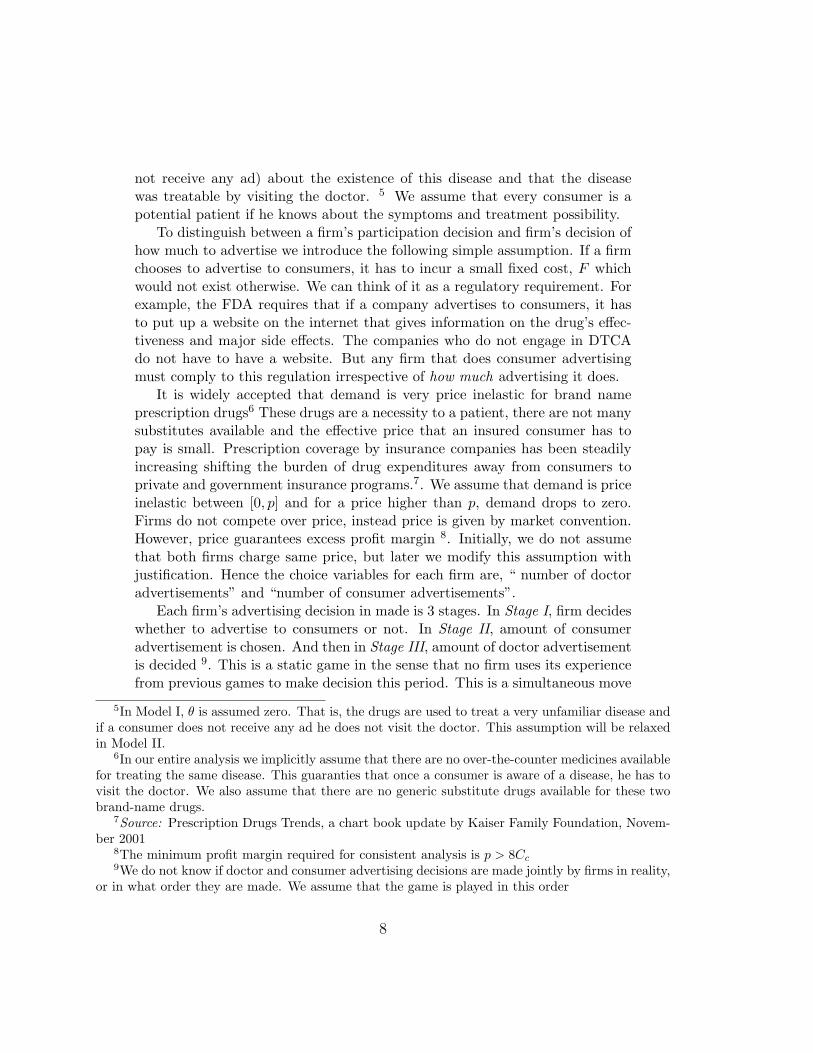
To distinguish between a firm’s participation decision and firm’s decision ofhow much to advertise we introduce the following simple assumption. If a firmchooses to advertise to consumers, it has to incur a small fixed cost, F whichwould not exist otherwise. We can think of it as a regulatory requirement. Forexample, the FDA requires that if a company advertises to consumers, it hasto put up a website on the internet that gives information on the drug’s effec-tiveness and major side effects. The companies who do not engage in DTCAdo not have to have a website. But any firm that does consumer advertisingmust comply to this regulation irrespective of how much advertising it does.
It is widely accepted that demand is very price inelastic for brand nameprescription drugs6 These drugs are a necessity to a patient, there are not manysubstitutes available and the effective price that an insured consumer has topay is small. Prescription coverage by insurance companies has been steadilyincreasing shifting the burden of drug expenditures away from consumers toprivate and government insurance programs.7. We assume that demand is priceinelastic between [0, p] and for a price higher than p, demand drops to zero.Firms do not compete over price, instead price is given by market convention.However, price guarantees excess profit margin 8. Initially, we do not assumethat both firms charge same price, but later we modify this assumption withjustification. Hence the choice variables for each firm are, “ number of doctoradvertisements” and “number of consumer advertisements”.
Each firm’s advertising decision in made is 3 stages. In Stage I, firm decideswhether to advertise to consumers or not. In Stage II, amount of consumeradvertisement is chosen. And then in Stage III, amount of doctor advertisementis decided 9. This is a static game in the sense that no firm uses its experiencefrom previous games to make decision this period. This is a simultaneous move
5In Model I, θ is assumed zero. That is, the drugs are used to treat a very unfamiliar disease andif a consumer does not receive any ad he does not visit the doctor. This assumption will be relaxedin Model II.
6In our entire analysis we implicitly assume that there are no over-the-counter medicines availablefor treating the same disease. This guaranties that once a consumer is aware of a disease, he has tovisit the doctor. We also assume that there are no generic substitute drugs available for these twobrand-name drugs.
7Source: Prescription Drugs Trends, a chart book update by Kaiser Family Foundation, Novem-ber 2001
8The minimum profit margin required for consistent analysis is p > 8Cc9We do not know if doctor and consumer advertising decisions are made jointly by firms in reality,
or in what order they are made. We assume that the game is played in this order
8

game where firms observe each other’s move at the end of every stage.To solve the model by backward induction, first we find out profit maximiz-
ing levels of s1 and s2 given σ1 and σ2. Then we substitute s1(σ1, σ2); s2(σ1, σ2)in the original profit functions to find the profit maximizing levels of σ1 andσ2 in terms of the parameters of the model. And finally, we compare fourdifferent cases(different sub-games) where either both firms advertise to con-sumers, or one advertises but the other does not and where no one advertisesto consumers. By comparing expected profits in all these cases we are able todetermine if there is any pure strategy sub-game perfect Nash equilibrium inthis game.
Model I: Unfamiliar disease
General expected profit function10 for firm 1 is written as:
E[π1] = Np1[φβ(1− γ) +s1
s1 + s2{φβγ + (1− φ)(β + γ − βγ)}]− σ1Cc − s1Cd − F
This implies,
E[π1(σ1, s1)] = Np1[φ(1− e−σ1/N )e−σ2/N +s1
s1 + s2(1− e−σ1/Ne−σ2/N+
2φe−σ1/Ne−σ2/N − φe−σ1/N − φe−σ2/N )]− σ1Cc − s1Cd − F
Similarly for firm 2 the general profit function can be written as:
E[π2] = Np2[φ(1− β)γ +s2
s1 + s2{φβγ + (1− φ)(β + γ − βγ)}]− σ2Cc − s2Cd − F
Thus,
E[π2(σ2, s2)] = Np2[φe−σ1/N (1− e−σ2/N ) +s2
s1 + s2(1− e−σ1/Ne−σ2/N+
2φe−σ1/Ne−σ2/N − φe−σ1/N − φe−σ2/N )]− σ2Cc − s2Cd − F
10when firm advertises to consumers
9
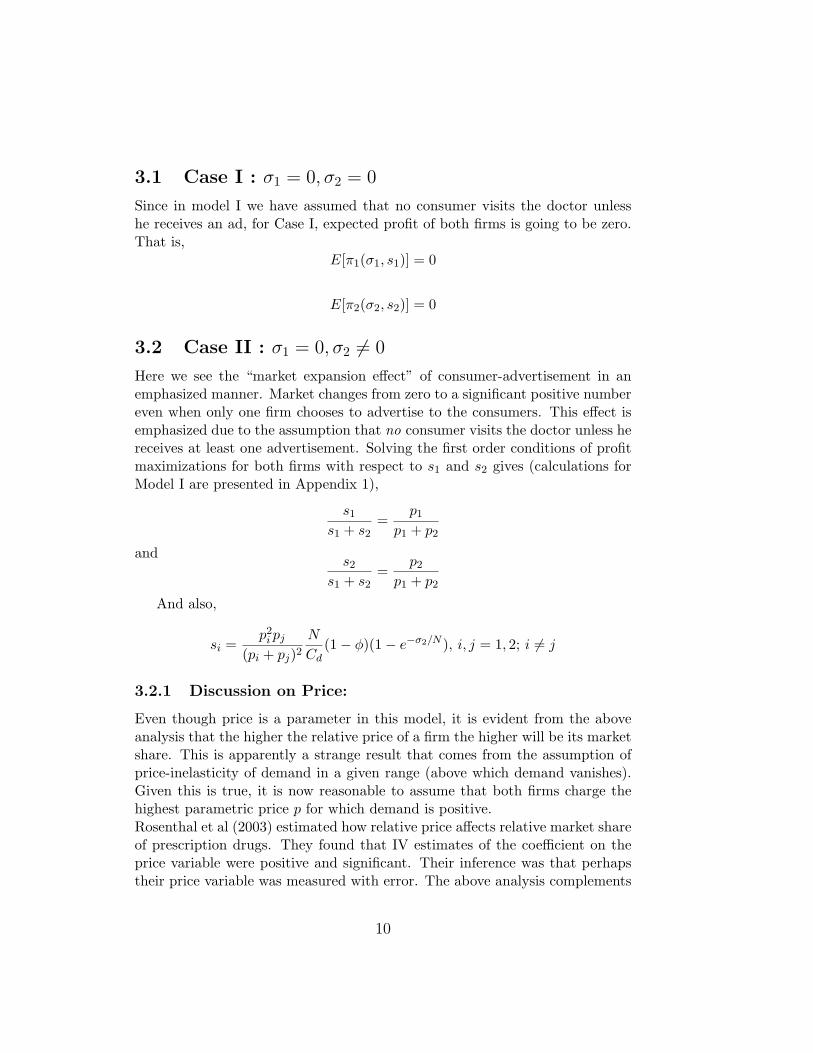
3.1 Case I : σ1 = 0, σ2 = 0
Since in model I we have assumed that no consumer visits the doctor unlesshe receives an ad, for Case I, expected profit of both firms is going to be zero.That is,
E[π1(σ1, s1)] = 0
E[π2(σ2, s2)] = 0
3.2 Case II : σ1 = 0, σ2 6= 0
Here we see the “market expansion effect” of consumer-advertisement in anemphasized manner. Market changes from zero to a significant positive numbereven when only one firm chooses to advertise to the consumers. This effect isemphasized due to the assumption that no consumer visits the doctor unless hereceives at least one advertisement. Solving the first order conditions of profitmaximizations for both firms with respect to s1 and s2 gives (calculations forModel I are presented in Appendix 1),
s1
s1 + s2=
p1
p1 + p2
ands2
s1 + s2=
p2
p1 + p2
And also,
si =p2
i pj
(pi + pj)2N
Cd(1− φ)(1− e−σ2/N ), i, j = 1, 2; i 6= j
3.2.1 Discussion on Price:
Even though price is a parameter in this model, it is evident from the aboveanalysis that the higher the relative price of a firm the higher will be its marketshare. This is apparently a strange result that comes from the assumption ofprice-inelasticity of demand in a given range (above which demand vanishes).Given this is true, it is now reasonable to assume that both firms charge thehighest parametric price p for which demand is positive.Rosenthal et al (2003) estimated how relative price affects relative market shareof prescription drugs. They found that IV estimates of the coefficient on theprice variable were positive and significant. Their inference was that perhapstheir price variable was measured with error. The above analysis complements
10
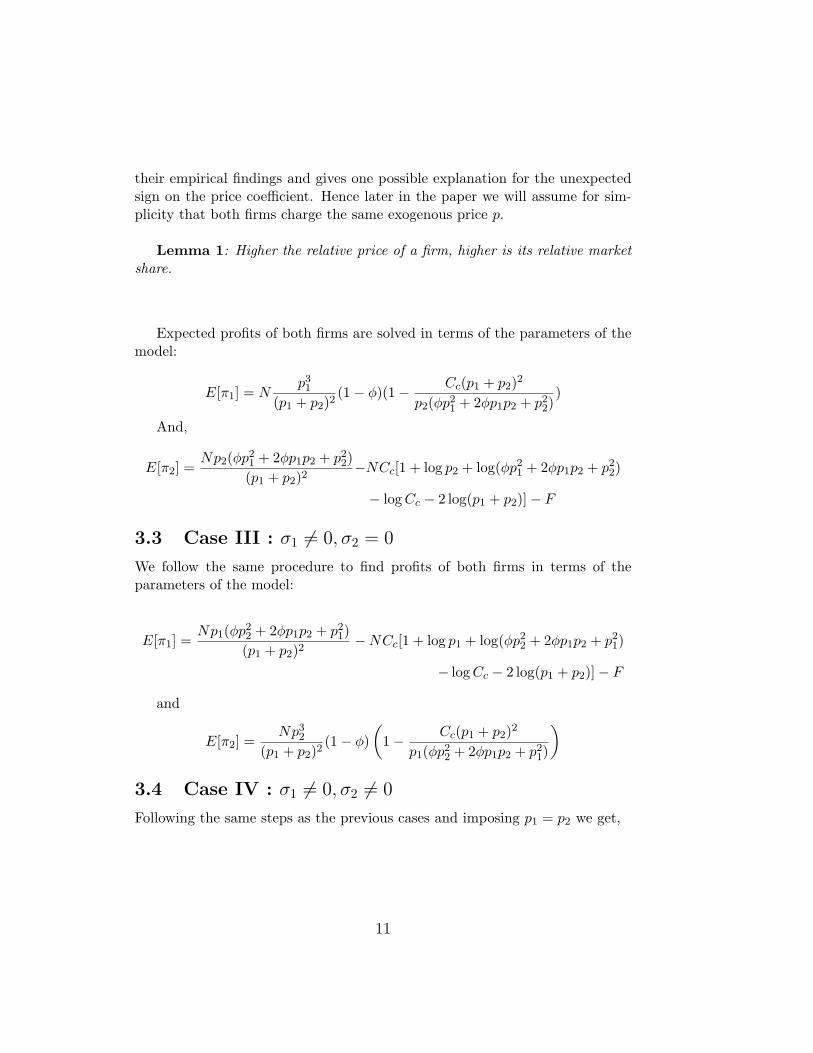
their empirical findings and gives one possible explanation for the unexpectedsign on the price coefficient. Hence later in the paper we will assume for sim-plicity that both firms charge the same exogenous price p.
Lemma 1: Higher the relative price of a firm, higher is its relative marketshare.
Expected profits of both firms are solved in terms of the parameters of themodel:
E[π1] = Np31
(p1 + p2)2(1− φ)(1− Cc(p1 + p2)2
p2(φp21 + 2φp1p2 + p2
2))
And,
E[π2] =Np2(φp2
1 + 2φp1p2 + p22)
(p1 + p2)2−NCc[1 + log p2 + log(φp2
1 + 2φp1p2 + p22)
− log Cc − 2 log(p1 + p2)]− F
3.3 Case III : σ1 6= 0, σ2 = 0
We follow the same procedure to find profits of both firms in terms of theparameters of the model:
E[π1] =Np1(φp2
2 + 2φp1p2 + p21)
(p1 + p2)2−NCc[1 + log p1 + log(φp2
2 + 2φp1p2 + p21)
− log Cc − 2 log(p1 + p2)]− F
and
E[π2] =Np3
2
(p1 + p2)2(1− φ)
(1− Cc(p1 + p2)2
p1(φp22 + 2φp1p2 + p2
1)
)
3.4 Case IV : σ1 6= 0, σ2 6= 0
Following the same steps as the previous cases and imposing p1 = p2 we get,
11
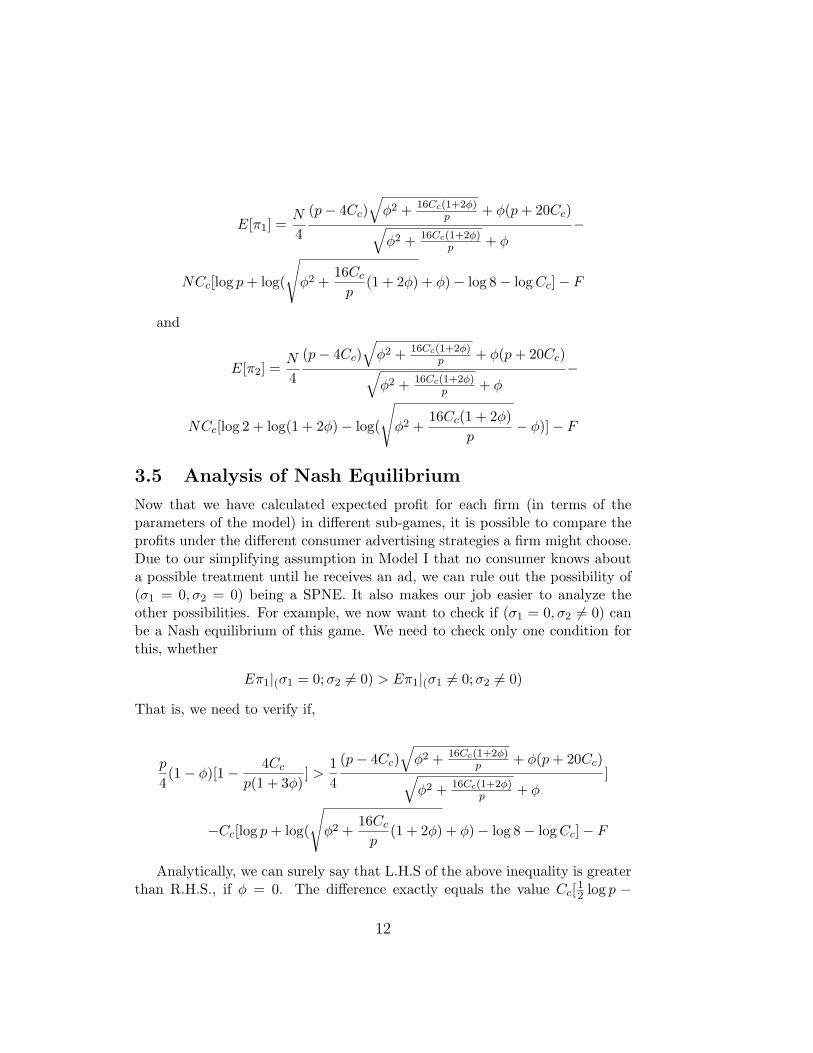
E[π1] =N
4
(p− 4Cc)√
φ2 + 16Cc(1+2φ)p + φ(p + 20Cc)√
φ2 + 16Cc(1+2φ)p + φ
−
NCc[log p + log(
√φ2 +
16Cc
p(1 + 2φ) + φ)− log 8− log Cc]− F
and
E[π2] =N
4
(p− 4Cc)√
φ2 + 16Cc(1+2φ)p + φ(p + 20Cc)√
φ2 + 16Cc(1+2φ)p + φ
−
NCc[log 2 + log(1 + 2φ)− log(
√φ2 +
16Cc(1 + 2φ)p
− φ)]− F
3.5 Analysis of Nash Equilibrium
Now that we have calculated expected profit for each firm (in terms of theparameters of the model) in different sub-games, it is possible to compare theprofits under the different consumer advertising strategies a firm might choose.Due to our simplifying assumption in Model I that no consumer knows abouta possible treatment until he receives an ad, we can rule out the possibility of(σ1 = 0, σ2 = 0) being a SPNE. It also makes our job easier to analyze theother possibilities. For example, we now want to check if (σ1 = 0, σ2 6= 0) canbe a Nash equilibrium of this game. We need to check only one condition forthis, whether
Eπ1|(σ1 = 0;σ2 6= 0) > Eπ1|(σ1 6= 0;σ2 6= 0)
That is, we need to verify if,
p
4(1− φ)[1− 4Cc
p(1 + 3φ)] >
14
(p− 4Cc)√
φ2 + 16Cc(1+2φ)p + φ(p + 20Cc)√
φ2 + 16Cc(1+2φ)p + φ
]
−Cc[log p + log(
√φ2 +
16Cc
p(1 + 2φ) + φ)− log 8− log Cc]− F
Analytically, we can surely say that L.H.S of the above inequality is greaterthan R.H.S., if φ = 0. The difference exactly equals the value Cc[12 log p −
12
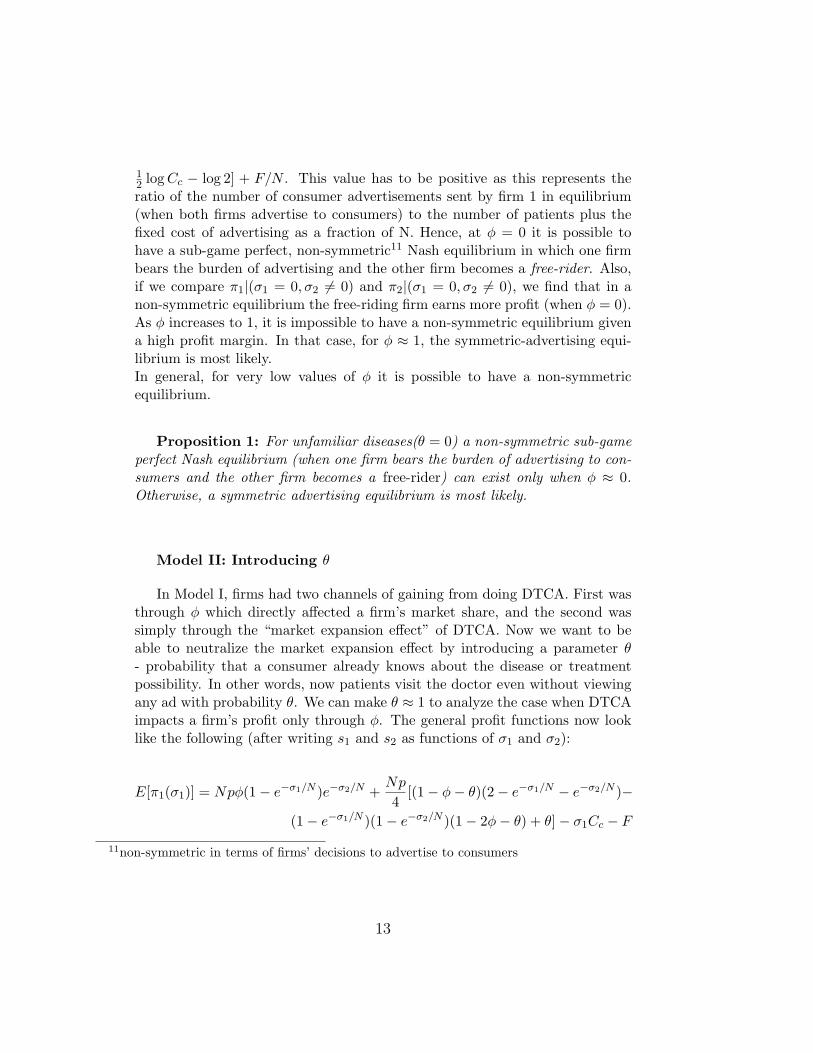
12 log Cc − log 2] + F/N . This value has to be positive as this represents theratio of the number of consumer advertisements sent by firm 1 in equilibrium(when both firms advertise to consumers) to the number of patients plus thefixed cost of advertising as a fraction of N. Hence, at φ = 0 it is possible tohave a sub-game perfect, non-symmetric11 Nash equilibrium in which one firmbears the burden of advertising and the other firm becomes a free-rider. Also,if we compare π1|(σ1 = 0, σ2 6= 0) and π2|(σ1 = 0, σ2 6= 0), we find that in anon-symmetric equilibrium the free-riding firm earns more profit (when φ = 0).As φ increases to 1, it is impossible to have a non-symmetric equilibrium givena high profit margin. In that case, for φ ≈ 1, the symmetric-advertising equi-librium is most likely.In general, for very low values of φ it is possible to have a non-symmetricequilibrium.
Proposition 1: For unfamiliar diseases(θ = 0) a non-symmetric sub-gameperfect Nash equilibrium (when one firm bears the burden of advertising to con-sumers and the other firm becomes a free-rider) can exist only when φ ≈ 0.Otherwise, a symmetric advertising equilibrium is most likely.
Model II: Introducing θ
In Model I, firms had two channels of gaining from doing DTCA. First wasthrough φ which directly affected a firm’s market share, and the second wassimply through the “market expansion effect” of DTCA. Now we want to beable to neutralize the market expansion effect by introducing a parameter θ- probability that a consumer already knows about the disease or treatmentpossibility. In other words, now patients visit the doctor even without viewingany ad with probability θ. We can make θ ≈ 1 to analyze the case when DTCAimpacts a firm’s profit only through φ. The general profit functions now looklike the following (after writing s1 and s2 as functions of σ1 and σ2):
E[π1(σ1)] = Npφ(1− e−σ1/N )e−σ2/N +Np
4[(1− φ− θ)(2− e−σ1/N − e−σ2/N )−
(1− e−σ1/N )(1− e−σ2/N )(1− 2φ− θ) + θ]− σ1Cc − F
11non-symmetric in terms of firms’ decisions to advertise to consumers
13
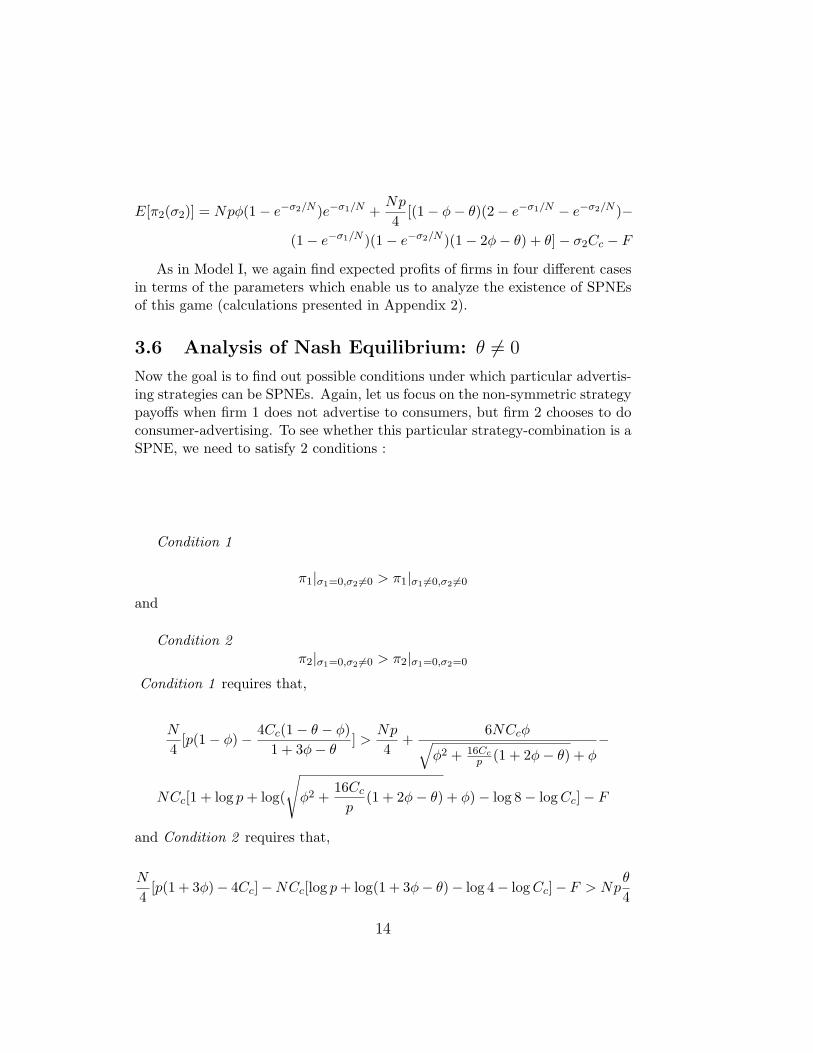
E[π2(σ2)] = Npφ(1− e−σ2/N )e−σ1/N +Np
4[(1− φ− θ)(2− e−σ1/N − e−σ2/N )−
(1− e−σ1/N )(1− e−σ2/N )(1− 2φ− θ) + θ]− σ2Cc − F
As in Model I, we again find expected profits of firms in four different casesin terms of the parameters which enable us to analyze the existence of SPNEsof this game (calculations presented in Appendix 2).
3.6 Analysis of Nash Equilibrium: θ 6= 0
Now the goal is to find out possible conditions under which particular advertis-ing strategies can be SPNEs. Again, let us focus on the non-symmetric strategypayoffs when firm 1 does not advertise to consumers, but firm 2 chooses to doconsumer-advertising. To see whether this particular strategy-combination is aSPNE, we need to satisfy 2 conditions :
Condition 1
π1|σ1=0,σ2 6=0 > π1|σ1 6=0,σ2 6=0
and
Condition 2π2|σ1=0,σ2 6=0 > π2|σ1=0,σ2=0
Condition 1 requires that,
N
4[p(1− φ)− 4Cc(1− θ − φ)
1 + 3φ− θ] >
Np
4+
6NCcφ√φ2 + 16Cc
p (1 + 2φ− θ) + φ−
NCc[1 + log p + log(
√φ2 +
16Cc
p(1 + 2φ− θ) + φ)− log 8− log Cc]− F
and Condition 2 requires that,
N
4[p(1 + 3φ)− 4Cc]−NCc[log p + log(1 + 3φ− θ)− log 4− log Cc]− F > Np
θ
4
14
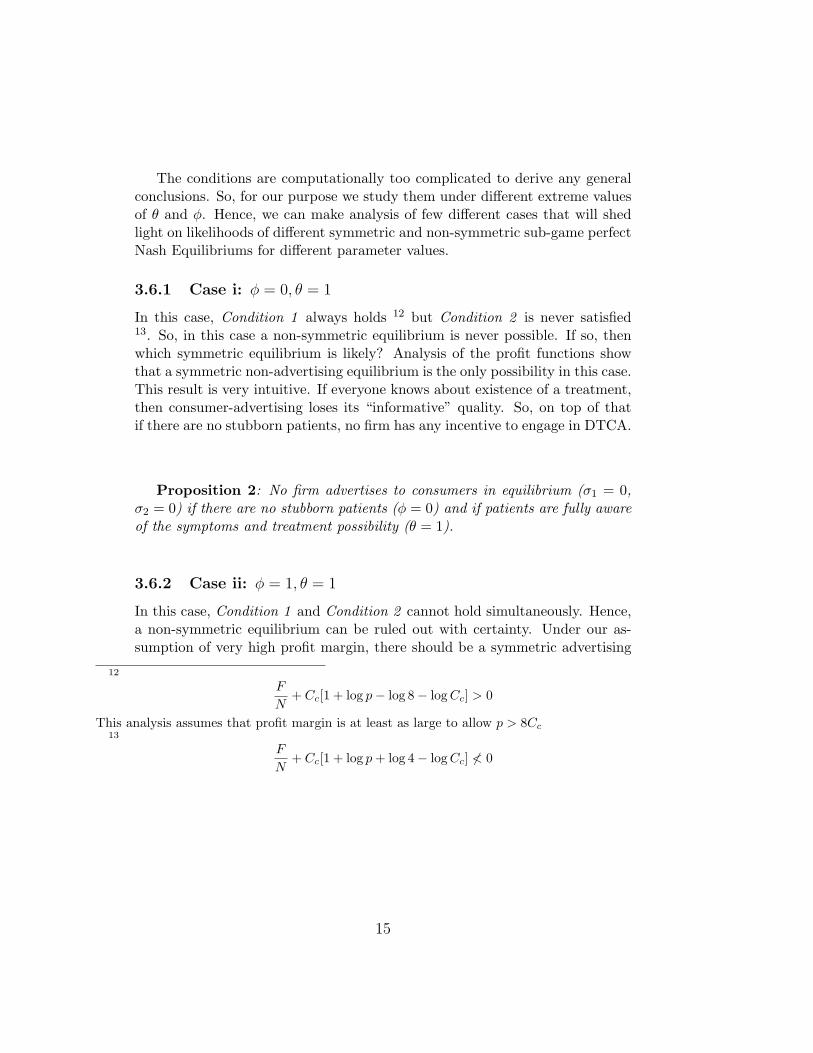
The conditions are computationally too complicated to derive any generalconclusions. So, for our purpose we study them under different extreme valuesof θ and φ. Hence, we can make analysis of few different cases that will shedlight on likelihoods of different symmetric and non-symmetric sub-game perfectNash Equilibriums for different parameter values.
3.6.1 Case i: φ = 0, θ = 1
In this case, Condition 1 always holds 12 but Condition 2 is never satisfied13. So, in this case a non-symmetric equilibrium is never possible. If so, thenwhich symmetric equilibrium is likely? Analysis of the profit functions showthat a symmetric non-advertising equilibrium is the only possibility in this case.This result is very intuitive. If everyone knows about existence of a treatment,then consumer-advertising loses its “informative” quality. So, on top of thatif there are no stubborn patients, no firm has any incentive to engage in DTCA.
Proposition 2: No firm advertises to consumers in equilibrium (σ1 = 0,σ2 = 0) if there are no stubborn patients (φ = 0) and if patients are fully awareof the symptoms and treatment possibility (θ = 1).
3.6.2 Case ii: φ = 1, θ = 1
In this case, Condition 1 and Condition 2 cannot hold simultaneously. Hence,a non-symmetric equilibrium can be ruled out with certainty. Under our as-sumption of very high profit margin, there should be a symmetric advertising
12
F
N+ Cc[1 + log p− log 8− log Cc] > 0
This analysis assumes that profit margin is at least as large to allow p > 8Cc13
F
N+ Cc[1 + log p + log 4− log Cc] 6< 0
15
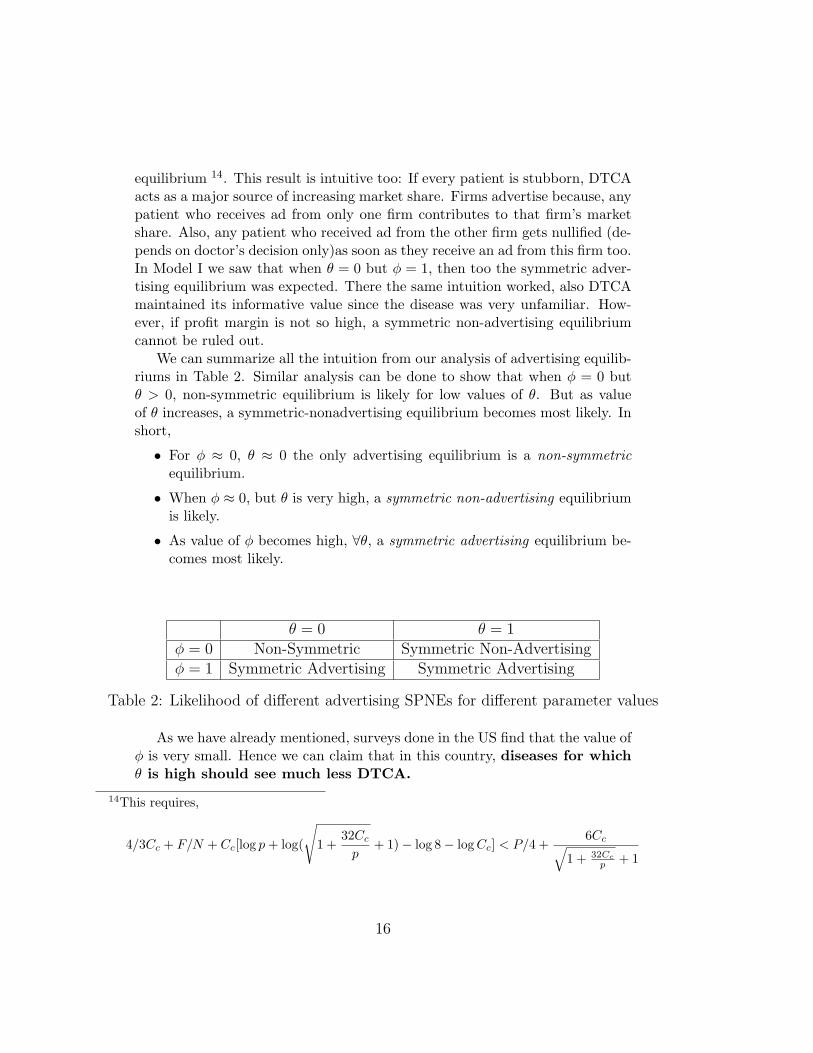
equilibrium 14. This result is intuitive too: If every patient is stubborn, DTCAacts as a major source of increasing market share. Firms advertise because, anypatient who receives ad from only one firm contributes to that firm’s marketshare. Also, any patient who received ad from the other firm gets nullified (de-pends on doctor’s decision only)as soon as they receive an ad from this firm too.In Model I we saw that when θ = 0 but φ = 1, then too the symmetric adver-tising equilibrium was expected. There the same intuition worked, also DTCAmaintained its informative value since the disease was very unfamiliar. How-ever, if profit margin is not so high, a symmetric non-advertising equilibriumcannot be ruled out.
We can summarize all the intuition from our analysis of advertising equilib-riums in Table 2. Similar analysis can be done to show that when φ = 0 butθ > 0, non-symmetric equilibrium is likely for low values of θ. But as valueof θ increases, a symmetric-nonadvertising equilibrium becomes most likely. Inshort,
• For φ ≈ 0, θ ≈ 0 the only advertising equilibrium is a non-symmetricequilibrium.
• When φ ≈ 0, but θ is very high, a symmetric non-advertising equilibriumis likely.
• As value of φ becomes high, ∀θ, a symmetric advertising equilibrium be-comes most likely.
θ = 0 θ = 1φ = 0 Non-Symmetric Symmetric Non-Advertisingφ = 1 Symmetric Advertising Symmetric Advertising
Table 2: Likelihood of different advertising SPNEs for different parameter values
As we have already mentioned, surveys done in the US find that the value ofφ is very small. Hence we can claim that in this country, diseases for whichθ is high should see much less DTCA.
14This requires,
4/3Cc + F/N + Cc[log p + log(
√1 +
32Cc
p+ 1)− log 8− log Cc] < P/4 +
6Cc√1 + 32Cc
p + 1
16
3.7 Correlation Between Doctor and Consumer Ad-vertisements
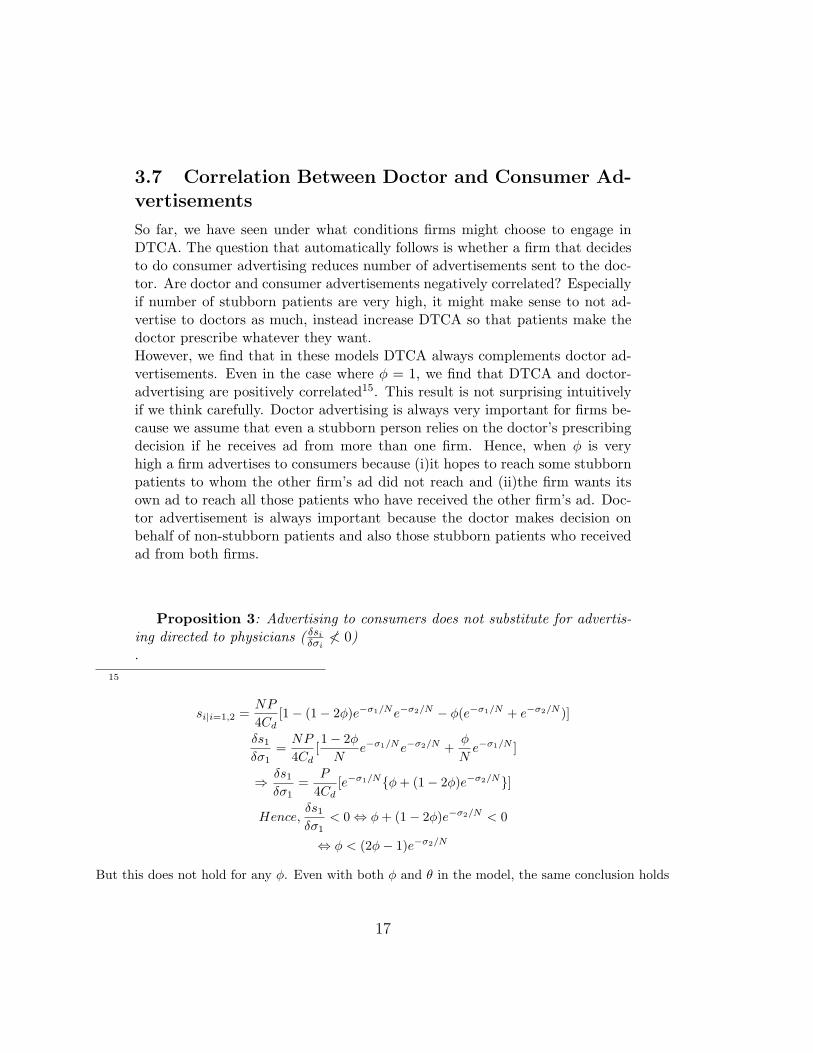
So far, we have seen under what conditions firms might choose to engage inDTCA. The question that automatically follows is whether a firm that decidesto do consumer advertising reduces number of advertisements sent to the doc-tor. Are doctor and consumer advertisements negatively correlated? Especiallyif number of stubborn patients are very high, it might make sense to not ad-vertise to doctors as much, instead increase DTCA so that patients make thedoctor prescribe whatever they want.However, we find that in these models DTCA always complements doctor ad-vertisements. Even in the case where φ = 1, we find that DTCA and doctor-advertising are positively correlated15. This result is not surprising intuitivelyif we think carefully. Doctor advertising is always very important for firms be-cause we assume that even a stubborn person relies on the doctor’s prescribingdecision if he receives ad from more than one firm. Hence, when φ is veryhigh a firm advertises to consumers because (i)it hopes to reach some stubbornpatients to whom the other firm’s ad did not reach and (ii)the firm wants itsown ad to reach all those patients who have received the other firm’s ad. Doc-tor advertisement is always important because the doctor makes decision onbehalf of non-stubborn patients and also those stubborn patients who receivedad from both firms.
Proposition 3: Advertising to consumers does not substitute for advertis-ing directed to physicians ( δsi
δσi6< 0)
.15
si|i=1,2 =NP
4Cd[1− (1− 2φ)e−σ1/Ne−σ2/N − φ(e−σ1/N + e−σ2/N )]
δs1
δσ1=
NP
4Cd[1− 2φ
Ne−σ1/Ne−σ2/N +
φ
Ne−σ1/N ]
⇒ δs1
δσ1=
P
4Cd[e−σ1/N{φ + (1− 2φ)e−σ2/N}]
Hence,δs1
δσ1< 0 ⇔ φ + (1− 2φ)e−σ2/N < 0
⇔ φ < (2φ− 1)e−σ2/N
But this does not hold for any φ. Even with both φ and θ in the model, the same conclusion holds
17
4 Conclusion
Our goal was to find out which advertising strategies are likely to be employedand under what circumstances when it comes to promoting a product in aspecialized market set up. Focusing specifically on the pharmaceutical industrywe find that engaging in DTCA is indeed the logical thing to do for companiesif,
1. many consumers are willing to contribute to their own prescription deci-sions, and
2. the prescription medication is used to treat unfamiliar diseases
Our analysis is based on the assumption that the companies must have avery high profit margin. Indeed, pharmaceuticals more often than not rankas the most profitable sector in the United States 16. The observed trend17 inadvertising by the U.S. pharmaceutical companies can be well-explained by ourmodel. Our theoretical conclusion complements the empirical finding by Iizuka(2004) that DTCA is mostly done for under-treated diseases. That is, we seeDTCA for disease categories that have very low values of θ in general. Also, ac-cording to surveys 18conducted by several pharmaceutical research groups onlyvery small percent of patients can be called stubborn consumers. Less than 30%patients talk to their doctors after viewing an ad about a particular drug, andonly few of them effectively succeed to make their doctors prescribe what theywanted. So, this suggests that φ is not very large for U.S. patients and thesecan well explain why we find only some companies bearing the burden of adver-tising to consumers while others selling competing brands become free-riders onthem. As we have already mentioned, in reality we find significant within-classvariation in DTCA and our models suggest that such non-symmetric adver-tising is likely for unfamiliar diseases and when patients are not stubborn ingeneral. Also, it is easy to see that for unfamiliar diseases DTCA increasesawareness and hence marketsize, but the only channel through which DTCAcould affect market share is through stubborn patients. If there are not manystubborn patients, DTCA has no significant effect on marketshare. Thus, ourtheoretical result supports the facts and empirical findings.
Even without an explicit theoretical analysis on welfare effect of DTCA,intuitively we can say that if DTCA is done for low θ (unfamiliar-disease), thenit has a welfare improving effect. Patients who would not otherwise be treated
16Source: annual Fortune 500 ranking of America’s top industries17DTCA is concentrated among very few classes of drugs.18For example, 1997 Prevention magazine survey.
18
now consult a physician and get treatment as a result of DTCA19. However, ifDTCA is done for high φ (more consumers are stubborn type) it is likely to havea welfare-reducing effect if we assume that insisting patients distort doctor’sexpert decision, or arguing with patients result in the waste of valuable time(many doctor surveys suggest this). But whether the overall effect of DTCAon welfare is positive or negative will depend on the relative values of θ and φfor each particular disease category and market. Another point to notice hereis that, we show that doctor advertising is important even if it does not informquality or existence. Normally people believe that all drug companies advertiseto doctors because doctors need to know about the product and its quality.But we show that even if doctor knows about the product and its quality, firmsstill have incentives to heavily advertise to doctors as long as doctors can beinfluenced.
Even though the analysis in the paper is presented in the context of thepharmaceutical industry rather than in a general framework of manufacturers,experts and consumers, very similar intuition should hold in any specializedmarkets where consumers choose to rely on expert-opinion. Analysis in terms ofpharmaceutical companies, doctors and patients certainly have intuitive appeal.Introduction of so called “stubborn patients” makes the paper more relevantto other specialized markets where the consumers can have strong influence onthe experts.
This paper is only the first step in studying advertising prospects and chal-lenges in a specialized market setting. We believe there are many opportunitiesfor research in this area that can generate useful economic insights. Empiricaltests for the theoretical propositions derived in this paper are difficult due tounavailability of data. We are working on finding acceptable proxy variables.Future research agenda includes extending the model to multi-firm and multi-period settings.
19Again, our crucial assumption here is that there are no OTC medicines for these prescriptiondrugs. Otherwise, even when patients do not see a doctor, they can treat themselves using over-the-counter drugs
19
References
[1] Berndt, Ernst R., Linda T. Bui, David H. Reiley and Glen L. Urban,“Information, Marketing and Pricing in the U.S. Anti-Ulcer Drug Market,”American Economic Review Vol.85 No.2, (May 1995): pp. 100-105
[2] Bond, Ronald S. and David F. Lean, “Sales, Promotion and Product Dif-ferentiation in Two Prescription Drug Markets,” Washington DC: StaffReport of the Bureau of Economics of the Federal Trade Commission,(February 1977)
[3] Butters Gerard R., “Equilibrium Distributions of Sales and AdvertisingPrices,” The Review of Economic Studies Vol. 44 No.3, (Oct.,1977): pp.465-491
[4] Calfee, John E., Clifford Winston and Randolph Stempski, “Direct-to-consumer Advertising and the Demand for Cholesterol-reducing Drugs,”Journal of Law and Economics Vol. 45 No.2, (2002): pp. 673-690
[5] Henry J. Kaiser Family Foundation, “Prescription Drug Trends: A Chart-book,” (Menlo Park, CA, 2000)
[6] Hurwitz, Mark A. and Richard Caves, “Persuasion or Information? Pro-motion and the shares of Brand Name and Generic Pharmaceuticals,”Journal of Law and Economics Vol.31 No.5, (1988): pp. 299-320
[7] Iizuka T., and Jin G. Z., “The Effects of Direct to Consumer Advertisingin the Prescription Drug Markets,” (mimeo, Vanderbilt University, 2003)
[8] Iizuka T., “What Explains the Use of Direct-To-Consumer Advertising ofPrescription Drugs?,” The Journal of Industrial Economics Vol. LII No.3, (September 2004): pp. 349-377
[9] Kaiser Family Foundation, “Impact of Direct-to-Consumer Advertising on Prescription Drug Spending,”(http://www.kff.org/content/2003/6084/Impact Consumer revised 61803.pdf,2003)
[10] Kaldor Nicholas, “The Economic Aspects of Advertising,” Review of Eco-nomic Studies Vol. 18, (1950): pp. 1-27
[11] Rosenthal M. B., Berndt E. R., Donohue J. M., Epstein A. M. and Frank R.G.,“Demand Effects of Recent Changes in Prescription Drug Promotion,”Frontier in Health Policy Research Vol. 6, (MIT Press, Cambridge, MA,2003)
[12] Stigler George J.,“The Economics of Information,” Journal of PoliticalEconomy Vol. 69 No.3, (June 1961): pp. 213-225
20
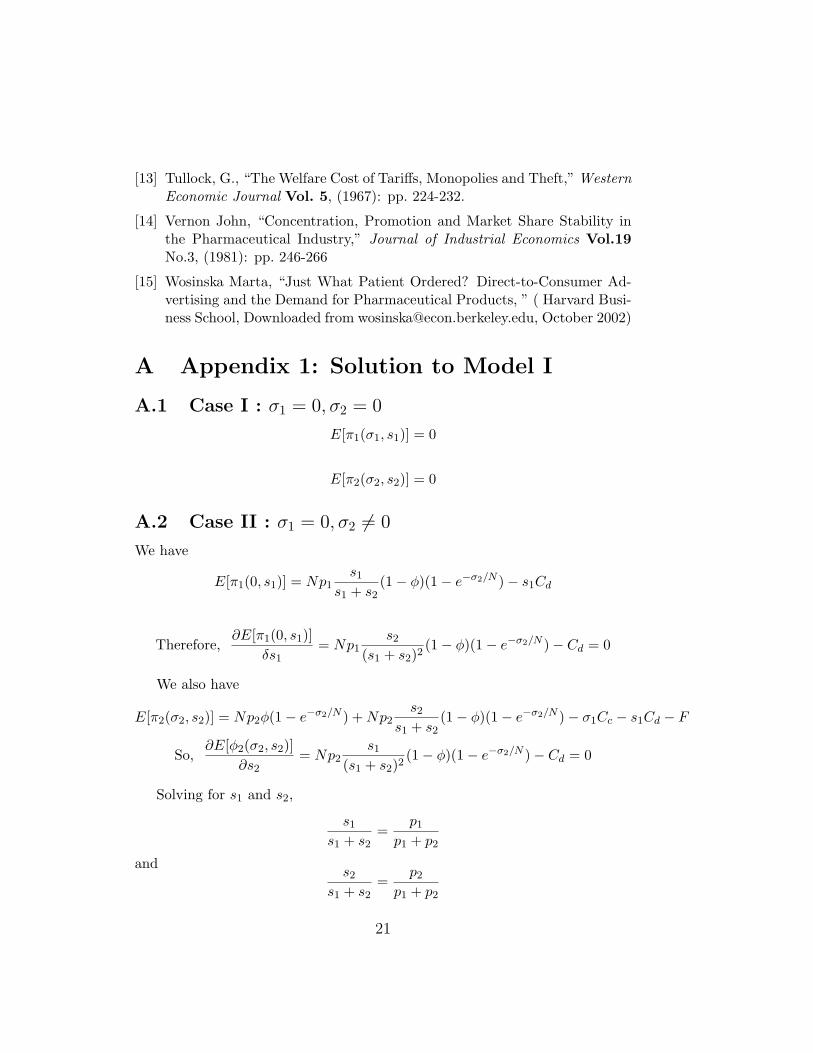
[13] Tullock, G., “The Welfare Cost of Tariffs, Monopolies and Theft,” WesternEconomic Journal Vol. 5, (1967): pp. 224-232.
[14] Vernon John, “Concentration, Promotion and Market Share Stability inthe Pharmaceutical Industry,” Journal of Industrial Economics Vol.19No.3, (1981): pp. 246-266
[15] Wosinska Marta, “Just What Patient Ordered? Direct-to-Consumer Ad-vertising and the Demand for Pharmaceutical Products, ” ( Harvard Busi-ness School, Downloaded from [email protected], October 2002)
A Appendix 1: Solution to Model I
A.1 Case I : σ1 = 0, σ2 = 0
E[π1(σ1, s1)] = 0
E[π2(σ2, s2)] = 0
A.2 Case II : σ1 = 0, σ2 6= 0
We have
E[π1(0, s1)] = Np1s1
s1 + s2(1− φ)(1− e−σ2/N )− s1Cd
Therefore,∂E[π1(0, s1)]
δs1= Np1
s2
(s1 + s2)2(1− φ)(1− e−σ2/N )− Cd = 0
We also have
E[π2(σ2, s2)] = Np2φ(1− e−σ2/N ) + Np2s2
s1 + s2(1− φ)(1− e−σ2/N )− σ1Cc − s1Cd − F
So,∂E[φ2(σ2, s2)]
∂s2= Np2
s1
(s1 + s2)2(1− φ)(1− e−σ2/N )− Cd = 0
Solving for s1 and s2,
s1
s1 + s2=
p1
p1 + p2
ands2
s1 + s2=
p2
p1 + p2
21

And also,
s1 =(p1)2p2
(p1 + p2)2N
Cd(1− φ)(1− e−σ2/N )
s2 =p1(p2)2
(p1 + p2)2N
Cd(1− φ)(1− e−σ2/N )
Putting these values back in the original profit functions,
E[π2(σ2)] = Np2φ(1− e−σ2/N ) + N(1− φ)(p2)3
(p1 + p2)2(1− e−σ2/N )− σ2Cc − F
So,∂E[π2(σ2)]
∂σ2= p2φe−σ2/N + (1− φ)
(p2)3
(p1 + p2)2e−σ2/N − Cc = 0
=⇒ e−σ2/N =Cc
p2
(p1 + p2)2
φp2 + 2φp1p2 + p2
Taking logarithms of both sides,
σ2
N= log p2 + log(φp2
1 + 2φp1p2 + p22)− log Cc − 2 log(p1 + p2)
Also,∂2E[π2(σ2)]
∂σ22
= −p2
Ne−σ2/N φp2
1 + 2φp1p2 + p22
(p1 + p2)2< 0
Using these results one can now write,
Eπ1 = Np31
(p1 + p2)2(1− φ)(1− Cc(p1 + p2)2
p2(φp21 + 2φp1p2 + p2
2))
Similarly, one can derive that
Eπ2 =Np2(φp2
1 + 2φp1p2 + p22)
(p1 + p2)2−NCc[1 + log p2 + log(φp2
1 + 2φp1p2 + p22)
− log Cc − 2 log(p1 + p2)]− F
A.3 Case III : σ1 6= 0, σ2 = 0
We follow the same procedure:
E[π1(σ1, s1)] = Np1φ(1− e−σ1/N ) + Np1s1
s1 + s2(1− φ)(1− e−σ1/N )− σ1C − c− s1Cd − F
=⇒ ∂[π1(σ1, s1)]∂s1
= Np1s2
(s1 + s2)2(1− φ)(1− e−σ1/N )− Cd = 0
22
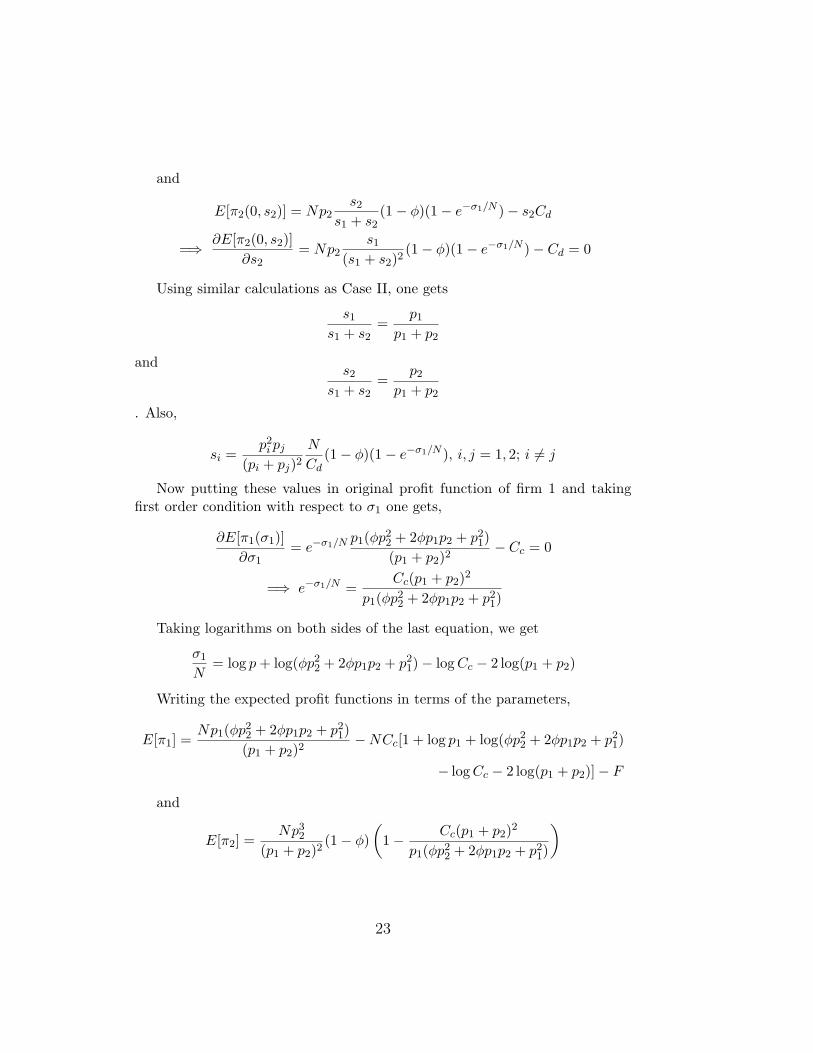
and
E[π2(0, s2)] = Np2s2
s1 + s2(1− φ)(1− e−σ1/N )− s2Cd
=⇒ ∂E[π2(0, s2)]∂s2
= Np2s1
(s1 + s2)2(1− φ)(1− e−σ1/N )− Cd = 0
Using similar calculations as Case II, one gets
s1
s1 + s2=
p1
p1 + p2
ands2
s1 + s2=
p2
p1 + p2
. Also,
si =p2
i pj
(pi + pj)2N
Cd(1− φ)(1− e−σ1/N ), i, j = 1, 2; i 6= j
Now putting these values in original profit function of firm 1 and takingfirst order condition with respect to σ1 one gets,
∂E[π1(σ1)]∂σ1
= e−σ1/N p1(φp22 + 2φp1p2 + p2
1)(p1 + p2)2
− Cc = 0
=⇒ e−σ1/N =Cc(p1 + p2)2
p1(φp22 + 2φp1p2 + p2
1)
Taking logarithms on both sides of the last equation, we get
σ1
N= log p + log(φp2
2 + 2φp1p2 + p21)− log Cc − 2 log(p1 + p2)
Writing the expected profit functions in terms of the parameters,
E[π1] =Np1(φp2
2 + 2φp1p2 + p21)
(p1 + p2)2−NCc[1 + log p1 + log(φp2
2 + 2φp1p2 + p21)
− log Cc − 2 log(p1 + p2)]− F
and
E[π2] =Np3
2
(p1 + p2)2(1− φ)
(1− Cc(p1 + p2)2
p1(φp22 + 2φp1p2 + p2
1)
)
23

A.4 Case IV : σ1 6= 0, σ2 6= 0
We now impose p1 = p2:
E[π1(σ1, s1)] = Np[φ(1− e−σ1/N )e−σ2/N +s1
s1 + s2(1− e−σ1/Ne−σ2/N+
2φe−σ1/Ne−σ2/N − φe−σ1/N − φe−σ2/N )]− σ1Cc − s1Cd − F
and
E[π2(σ2, s2)] = Np[φ(1− e−σ2/N )e−σ1/N +s2
s1 + s2(1− e−σ1/Ne−σ2/N+
2φe−σ1/Ne−σ2/N − φe−σ1/N − φe−σ2/N )]− σ2Cc − s2Cd − F
Taking first order conditions with respect to s1 and s2 and then solving,
s1
s1 + s2=
s2
s1 + s2=
12
and also,
s1 = s2 =Np
4Cd[1− e−σ1/Ne−σ2/N + 2φe−σ1/Ne−σ2/N − φe−σ1/N − φe−σ2/N ]
These values are put back in the profit functions, and then first order con-ditions are enforced with respect to σ1 and σ2 for π1 and π2 respectively. Andfinally, these first order conditions are solved to get values of σ1 and σ2 in termsof the parameters of the model.
E[π1(σ1)] = Npφ(1− e−σ1/N )e−σ2/N +Np
4(1− e−σ1/Ne−σ2/N+
2φe−σ1/Ne−σ2/N − φe−σ1/N − φe−σ2/N )− σ1Cc − F
E[π2(σ2)] = Npφ(1− e−σ2/N )e−σ1/N +Np
4(1− e−σ1/Ne−σ2/N+
2φe−σ1/Ne−σ2/N − φe−σ1/N − φe−σ2/N )− σ2Cc − F
=⇒ ∂E[π1(σ1)]∂σ1
=pe−σ1/N
4(e−σ2/N (1 + 2φ) + φ)− Cc = 0
∂E[π2(σ2)]∂σ2
=p
4e−σ1/Ne−σ2/N (1 + 2φ) +
pφ
4e−σ2/N − Cc = 0
and∂2E[πi(σi)]
∂σ2i
= −pe−σi/N
4N(e−σj/N (1 + 2φ) + φ) < 0, where i, j ∈ {1, 2}, i 6= j.
24
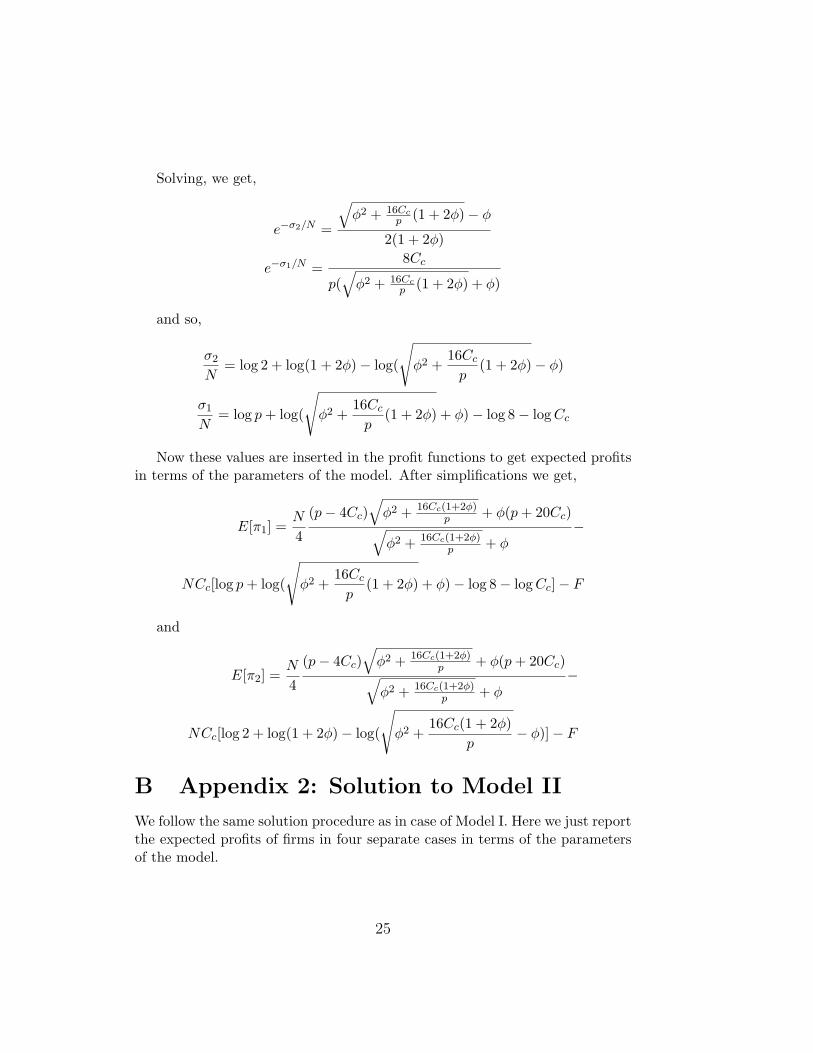
Solving, we get,
e−σ2/N =
√φ2 + 16Cc
p (1 + 2φ)− φ
2(1 + 2φ)
e−σ1/N =8Cc
p(√
φ2 + 16Ccp (1 + 2φ) + φ)
and so,
σ2
N= log 2 + log(1 + 2φ)− log(
√φ2 +
16Cc
p(1 + 2φ)− φ)
σ1
N= log p + log(
√φ2 +
16Cc
p(1 + 2φ) + φ)− log 8− log Cc
Now these values are inserted in the profit functions to get expected profitsin terms of the parameters of the model. After simplifications we get,
E[π1] =N
4
(p− 4Cc)√
φ2 + 16Cc(1+2φ)p + φ(p + 20Cc)√
φ2 + 16Cc(1+2φ)p + φ
−
NCc[log p + log(
√φ2 +
16Cc
p(1 + 2φ) + φ)− log 8− log Cc]− F
and
E[π2] =N
4
(p− 4Cc)√
φ2 + 16Cc(1+2φ)p + φ(p + 20Cc)√
φ2 + 16Cc(1+2φ)p + φ
−
NCc[log 2 + log(1 + 2φ)− log(
√φ2 +
16Cc(1 + 2φ)p
− φ)]− F
B Appendix 2: Solution to Model II
We follow the same solution procedure as in case of Model I. Here we just reportthe expected profits of firms in four separate cases in terms of the parametersof the model.
25
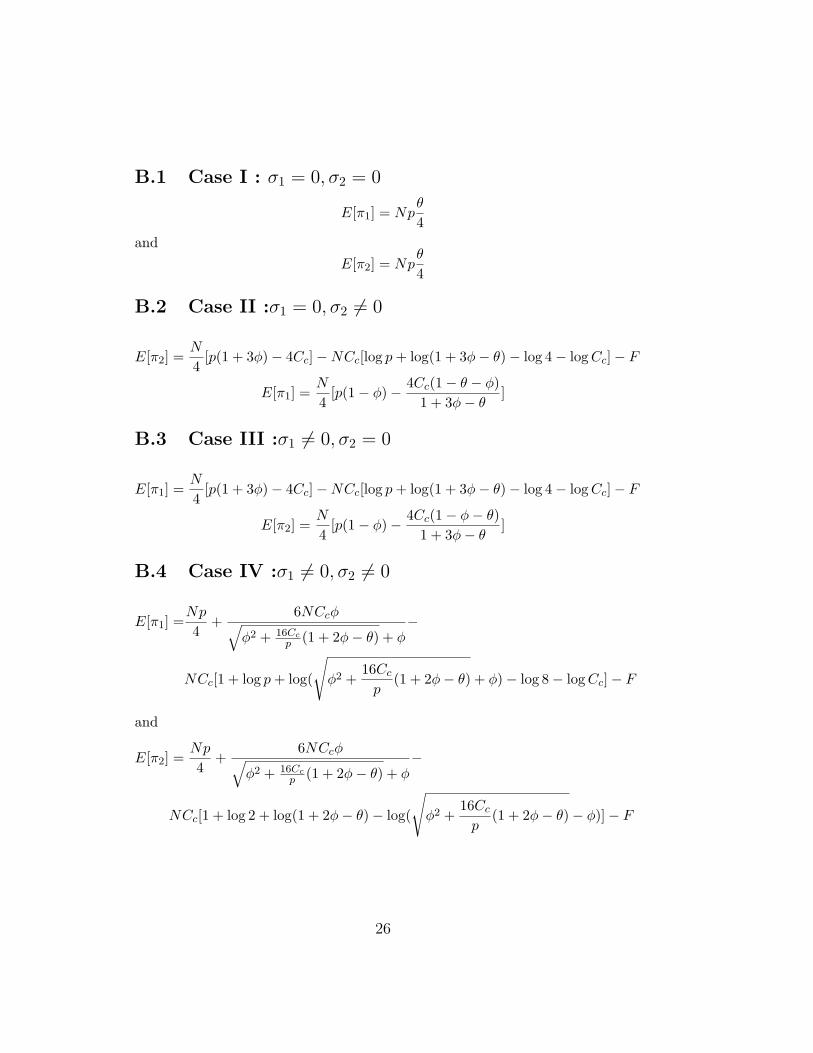
B.1 Case I : σ1 = 0, σ2 = 0
E[π1] = Npθ
4and
E[π2] = Npθ
4
B.2 Case II :σ1 = 0, σ2 6= 0
E[π2] =N
4[p(1 + 3φ)− 4Cc]−NCc[log p + log(1 + 3φ− θ)− log 4− log Cc]− F
E[π1] =N
4[p(1− φ)− 4Cc(1− θ − φ)
1 + 3φ− θ]
B.3 Case III :σ1 6= 0, σ2 = 0
E[π1] =N
4[p(1 + 3φ)− 4Cc]−NCc[log p + log(1 + 3φ− θ)− log 4− log Cc]− F
E[π2] =N
4[p(1− φ)− 4Cc(1− φ− θ)
1 + 3φ− θ]
B.4 Case IV :σ1 6= 0, σ2 6= 0
E[π1] =Np
4+
6NCcφ√φ2 + 16Cc
p (1 + 2φ− θ) + φ−
NCc[1 + log p + log(
√φ2 +
16Cc
p(1 + 2φ− θ) + φ)− log 8− log Cc]− F
and
E[π2] =Np
4+
6NCcφ√φ2 + 16Cc
p (1 + 2φ− θ) + φ−
NCc[1 + log 2 + log(1 + 2φ− θ)− log(
√φ2 +
16Cc
p(1 + 2φ− θ)− φ)]− F
26