Embed Size (px)
Citation preview


AUTHOR:
Phetsoulaphonh N. Choulatida, Rice post-harvest researcher Crop and Environmental Science Division (CESD) at IRRI
ADB Scholar 2009 – 2011, Colleges of Public Affairs & Agronomy
University of Philippines, Los Baños (UPLB)
[email protected] ; [email protected]
ADVISOR AT UPLB:
Dr. Rowena Barzaga dela Torre-Baconguis
Director, Ugnayan ng Pahinungod/Oblation Corps and
Associate Professor, Institute of Community Education
University of the Philippines – Los Baños
ADVISOR AT IRRI:
Martin Gummert
Senior Scientist, Grain Quality, Nutrition and Post-
harvest development Center (GQNPC)
International Rice Research Institute (IRRI), Manila,
Philippines [email protected]
COMMITTEE MEMBER AT COLLEGE OF PUBLIC AFFAIRS:
Dr. Jose R. Medina
Professor, Adult Education. Ugnayan ng Pahinungod/
Oblation Corps and Institute of Community Education
University of the Philippines – Los Baños
COMMITTEE MEMBER AT COLLEGE OF AGRONOMY:
Ma. Fatima O. Mercado
Professor, Rice post harvest and Seed Technology
Crop Science Cluster, College of Agronomy
University of the Philippines – Los Baños
1
2
3
4

i
EXTENSION GAPS IN THE PRODUCTION, POSTHARVEST
AND MARKETING SYSTEM OF ORGANIC RICE IN
SANGTHONG DISTRICT, VIENTIANE
CAPITAL, LAO PDR
PHETSOULAPHONH N. CHOULATIDA
SUBMITTED TO THE FACULTY OF GRADUATE SCHOOL
UNIVERSITY OF THE PHILIPPINES LOS BANOS
IN PARTIAL FULFILLMENT OF THE
REQUIREMENTS FOR THE
DEGREE OF
MASTER OF SCIENCE
(Extension Education)
JUNE 2011

ii
The thesis hereto attached, entitled “EXTENSION GAPS IN THE PRODUCTION,
POSTHARVEST AND MARKETING SYSTEM OF ORGANIC RICE IN
SANGTHONG DISTRICT, VIENTIANE CAPITAL, LAO PDR” prepared and
submitted by PHETSOULAPHONH N. CHOULATIDA in partial fulfillment of the
requirements for the degree of MASTER OF SCIENCE (EXTENSION
EDUCATION) is hereby accepted.
MA. FATIMA O. MERCADO JOSE R. MEDINA
Member, Guidance Committee Member, Guidance Committee
Date Signed Date Signed
MARTIN GUMMERT ROWENA DT. BACONGUIS
Co-chair, Guidance Committee Chair, Guidance Committee
Date Signed Date Signed
Accepted as partial fulfillment of the requirements for the degree of MASTER
OF SCIENCE (EXTENSION EDUCATION)
MARIA ANA T. QUIMBO
Director, Institute of Community Education
Signed
OSCAR B. ZAMORA
Dean, Graduate School
University of the Philippines Los Baños
Date Signed

iii
BIOGRAPHICAL SKETCH
The author was born on March 12, 1978 in Savannakhet province, Lao PDR. He is the
oldest among four children of Mrs. Phouangphet Vilayphoumy and Dr. Khampha Choulatida
(deceased).
He completed his secondary education at Lycée Phonsavanh high school in 1996 and his
higher education at National University of Laos under the Faculty of Agriculture. In 2001, he
graduated with the degree of Bachelor of Plant Science.
He is currently connected with the International Non-Government Organizations
(INGOs), an agency aiming to alleviate poverty and improve the well-being of poor farmers
through increased agricultural production under a bilateral cooperation with the Ministry of
Agriculture and Forestry, LAO PDR.
As a master trainer, he develops appropriate curriculum packages and conducts training
for farmers. He organizes farmer groups and establishes network with processors and organic
exporters.
He was awarded a scholarship grant by the Asian Development Bank-Japanese
Scholarship Program in conjunction with International Rice Research Institute (IRRI) to pursue
graduate studies for MS program in Extension Education at the University of Philippines Los
Baños (UPLB).
He is married to Amphaiphone Keodouangvichit and has one son and one daughter.
PHETSOULAPHONH N. CHOULATIDA

iv
ACKNOWLEDGMENT
I would like to acknowledge the help of all those who motivated, challenged and
supported me in this work, specially: Dr. Rowena DT. Baconguis, my major adviser at UPLB for
all her enduring support, tireless revisions, unceasing patience, and understanding;
My special thanks to Senior Scientist Engr. Martin Gummert, my co-adviser at IRRI for
his inspiring guidance, valuable suggestions, strong support, and helpful advice during the
conduct of my experimental research;
Dr. Jose R. Medina and Ma. Fatima O. Mercado, members of the guidance committee,
for their valuably advice, constructive comments and suggestions;
The Asian Development Bank-Japanese Scholarship Program (ADB-JSP) and the
International Rice Research Institute (IRRI) for the full grant scholarship privilege through its
Deputy Director General (research), Achim Dobermann and IRRI-Training center manager, Dr.
Noel Magor;
My overwhelming thanks also go to Dr. Mariano de Ramos of INSTAT Statistical
Consulting Group in UPLB for his constructive comments regarding my statistical outputs and
for Jeff and Jane for helping me process my data,
My gratitude also goes to Mrs. Khamtay Vongxaya, Rice and Cash Crop Research Center
(RCRC), Miss May Inthalangsy, Provincial Agriculture and Forestry Extension Service (PAFES),
Mr. Sythuan Salavongsy, District Agriculture and Forestry Extension Service (DAFES) who
assisted me during data gathering, field experimental research and laboratory examination.
Special heartfelt thanks likewise go to all my UPLB professors who gave me invaluable
knowledge,
I am very thankful to my mother for the encouragement and moral support that she gave
throughout my study;
Ultimately, I wish to express my gratitude to my dearest wife Ampaiphone, my
handsome son Phonesavanh, and my beautiful daughter Nylandon for their love, understanding,
sacrifices, prayer and moral support, and in sharing with me all the joys and sadness that I
experienced during my study.

v
TABLE OF CONTENTS
CHAPTER
Title Page
Approval Page
Biographical Sketch
Acknowledgement
Table of Contents
List of Tables
List of Figures
List of Appendices
List of Appendix Figures
Abstract
PAGE
i
ii
iii
iv
v
viii
x
xi
xii
xiii
I INTRODUCTION 1
Statement of the Problem 3
Objectives of the Study 4
Significance of the Study 4
Scope and Limitations of the Study 5
II REVIEW OF RELATED LITERATURE 6
Extension 6
Extension System in Lao PDR 7
Extension Support for Organic Rice 9
Organic Rice Production 12
Organic Rice Production in Lao PDR 13
Certification Process in Lao PDR 15
Post harvest System and Farmer’s Practices in Lao PDR 20
Organic Rice Post Harvest Monitoring in Lao PDR 30
Martketing of Organic Rice 31
Conceptual Framework 34

vi
CHAPTER
III METHODOLOGY
PAGE
Location of the Study 36
Sampling Design 38
Data Collection Procedures 39
Data Analysis 41
IV RESULTS AND DISCUSSION 44
Socio-Economic Profile of Respondents 44
Age of Respondents 44
Gender of Respondents 46
Education of Respondents 46
Household Size 47
Farm Size 47
Family Income from Farm Activities 47
Family Income from Non-farm Activities 50
Household Family Members Working in the Farm 54
Cost of Organic Rice Production 54
Return Analysis from Rice Production 56
Organic Rice Production Practices 57
Schedule of Activities in Organic Rice Production 57
Sources of Fund in Organic Rice Production 58
Application Preparedness, Certification and Traceability
Process
59
Varieties Used in Organic Farming 60
Land Preparation Practices 62
Seedlings Establishment 63
Transplanting Practices 64
Organic Fertilizer Application 65
Common Pest in Rice Production 66
Harvesting Practices 68
Field Drying, Hauling and Piling Practices 69
Threshing and Transporting Practices 70
Organic Rice Yield Production 71
Storage Practices 71
Utilization Practices 73
Village Milling for Home Consumption 74
Paddy Marketing Through Village Collectors 75
Farmer’s Training Support System 76
Farmers’ Training Needs 79

vii
CHAPTER
PAGE
cha
Profile of Organic Rice Millers and Traders
80
Investigation of Paddy Moisture Content in the Granaries of
Organic Farmers
88
Effects of Availability of Family Labor on Moisture Content 91
Examination of Paddy Drying Practices and Grains Quality
Milling Test in Laboratory
93
Design of Flatbed Dryer in Pialath Village 94
Evaluating Drying Methods in the Field 95
Effect of the Drying Methods on Quality for the Three
Varieties
98
Varietal Effects on Quality for the Three Drying Treatments 103
Cost of Using Flatbed Dryer 106
Development of a Market Based Price Incentive Scheme for
Inclusion in Extension Campaigns to Encourage Better Post
Harvest Practices
107
Volatility of Paddy Price in Sangthong 108
Weight Loss in Drying 109
Farmers Practice 110
Grain Quality Payment Scheme Based on MC Analysis 111
Proposed Paddy Pricing Scheme Based on Moisture Content 112
Break-even Computation of Prices 113
Analysis of Milled Rice Exported and Sold to Foreign Markets 117
Proposed Extension Campaign Model 122
V SUMMARY, CONCLUSIONS AND RECOMMENDATIONS
130
Summary 130
Conclusion and Recommendations 141
Suggestions for Further Study 145
LITERATURE CITED 146
APPENDICES 154

viii
LIST OF TABLES
TABLE PAGE
1 Current certified organic farmers in 2009 19
2 Price range for paddy and milled rice in selected ASEAN countries 34
3 Socio-economic characteristics of respondents 45
4 Annual family income of respondents 48
5 Other sources of family income of respondents 50
6 Sources of annual family income 53
7 Number of household family members working in the farm 54
8 Cost of rice production per hectare 55
9 Return analysis per hectare from rice production 56
10 Organic rainfed rice farming calendar 57
11 Credit and other microfinance sources for rice growers 58
12 Organic certification activities 60
13 Uses of organic rice varieties in Sangthong district 61
14 Common land preparation practices in organic farms 63
15 Rice transplanting practices 64
16 Rice nutrient management 65
17 Pest-related problems in organic rice farms 67
18 Harvest practices and labor sources 69
19 Average yield per hectare of the three varieties 71
20 Characteristic of rice storage used by organic rice farmers 72
21 Rice utilization practices of farmers 73
22 Rice milling management system within household 74
23 Organic paddy purchasing scheme 76
24 Training programs attended 77
25 Training topics given by service providers 78
26 Training needs 79
27 Market channels of SomPhone rice mill 81
28 Market channels of SomHong rice mill 82
29 Green Field Miller Group (GFMG) production capacity and milling quality 83

ix
TABLE
PAGE
30 Market channels of SFSE 84
31 Market channels of LFP 86
32 Organic paddy purchased through certified traders, 2010 87
33 Summary market channels of rice millers and processors 87
34 Regression analysis of relationship between labor, area, number of
days of field dying and drying methods on moisture content for
glutinous variety
91
35 Regression analysis of relationship between labor, area, number of
days of field dying and drying methods on moisture content for non-
glutinous variety
92
36 Regression analysis of relationship between labor, area, number of
days of field dying and drying methods on moisture content for
purplish-blue rice
92
37 Experimental results of comparative drying practices in Pialath village 98
38 The ANOVA table for quality 103
39 Milling recovery and head rice recovery results 104
40 Estimated operating expenses per batch of 208 Kg 107
41 Calculation of weight and price as a function of moisture content
(case of HomSangthong glutinous rice)
111
42 Calculation of weight and price move as a function of moisture
content (case of HomSavanh non-glutinous and purplish-blue rice)
112
43 Moisture content based pricing scheme 113
44 Break even analysis using purchased paddy and computed revenue for
glutinous rice
115
45 Non-glutinous milled rice sold within domestic markets 116
46 Details of exportation for SomHong, Genoa, Italy, 2010 118
47 Details of exportation for SFSE, Vietnam, 2010 119
48 Details of exportation cost for LFP, European market 120
49 Calculation of actual cost and return analysis for traders (SOMHONG,
SFSE, and LFP)
121
50 Calculation of projected cost and return analysis for traders
(SOMHONG, SFSE, and LFP)
122
51 Proposed extension campaign 128

x
LIST OF FIGURES
FIGURE
PAGE
1 The knowledge support system for organic rice production 8
2 Types of clean agriculture and agro-ecosystem technology application
in Lao PDR
11
3 Diagrammatic study of the market flow of organic rice 35
4 Geographic map of study area 37
5 Representation of how samples were collected in flat bed dryer 41
6 Measurement of paddy moisture content of in the granaries based on
different field drying methods
88
7 Moisture content of paddy in the granaries 90
8 Principle of flat bed dryer in Sangthong organic rice farmer group 94
9 Results of physical quality test of glutinous rice 100
10 Results of physical quality test of non-glutinous rice 101
11 Results of physical quality test of purplish-blue rice 102
12 Paddy price at farm gate in Sangthong district 108
13 Proposed extension campaign model 123

xi
LIST OF APPENDICES
APPENDIX
PAGE
A Organic certification processes 155
B Research instrument 161
C Paddy weight computation uses for the quality payment 194
D Results of statistical analysis with SAS 9.1 195

xii
LIST OF APPENDIX FIGURES
APPENDIX
FIGURE
PAGE
1 Harvesting/cutting practices 203
2 Field drying practices 203
3 Piling practices 203
4 Hauling practices 204
5 Threshing, bagging, and transporting practices 204
6 Sun drying practices 204
7 Village granaries 205
8 Village rice mills 205
9 Village paddy trading 205
10 Green Field Miller Group (GFMG) 206
11 Rice processors and exporters 206
12 Sorting and packaging 206
13 Organically certified products 207
14 Domestic markets 207
15 Foreign markets 207
16 Field research on moisture content in granaries and drying trial 208
17 Mechanical drying treatment 209
18 Sun drying treatment 209
19 Shade drying treatment 209
20 Laboratory instrument 210

xiii
ABSTRACT
PHETSOULAPHONH N. CHOULATIDA, the University of the Philippines Los
Baños, June 2011. Extension Gaps in the Production, Postharvest and Marketing System
of Organic Rice in Sangthong District, Vientiane Capital, Lao PDR.
Major Professors: Dr. ROWENA DT. BACONGUIS
Engr. MARTIN GUMMERT
The study aimed to understand organic farmer and processor constraints and
potentials in coming up with quality organic rice that meets international standards in
Sangthong District in the Province of Vientiane capital, Lao PDR. The specific objectives
were: 1) describe the socio-economic characteristics of organic rice farmers; 2) explain
farmer practices in the organic rice postharvest system and traceability; 3) describe
processing and marketing aspect of the certified organic processors 4) investigate paddy
moisture content in the granaries of organic farmers; 5) conduct grains quality milling test in
laboratory with different types of paddy drying practice; 6) develop a market-based price
incentive scheme for inclusion in extension campaigns to encourage better post harvest
practices.
One hundred ninety seven (197) certified organic farmers served as respondents of
the study. Structured interview was conducted among respondents. Data was analyzed using
descriptive statistical tools such as percentages, means, standard deviation, t-test and chi-
square. ANOVA was used to analyze laboratory tests while economic cost and return
analysis was used to investigate capability of traders to pay premium prices.

xiv
Results reveal that farmers are past middle age and have low educational attainment.
Moreover, survey results on farmer practices and laboratory tests on paddy rice confirm that
premium grain quality is not achieved because of failure of farmers to meet desirable levels
of moisture content. Based on experimentation, shade drying produced better head rice
recovery. However, mechanical drying has better potentials to improve grain quality because
of less infrastructure investment needed. Based on economic cost and return analysis, organic
rice processors can afford to give premium price incentive to farmers and still earn profit if
they export to established markets.
The major contribution of this study were the provision of local evidences on the
effect of moisture content to grain quality and come up with a price based incentive scheme
based on actual data from survey and export data from processors in Santhong District. To
facilitate improvement in organic rice quality, a broad based, participatory and market
oriented extension campaign is proposed. The organic rice supply chain will guide the
extension campaign to integrate all capability and infrastructure needs identified, address
constraints and maximize potentials faced by actors.
Given the importance of good post harvest system, the feasibility of establishing a
farmer association managed rice mill which is seen to simplify organic rice certification
process and empower farmers to trade directly with international partners is proposed for
further studies.

1
CHAPTER I
INTRODUCTION
Lao PDR is an agrarian society. The agricultural sector contributes to over 50% of
the country’s GDP and provides work for over 80% of its labor force. Rice is the most
important agricultural commodity of the country, produced largely using traditional
methods with limited inputs of fertilizers and other chemicals. The country has a wide
diversity of rice production systems and rice varieties, with over 3,000 different varieties
recorded. However, rice production is largely for national consumption and international
markets are poorly developed.
Rice also supplies almost 70% of daily caloric intake, making Lao PDR one of the
five countries most dependent on rice for food security. While food availability at the
national level has improved, household food security has not been achieved. Continued
increases in production are necessary to catch up with a population growth of 2.1 % of
annual growth rate, with the current population already estimated at 5.62 million
according to Bureau of National Statistics Centre of Laos (Population Census, 2005).
In Laos, access to rice is the one most important factor in determining people’s
welfare status. It is estimated that 30% of the population suffer from insufficient food for
more than six months per year (UN World Food Program, 2007). While accurate
statistics on food insufficiencies are hard to generate, it is estimated that volatile rice
price leads to even more hardships in rural and urban areas.

2
Rice farming in Lao PDR is considered essentially organic in nature due to
several reasons. Firstly, production environments are marginal with little or no response
to higher inputs. Secondly, farmers have limited access to markets, and lastly, chemical
inputs are too expensive or simply not available.
In 2004, Lao PDR launched PROFIL to promote organic farming and marketing
in the country. To further strengthen the program, the Promotion of Organic Rice Project
(ProRice) was established in 2006 to promote Participatory Market Chain Approach
(PMCA). The project was supported by Helvetas-Swiss Association for International
Cooperation and has initiated the promotion of organic rice to Swiss markets. The
purplish-blue rice has received positive response during fair-trade in Swiss at CLARO
markets. However, despite these developments, there is still little knowledge about
benefits of organic production or the fact that there exists a premium market for organic
products. Furthermore, there is presently no differentiation of price for organic products
in local markets. Good post harvest practices are essential to produce premium organic
rice products.
This study aims to understand the constraints and potentials in promoting
appropriate production and post harvest system practices with the aim of developing a
market based price incentive scheme for inclusion in extension campaign that is designed
to significantly contribute to the production of premium quality organic rice that meets
international standards. At present, post harvest remains the biggest challenge for

3
extension workers as drying and milling practices are far from ideal resulting to high
moisture content and impurities of organic rice.
Statement of the Problem
Currently, Lao PDR has an existing certification method for organic rice farmers.
There had been efforts in the past to explore foreign markets in Switzerland through Fair-
Trade. Despite the organic production methods, the farmers are unable to sell in organic
market of Switzerland because of the failure to meet the international quality standards
demanded by foreign markets. It is argued that that a major reason for this rests on
traditional post harvest system. In the past, the agricultural extension approach has always
focused on the production practices and has yet to include and promote postharvest
management. With focus primarily on production practices, agricultural extension cannot
help improve the welfare of farmers as increases in yield does not necessary translate to
increased income due to poor post harvest support and/or market support. With poor
postharvest system, farmer’s product quality fails may not meet market foreign standards.
Given this, organic rice farmers are deprived of the opportunity to participate in the
international organic market because of impurities that may be largely a result of a poor post
harvest system. Postharvest extension can link farmers to markets by enabling them to
produce better quality rice products. This study explores in detail the post harvest system by
describing the production and post harvest system processes and important actors and
measuring the parameters for quality organic rice production attributed to post harvest
namely, milling recovery, moisture content and head rice recovery.

4
Objectives of the Study
The general objective of this study is to understand organic farmer and processor
constraints and potentials in coming up with quality organic rice that meets international
standards. Specifically, the study will:
1. Describe the socio-economic characteristics of organic rice farmers;
2. Explain farmer practices of organic rice farmers;
3. Describe the processing and marketing aspect of the certified organic
processors;
4. Investigate paddy moisture content in the granaries of organic farmers;
5. Conduct grains quality milling test in laboratory with different types of paddy
drying practice;
6. Develop a market based price incentive scheme for inclusion in extension
campaigns to encourage better post harvest practices.
Significance of the Study
Organic rice addresses the general principles of food safety and sustainability and
serves as a potential poverty alleviation strategy if organic product is marketed
strategically. The lack of adherence to good postharvest practices remains the biggest
challenge in attaining desirable grain quality demanded of certified organic rice products.
Post harvest is a major component of producing quality rice. Likewise, poor post harvest
practices and facilities lead to poor grain quality and deprive farmers not only of good
quality rice but also of the chances to command better prices for their rice grain.

5
Providing data constraints and potentials on organic rice production and post harvest
practices of both farmers and millers through survey and actual measurement of
performance indicators may lead to better understanding among stakeholders regarding
the importance of adopting proper post harvest practices. This in turn may serve as an
incentive to adopt recommended post harvest practices which currently remains the major
bottleneck in the organic certification process. The proposed market based extension
campaign may further serve as a basis to enhance stakeholder understanding of the
importance of adhering to good post harvest practices.
Scope and Limitations of the Study
The study is limited to the survey and investigation of production and post harvest
practices of organic farmers and certified processors in ten villages of Santhong Organic
Area, Vientiane Capital. Moreover, quality indicators like paddy moisture content,
percent of milling recovery and percent of head rice recovery will be gathered only after
the wet season of 2010.
6
CHAPTER II
REVIEW OF RELATED LITERATURE
Extension
Extension refers to the process of bringing helpful information to people (Roling,
2006) and exchanging information in order to increase new opportunities for
improvement by providing them the right information at the right time. It involves a
series of activities that bring useful information to people and then assist them in
developing necessary knowledge, skills, and attitudes to utilize information or technology
effectively (Swanson, 1984). Tiago and Yen (2007) contend that extension plays an
important function in the transfer of scientific knowledge and technology and the
dissemination of information on production matters. The new paradigm in extension
moves beyond provision of information by directly providing educational opportunities
that will make the people help themselves. Through the years, extension has evolved
from its traditional focus on providing information into a capacity-building and people
empowerment tool.
According to the agricultural extension policy of Bangladesh (MAF, 1996),
agricultural extension is a key component strategy to help farmers make efficient,
productive and sustainable use of their land and other agricultural resources, through the
provision of information, advice, education and training.

7
Agricultural extension is therefore one of many services or systems that provide
farmers and communities educational opportunities and improved technical farming
methods that could help increase production of income and better quality of life. As such,
extension services are fundamental in helping human development in rural areas (FAO,
1979).
Extension System in Lao PDR
In Lao PDR, extension was implemented as a nationwide approach in order to
harmonize agricultural extension. In 2001, the National Agriculture and Forestry Extension
Service (NAFES) under the Department of Ministry of Agriculture and Forestry (MAF)
created a national extension system. This was a fundamental step in the development of a
national extension system that aims to assist farmers in adapting their production and
marketing strategies to rapid changes in economic, social and political conditions (LEAP,
2004). NAFES adopted a bottom up approach that capitalizes on the strength of village
production groups.
Two policy papers concerning National Growth and Poverty Eradication Strategy
(NGPES) provided the framework for a bottom-up approach to extension where village
initiatives were encouraged and supported (LEAP, 2004).
Within the National Agricultural and Forestry Extension Service (NAFES), the
Central Extension and Training Development Unit (CETDU) led the development and
implementation of the Lao extension approach. Two administrative bodies were
responsible in implementing this approach: the Village Extension System (VES) and the
government extension system which are jointly managed by villagers and village

8
authorities. Activities were facilitated by Village Extension Workers (VEWs) who were
appointed and compensated by the community and received technical support through the
Government Extension Service (GES). The Government Extension Service on the other
hand, consists of three agencies: the National Agricultural and Forestry Extension Service
(NAFES), the Provincial Agricultural and Forestry Extension Service (PAFES) and the
District Agricultural and Forestry Extension Service (DAFES). The VES and government
extension provide knowledge support to farmers as show in Figure 1 below.
Figure 1. The knowledge support system for organic rice production

9
Extension Support for Organic Rice
Similar to other developing countries, the development of Laos’s organic
agriculture was promoted actively by the private sector and rural development NGOs in
partnership with the Laos government. Incidentally, almost all NGOs in Laos are foreign
and these NGOs promoted the concept of sustainable agriculture and organic farming in
Laos during the late 1990s. Sustainable farming technologies and practices were
incorporated into various training activities of public agencies like the National
Agriculture and Forestry Extension Services (NAFES) reaching out to thousands of
farmers throughout the country. Since most of the NGO programs at that time did not
have market focus, the products from these sustainable farms were all sold as
conventional products and very few were sold as natural products or pesticide-free
products with premium prices (Green Net and Earth Net Foundation, 2008).
In the mid 2000s, market linkage became an important agenda among Lao
agriculture authorities and NGOs as many international development institutions and
donor agencies realized the potential opportunities of organic agriculture as a way to
reduce poverty. Takamatsu (2002) found that the rice market of Laos is a fragile market
because of the market disintegration between the Northern portions and other regions and
the weaker market integration between the Central and the Southern regions. Although
the Lao government introduced market mechanism in the agricultural sector, it has yet to
fully consider such market integration and the positive roles the government play in
supplementing fragile markets.

10
In 2004, HELVETAS and the Department of Agriculture launched a collaborative
project for the promotion of organic farming and marketing in Lao PDR. The project was
dubbed The Promotion of Organic Farming and Marketing in Lao PDR (PROFIL).
Along with the Laos Department of Agriculture, the Swiss Association for International
Cooperation actively took part in addressing the coordination of activities aimed at
supporting organic agriculture, creating enabling legal environment, supporting producers
through appropriate extension activities and initiating marketing support for in-country
and export markets (Panyakul, 2009). Meanwhile, PRORICE, a “sister” project of
PROFIL, concentrated on the production and marketing of organic rice. Under the
project, over five hundred farmers actively participated in the production of organic rice
in Sangthong District, Vientiane Capital.
Lao PDR promotes a policy of clean agriculture focusing on stable production,
chemical- and pesticide-free agriculture and low cost of production. The country’s
organic standard is formulated by Department of Agriculture (DoA) with strong mandate
from MAF. Clean agriculture in Laos is classified into four types of practices based on
safety for human and animal consumption: organic agriculture (OA), conventional
agriculture (CA), pesticide free agriculture (PFA), good agriculture practice (GAP) and
integrated pest management (IPM).
OA is promoted in mountainous area while PFA is promoted in slopping areas. In
the lowland, farmer’s practices all four types. Figure 2 shows the practice of the four
types of clean agriculture in relation to agro-ecosystem technology.

11
Figure 2. Types of clean agriculture and agro-ecosystem technology application in Lao PDR.
In CA, farmers may use synthetic inputs such as artificial fertilizers and chemical
pesticides subject to regulation of Lao agricultural law. Such good agriculture practices
(GAP) are based on principles that promote environmental, economic, and social
sustainability for on farm production and post production processes (FAO, 2003). GAP is
used in a variety of ways related to soil, water, production systems, crop production and
animal production. IPM is a methodology that has evolved to address issues under crop
production. It encourages the combination of different management strategies to grow
healthy crops and minimize use of pesticides at a level that minimizes risks to human

12
health and intervention (FAO, 2009). It follows four steps which include the setting up of
action threshold of pest production, monitoring and identification of pests, adoption of a
variety of prevention methods to control pests. The National Integrated Pest Management
under the Department of Agriculture conducts Farmer Field Schools (FFS) to promote the
use of IPM. Meanwhile, PFA means the non-use of chemical pesticides and herbicides,
though chemical fertilizer is allowed. Using pesticides in Lao PDR has been fairly low
compared to neighboring countries in South East Asia due to lack of resources among
farmers. The practices promoted during the Green Revolution had not really been
adopted in Laos (Bjorkqvist, 2008).
Organic Rice Production
Sustainable agriculture encourages the production of abundant food without
depleting the natural resources and minimizing pollution releases to environment (Earles,
2005). Sustainable agriculture can be broken into three components: economic,
environmental, and social (Sullivan, 2003). Both organic and sustainable agriculture
reflect production systems that rely on biological processes and natural cycles to
build diversity and resilience within the farming operation. While there are important
philosophical and practical similarities between sustainable and organic agriculture, there
are also fundamental differences.
Organic farming avoids the use of synthetic chemical pesticides, herbicides, and
fertilizers (Obach, 2006). Organic agriculture is a production system that sustains the
health of soils, ecosystems and people. It relies on ecological processes, biodiversity and

13
cycles adapted to local conditions and denounces the use of chemical inputs. Organic
agriculture merges tradition, innovation and science to benefit the shared environment
and promote fair relationships and a good quality of life for all involved (IFOAM, 2008).
Organic rice farming also uses natural fertilizers and natural pest control techniques
produced from natural sources and locally available resources. To ensure the quality and
integrity of the product, organic rice farming uses detailed production records to ensure
traceability through the entire product and marketing process. Due to its overwhelming
popularity and use in many areas of agriculture, the use of the term “organic” is now
regulated by the USDA approval for which requires compliance with recognized
standards (USDA-ARS, 2008).
Organic Rice Production in Lao PDR
The demand for rice is expected to grow substantially with the current rate of
Laos population growth at 2.1% per year. At this rate of growth, the population is
expected to increase from 5.62 million in 2005 to 8.8 million in 2020. The total demand
for rice is therefore expected to increase to 3.6 million tons by 2020. This is equivalent to
at least a million tons of additional production relative to the output achieved in 2004.
Assuming that the total rice area will not increase, rice productivity would have to
increase to 4.7 tons per hectare nationally by 2020 to maintain self-sufficiency in Lao
PDR. Thus, it is important to keep up the momentum of rice productivity growth at least
during the next 10 to 15 years (Samjhana, 2006).

14
UNEP-UNCTAP (2008) reports that most of the policy measures used to support
agriculture discourage sustainable and organic farming. In the short term, this means that
farmers switching from high-input to resource-conserving technologies cannot do so
without incurring some transition costs. To some extent, one can claim that the premium-
priced organic market lets the consumers carry the burden of failures in policy. Whilst the
organic market has been instrumental for driving the development, it is questionable in
the longer term if consumers are willing to, or if they should, compensate for policy
failures by paying higher prices for organic products.
Organic rice production can benefit small-holder farmers by decreasing the farm
production cost while at the same time increasing product’s price. Moreover, fertility of
their land is improved and health condition and safety of both farmers and consumers are
protected. In terms of production volume and quality, Laos has no chance of competing
with leading rice exporters in ASEAN like Cambodia, Thailand, and Vietnam in terms of
quantity but it can do so in term of quality. The LAO- PDR government has aggressively
promoted organic rice production with the aim of exporting organic rice to Western
markets. The short and long term vision of Department of Agriculture is directed at food
security and safety and strict adherence to international standards has been promoted and
monitored by international NGOs and the Lao extension system.
In addition to limiting the use of chemicals in agriculture, the MAF also launched
the IPM program, set up bio-fertilizer factories, promoted bio-pesticides and declared
pesticide free zones in various parts of the country to support organic farming. But it also
established Organic Agriculture Standards to ensure ensure adherence of production

15
systems to international organic standards. In Sangthong district, 574 rice growers in 10
villages have already adopted organic rice techniques but quality of produce is still
subject to inspection and accreditation.
Certification Process in Lao PDR
According to IFOAM-Training Manual on Setting Up and Harmonising Internal
Control Systems, a rice farm can be certified organic if it does not use any inorganic
chemicals that might produce residue in a human body such insecticide, herbicide, fungicide,
chemical fertilizers. In Laos, certification as organic farm requires non-use of inorganic
pesticides and fertilizers for three years.
Accreditation procedures include submission of yearly documentation and
information on materials used, production methods used to mitigate risk of contamination
from neighboring rice farms which uses chemical agricultural inputs, and yield estimates
based on absolute hectare and local climate each season. Because of the monitoring
system, numerous rice growers have failed to get organic certification. Based on 2009
records, only 390 rice growers were certified as organic farmers after three years of
practice. In addition to strict standards and time frame, a village internal control system
inspects individual farms at least three times a year and farm inspection report are
submitted to the office of Clean Agriculture and Development Center. A final inspection
is made by the Laos Certification Body before crop certification.
Organic certification focuses on the production and processing system as opposed
to the certification of a product. It is a system of regulation designed to ensure that

16
producers and processors comply with Laos organic standard. It is more complex than
product certification because it cannot be based on measurable product characteristics.
For a product to be certified organic, all operators in the product chain from farmers,
millers, processors, manufacturers, exporters, importers, wholesalers and retailers must
be certified as acting in conformity with the standards and regulations of the certification
program concerned.
Where large numbers of smallholders are to be inspected by a foreign certification
body, the involved costs can be very high. Many organic smallholder projects in the
Southern Laos are implementing a model referred to as group certification. Defined
groups of farmers with similar production are organized by an NGO or corporation and
are monitored by an Internal Control System (ICS).
An Internal Control System (ICS) is part of a documented quality assurance
system that allows the external certification body to delegate the periodical inspection of
individual group members to an identified body or unit within the certified producers.
In Lao PDR, the external inspection is carried out by the Department of
Agriculture. Staff from the Department of Agriculture visits the farmer group and all
individual farmers at least once a year. They check farm records and compliance of each
farmer with the Lao Organic Standards. If found adhering to requirement and standard,
the Lao Organic label can be used by the farmer.
In collaboration with the DOA, PROFIL had developed a national organic
standard since 2004 based on IFOAM Basic Standards. The standards, covering organic
crops production was approved by the MAF in December 2005. PROFIL also assists the

17
DOA to develop a national organic seal, to be used for organic products certified against
DOA’s organic standards. The Laos Organic label is the trademark for certified organic
products from the Lao PDR. The logo is used on organic products certified by the Lao
Organic Standards, which are based on IFOAM Norms.
It was only early 2008 that the Laos Certification Body (LCB) was established by
the DOA, under the Clean Agriculture and Development Center. Currently, the organic
seal is used with some products like vegetables, rice, coffee, and green tea. Besides
putting efforts to operationalize the LCB, the DOA is considering to set up a regulatory
framework for organic and safe food production, under the broad term of “clean
agriculture”. The framework has included the approval of certification bodies with
possibly requirement for accreditation.
For export of Lao products to European countries, there are a handful of foreign
organic certification bodies that offer additional services in Laos, all of which are based
in Thailand. These include Organic Agriculture Certification Thailand – ACT (Thailand),
Bio Control System-BCS (Germany), ICEA (Italy) and Bioagricert (Italy).
This means that the third party certification bodies only have to inspect the
functioning of the system, and perform a few spot-check and re-inspections of individual
smallholders. Both the farmers and the Internal Inspector have responsibilities for
managing the data. The extent to which farmers can manage their data will depend on
their ability to read and write and their availability of a suitable place to store data.
In early 2008, the Lao Certification Body entered into an Asian region
certification collaborative platform together with other eight (8) Asian organic

18
certification bodies, known as Certification Alliance. This regional collaborative platform
allows members to offer multiple organic certifications with integrated inspection as well
as market support and institutional development.
One of the mandates of the Clean Agriculture Development Centre, set up by the
Department of Agriculture (under MAF) is to develop organic agriculture. It has among
other measures, created a support unit to assist in the development of Internal Control
Systems-Support Unit (ICS-SU) used for organic group certification schemes. This unit
developed into a Lao Certification Body (LCB) which can certify against organic
standards and other related standards concerning food safety such as GlobalGAP. The
LCB is a member of the Certification Alliance (CertAll), a regional partnership for organic
certification launched during Biofach 2008, the biggest organic trade fair, based in
Germany.
PROFIL is currently working with the Department of Agriculture to implement a
new Lao certification body. This new organization will be able to certify Lao Organic
Standards, and will eventually provide inspection services for many international
certifications, including National Organic Program in United State of America (NOP),
Japanese Agricultural Standard (JAS), and European Union (EU).
Currently, only few organic agricultural development projects are ongoing in
Laos. Presently, Oxfam Australia, the Jhai Foundation, GTZ/DED and Helvetas are the
main development agencies supporting organic projects on production and trade. A
number of private sector initiatives are investing in the development of the organic sector
such as the Vangvieng Organic Farm , Sinouk-Coffee, Jhai Coffee Cooperation, Lao

19
Farmer Products, Food State Enterprise, SomHong rice mill, Somphone rice mill to
name a few. The products so far certified are coffee, tea, rice, vegetable and fruits. There
are also other potential products such as peanuts, sesame, cotton and products from wild
collection known as NTFP’s (Alleje and Sacklokham, 2009).
As of 2009, there are 390 rice growers and 270 hectares of rice farm area certified
as organic (Table 1). Moreover there are 24 farmers growing purplish-blue rice that has
been certified by ACT for EU standard and 250 farmers are also certified by LCB.
Organic certification is a process of verifying compliance with National Organic
Standard and accredited certifying institute to ensure that organic products are produced
according to specific local or regional organic standards (Tourt, 2000). Certification is a
comprehensive process of recording farm operation to give consumers confidence that
they are buying genuine organic products (PROFIL, 2009). In many countries,
certification is required for all products that will be imported or sold as "organic".
Table 1. Current certified organic farmers in 2009
LOCATION NO. OF FAMILIES ORGANIC
CERTIFIED
ORGANIC Number % Number % Number %
Haitai village 91 15.23 76 14.19 66 16.92
NaSaoNang village 57 9.89 57 10.63 56 14.37
Pakthep village 51 8.86 51 9.51 24 6.16
Natarn village 46 7.99 46 8.58 36 9.23
Natiem village 62 10.77 62 11.57 48 12.31
Nalard village 49 8.52 47 8.77 35 8.97
Namieng village 58 10.07 57 10.63 38 9.74
TaoHai village 84 14.56 64 11.94 32 8.2
NaHoiPang village 32 5.59 30 5.6 29 7.43
HaiNeua village 49 8.52 46 8.58 26 6.67
Total 579 100 536 100 390 100

20
The organic certification process is administered by a neutral third party called a
certifier that gives written assurance with a clearly identified production and processing
system (OCCP, 2009). The certifier visits the farm or facility applying for certification to
inspect their operations. The inspection process makes sure that the farm or facility is
operating according to the organic standards, and that their planning, documentation and
record keeping are adequate. If the inspector finds any deviation from recommended
practices, this must be fixed before certification can take place.
The inspection constituted a significantly higher cost, project subsidies for
inspection cost for farmers and millers during project life cycle and market are not
established yet.
Post Harvest System and Farmer’s
Practices in Lao PDR
The post-harvest system consists of a set of operations which cover the period from
harvest through consumption. An efficient post-harvest system aims to minimize losses and
maintain the quality of the crop until it reaches the final consumer. When food losses are
minimized during post harvest, food security and income increase a vital importance for
small and medium farmers, particularly in developing countries. From a socio-economic
point of view, the implementation of an efficient post-harvest system in any community must
provide equitable benefits to all those involved in the system (Grolleaud, 2001).
The post-harvest system for rice deserves special attention since it has been
estimated that rice post-harvest losses may be as high as 16%. A study of post –harvest

21
practices in China revealed that total post-harvest losses ranged from 8% to 26%, with
storage and drying identified as the most critical operations (Ren-Yong et al., 1990). In
addition, de Padua (1999) stated that poor milling practice is a major post-harvest
problem.
Other post harvest factors that contribute to poor rice quality include the mixing
of varieties, heat discoloration, contamination, insect damage in storage, fissuring in
drying, and breakage in milling which are controllable.
Harvesting
Harvesting is an important step affecting the quality of rice. Rice harvesting includes
several steps namely reaping, gathering, threshing, separating and cleaning. These steps are
normally performed in the rice fields. In other areas, rice is transferred, threshed and
separated in the back yard after being reaped (Quoc Viet, 2006).
One important post-harvest consideration is moisture content (MC). Smith and
Dilday (2003 as cited by Tolbert, 2007) explained that harvest moisture content is very
important in rice. Immature rice kernels when harvested (high moisture content) will reduce
head rice (whole kernel) yield, containing lighter, chalky kernels. Harvesting at low moisture
levels can also cause shattering, result to more broken kernels and reduce milling quality. It
is important therefore that rice should be harvested at moisture content of 18-21%, with the
crop harvest being complete by the time rice reaches 16% moisture.
Modern practices in harvesting are already posing serious problems in quality of
organic rice produce due to increased possibility of contamination. Traditionally, rice is

22
harvested manually by hand using simple tools like sickles. Threshing is also performed
manually and pedal-operated threshers have been accepted in the terraced field especially
in the northern provinces of Laos where exchange of labor is commonly practiced (Latine,
1997). However, harvest or threshing machines are recently replacing traditional methods.
Such mechanized methods of harvest or threshing however increases risk of
contamination of organic grains.
Post-harvest management is no different in terms of risks. It used to be commonly
done by drying rice in the field, piling into bundles and prior to threshing, transporting
and storage (Khemmarath, 2008). In the harvest stage farmers determine maturity by
observing the color of panicles, leaves and stems of rice plants. At harvest, the panicle is
a good indicator to decide whether it’s the right time for harvest. The panicle should be
80% matured and colored yellow. The ideal time for harvest is around 30 – 35 days after
booting. If there is still water in the field it should be drained for seven days.
CARD, (2010) described that a delay of harvesting about 4 - 6 days reduced the
head rice yield by 11.3 % an average and up to 50 %. The large varietal difference in
percentage of cracked grain 0.9 to 60.5% on 6 days after maturity date indicated that the
level of rice cracking caused by late harvesting time can be minimized by the selection of
suitable varieties.
Field Drying
The purpose of drying is to reduce the amount of water contained in the grains to
achieve an acceptable level of marketing, storage and processing. It is necessary to

23
decrease the moisture content in order to minimize the development of molds and insect
infestation. A delay in drying leads to grain discoloration, chalky kernels and decreased
yields during grain handling and processing (Dirk and Bakker-Arkema, 2002).
In field drying, the cut panicles are left to dry in the rice field for 2 to 3 days.
Usually field drying is done to wait for the thresher if there is labor shortage and/or to
loosen the grains in the panicle before manual threshing, which is a common practice
among Lao farmers (Khemmarath, 2008).
Kunze (2008) noted that rice is hygroscopic. The dried grain reabsorbs moisture
from any source to which it is exposed. Moisture adsorbed through the grain surface
causes the starch cells to expand and produce compressive stresses. When rice grains in
the field reach harvest moisture (22%), the grain may contain grains with moisture
contents (MC) between 15 and 45%. Many individual grains may dry below 15% MC
during the day. Such grains can fissure on the stalk when they reabsorb moisture at night.
Thompson and Mutters (2006) found that average rice moisture alone is not an
adequate predictor of head rice yield. The historic rice moisture varies with
meteorological conditions. Under typical calm conditions in California, the relative
humidity during the daytime is low and humidity increases at night, the rice becomes
directly exposing to dew. All kernels that dried below 15% moisture during the day
would rehydrate at night and fissure, resulting in lost head rice yield.

24
Hauling
For certification, organic products should be clearly separated from other non-
organic products. Transport can be done with conventional products but with clear
separation through adequate packaging and labeling. Bags for packaging should be
preferably new to avoid contamination with conventional rice products from unknown
sources.
Threshing
Technically, threshing is the process of striking paddy plants in order to separate
the grains from the rice straw. After harvest, paddy panicles should be threshed as soon
as possible. It can be practiced manually or mechanically depending on conditions and
technology available. Manual methods of threshing include treading by feet, flail method,
and beating stalks against tubs, boards or racks.
Mechanical threshing removes rice grains from the rice plant, speeds up threshing
by setting the correct machine speed in thresher around 600rpm (Gummert, 2010).
Mechanical thresher reduces losses, and labor requirements. Most of farmers how prefer
mechanical threshing.
Threshing can be done manually or by machinery. A threshing machine is also
used among farmers, though a cleaning process is recommended before processing
organic rice grains to avoid contamination.

25
During the manual threshing stage of the rice harvest, bundles of grain are taken
from each stuck and threshed onto a bamboo mat. Wooden sticks are used to beat the
stalks to ensure to minimization of waste. The grains are taken to the village for sun
drying when paddy still holds 14% moisture content or higher.
Sun-drying
Henderson and Perry (1976 as cited by Roopa, 2006) explained that drying can be
defined as the removal of moisture molecule to known moisture content in equilibrium
with normal atmospheric air or to such a moisture content to protect the quality from
moulds, enzymic action and insects.
Thompson (1998) described that reduction in MC of rice is affected by moisture
and the humidity of the air around rice grains. When the humidity is low, rice will loose
moisture content is equal until it comes to constant moisture content at 14%MC. But
when humidity is high, rice moisture will increase. Another factor that affects rice quality
is thickness of rice cultivar. Thick kernels are more prone to breakage (Tolbert, 2007).
Flordeliz and Pamplona (2009) reported that sun drying is a traditional and very
old drying technique. Though highly laborious, it is favored by many farmers because it
is the least costly and at times requires no cash outlay when done only by family
members.
Drying is necessary to reduce the moisture content of the grain. Drying will be
done on a mat under sun exposure or by using a drying machine. Rice grain should have

26
less than 14% moisture before storage. Dried grains can be stored in jute or polyethylene
bags.
In Lao PDR, sun drying is predominant among. Given the solar intensity, sun
drying results higher quality when we stir grains regularly (Pyseth, 2006). Natural or sun
drying is solely dependent on weather condition, so the timeliness of work is hard to be
achieved. The drying becomes more problematic for farmers during harvesting season
due to continuous rainfall.
Dillahunty et. al. (2000) and Hu et. al. (2003) described that especially during the
rainy season, moisture content of rice at harvest can be as high as 22-26%. To avoid
deterioration after harvest, paddy rice should be dried about 13-14% level of moisture
content to reduce respiration, slow down mould growth, and prevent production of
mycotoxins for safe storage.
Mechanical Drying
The advantage of mechanical drying over sun drying is its ability to provide
uniform and controlled temperature for the grains. Grain is very temperature sensitive.
In order to dry without damaging the grains, the desired temperature should be 43.3 °C.
This requirement however cannot be attained through sun drying.
Artificial drying is necessary to prevent grain deterioration, which will greatly
affect the income of farmers. Mechanical drying method using dryers is a reasonable
alternative method of sun drying (Akteruzzaman and Parvin, 2002).

27
The most common fixed bed dryers are flat bed dryers which have a very simple
design. Grain is laid out on a perforated screen, and dried by forcing air from below. The
air fan that provides the drying air is usually a simple axial flow fan that is powered by a
diesel engine or by an electric motor. A kerosene burner or a biomass stove provides
drying heat. The capacity of the dryer varies from one to ten tons. Generally the drying
floor is flat although dryers with reclining sections (to facilitate unloading) or vibrating
sections (to facilitate stirring) exist as well. The height of the layer is usually 40 cm. The
most common smaller dryers have a capacity of one to three tons per day with drying
times of six to twelve hours. For drying of paddy in tropical areas, an air temperature of
40-45ºC is normally used with a heater capable of raising the air temperature 10-15º C
above ambient. An air velocity 0.15-0.25m/s is required and typical fan power
requirements are 1.5-2.5 kW /ton of paddy. The efficiency of these dryers as well as the
head rice recovery is improved by stirring the grain during drying (IRRI, 2009).
In Vietnam, Soc-Trang Province first installing flat bed dryer during 1982 with
assistance of Nong-Lam University (NLU). Over the year, other provinces adopted this
technology and machines were modified by farmers with using cheap local materials
(CARD, 2008).
Shade Drying
Shade drying is best done by placing unthreshed rice with the panicles inward,
often on special built rack, so that the straw shades and protects the rice grains. The
arrangement must allow sufficient air around the rice but air must be dry enough to be

28
effective. The labor requirement is less but drying time is longer than sun drying
(Saunders et al, 1980). The shade drying method is usually used in research trials because
it is the gentlest drying method producing the best quality close to the potential of the raw
materials as the paddy. But it is not compatible for farmer’s practice or even industries
because it takes for longer time to dry the rice.
Storage
Paddy rice moisture level in the field reaches at 20 – 22%. Attempting to store it
in this condition will cause grain quality deterioration. To maintain seed quality during
storage, paddy rice should therefore be dried to a moisture content of wet basis at 13 –
14% (Somado and Berhe, 2008).
However, deterioration may be prevented if moisture is kept at 65% equilibrium
relative humidity and rice seeds are stored at 5.56°C of the average monthly air temperature
and below 33.36°C. The aeration system has to be designed and operated in order to maintain
uniform rice moisture and temperature in storing (Navarro and Noyes, 2001).
For organic rice, no chemical must be used during storage. Processed rice
(wholegrain, white or parboiled) requires different storage conditions. Parboiled rice can
be stored up to one year at a temperature below 22°C and under airtight storage
conditions. For wholegrain, the maximum storage is two years under airtight storage
conditions and temperatures between 10 and 35°C. White rice can be stored up to three
years.

29
Rice Milling
Milling recovery refers to total milled rice obtained out of paddy expressed as
weight percentage of milled rice (including broken kernel) obtained from a sample of
paddy. The maximum milling recovery is 69-70% depending on rice variety, but because
of grain imperfections and the presence of unfilled grains, commercial millers are happy
when they achieve 65% milling recovery. Some village type rice mills have 55% or lower
milling recovery (IRRI, 2009).
On the other hand, head rice recovery is the weight percentage of head rice
(excluding broken kernel) obtained from a sample of paddy. Under controlled conditions
head rice recovery can be as high as 84% of the total milled rice or 58% of the paddy
weight. Commercial rice mills turn out 55% head rice on average, whereas head rice
recovery of village type rice mills is in the order of 30% (IRRI, 2009).
Broken kernel or broken depends on the rice mill. Breakage may only be one
fraction or it may contain several fractions of different size like the large broken kernel
(50-75% of the whole kernel size); a medium broken kernel (25-50% of the whole kernel
size), the small broken kernel (less than 25% of the kernel size) (IRRI, 2009).
Use of rice milling post-harvest facilities must be kept to ensure maximum
product quality like purity, appearance, hygiene, freshness, and nutrition by following
recommended techniques using materials that are consistent with Laos Organic Standards.
Because millers use the same machine for organic and non-organic rice, they are
supposed to clean the machine by using three sacks of organic rice before fully

30
milling organic rice. Thus three sacks will not be counted organic because of possible
contamination from non-organic rice. Only the 4th
onwards is counted organic.
Laine (1997) reported that the rice mills used in rice-producing countries vary
from the manually operated hammer beam pounder or mortar and pestle to the very
sophisticated rice mill used in big commercial or government installations. In remote
areas where power is not available, the beam hammer pounder or the mortar and pestle
are used by farmers usually operated by the female members of the family. Engine
powered single -pass rice mill is normally favored over manually operated mills due to
the efficiency of the farmer.
FAO (2001 as cited by Shinya Takamatsu, 2002) reported that as the main actors
of inter-provincial transportation, rice millers play an important role in rice marketing
including purchasing from farmers.
In Laos, there are more than 18,000 rice mills, 497 of which are in Vientiane
municipality (Ministry of Commerce Lao PDR, 2003). In addition, four organic rice
millers, namely Suthat, Somhong, Dao Pa Kai, and Somphone rice millers have been
identified as willing investors for export markets. (Gummert and Balingbing, 2007).
Organic Rice Post Harvest Monitoring in Lao PDR
Collective action in organic rice production is necessary in implementing rules
and regulations, in maintaining standards of resources management process and by
product. More specifically, collective action in organic production groups must focus not

31
just on the production stages but also in product marketing including collection and
transportation (Pham Thi Hanh Tho, 2009).
In Laos, village collectors (marketers) are committee members of organic rice
group who are mandated to assist traceability system, they act as traders or middle men
between farmers and miller. All certified organic paddies transit to organic rice millers
thru village collectors. If organic paddies do not pass though this system, it is
unacceptable and is not accredited as organic products. Under the monitoring standard
used by village collectors, the optimum grain moisture content depends on desired
storage duration, when paddy grain reaches more than 18% MC, grain will deteriorate
rapidly. Therefore, 14% to 9% MC is ideal for long term storage. MC rate higher than
14% will require re-drying of paddy at rice mill.
Marketing of Organic Rice
`The market strategic option of the organic products determines the selection of
the certification scheme to be followed. The market choice could be domestic or export
market. In the domestic market, there are various channels for organic produce, including
direct membership schemes, weekly markets and fairs, occasional markets, retail health
shops, specialised health supermarkets, modern trade supermarkets and even organic
restaurants. Major export markets are Europe the United States, Japan and other high-
income countries, particularly in Asia (Santacoloma, 2007). Pricing organic rice is a
critical issue for organic farmers since market is not established yet.

32
The initial domestic organic markets developed are in specialized health food
shops, supermarkets, and minimarts and in other non-mainstream outlets. The biggest
market however, are foreign markets in the wealthiest nations namely the United States,
followed by Germany, the United Kingdom, France, Japan and Italy where consumers
prioritize food safety. Because of the stringent organic standards, organic producers often
have fewer problems adapting themselves to other demanding standards such as GAP,
oragic, etc (UNEP-UNCTAP, 2008).
Njoman et. al. (2006) states that one of the most important factors is the limitation
of the access to international markets as Lao rice is largely glutinous while export
preference is mainly for non-glutinous rice. The glutinous rice accounts for 80%–90% of
the rice consumed in the Lao PDR. Trade in glutinous rice is limited mainly to the areas
bordering the Kingdom of Thailand because glutinous rice is also consumed by some
groups of Thai people. Consequently, the Lao glutinous rice has to inextricably compete
with Thai glutinous rice in these markets.
In the past several years, an emerging and expanding awareness for healthy food
was observed within Lao-PDR. This was indicated by the proliferation of herbal and
natural medicine in the market. This development indicates a potential expanding market
for organic products.
In relation, it must be noted the market for organic rice is comprised mostly by
upper-to top income group consumers. However, lately, more and more middle income
groups are patronizing organic products due primarily to food safety concerns and for
therapeutic purposes (PhilDHRRA, 2004).

33
Given the price sensitivity of a wide section of our consumers, the nature of niche
market (with premium price) becomes major consideration because of affordability.
While there is an increasing demand for organic products, downward trend in organic
premiums must be expected in the future as more farmers engage in organic growing.
There is definitely some limit to the ability of niche market to absorb all the available
supply. This problem will become more apparent with the entry of competition from
imported products. UNEP-UNCTAP (2008) reported that the organic producers have to
meet the same competitive parameters as their conventional counterparts as far as prices,
logistics and packaging standards.
Table 2 shows the price range of milled rice in selected Asian countries.
In Cambodia and Vietnam, paddy with high moisture content also fetches a low
price in the market because the traders would still need to dry the paddy before it can be
milled at high quality output and stored longer without further deterioration. Properly
dried paddy especially with use of mechanical dryers would have a premium price in
some areas in Vietnam as milled rice output from mechanically-dried paddy would have
high head rice yield compared to sun dried paddy.
With regards to quality and market price, IRRC (2007) stated that prices of
organic rice are affected by the high moisture content (MC) of paddies (above 14%MC).
Rice with higher MC is bought at lower price by traders (Table 2). Traders would
normally measure MC using commercial/digital moisture tester. A price is agreed upon
by traders and farmers depending on the prevailing price. In other areas, some traders
take advantage of smallholders farmers by dictating the price of paddy especially in areas

34
Table 2. Price range for paddy and milled rice in selected ASEAN countries.
PRODUCTS QUALITY PRICE (US$)
Cambodia Philippines Vietnam
Paddy Wet (MC>14%) 0.18 0.28 0.22
Dry (14% MC) 0.20 0.36 0.25
Milled rice 25% broken/poor quality 0.30 0.55 0.40
5% broken/good quality 0.50 1.05 0.46
where postharvest facilities are lacking and market information on paddy prices are not
available to the farmers. Farmers who are indebted to the traders are oftentimes not able
to negotiate process properly.
Conceptual Framework
The study investigated the post harvest value chain of organic rice in Lao-PDR in
order to identify measures to facilitate the certification of Lao Organic Rice. The
diagram below shows the framework used in the investigation (Figure 3).

35
Figure 3. Diagrammatic study with the market flow of organic rice.

36
CHAPTER III
METHODOLOGY
The study investigated the socio-economic profile of organic farmers, their
farming practices and the correlation of farmer’ practices in different post harvest
management and percentage of milling recovery, moisture content and head rice recovery.
It also sought to investigate the constraints and potentials of organic rice processors as
critical input in the development of a price incentive scheme for an extension campaign
that seeks to maximize benefits for organic rice producers.
Location of the Study
The study was conducted in Sangthong district, Vientiane Capital (Figure 4).
Sangthong is one of the 47 poorest districts in Laos and is situated North-west of
Vientiane Capital, around 55 kms. from downtown Vientiane. The study covered ten
villages namely; Hai Tai, NasaoNang, Pakthep, Natarn, Nalard, Natiem, Namieng,
TaoHai, Nahoipang, and Hai Nua. Figure 4 shows the geographical locations of these
villages.
Surveys were conducted using three sets of questionnaires. One set of
questionnaire was distributed for organic certified farmers, another for village marketers,
and a different set for two millers and processors. Each questionnaire was pre-tested in a
separate village to ensure validity of the instrument. Representatives of all stakeholders in

37
Figure 4. Geographic map of study area

38
the rice supply chain were interviewed and involved in discussions. Field samples were
taken to measure quality of rice.
Sampling Design
The total number of samples was determined using Slovin’s formula (as cited in
Chua, 1984):
N
n =
1+Ne2
N = Population size, and
e = Desired margin of error
n= sample size
Based on the formula where the total number of population was 390, and 5%
margin error, a total of one hundred ninety seven (197) certified organic farmers were
selected as respondents using random sampling.
A subset of the population was again sampled for rice quality investigation. To
get the sample, the equation below was used.
2
2 2
2
2 2
1
1.96 0.5 0.5 197
197 1 0.1 1.96 0.5 0.5
189.1988 189.1988
1.89 0.49 2.38
79.45
80
Z pqNn
N e Z pq

39
P=sample proportion
N=size of population
n=size of sample
e =acceptable error
Z=standard variation
q = 1-p
Based on the equation, eighty (80) farmer granaries were investigated on the moisture
contents (MC) using moisture tester (kett-Riceter m401). MCf moisture content was
computed using the formula:
mf = mi
MCMC
f
i
100
100
Where mi : initial weight,
MCf : Final moisture content,
MCi : Initial moisture content
Data Collection Procedures
In addition to primary data collection, the following data collection procedures
were conducted:
1) Secondary data review of existing laws, decrees, statistics, census data from
government agencies and research institutions;
2) Survey of two food manufacturers namely Lao Farmer Product and State Food Stuff
Enterprise and two rice millers of SomePhone and SomeHong;

40
3) Focus group discussions (FGD) with core groups of rice growers, village marketers,
millers, rice processors, export companies, and consumers to deepen analysis of the
post-production value chain of organic rice; and
4) An experiment using factorial in completely randomized design (CRD) with three
treatments (mechanical drying, shade drying, and sun drying methods), and three
organic rice varieties (glutinous, non-glutinous and purplish-blue rice).
Milling quality test on rice samples from different three farmers was also
conducted. The samples were collected from the same batch subjected to flat bed drying,
sun drying and shade drying methods. Grain quality was determined using percent of
milling recovery and percentage of head rice recovery. For sun drying and shade drying
methods, 1 kg of samples were taken. For flat bed drying, three batches of one kg
samples per layer were taken. Each layer was divided into nine divisions and a total of 27
kg were collected. The process was done three times for each of the three organic rice
varieties (Figure 5).

41
Figure 5. Diagram shows how samples were collected in flat bed dryer.
Data Analysis
The researcher used Statistical Packages for Social Science (SPSSv.16) and
Statistical Analysis Software (SAS 9.1) as statistical software to analyze the data.
1. Descriptive statistics such as means, ranges, percentages, and standard deviation
were used to determine the characteristics of the variables of the study such as socio-
economic factors, sources of fund for organic rice production, certification process, rice
transplanting, fertilizer application, types of organic fertilizer used, common pests in rice
production, rice storage ;
2. T-test was used to compare the differences between two variables such as manual
harvest, machinery operation and harvest practices; frequency of rice milling, milling

42
fe
recovery, mode of payment and types of rice mill; trading scheme and sold paddy;
training courses provided, training places and group of rice farmers; and farmer’s training
needed and group of farmers;
3. Chi-square test (2) was used to determine the relationship between varietal use,
growing preference and rice products; the relationship between method in use, ownership,
frequent use of machine and types of land preparation; and types of grain and
productivity disposal.
The formula used was as follows:
2 =
ع (Chernoff and Lehmann, 1954)
Where:
fo = obtained frequency
fe = expected frequency
ع
= sum of total of all values
For all these tests, significance level was set at 0.05
4. Regression analysis was used to predict the moisture content in the granaries of
organic farmers, with moisture content as the predicting variable (dependent), and
number of active labor, area of farm hectares (Ha) and number of days in the field-drying
practices as the independent variables.
(fo – fe)2

43
5. Analysis of Variance (ANOVA) was used to examine the effects of paddy rice
drying practices on the three different organic rice varieties namely glutinous, non-
glutinous and purplish-blue rice on milling recovery and head rice recovery.
6. Economic analysis was calculated to determine the effectiveness of pricing
scheme. Price incentive scheme was developed from the computation of GFMG2 and
SFSE by using the break-even equation as follows:
Break-even is achieved if TR is equal to TC, where millers earn exactly what he
has spent.
TR=TC
(Head rice sale + Half grain sale + Large broken + Small broken + Bran) = (Cost
of buying paddy rice from farmers + Transport cost + Milling cost)
Break-Even = (TR – TC)/ Purchased paddy quantity (Kg)
From this, price incentive was computed using 17% MC, the acceptable rate set
by millers in Santhong.
Using price from survey, export data from millers and official export documents
from LAO PDR, actual cost and returns were computed. Given the computed gains from
improved moisture content, projected cost and returns were likewise estimated.
44
CHAPTER IV
RESULTS AND DISCUSSION
This chapter presents the results of the study of organic rice post harvest system in
Sangthong district, Vientiane capital, Lao PDR. It is divided into five sections based on
study objectives. The first section discusses the socio-economic profile of organic
farmers while the second section discuses the rice farming practices. The third section
discusses the rice quality of sampled paddy rice based on drying techniques. The forth
section explores possible price incentive schemes for to improve and sustain quality of
organic rice while the last section proposes an extension campaign model.
Socio-Economic Profile of Respondents
Table 3 shows the demographic profile of the respondents.
Age of Respondents
Respondents had an age range of 24 to 75 years with a mean of 45 years. Focus
group discussion showed that most of the young farmers preferred non-farming jobs in
Vientiane town while some of them crossed the border illegally to Thailand to find other
sources of income. As a result, older farmers were left in the village assume farm work as
a major livelihood. This explains shortage of labourers in farm operations. In cases where

45
Table 3 Socio-economic characteristics of respondents
CHARACTERISTIC
ORGANIC RICE FARMERS (n = 197)
Number %
Age
30 & below 15 8
31 - 40 61 31
41 - 50 68 35
51 - 60 42 21
61 & over 11 6
Total 197 100
Mean 45
S.D 10.40
Range 24-75
Gender
Male 161 82
Female
36 18
Total 197 100
Educational attainment
No schooling 9 5
Elementary school 92 47
Lower secondary school 69 35
Upper secondary school 21 11
High school 2 1
College 4 2
Total 197 100
Average no. of years in school 6.70
S.D. 2.77
Range 0-15
Family members
2 – 5 110 56
6 – 9 84 43
10 & above 3 2
Total 197 100
Mean 5.35
S.D. 1.56
Range 2 – 4
Farm size (ha) Number Percent
Less than 1 49 25
1.00 - 2.99 128 65
3.00 - 4.99 16 8
5 and above 4 2
Total 197 100
Mean 1.64
S.D. 1.11
Range 0.32 - 8.00

46
household labor is lacking or unavailable, some resort to selling their lands or renting it
out.
Gender of Respondents
A significant majority of the respondents (82%) were male reflecting that farming
is the main preoccupation of males. It is important however to note that in Laos, the role
of women in agriculture and food security has gradually increased. For instance, the
management of village revolving fund and village marketing now fall within the
supervision of Lao Women Union at the district level.
Education of Respondents
A very small segment of the respondents attended and finished college (2%) and
high school (1%). Some of these respondents are school teachers who also grow organic
rice in Sangthong. However, 47% percent were able to finish only basic education. The
low educational attainment can partly be explained by the fact that secondary education is
available only in a few village clusters. Informal interviews among the respondents
reveal that there is now a higher dropout rate among males due to demands of farm labor
and financial difficulties. As a result, male community members who are of schooling
age either work in the farm or look for odd jobs in Vientiane or Thailand.
Incidentally, the low level education among farmers suggests weakness in the
adoption of effective organic rice farming and marketing since most farmers willing to
fully adopt organic farming are those with high degree of education. Even in non-formal

47
educational interventions like training, educational level of farmers affects the rate of
adoption (Yamota and Tan-Cruz, 2007). This level of education also affects bargaining
power of farmers since education enhances a farmer’s ability to know his marketing
alternatives. A better educated farmer is more likely to know what prices are likely to
prevail in equilibrium and become a better bargainer (Onphanhdala, 2009).
Household Size
Majority of the respondents (56%) lived with households of 2 – 5 members while
a very low proportion of the respondents have household sizes of 10 and above.
Farm Size
The average farm size is at 1.64 hectares with the smallest at 0.3 ha and the
largest at 8.0 hectares. Majority of the farmers have 1.0 – 2.99 hectares. According to
the Census of 2005, average land holding in Laos is at 2.11 hectares.
(http://www.cansea.org.la)
Family Income from Farm Activities
Table 4 shows the sources of income from agricultural activities of the
respondents.
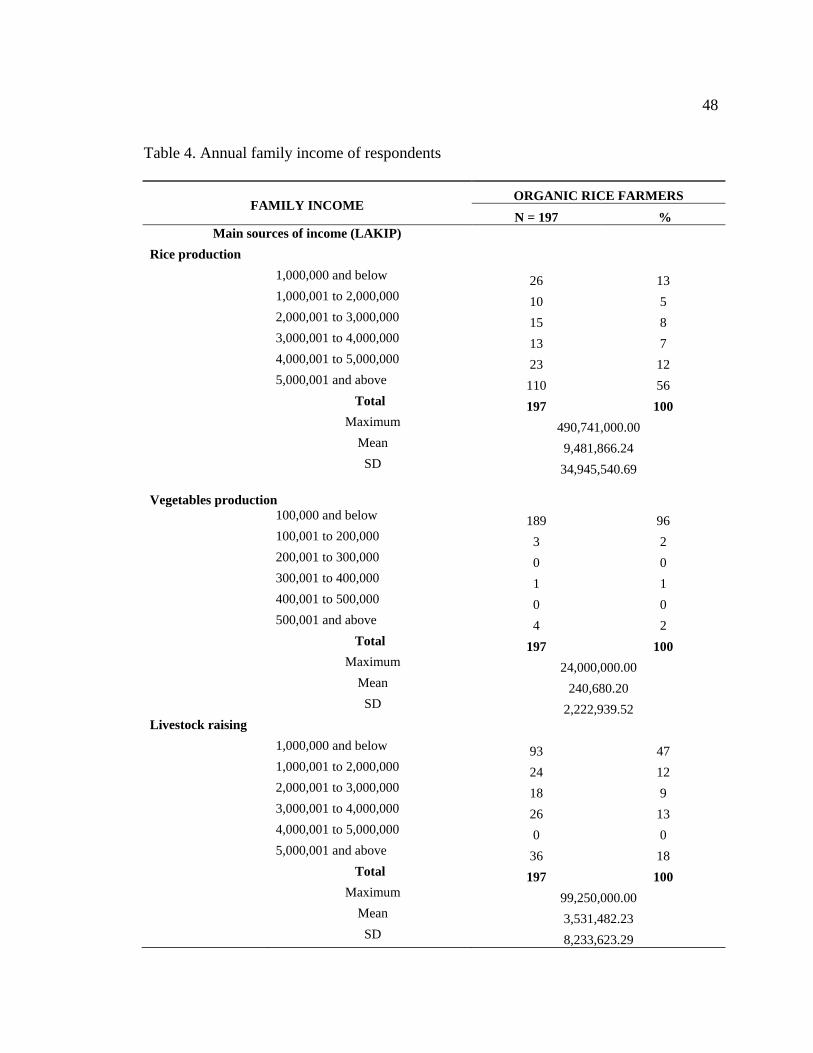
48
Table 4. Annual family income of respondents
FAMILY INCOME ORGANIC RICE FARMERS
N = 197 %
Main sources of income (LAKIP)
Rice production
1,000,000 and below 26 13
1,000,001 to 2,000,000 10 5
2,000,001 to 3,000,000 15 8
3,000,001 to 4,000,000 13 7
4,000,001 to 5,000,000 23 12
5,000,001 and above 110 56
Total 197 100
Maximum 490,741,000.00
Mean 9,481,866.24
SD 34,945,540.69
Vegetables production
100,000 and below 189 96
100,001 to 200,000 3 2
200,001 to 300,000 0 0
300,001 to 400,000 1 1
400,001 to 500,000 0 0
500,001 and above 4 2
Total 197 100
Maximum 24,000,000.00
Mean 240,680.20
SD 2,222,939.52
Livestock raising
1,000,000 and below 93 47
1,000,001 to 2,000,000 24 12
2,000,001 to 3,000,000 18 9
3,000,001 to 4,000,000 26 13
4,000,001 to 5,000,000 0 0
5,000,001 and above 36 18
Total 197 100
Maximum 99,250,000.00
Mean 3,531,482.23
SD 8,233,623.29

49
Table 4 continued ...
FAMILY INCOME ORGANIC RICE FARMERS
N = 197 %
Fish raising
100,000 and below 189 96
100,001 to 200,000 1 1
200,001 to 300,000 3 2
300,001 to 400,000 0 0
400,001 to 500,000 1 1
500,001 and above 3 2
Total 197 100
Maximum 2,800,000.00
Mean 38,578.68
SD 263,142.33
Note: US$ 1.00 = 8,300 LKIP
Results of the study show that the respondents’ family income from rice
production ranged from 1,000,000 to 5,000,000 LKIP (US$ 120 to 602) with a mean of
9,481,866.24LKIP (US$ 1,142.39). This annual income greatly varied from season to
season and on changes in the value of the crops. Other sources of income were
vegetables which provided 100,000 to 500,000 LKIP (US$ 12 to 60) with mean of
240,680.20 KIP (US$ 28.99).. Still, vegetable production was not considered an
important source of income and 96% of the respondents claimed that vegetables were
produced primarily for home consumption rather than for commerce.
Farmers also engaged in livestock and fish raising which were traditionally used
in organic farming systems not only as a source of income but also as protein source. For
livestock raising, buffaloes were a favourite draft animal and source of organic manure.

50
Family Income from Non-farm Activities
Table 5 shows other sources of family income from non-agricultural activities.
Table 5. Other sources of family income of respondents
NON-AGRICULTURAL INCOME ORGANIC RICE FARMERS
N = 197 %
Other sources of income (LAKIP)
Non-Trimble Forest Product (NTFP)
100,000 and below 187 95
100,001 to 200,000 2 1
200,001 to 300,000 3 2
300,001 to 400,000 0 0
400,001 to 500,000 2 1
500,001 and above 3 2
Total 197 100
Maximum 1,000,000.00
Mean 24,112.18
SD 122,744.54
Commercial trees plantation
100,000 and below 178 90
100,001 to 200,000 0 0
200,001 to 300,000 1 1
300,001 to 400,000 0 0
400,001 to 500,000 0 0
500,001 and above 18 9
Total 197 100
Maximum 40,000,000.00
Mean 1,604,060.96
SD 6,491,586.67

51
Table 5 continued ...
NON-AGRICULTURAL INCOME ORGANIC RICE FARMERS
N = 197 %
Handicraft/Weaving
100,000 and below 168 85
100,001 to 200,000 0 0
200,001 to 300,000 0 0
300,001 to 400,000 0 0
400,001 to 500,000 2 1
500,001 and above 27 14
Total 197 100
Maximum 8,000,000.00
Mean 410,710.74
SD 1,227, 488.08
Trade
100,000 and below 139 71
100,001 to 200,000 1 1
200,001 to 300,000 0 0
300,001 to 400,000 0 0
400,001 to 500,000 1 1
500,001 and above 56 28
Total 197 100
Maximum 15,000,000.00
Mean 1,334,264.02
SD 2,847,932.64
Employment/off-farm activities
1,000,000 and below 181 92
1,000,001 to 2,000,000 2 1
2,000,001 to 3,000,000 5 3
3,000,001 to 4,000,000 0 0
4,000,001 to 5,000,000 5 3
5,000,001 and above 4 2
Total 197 100
Maximum 40,000,000.00
Mean 647,715.79
SD 3,342,072.14
Note: US$ 1.00 = 8,300 LKIP

52
Income from non-farm activities are, at best, forms of coping mechanisms due to
the low income from these activities. Non-farm income were mostly derived from
gathering of non-timber forest products (NTFP), sale of commercial tree plantation,
handicraft making and textile weaving and engaging in trade and wage employment.
Results show that non-timber forest product (NTFP) like bamboo shoots, rattan
shoots, honey, wild edible vegetables, and wildlife were collected by the respondents and
provided additional income without affecting agricultural productivity. However, income
range from NTFP was not significant at only 100,000 to 500,000 LKIP (US$ 12-60) with
mean of 24,112.18 LKIP (US$ 2.90). Eighty three percent (95%) of the respondents also
explained that NTFP collection served home consumption rather than commercial
purposes.
Commercial plantation trees like teakwood, rubber trees, agar wood, and
Eucalyptus which were grown in Sangthong province provided extra income between
100,000 to 500,000 LKIP (US$ 12-60) with mean of 1,604,060.96 KIP (US$ 193.26).
Most of the respondents earned a maximum annual income of 40,000,000.00 KIP
(US$ 4,819.28) from commercial tree plantation.
Handicraft making, which was considered a secondary livelihood in the past, has
also declined as a source of income. Although Laos has been known to produce and earn
from intricate patterns in home-spun silk, textiles, basketry, scarf and silk worm rising,
the industry has deteriorated. Results of the study showed that income from handicraft
was only at 100,000 to 500,000 LKIP (US$ 12-60) with mean of 410,710.74 LKIP
(US$ 49.48).

53
Income from small trading like mini-shop, manual mini-gas pump station, and
plough and threshing machine rentals ranged from 100,000 to 500,000 LKIP (US$ 12-60)
with mean of 1,334,264.02 LKIP (US$ 160.75). It is worth noting in this regard that that
some villagers earned 15,000,000 LKIP (US$ 1,807) per season from rentals of threshing
machine.
Lastly, wage income from industries like garment companies, restaurants,
building construction, house servants, accounted for additional family income ranging
from 1,00,000 to 5,000,000 LKIP (US$ 120-602) with mean of 647,715.79 KIP
(US$ 78.04). Figure 6 shows distribution of income from farm and non-farm activities.
Results showed that 55% of family income comes from rice production and 20%
from livestock raising which attests to the fact that agriculture remains as the primary
economic activity in Laos.
Table 6. Sources of annual family income
ANNUAL FAMILY INCOME
ORGANIC RICE FARMERS (n = 197)
Amount (LKIP) %
Rice 9,481,866 55
Livestock 3,531,482 20
Trees plantation 1,604,061 9
Village trade 1,334,264 8
Wage employment 647,716 4
Handicraft 410,711 2
Vegetables 240,680 1
Fish 38,579 0
NTFP 24,112 0
Total 17,313,471 100
Mean 1,923,719
S.D 3,042,868.365
Range 24,112 – 9,481,866

54
Household Family Members Working in the Farm
Table 7 shows the number of family members who are directly involved in farm
work. It is worth noting that majority of the respondents have only 1-2 members working
in the farm which could be attributed to the fact that the younger members of the family
seek work in urban areas.
Table 7. Number of household family members working in the farm
Cost of Organic Rice Production
Except for cost of seed, all other cost of production from land preparation to
threshing is the same because farmer practices are the same for all three varieties. The
main difference in cost lie in seeds where the initial investment on non-glutinous hybrid
rice is higher given that farmers buy it at higher market price. Glutinous rice seeds is
lower than non glutinous because farmers tend to barter seeds among neighbours.
Purplish blue rice, on the other hand, is the least expensive despite being a specialty rice
given that it is not the preferred variety in Lao and the yield is also significantly lower
than the other two varieties (Table 8).
FARM OPERATION
ORGANIC RICE FARMERS (n = 197)
Number %
Family members size
1 – 2 101 51
3 – 4 79 40
5 – 6 16 8
7 & above 1 1
Total 197 100
Mean 2.78
S.D. 1.16
Range 1 – 7

55
Table 8. Cost of rice production per hectare
TASKS TO
BE COSTING
COST OF PRODUCTION (LKIP/ha)
Glutinous(n=195) Non-glutinous(n=52) Purplish-blue(n=33)
Amount % Amount % Amount %
Seeds 308,362.11 15.64 472,015.21 22.10 283,018.94 14.54
Land preparation 449,493.96 22.79 449,493.96 21.05 449,493.96 23.09
Transplanting 173,916.81 8.82 173,916.81 8.14 173,916.81 8.93
Nutrient management 104,524.13 5.30 104,524.13 4.89 104,524.13 5.37
Harvesting(hired labor) 102,224.27 5.18 102,224.27 4.79 102,224.27 5.25
Hauling 1,827.09 0.09 1,827.09 0.09 1,827.09 0.09
Threshing 831,710.20 42.17 831,710.20 38.94 831,710.20 42.72
Average cost 1,972,058.57 100.00 2,135,711.67 100.00 1,946,715.40 100.00
Note: US$ 1.00 = 8,300 LKIP
Seeds’ price was affordably set by Department of Agriculture 3,000 LKIP/kg
(US$0.36) for glutinous rice and 4,000 LKIP/kg (US$0.48) for non-glutinous and
purplish-blue rice. Based on the results of the survey, farmers are actually using more
than twice the recommended amount of rice seeds per hectare. For glutinous rice, given
the cost of seeds per hectare and the actual cost/kg set by DOA, farmers are using more
than the required amount of seeds per hectare. The trend is the same for the other
varieties. Based on focus group discussion, this is because some seeds to do grow and
some are eaten by apple snails (Pomacea canaliculata), a problem that farmers consider
laborious to address.
Cost for seeds did not differ significantly and represented only a small percentage
of the total cost. Significant cost differences is in post harvest where threshing
approximately represents 39-43% of total production cost. This could be explained by the
fact that diesel price is really expensive in rural areas and some times, unavailable.

56
Return Analysis from Rice Production
To understand farmer’s income generation, the analysis of income was computed
on a per hectare basis Table 9 shows the net income from rice production given the
assumption that all of the rice produced will be sold.
The highest net income comes from glutinous rice production due to higher yield.
This holds true despite the fact that it has lower market price compared to the other two
varieties. While hybrid seeds are supposed to have higher yield, farmers are not able to
realize this potential because they re-use seeds from previous harvest, just like what they
do with glutinous rice. While both non-glutinous and purplish blue rice have the
potential for much higher yield, farmers are not able to get this benefit because of wrong
practices. Based on focus group discussion, they use the same sources of variety more
than three years.
Table 9. Return analysis per hectare from rice production
Note: US$ 1.00 = 8,300 LKIP
RICE PRODUCTION IN
2009
YIELD
(kg/ha) UNIT PRICE
(LKIP/kg)
GROSS INCOME (LKIP/ha)
PRODUCTION
COST (LKIP/ha)
NET INCOME
(LKIP/ha)
Glutinous rice (Inbred) 4,042.65 2,500 10,106,625.00 1,972,058.57 8,134,566.43
Non-glutinous (Hybrid) 3,092.28 2,800 8,658,384.00 2,135,711.67 6,522,672.33
Purplish-blue rice (Hybrid) 2,438.13 2,850 6,948,670.50 1,946,715.40 5,001,955.10
Total 9,573.06 25,713,679.50 19,659,193.86

57
Organic Rice Production
Schedule of Activities in Organic Rice Production
Rainfed rice varieties are the dominant varieties in Santhong District. Rainfed rice
cultivation involves growing of rice in lowland areas which takes place for six months
from June to October. Table 10 shows the rainfed rice farming schedule observed by
farmers in the study area.
Table 10. Organic rainfed rice farming calendar
MAIN TASKS JAN FEB MAR APR MAY JUN JUL AUG SEP OCT NOV DEC
Leveling land
First plowing land
Applying fertilizers
Seedling nursery
Second plowing land
Harrowing field
Uprooting seedlings
Transplanting
Weeding
Controlling pests
Harvesting
Field drying
Threshing
Sun drying
Transporting
Storage
Note: Usually sun drying is done after threshing. In above, it happens partly before threshing so it is
obviously the field drying (rice still in panicles). The sun drying of threshed grains is done when the field
drying does not result in a marketable product.
There are 16 major tasks which have to be periodically done throughout the year.
The first 10 tasks are necessary to ensure agronomic quality of the rice because grain
filling needs good soil tillage, vigor seeds, nutritious management and plant care to
achieve high yield. The last tasks of harvesting, field drying, threshing, paddy drying,
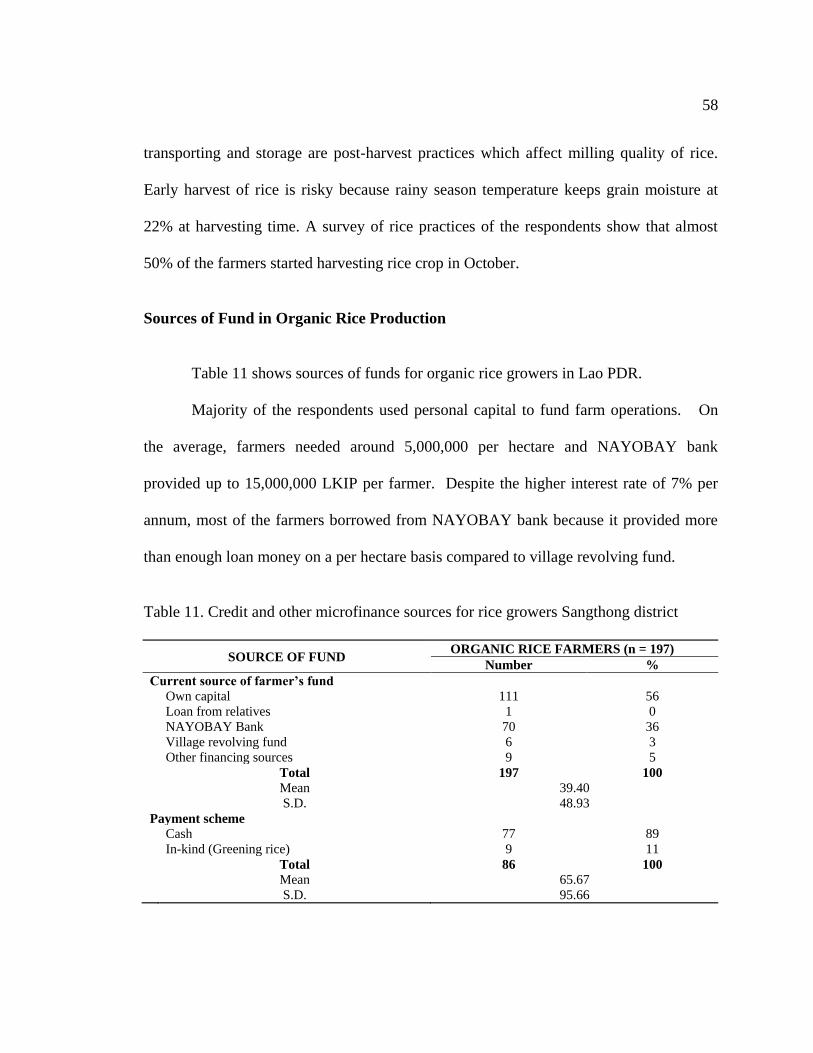
58
transporting and storage are post-harvest practices which affect milling quality of rice.
Early harvest of rice is risky because rainy season temperature keeps grain moisture at
22% at harvesting time. A survey of rice practices of the respondents show that almost
50% of the farmers started harvesting rice crop in October.
Sources of Fund in Organic Rice Production
Table 11 shows sources of funds for organic rice growers in Lao PDR.
Majority of the respondents used personal capital to fund farm operations. On
the average, farmers needed around 5,000,000 per hectare and NAYOBAY bank
provided up to 15,000,000 LKIP per farmer. Despite the higher interest rate of 7% per
annum, most of the farmers borrowed from NAYOBAY bank because it provided more
than enough loan money on a per hectare basis compared to village revolving fund.
Table 11. Credit and other microfinance sources for rice growers Sangthong district
SOURCE OF FUND ORGANIC RICE FARMERS (n = 197)
Number %
Current source of farmer’s fund
Own capital 111 56
Loan from relatives 1 0
NAYOBAY Bank 70 36
Village revolving fund 6 3
Other financing sources 9 5
Total 197 100
Mean 39.40
S.D. 48.93
Payment scheme
Cash 77 89
In-kind (Greening rice) 9 11
Total 86 100
Mean 65.67
S.D. 95.66

59
ProRice village revolving fund was the main source of funds for organic farm
operations. The fund provided individual farmers with cash of around 350,000 LKIP
(US$ 42) or equivalent 143,500,000 LKIP (US$ 17,289). While the interest rate is at 1 –
3 % and lower than NAYOBAY bank, most prefer the latter because the amount lent
through the revolving fund is not enough.
Application Preparedness, Certification
and Traceability Process
Certification is the heart of organic farming practice. CADC through ICS-SU
provided an ICS training package to farmers, millers, food processors in preparing
certification application and records required by LCB. For organic rice to be exported to
international market, it must be certified and accredited by foreign certification bodies
like NOP-United State of America, JAS-Japan, BCS-Germany, ICEA-Italy and
Bioagricert-Italy. Rice post harvest facilities also expect to be inspected every year as
part of the assumption that processing facilities operate according to international
standards.
Table 12 shows schedule of accreditation activities in the project sites.
There are three inspections conducted for the whole season: inspection of
beginning farm record, initial inspection which investigates all kinds of farm inputs to
ensure there is no synthetic chemicals used, and final inspection looks into safety
practices adopted to avoid contamination from conventional paddy. Initial document
inspection normally happens after transplanting (67%) or during early land
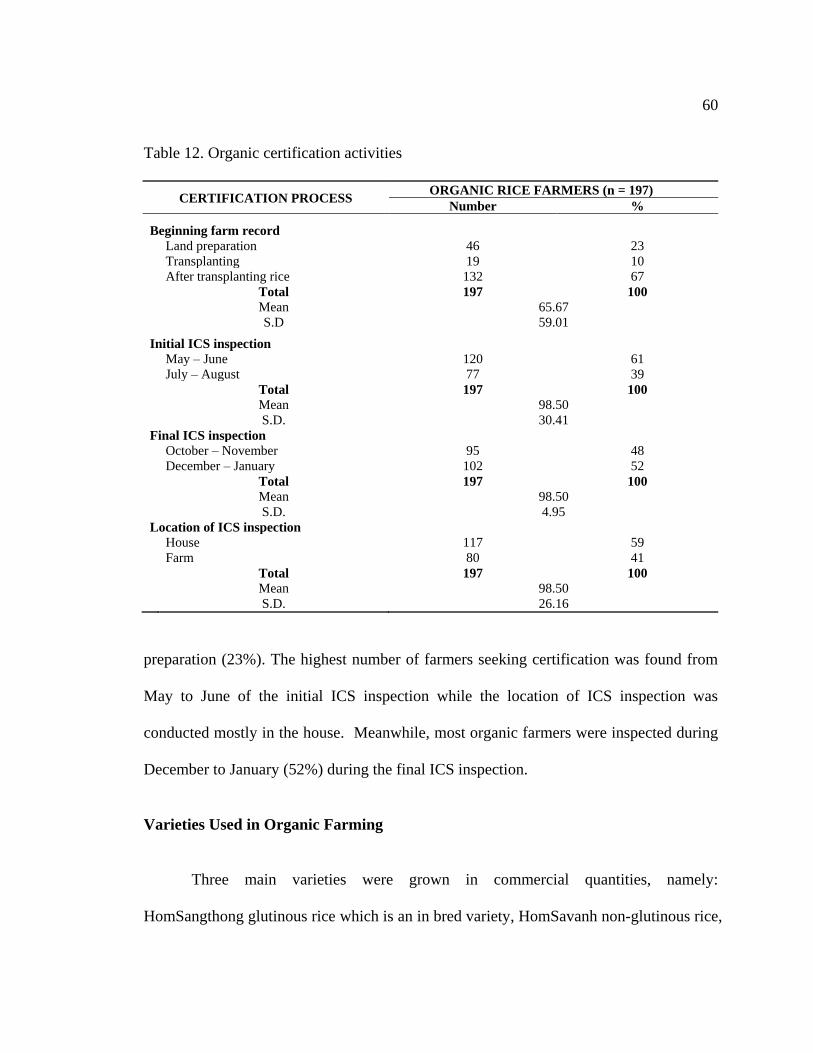
60
Table 12. Organic certification activities
preparation (23%). The highest number of farmers seeking certification was found from
May to June of the initial ICS inspection while the location of ICS inspection was
conducted mostly in the house. Meanwhile, most organic farmers were inspected during
December to January (52%) during the final ICS inspection.
Varieties Used in Organic Farming
Three main varieties were grown in commercial quantities, namely:
HomSangthong glutinous rice which is an in bred variety, HomSavanh non-glutinous rice,
CERTIFICATION PROCESS ORGANIC RICE FARMERS (n = 197)
Number %
Beginning farm record
Land preparation 46 23
Transplanting 19 10
After transplanting rice 132 67
Total 197 100
Mean 65.67
S.D 59.01
Initial ICS inspection
May – June 120 61
July – August 77 39
Total 197 100
Mean 98.50
S.D. 30.41
Final ICS inspection
October – November 95 48
December – January 102 52
Total 197 100
Mean 98.50
S.D. 4.95
Location of ICS inspection
House 117 59
Farm 80 41
Total 197 100
Mean 98.50
S.D. 26.16

61
and purplish-blue rice, both hybrid varieties. These varieties were certified organic
varieties under Lao Union of Science and Engineering Associations with National
Science.
Table 13 shows varietal uses of organic rice.
The most popular variety is the glutinous rice which is preferred by Lao
consumers. In addition, some farmers still planted non-glutinous rice (52%) or purplish
blue rice (33%) for commercial purposes.
Chi-Square test (2=282) showed that that there was an association between
utilization and three types of grains. Results indicated that farmers grew glutinous rice for
the both home consumption and income while non-glutinous and purple-blue rice were
grown mostly for commercial purposes.
Table 13. Uses of organic rice varieties in Sangthong district
* Significant at 0.05 level; ns Not significant
SEED VARIETIES
GLUTINOUS
RICE
(INBRED)
NON-
GLUTINOUS
RICE
(HYBRID)
PURPLISH-
BLUE RICE
(HYBRID)
Number % Number % Number %
Varietal use 195 100 52 100 33 100
2 = Pearson Chi Square: 282.00 p-value: 0.000*
Utilization
Consumption 78 40 3 6 3 9
Market 117 60 49 94 30 91
Total 195 100 52 100 33 100
Mean 98.50 26.00 16.50
S.D. 98.50 26.00 16.50
2 = Pearson Chi Square: 282.00 p-value: 0.000*

62
Land Preparation
Land preparation involves plowing, harrowing, and leveling the field to make it
suitable for rice establishment. In preparing their lands, two-wheel hand-tractors were
used in the study area. For land preparation, soil tillage was twice. First, lower soils were
plowed and left for a week and exposed to sunlight. Then, soil were harrowed and leveled
respectively to soften mud and make it easier and safer for transplanting. Only a small
portion actually performs leveling the farm.
Table 14 shows common land preparation practices in the study area. Majority of
the farmers use machine for land preparation. Of those who use machine, most of them
personally own the machine they use (75%). Common machineries for land preparation
are two wheel hand tractors and double rotovators. The farmer who prepares his land
manually owns his draft animal and farm implements. Eighty percent (80%) of the
respondents’ performed tillage twice because of bad silt-soil texture which cost about
173,916.81 LKIP (US$ 20.95) per hectare (for more details please see Table 8) using
their own machine.
Using Chi-Square test (2 = 0.173) of independence, it was found that the method
in use and the type of land preparation were not related. Results also show that land
preparation using the 2-wheel hand-tractors and double rotovators instead of a plow were
also used and land preparation was primarily performed by men at the start of rainy
season in June. Results further show that there is a significant relationship between
machinery ownership and categories of land preparation.

63
Table 14. Common land preparation practices in organic farms
* Significant at 0.05 level; ns Not significant
Seedlings Establishment
Based on focused group discussion and observation, seedling areas were
conveniently located close to the main fields for efficient watering. Wet bed nursery
preparation using 60 – 80 kg seed per hectare is practiced, depending on the degree of
apple snails (Pomacea canaliculata) outbreak.
LAND PREPARATION PLOWING HARROWING LEVELING
Number % Number % Number %
Method in use
Machine 196 99 196 99 34 17
Animal draft 1 1 1 1 0 0
Manual 0 0 0 0 163 83
Total 197 100 197 100 197 100
Mean 65.67 65.67 65.67
S.D. 112.87 112.87 85.99
2 = Pearson Chi Square: 0.173 p-value: 0.917ns
Ownership
Own machine 148 75 148 75 21 11
Rent machine 39 20 39 20 13 7
Borrow from relatives 9 5 9 5 0 0
Own animal draft 1 1 1 1 0 0
Own farm implements 0 0 0 0 163 83
Total 197 100 197 100 197 100
Mean 39.40 39.40 39.40
S.D. 62.74 62.74 69.67
2 = Pearson Chi Square: 452.6 p-value: 0.000*
Frequency use of machine
Once 38 19 196 100 196 100
Twice 158 81 0 0 0 0
Total 196 100 196 100 196 100
Mean 98.50 98.50 98.50
S.D. 85.56 139.30 139.30
2 = Pearson Chi Square: 4.350 p-value: 0.000*

64
Transplanting
Table 15 shows transplanting activities in study area.
Based on focused group discussion, vigorous rice seedlings were pulled when
their age reached 28 days. Seedlings were tied in bundles for convenient carrying during
transplanting. Most of the farmers transplanted at the rate of 3 – 4 seedlings per hill.
Based on focused group discussion, seedlings were transplanted at a depth of 3 – 4 cm
and a spacing of 20 cm x 20 cm or 15 cm x 15 cm depending on varieties and soil fertility.
This led them to plant more seedlings to ensure better survival rate. Farmers also shared
Others farmers planted with a spacing of 15 × 15 cm. The recommended dimension was
Table 15. Rice transplanting practices
TRANSPLANTING METHOD
Organic rice farmers (n = 197)
Number %
Age of seedlings
16 – 20 3 2
21 – 25 22 11
26 – 30 172 87
Total 197 100
Mean 28.55
S.D 2.23
Range 16 – 30
Number of seedlings per hill
1 – 2 3 2
3 – 4 80 41
5 – 6 69 35
7 – 8 40 20
9 – 10 5 3
Total 197 100
Mean 5.23
S.D. 1.58
Range 1 – 10

65
25 cm x 25 cm but farmers did not follow this because it was not enough to effectively
compensate for crops damaged by apple snails (Pomacea canaliculata). that gaps
occurred during transplanting due to rice crabs (Varuna litterata), apple snails (Pomacea
canaliculata), and broken and/or injured seedlings at the time of transplanting. These
gaps were filled within two weeks using extra seedlings from the nursery.
Organic Fertilizer Application
Base on focused group discussion, majority of the farmers applied 5–10 tons of
compost per hectare. Table 16 shows nutrient management practices of farmers in the
study area.
Table 16. Rice nutrient management
1 wet compost, bokashi, and bio-extract
METHOD OF APPLICATION
ORGANIC RICE FARMER (n = 197)
Number %
Non- application
Grow naturally 73 37
Compost1
Basal 74 38
Top dressing 1 22 11
Top dressing 2 1 1
Pure manure
Basal 25 13
Top dressing 1 1 1
Top dressing 2 1 1
Total 197 100
Mean 28.14
S.D. 32.59

66
A significant number of farmers (37%) did not apply fertilizer at all while
majority used compost. The rest of the remaining respondents applied fertilizer only
once. Based on interviews, farmers classified compost into three: wet compost, bokashi
and bioextract. Wet compost was most commonly used and it came from a combination
of several materials like manure, kitchen wastes and farm wastes composted for three
months either in a bamboo trap or in pits. Pure manure was sourced from livestock.
Common Pest in Rice Production
Table 17 shows pest-related problems in farms in the study area.
Results show that apple snails (Pomacea canaliculata) were the dominant pest for
most farmers (87%) which affected farm productivity. Farmers dealt with the problem by
manually removing both eggs and apple snails from fields. Most of farmers collected the
apple snails for cooking and used the eggs for feeding poultry. There were very few pest
outbreaks during the vegetative stage but insects like black bugs (Scotinophara spp), gall
midge (Prodiplosis longifila Gagné) and stem borers (Scirpophaga incertulas) were
periodically present during the reproductive stage. However, their population and damage
was not significant enough to prompt farmers to pay attention to the problem.
Weeds also caused difficulty in the organic rice farms. Weeds were manually
removed at least two times a year after 15 days and 40 days of transplanting. Rats (Rattus
norvegicus) and rice birds (Padda Oryzivora) were common during harvest season.
Based on key informant interviews, farmers normally used traps and straw
puppets were used to control and expel these pests.

67
Table 17. Pest-related problems in organic rice farms
PEST DAMAGE IN RICE FIELD
ORGANIC RICE FARMERS
(n = 197)
Number %
1. Vegetative stage
1.1 Insects
Prodiplosis longifila Gagné 11 6
Baliothrps Biformis 3 2
Nilaparvata lugens 7 4
Mythimna sparata 1 1
Valanga nigricornis 1 1
Melanitis leda imene 2 1
1.2 Pests
Pomacea canaliculata 87 44
1.3 Weeds
Fimbristylis miliacea (L.) Vahl 29 15
Cyperus difformis L. 19 10
Monochoria Vaginalis 15 8
Digitaria Ciliaris (Rezt.) Koel 22 11
Total 197 100
Mean 17.91
S.D 24.77
Ranged 86
2. Reproductive stage
2.1 Insects
Scirpophaga incertulas 13 7
Scotinophara spp. 29 15
Prodiplosis longifila Gagné 26 13
Baliothrps Biformis 1 1
2.2 Pests
Non 0 0
2.3 Weeds
Fimbristylis miliacea (L.) Vahl 42 21
Cyperus iria L. 45 23
Monochoria Vaginalis 41 20
Total 197 100
Mean 24.63
S.D 18.15
Ranged 45

68
Table 17 continued …
Harvesting/Cutting
Based on focus group discussions, farmers start harvesting rice when panicles
showed signs of maturity and 45% of the leaves had become yellowish. Farmers opined
that harvesting was laborious and a time-consuming task and most of the respondents
experienced difficulty in harvesting on time due primarily to labor shortage. Delays in
harvest can result to physiological loses due to falling panicles. Rain also provided risks
when harvest was delayed. Some farmers therefore resorted to hiring laborers during
harvest at an estimated cost of 102,224.27 LKIP (US$ 12.31) per hectare (Table 8).
Table 18 shows harvest practices of farmers in the study area.
Most farmers use family labor and labor exchange for harvesting (79%) while the
remaining respondents hire labor (21%). Farmers also perform hauling activities
PEST DAMAGE IN RICE FIELD
ORGANIC RICE FARMERS
(n = 197)
Number %
3. Maturity stage
3.1 Insects
Scotinophara coarctata 13 7
3.2 Pests
Rattus norvegicus 12 6
Padda Oryzivora 23 12
3.3 Weeds
Leptochloa chinensis (L.) Nees 82 42
Ischaemum rugosum salisb. 67 34
Total 197 100
Mean 39.40
S.D. 32.76
Ranged 70

69
themselves (94%) while the remaining respondents ask help from relatives. For threshing,
an overwhelming majority (99%) use thresher’s services.
T-test analysis showed that use of harvest/cutting and threshing did not
significantly differ. Harvesting was done manually by all farmers but threshing was
completely mechanized and done by machine operators.
Table 18. Harvest practices and labor sources
* Significant at 0.05 level; ns Not significant
Field Drying, Hauling and Piling
The common practice for rice farmers is field drying. After an average of 2-5 days
of field drying in farm (depending on intensity of heat from sun), the cut panicles are tied
HARVEST PRACTICES
MANUAL HARVEST MACHINE OPERATED
Number % Number %
Harvest/Cutting
Family + labor exchange 155 79 0 0
Hired labor 42 21 0 0
Total 197 100 0 0
Mean 98.5 0
S.D. 79.90306627 0
T-Test t-value =1.743 p-value = 0.223ns
Hauling
Family 186 94 195 99
Relatives 11 6 2 1
Total 197 100 197 100
Mean 98.5 98.5
S.D. 123.7436867 136.4716088
T-Test t-value = 1.000 p-value =0.000*
Threshing
Use thresher’s service 0 0 195 99
Family 0 0 2 1
Total 0 0 197 100
Mean 0 98.5
S.D. 0 136.4716088
T-Test t-value = -1.021 p-value =0.415ns

70
and removed immediately for pilling on dried ground on an elevated site beside rice field,
the purpose of piling is to wait for machinery thresher.
Based on actual observation, among large farm size and those near main roads,
grains were hauled using hand tractors. This task required less labor but increased
expenditure for diesel cost per hectare at a mean of 250,000 LKIP (US$ 30.12) or 31
liters (based on survey results). Thus, 94% of the respondents preferred manual hauling,
which was done by water buffalo and cart.
Threshing and Transporting
Based on informal interview with village elder, the Sangthong farmers started
using machinery thresher since 1998. Machine thresher was embraced because of lack of
farm labor. Based on actual observation, manual threshing per hectare by at least two
family members lasted about one month. Therefore, almost all of the respondents (99%)
often resorted to machine threshing, particularly using two machine threshers in
NaHoiPang and HaiNeua villages. Transportation of the paddy sacks to the granary was
included in the services provided by threshers. For every 10 sacks threshed, one sack was
paid to the threshing machine operator/mechanic (1 sack of poly propylene is equivalent
of 60 kg and 1 jute sack equals 80 kg). The practice costs of 831,710.20 LKIP
(US$ 100.20) per hectare (Table 8).

71
Organic Rice Yield Production
Table 19 shoes average yield per hectare of three varieties.
Based on survey results, glutinous rice gives the highest yield, almost four tons
per hectare, followed by Purplish blue rice while non-glutinous rice gives the lowest yield
at 2.4 tons per hectare. While hybrid rice is expected to have higher yields, this potential
is not realized as farmers reuse seeds from previous harvests.
Table 19. Average yield per hectare of the three varieties
Storage
Table 20 shows the characteristics of storage facilities used by farmers in the
organic rice farmers in the study area.
Results show that majority of the farmers (50%) used wooden storage houses with
steels roofs. Twenty four percent (24%) used houses made of bamboo with roof of dried
grasses while other farmers used concrete storage houses. Majority of the farmers (88%)
also used storage granaries with a maximum capacity of 10 tons. Only a small number of
the farmers had granaries that could store 31 tons. Most of the farmers (55%) stored their
grains from 10 to 12 months while 41% stored for 7 to 9 months and only 4% stored
TYPES OF RICE YIELD 2009 (Kg/ha)
Amount S.D Range
Glutinous rice (Inbred) 4,042.65 3,088.69 600.00 - 28,125.00
Non-glutinous rice (Hybrid) 3,092.28 1,772.39 600.00 - 10,000.00
Purplish-blue rice (Hybrid) 2,438.13 957.66 937.50 - 5,208.33

72
for 4 to 6 months. Rats (Rattus norvegicus) and rice birds (Padda Oryzivora) were also
common problems in grain storage. The length of storage time has implications to grain
quality. Longer storage requires better drying practices to attain good grain quality.
Table 20. Characteristic of rice storage used by organic rice farmers
STORAGE ORGANIC RICE FARMER (n = 197)
Number %
Granary capacity (ton)
5 – 10 174 88
11 – 30 20 10
31 & above 3 2
Total 197 100
Mean 9.13
SD 11.75
Range 0 – 40
Length of storage (month)
4 – 6 7 4
7 – 9 81 41
10 – 12 109 55
Total 197 100
Mean 11
SD 3
Village granary structure
Concrete with tile 3 1
Wooden with steel 98 50
Bamboo with grasses 47 24
Others 49 25
Total 197 100
Mean 49.25
S.D. 38.82
Problem in rice granary
Fungi/mold development 2 1
Rats and birds attach 81 41
Storage insect infestation 22 11
None 92 47
Total 197 100
Mean 49.25
S.D. 44.01

73
Utilization Practices
Table 21 shows the utilization practices observed by farmers and household in the
study area.
Results reveal that farmers are becoming market oriented given that majority of
their yield is sold in the market. This trend is different from other areas where most of
the farmers remain subsistence. The increased market orientation a can probably be
attributed to farmer’s exposure to market as a result of PROFIL advocacy. The practice
of selling of the rice, however is different among varieties. For the two hybrid varieties,
farmers sell all of the amount of rice to the market at once. However, for the glutinous
variety, farmers tend to keep the produce in the granaries as they prefer to keep for food
and financial secure where they sell when they need cash.
The table also reflects the farmers practices of seed bartering as farmers save
more than they need for bartering practices. Results also reveal that farmers use hybrid
seeds from previous crops which explain the low yield from both hybrid varieties.
Table 21. Rice utilization practices of farmers
RICE UTILIZATION
TYPES OF GRAIN (in kg/hectare)
Glutinous rice Non-glutinous Purple-blue rice
Amount % Amount % Amount %
Home consumption 1,558.64 38.55 408.11 13.20 188.15 7.72
Seeds 154.13 3.81 314.31 10.16 84.47 3.46
Sold 2,329.88 57.63 2,369.86 76.64 2,165.51 88.82
Total yield 4,042.65 100.00 3,092.28 100.00 2,438.13 100.00
Mean 1,347.55 1,030.76 812.71 S.D. 1103.128 1160.643 1172.706
2 = Pearson Chi Square: 1194.007 p-value: 0.000*
* Significant at 0.05 level; ns Not significant

74
Village Milling for Home Consumption
Majority of the respondents (76%) milled rice once a month at village rice mills
while 15% milled every two weeks at a commercial rice mill. Other farmers used
services from both the village and the commercial rice mill.
Most farmers estimate that milling recovery is at 41%-50% while a few contend
that it is as high as 61%-70%. Majority of the farmers pay in cash for milling while some
pay in kind.
Table 22 shows rice milling practices among farms in the study area.
Table 22. Rice milling management system within household
* Significant at 0.05 level; ns Not significant
RICE MILLING
SMALL VILLAGE
RICE MILL
COMMERCIAL RICE
MILL
Number % Number %
Frequency of rice milling
Every week 19 10 34 17
Every other 2 weeks 29 15 101 51
Every other 3 weeks 0 0 1 1
Once month 149 76 61 31
Total 197 100 197 100
Mean 49.25 49.25
S.D. 67.58 42.33
T-Test t-value = 0.083 p-value =0.0937ns
Milling recovery (%)
30 – 40 0 0 13 7
41 – 50 166 84 33 17
51 – 60 26 13 96 49
61 – 70 5 3 55 28
Total 197 100 197 100
Mean 49.25 49.25
S.D. 78.64 35.58
T-Test t-value = 0.038 p-value =0.971ns
Payment scheme
Cash 139 71 158 80
In kind ( Bran+broken rice) 58 29 39 20
Total 197 100 197 100
Mean 65.67 65.67
S.D. 64.84 82.31
T-Test t-value = 0.000* p-value = 1.000ns

75
The T-test analysis showed that the frequency in milling rice is not significant
between small village rice mill and commercial rice mill. Similarly, the T-test analysis
showed that there is no difference across mode of payment of the organic rice farmers
who used small village rice mill and those who used commercial rice mill.
Paddy Marketing Through Village Collectors
It is hard to get actual amount of paddy sold from farmers because farmers
themselves sold paddy gradually depending on their need for money. The needs varied
occasionally in the form of loan/mortgage settlement, children education/support, health
treatment, and other basic needs in their own family. Farmers also sold their paddies at
higher price during July to October. Table 23 shows paddy estimates sold to traders
based on farmer survey.
After harvesting, most farmers urgently need money to pay loans. As such, a large
quantity of organic paddy is therefore sold during December to February every year.
Unfortunately, paddy price at this time is quite low. Using T-test analysis, we can say that
there is no significant difference on the mean paddy purchase between systematic and
trading scheme. Despite the encouragement to sell to organic certified rice traders, most
farmers still sell to uncertified traders. This could be attributed to the fact that there is no
price differentiation between certified and uncertified rice traders.

76
Table 23. Organic paddy purchasing scheme
* Significant at 0.05 level; ns Not significant
Farmer’s Training Support System
The organic rice farmer’s training support system is an integrated training support
activity that is flexible enough to meet organic aspect strategies. To achieve safe food,
protect the environment and promote good health, training design followed the organic
rice growing standard policies of International Federation of Organic Agriculture
Movement (IFOAM). Training approach included non-formal education principles as
well as practical trainings and demonstrations. Table 24 shows the 10 training modules
participated in by the respondents.
An additional module on Participatory Market Chain Approach (PMCA) was
implemented to facilitate the development of rice value chain where farmers built long
term alliances with buyers and then farmers become crop specialists with a clear market
orientation.
Majority (29%) of the farmers in the village cluster received training specifically
in Module 1 and module 10 (20%).
PADDY PURCHASE
TRADING SCHEME (Ton)
Certified traders Uncertified traders
Amount % Amount %
Sold paddy in crop 2009 – 2010
Glutinous rice 207.50 64.48 423.64 96.19
Non-glutinous 88.30 27.44 0 0.00
Purple-blue rice 26.02 8.09 16.77 3.81
Total 321.82 100.00 440.41 100.00
Mean 107.27 146.80
S.D. 92.22 239.89
T-TEST t-value= -0.266 p-value=0.810ns

77
Table 24. The training programs attended
In the training assistance given to farmers, knowledge basically came from three
major sources namely: the central government, PAFES/DAFES and Project. Most
farmers attend training program support of central government mostly on organic
agricultural standard, organic vegetable for home consumption and healthy seed selection
and multiplication. But training program supported by PAFES/DAFES on water and
nutrient management, rice transplanting, and compost production. And most farmers
attend training supported by project on post harvest management and marketing.
Training providers also used adult education learning approach using self-
discovery and knowledge exchange which involved experiences, reflection, immediate
FARMER’S TRAINING
ORGANIC RICE FARMER
( n = 197 )
Number %
Training courses provided
Module1: organic standard/rice farming 56 29
Module2: Soil and nutrient management 19 10
Module3: Rice cropping cycle 11 5
Module4: Compost and bio extracts 24 12
Module5: water contamination protection 17 8
Module6: Crop rotation and intercropping 9 5
Module7: agro-ecosystem management 8 4
Module8: Pest control 5 3
Module9: Integrated farming 3 2
Module10: Harvest and post harvest techno 39 20
Additional module: Market approach 6 3
Total 197 100
Mean 17.91
S.D. 16.40
Training places
Vientiane town 9 4
Sangthong district 84 43
Village cluster 68 35
Farm sites 36 18
Total 197 100
Mean 49.25
S.D. 33.44

78
needs, self-responsibility, participation, feedback, empathy, a safe atmosphere, and a
comfortable environment, exchange of experiences among participants and field trips
within country and neighboring countries like Thailand.
Table 25 shows the various trainings topics normally given by service providers. .
Project here refers to PROFIL.
Table 25. Training topics given by service providers
TRAINING PROGRAMS
CENTRAL
GOVERNMENT PAFES/DAFES PROJECT
Number % Number % Number %
Pre-production
Organic agricultural standard 194 98 0 0 3 2
Organic rice farming 0 0 13 15 87 85
Production
Healthy seed section and seed
multiplication
197 100 0 0 0 0
Seedbed nursery 55 28 100 51 42 21
Land preparation and soil
improvement
14 7.11 71 36.04 112 56.85
Compost and BOHASHI
production
0 0 148 75 49 25
Bio-Extract production 32 21 84 55 37 24
Rice transplanting 0 0 166 84 31 16
Farm record and documentation 20 13 33 22 100 65
Weeding and pest management 95 48 77 39 25 13
Nutrition management 0 0 172 87 25 13
Water management and buffer
zone
23 12 152 77 22 11
Post-production
Harvesting and variety selection
for next crop season
0 0 60 30 137 70
Post harvest and grains quality 0 0 1 1 196 99
Threshing and sacking system 0 0 47 24 150 76
Storage and insects prevention 0 0 56 28 141 72
Others
Farm record and documentation 20 13 33 22 100 65
Organic vegetable home garden 197 100 0 0 0 0

79
Based on the above table, the central government concentrates on mostly on pre
production topics, the DAFES on production topics while the project, on post harvest
topics.
Farmers’ Training Needs
Table 26 shows additional training needs identified by respondents of the study.
Results show that 33% of the respondents expressed a need for training on
making business plan followed closely by 30% who expressed need for apple snails
control (Pomacea canaliculata). This is understandable given the low number of farmers
who have received training along these lines.
Table 26. Training needed
TRAINING NEEDED ORGANIC FARMERS (n=197)
Number %
Rice related training programs identified
Farmers' business plan 64 33
Seed multiplication 5 3
Apple snails control 59 30
Black bugs control 3 1
Compost production 7 3
Post harvest management 32 16
Drying and importance of flat-bed dryer 5 3
Other training programs
Organic vegetables and home garden 22 11
Total 197 100
Mean 24.63
S.D. 24.91
Ranged 61
T-test T-value : 2.797 p-value : 0.027 *
* Significant at 0.05 level; ns Not significant

80
Organic Rice Millers and Traders
There are four key players in milling and trading of organic rice in Lao-PDR. The
results below are from focus group discussion and highlights of the survey.
SomPhone Rice Mill (GFMG1). SamPhone rice mill has two rice mill machines.
The major equipment in first milling line consists of pre-cleaner, rubber roller husker,
paddy separator, three cleaners (sorters/ husk separators), three stone polishers, two
graders, bagging station, moisture meter, and compressor for pressurized air. The second
rice mill has same milling line but there are additional equipment like de-stone, Chinese
rubber roller husker with 2 tons/hr capacity, and paddy separator.
For cropping season 2009, paddy price for glutinous rice at farm gate was 2,500
LKIP (US$ 0.3) per Kg, 2,800 LKIP (US$ 0.34) per Kg for non-glutinous and purplish-
blue rice. Some of the organic farmers sold paddy to SomPhone and transported their
grains 30 km to the rice mill for which they received an additional 100 LKIP (US$ 0.01)
per Kg. In 2009, SomPhone bought organic paddy from farmers in volumes of 32 tons,
18 tons, and 23 tons of glutinous, non-glutinous, and purplish-blue rice respectively. The
grains were not classified as organic or non-organic. SamPhone also purchases
conventional paddy from Vientiane and Savannakhet provinces. About 370 tons of brown
rice, graded rice, white rice mix (whole grain and broken rice used without grader), large
broken rice, small broken rice, rice bran, and husk were collected.
The SomPhone rice mill started exporting 22 tons of milled rice to France in 2004
and currently, their main domestic markets are wet market/retail shops. Market in France

81
was cut in 2005 due to poor quality of grain and too many mixed grain fractions (small
brokens, large brokens, and whole grain). Other potential markets are Southeast Asian
markets, traders in Singapore and Malaysia.
SomePhone rice mill has existing contracts with Lao Farmer Product and State
Food Stuff Enterprise. Both food processing companies hold organic and fair-trade
certifications and their rice mills are inspected frequently by Agricultural Certification of
Thailand, Lao Certification Body, and Bio Control System as requirement of EU market.
Milling fee is set at 300 LKIP (US$ 0.04) per Kg for brown rice and 100 LKIP
(US$ 0.01) Kg for polished rice (rice mill owner will gain profit from rice bran and
broken rice).
Table 27. Market channels of SomPhone rice mill
TARGETED CONSUMERS TYPES OF MILLED
RICE SOLD (ton/month)
Wet market/retail shop Conventional rice 17
Pakpasak college Conventional rice 6
Government institute Conventional rice 21
Total 44
SomHong Rice Mill (GFMG2). SamHong Rice Mill operates using a milling
facility with pre-cleaner, rubber roller husker, three cleaners (husk separators), three
stone polishers, grader, and bagging station. Flat-bed dryer was set up. A purchase order
for a second rice mill is currently being processed and storage capacity is being increased.
This rice mill is a certified organic processor and its products sell organic commodities.

82
SamHong rice mill purchases organic paddies from HaiTai, Pakthep, NaSaoNang,
Natiem, and Natarn villages in amounts of 120 tons of glutinous rice, 150 tons of non-
glutinous rice, and 10 tons of purplish-blue rice. Another 540 tons of conventional rice is
purchased per year.
Market products of SamHong are either unpacked or packaged in plastic
enclosure in one kilo and three kilo packages. Packaged products include: aromatic
glutinous rice, non-glutinous rice, non-glutinous brown rice, purplish-blue rice, mixed
purplish-blue rice and white rice. Unpackaged or ordinary products are conventional
white rice mix (brokens), broken rice, rice bran, and husk.
This rice mill markets and distributes mainly in wet markets, garment, retail shop,
and minimart. It has also exported 4 tons in 2007 and 7 tons in 2008 of purplish-blue rice
to CLARO fair-trade, Switzerland.
Table 28. Market channels of SomHong rice mill
TARGETED CONSUMERS TYPES OF MILLED
RICE
SOLD
(ton/month)
Tang-Fair minimart/Lao-ITECC Organic 2
Silk-Handicraft Shop Organic 0.24
Kongtup-trade cooperation shop Organic 0.4
Thongkhankham retail shop Organic brown and purplish-
Blue rice
0.5
Thatluang market Conventional rice 0.96
DongDok Market Conventional rice 10
Keomixay garment Conventional rice 10
DaoHeuang Market (Pakse) Conventional rice 8
Organic weekend market Organic 1
Total 33.5 (organic = 4.14)

83
Based on survey results, about 4.14 tons per month is in demand at the domestic
markets. Pricing system is based on the monthly fluctuation of conventional price plus
cost of rice packaging of 2,000 LKIP (US$ 0.24) for each kilogram. Glutinous rice from
SamHong costs 8,000 LKIP (US$ 0.96) per kg. Non-glutinous rice costs 10,000 LKIP
(US$ 1.2) per kg of purplish-blue rice costs 15,000 LKIP (US$ 1.8).
Based on key informant interviews, key issues in post harvest development
include poor quality of plastic material used in packaging, inefficient use of vacuum
packaging systems and non-use of fumigation during processing.
Table 29 shows result of survey and actual laboratory assessment on milling
quality. This data was used in cost and benefit analysis in Table 43 and 44. SomPhone
rice mill is used as standard because his rice mill is under subcontract with the two rice
processors, State Food Stuff Enterprise (SFSE) and Lao Farmer Product (LFP) who
mainly package and sell organic rice.
Table 29. Green Field Miller Group (GFMG) production capacity and milling quality
RICE MILL
OWNER
No.of
RICE
MILL
MILLING
CAPACIT
Y(ton/day)
OPERATION
(hour/day)
MILLING
RECOVERY
(%)
WHOLE
GRAIN IN
WHITE RICE
(%)
BROKEN
RICE (%)
Large Small
Some Phone 2 10 8 60 40 16 4
Some Hong 1 (1) 6 6 60 40 15 5
State Food Stuff Enterprise (SFSE). The SFSE is located in Sihom village,
Chanthabuly district, Vientiane capital. It was a new chain actor in organic rice value
chain in 2009 but even then, it had various potentials in the export markets. The SFSE is

84
currently working on food processing of instant sealed rice, vegetables, and livestock.
This company purchased organic paddy through organic village collectors appointed by
ProRice. All organic intakes flow from HaiTai, HaiNua, NaSaoNang, PakThep, Nalard,
Natiem, and TaoHai villages. 40 tons of glutinous rice, 2 tons of purplish-blue rice, and
61 tons of non-glutinous rice are purchased and milled in SomePhone rice mill. Machine
sorting is also performed there.
Milled rice certified as organic was sold at the same price of ordinary rice because
organic market is not established yet for SFSE. In order to meet market demand, SFSE
collected 2,020 tons of conventional paddy a year from everywhere in the country.
The packaging equipment of the mill included a moisture meter, seal bagging and
vacuum machines. The products have two sizes of sealed rice pack, 2 kg and 5 kg
respectively. Based on survey results, the bulk of organic rice market is Lao Beer
company and government institutes. Export market was Vietnam only. During Vietnam
New Year, the Vietnamese bought a lot of glutinous rice, least 1 kg per family, which
indicated that that glutinous rice can make good business for SFSE.
Table 30. Market channels of SFSE
TARGETED
CONSUMERS
TYPES OF MILLED
RICE
SOLD
(ton/year)
Government institutes Glutinous rice 500
FAO (Food for Work) Glutinous rice 435
Lao Beer company Non-glutinous rice 800
Vietnam Glutinous rice 200
Total 1,935

85
Other market opportunities have also risen in the past years. China wants to
import around 30,000 tons of rice per year. EU is currently helping buy 15,000 tons Lao
rice a year and Africa is negotiating the procurement of 400,000 tons of rice per year.
However, existing organic farmers may not be able to meet the demand of these markets.
Lao Farmer’ Product company (LFP). LFP has plenty of experiences on
international trading especially in the French market. A few years ago, by supporting and
buying chemical-free rice free rice in Xiengkhuang province, it developed Khao Kai Noy
rice, a cheap variety which eventually became well-known in the EU market. In 2009,
LFP joined the organic rice production and marketing for the first time. Interest among
Sangthong farmers increased on due to LFP’s potentials to provide the quantity and
quality of products to meet premium price demands. That same year, LFP did not buy
paddy from Sangthong district yet planned to buy crop estimating to around 400 tons of
rice, 200 tons of non-glutinous rice, 130 tons of glutinous rice, and 70 tons of purplish-
blue rice by 2010-2011.
The packaging system of LFP includes a machine sorting, manual sorting facility,
heat pasteurization equipment, and vacuum apparartus. Paddy from farmers are usually
directly transported to SomePhone rice mill for milling and machine sorting.
LFP also has access to mainly four export markets like France, Belgium,
Switzerland, and Germany. LFP products have been scrutinized for their low quality
especially since mixed grains are more recommended by international consumers.

86
Table 31. Market channels of LFP
TARGETED
CONSUMERS
TYPES OF MILLED
RICE
SOLD
(ton/year)
France Glutinous and non-glutinous rice 36
Belgium Glutinous and non-glutinous rice 18
Switzerland Glutinous and non-glutinous rice 5
Germany Glutinous and non-glutinous rice 15
Total 74
Trader paddy purchase and market data. Table 32 shows the amount of organic
paddy purchased by traders through certified traders. GFMG represents data for both
Somphone and SomHong rice mills and the total amount purchased is 64.4 ton for
glutinous rice and 35.2 ton for non-glutinous rice. For SFSE, the total amount purchased
glutinous rice is 143.1 tons and 53.1 ton for non-glutinous rice. No data is presented for
Lao Farmer Product because their source of organic rice is outside of Santhong district.
However, it was included in the survey given the fact that it is a key organic exporter and
plans to buy a bigger bulk of organic rice from Santhong for 2011.
SFSE trends to has global network in both market channels and big quantity sold
is subjected booming market strategy of the company in order to build trust to the clients
that its supply capability which covered 65% for both domestic and foreign markets. In
term of quality, LFP plays role at foreign markets 24% while GFMG markets at
Vientiane capital but in the meantime they learn to export product from small till big
quantity even failures were experienced due to low standard of products and less price
than domestic markets (Table 33).

87
T-test examines that the domestic markets and foreign markets have no significant
difference among actors, since the p-value 0.341 is greater than 0.05 alpha.
Table 32. Organic paddy purchased through certified traders, 2010
VILLAGE
PURCHASED PADDY (ton)
SOLD TO WHOM HomSangthong
glutinous rice
HomSavan Non-
glutinous rice
Purplish-
blue rice
HaiTay 2 0.8 0.36 GFMG
6 1.5 0.66 SFSE
NasaoNang 12 10 3 SFSE
Pakthep 35 20 3 SFSE
Natarn 50 0 10 SFSE
Natiem 62.4 34.4 3.2 GFMG
15.6 8.6 0.8 SFSE
Nalard 4.5 2.5 1.5 SFSE
Namieng 0 3 2.5 SFSE
TaoHai 15 5 0 SFSE
NahoyPang 0 1 0 SFSE
HaiNua 5 1.5 1 SFSE
TOTAL 207.5 88.3 26.02
Table 33. Summary market channels of rice millers and processors
ACTORS
DOMESTIC MARKETS
(Tons/years)
FOREIGN MARKETS
(Tons/years)
Amount % Amount %
SomePhone rice mill 528 19.81 22 6.54
SomeHong rice mill 402 15.08 7 2.31
SFSE 1,735 65.10 200 66.01
LFP 0 0.00 74 24.42
Total 2,665 100.00 303 100.00
Mean 666.25 75.75
S.D 747.23 87.67
Range 1,735.00 193.00
T-Test t-value=1.095 p-value=0.341 ns
* Significant at 0.05 level; ns Not significant

88
Investigation of Paddy Moisture Content in the
Granaries of Organic Farmers
Figure 6 shows moisture content of rice paddies using different field drying
techniques.
Spread field dry is the most common practice followed by bundle field dry. In
Natarm, which experienced sunny weather during harvest time, farmers opted for spread
field drying. In other areas where cloudy and rainy weather were experienced, farmers
combined various drying practices.
Figure 6. Moisture content of paddy in the granaries influences with different
field drying methods

89
To examine moisture content of fresh harvest, eighty (80) samples were taken
from farms in the study area with 48 samples of glutinous rice and 16 samples each of
non-glutinous and purplish-blue rice from village granaries. Results show that farmers
often had to deal with cloudy skies and/or rain showers during harvest time. While
NasaoNang, Nalard Namieng and NaHoiPang experienced mostly sunny weather during
harvest time, the lowest average MC was found in HaiTai despite rainy and cloudy
weather. The moisture content was even better than those in Natarn which experienced
sunny weather.
Figure 7 shows that the majority of farmers stored their paddy at moisture content
above 14%, too high for safe storage. The lowest average MC was found in HaiTai
despite the fact that this village had rainy and cloudy weather. The moisture content was
even better than those in Natarn which experienced sunny weather indicating that despite
less favourable weather HaiTai farmers put more effort on proper drying.
On the other hand, villages of Nalard and Namieng experienced occasional rain
during harvest time. Nalard achieved 13.9% MC through three days of field drying by
tilting panicle bundles by 30-45 degrees while Namieng reached 13.4% MC in seven
days of field drying while NaoHoiPang acieved 15.2% moisture content. The difference
of rice variety may account for the difference in the recovered grain moisture content.
Results showed that farmers failed to get optimum MC that could protect rice
harvest from potential storage problems like molds, insect damage and loss of viability.
However, farmers in the study area were dealing with protracted milling procedures and

90
therefore kept their rice paddies longer than three weeks. Although the ideal MC was
14% or less the MC of the grains collected in this study was above 14%.
Figure 7. Moisture content of paddy in the granaries
Results from the interviews also showed that storing grains at high moisture in the
granaries reduced grain MC until it reached equilibrium. However, this was a slow drying
process that took a lot of time since there was no forced convection of air inside the
granary, thus, grains were discolored. Farmers in Sangthong stored paddy at 17-21% MC
inside a granary from eight months to one year. It was found that a good-structured
granary reduced MC by up to 2% per month. As a result, grains lost their quality, were
discolored and were thus sold at a very cheap price.
14%MC

91
Effects of Availability of Family
Labor on Moisture Content
Tables 34 to 36 show the relationship of selective variables with moisture content
in the three varieties under investigation.
Results generally showed that there is no any relationships of MC in granaries and
family labor, farm size and field-drying practices using regression analysis where MC is
the predicting variable (dependent), and number of active labor, farm size (Ha) and
number of days in the field-drying days as independent variables.
Table 34. Regression analysis of relationship between labor, area, number of
days of field dying and drying methods on moisture content for
glutinous variety
VARIABLES b SIGNIFICANCE
Number of Labors -0.501 0.3204 ns
Area (ha) -0.004 0.9928 ns
Number days of field
drying
0.095 0.9160 ns
Drying methods -0.353 0.7136 ns
* significant; ns- not significant R2 = 11.23
F-value=0.35
The model of regression is as follows: ŶMC = 15.529 – 0.501 (Labor) – 0.004 (ha) + 0.095
(days of field drying) – 0.353 ( drying methods). The linear regression analysis showed
no significance at P<0.05. The variation of independent variables is explained by R-
square with a value of 11.23% which means that the 89.77% of the variation can be
explained by other factors such as time of harvest and climate.

92
Table 35. Regression analysis of relationship between labor, area, number
of days of field dying and drying methods on moisture content
for non -glutinous variety
VARIABLES
b
SIGNIFICANCE
Number of Labors -1.197 0.0239 *
Area (ha) -0.363 0.1983 ns
Number days of field drying -0.061 0.3038 ns
Drying methods -0.466 0.6212 ns
* significant; ns- not significant R2 = 50.49
F-value=2.80
The model of regression is as follows: ŶMC = 20.103 – 1.197 (Labor) – 0.363 (ha) - 0.061
(day) – 0.466 (kind of field drying). With 50.48% R-square value, we can say that the
number of active labor has significant effect on the MC with a p-value 0.0239 which is
less than 0.05 alpha. For every increase in the number of labor, there is a decrease on the
moisture content for non-glutinous variety.
The average moisture content for non-glutinous is 15.41%MC. However, during
harvest time, labor availability becomes a problem with farmers resorting to either
practicing exchange labor or hiring labor.
Table 36. Regression analysis of relationship between labor, area, number
of days of field dying and drying methods on moisture content
for purplish-blue rice
VARIABLES b SIGNIFICANCE
Number of Labors -0.159 0.5011 ns
Area (ha) -0.032 0.9178 ns
Number days of field drying -0.008 0.9598 ns
Drying methods -0.612 0.2158 ns
* significant; ns- not significant R2 = 4.17
F-value=0.51

93
The model of regression from the predictive variables is as follows: ŶMC = 16.929 – 0.159
(Labor) – 0.032 (ha) - 0.008 (days) – 0.612 (drying methods). . The linear regression
analysis showed no significance at P<0.05. The variation of independent variables is
explained by R-square with a value of 4.17% which means that the 95.83% of the
variation can be explained by other factors such as time of harvest and climate.
Examination on Three Different Paddy Drying
Practices and Grains Quality Milling
Test in Laboratory
Mechanical drying provides the means to control the drying process and therefore
ensures optimum quality. ProRice has provided flat bed dryers to two villages, Pialath
and Natiem. SomHong rice mill has also invested in a flat bed dryer. However, these
dryers are hardly used by the farmers either because the quality advantage is not clear to
them or because drying costs are too high. The following trials were conducted to
establish data on the quality of mechanically dried paddy compared the traditional drying
method for the three varieties under study.
Mechanical drying of paddy rice involved the use of a flatbed dryer, usually
composed of four major parts, namely: (1) the burner, which raises the drying air
temperature and lowers RH; (2) blower, which forces the air to induce positive pressure;
(3) plenum chamber, which evenly distributes air pressure, and; (4) drying bin, which
holds the paddy to be dried on a perforated metal sheet floor.
Flat bed dryer capacities range from 1-10 tons and a good flat bed dryer has the
following specifications. The drying air temperature can be controlled and should be

94
limited to 43ºC for seed drying and 45 ºC for commercial grain. The air velocity is
around 0.2m/s, lower air velocity leads to increase of drying time and unevenness of
drying, higher air velocity causes excessive energy consumption of the blower. The depth
of the grain bulk should be between 0.3-0.4m, shallower bed leads to lower capacity,
deeper beds to a high moisture gradient from the top to the bottom layer. Drying rate is
typically around 1% moisture removal per hour (IRRI, 2009) (Figure 8).
Figure 8. Principle of flat bed dryer in Sangthong organic rice farmer group.
Design of Flatbed Dryer in Pialath Village
The drying bin was made from 1mm thick perforated iron sheets with 4mm
diameter holes and a height of 0.74 m, 3.75 m length and 2.5 m width. At 0.3 m bulk
depth and considering a bulk density of paddy of 0.6 ton/m³ the drying bin therefore had
a capacity of 2.81 tons. The drying bin used in the experiment had side walls with
perforations, which is a design flaw since it allows the drying air to escape sideways. The
burner was made up of a charcoal stove inside a box that heated up the drying air

95
depending on the operation. Temperature was controlled through the feeding of coal. The
blower, which pushed the drying air to the plenum chamber, was made up of a backward-
curved fan driven by a 2.2kW motor. Unfortunately the blower was not matched to the
dryer and therefore it delivered less air then specified.
The flat bed dryer study was conducted in Pialath for convenience and due to the
presence of a group of farmers interested in the experiment. Flatbed dryers of similar
design were used in villages of Pialath and Natiem and by SomHong rice mill (GFMG2).
Evaluating Drying Methods in the Field
Three drying methods were used in the experiment, namely: mechanical drying
using a flat be dryer, sun drying as farmers practice and shade drying as the most gentle
drying treatment which results in the best quality as control treatment. Three varieties of
rice, HomSangthong glutinous-rice, HomSaVanh non-glutinous rice and purplish-blue
rice were compared. Each treatment was replicated three times.
An initial trial was conducted using paddy that farmers provided. However, the
moisture content of the paddy was below 17% because the farmers had field dried the
paddy. Since a lot of the quality deterioration happens during field drying at high
moisture content, mechanically drying after field drying would not lead to optimum
quality. To take full advantage of the dryer therefore farmers practices must be changed,
field drying abandoned and paddy dried immediately after harvest in the mechanical
dryer. The experimental design was changed accordingly and some farmers were
identified who were willing to provide freshly harvested paddy for the experiments. Since

96
it was already at the end of the harvest season only very little freshly harvested crop
could be obtained for each trial, which meant that the dryer could not be operated at full
load. Another limitation was that due to time limitations the control treatment “farmers
practice” sample was also sun dried immediately after harvest without field drying and
therefore not representing the real farmers practice and probably having better quality
farmers’ paddy.
Relying on the paddy farmers harvested according to their own harvesting
schedule also meant that the initial moisture contents were very different for the
individual trials. They ranged from extreme 36% for the Hom Sangom glutinous rice to
23% for the purplish-blue rice (Table 37).
In all trials the mechanical drying was done at an average temperature of 39°C
using an average drying air velocity of 0.2 m/s. Because of the limited paddy supply from
the farmers the bulk depth of the paddy subjected to drying was only 0.05 m meaning that
the dryer reached only 16.6% of it’s full capacity. With this low load drying rates of 1.2-
1.3%/h were reached (Table 35). It has to be expected that a fully-loaded bin would result
in a much lower drying rate because of higher resistance to the air flow and resulting
lower air flow rates. From the initial average MC of 23-36% depending on the trial, the
paddy was dried to below 14%, which was already considered safe for storage and
milling.
For every batch of mechanical drying treatment, 27 samples each weighing 250g,
were collected. For the sun drying treatment 10kg of rice paddy were spread in a plastic
mat at 1cm layer thickness and were subjected to the sun from 9 a.m. to 16 p.m. Ambient

97
temperatures ranged from 26-35°C, and ambient RH varied between 51-70%. At night,
the grains were stored in a room secured in a plastic bag. For the control treatment shade
drying, 1kg sample of grains were spread very thinly on a plastic sheet in the shade.
Shade drying is usually used as reference in research trials since compared of the other
drying methods it produces the best quality of dried paddy. Average ambient temperature
and RH for shade condition were 29°C and 56% respectively. Table 37 shows
comparative results of drying practices in Pialath village as determined in trials.
Results show that the mechanical drying rate for the HomSangthong-glutinous
rice variety was 1.3% per hour. This is because of the partial loading of the drying bin
which ensured good air flow despite the poor fan capacity. The drying time was very long
with 17 hours of drying time because of the extremely high initial MC of 36%. The
optimum maturity MC of paddy during harvest should be around 20-24%. Purplish-blue
rice and the non-glutinous rice, on the other hand, were harvested at optimum MC, drying
rate was 1.2%/h for both varieties because there was less easy to removed surface water
than in the first trial.
The results for sun-drying showed that the grains were dried at an average drying
time of 17-22 hours. The drying time varied because of the difference in initial MC from
harvesting and the different weather conditions. However, the drying cost of sun drying
was relatively low and the quality of grains recovered in the first trial was better than that
from mechanical method of drying.
For shade drying storage MC, less than 14%, was obtained after 49-68 hours due
to the gentle slow drying at ambient air temperature.

98
Table 37. Experimental results of comparative drying practices in Pialath village.
TREATMENT PARAMETER MECHANICAL
DRYING
SUN
DRYING
MC>14%
AIR DRYING
IN THE
SHADE
HomSangthong Glutinous rice
Initial weight (kg) 336 10 1
Final weight (kg) 236 8 0.8
Initial MC% 36 36 36
Final MC% 13.2 12.8 13.3
Water removal from grain (kg) 100 2 0.2
Moisture reduction (%) 22.8 23.2 22.7
Drying time (hour) 17 16 49
Drying rate (%/h) 1.3 1.4 0.5
Ambient air temperature (°C) 35 35 33
Drying air temperature (°C) 41.7 - -
HomSaVanh Non-glutinous rice
Initial weight (kg) 197 10 1
Final weight (kg) 164 7 0.8
Initial MC% 26.8 26.8 26.8
Final MC% 13.6 13.2 13.8
Water removal from grain (kg) 33 3 0.2
Moisture reduction (%) 13.2 13.6 13
Drying time (hour) 10.5 19 52
Drying rate (%/h) 1.2 0.7 0.2
Ambient air temperature (°C) 30 33 30
Drying air temperature (°C) 37.3 - -
Purplish-blue rice
Initial weight (kg) 192 10 1
Final weight (kg) 170 8.5 0.9
Initial MC% 23 23 23
Final MC% 13.7 12.3 13.4
Water removal from grain (kg) 22 1.5 0.1
Moisture reduction (%) 9.3 10.7 9.6
Drying time (hour) 8 22 68
Drying rate (%/h) 1.2 0.5 0.1
Ambient air temperature (°C) 24 26 25
Drying air temperature (°C) 41.0 - -
Effect of the Drying Method on Quality
for the Three Varieties
The milling recovery, head rice recovery, amount of broken grains, and
discoloration for each variety were determined after subjecting each variety to the three

99
drying methods. The milling degree of the laboratory analysis is equivalent with the
percentage of rice bran removed.
Glutinous rice. Figure 9 showed the post-harvest quality of glutinous rice
subjected to the three types of drying methods. Milling recovery was close to the
potential with slight variations between the drying methods (63.8-64.7%) mainly due to
the varying milling degree of the samples.
As can be seen in Figure 9, mechanical drying produced the lowest head rice yield
of all three drying methods. The reason for this could not be established due to the
limited number of replications. Ambient air temperatures of 35ºC and a drying rate of
1.5%/h indicate that it was a very hot day which might have led to extreme high grain
temperatures in the sun drying treatment. At very high temperatures partial gelatinization
or other changes might occur inside the grain leading to changes in the starch body of the
grain making it more resistant to breakage. This needs to be verified in additional
experiments.

100
Figure 9. Results of physical quality test of glutinous rice
Non-glutinous rice. Figure 10 shows the post-harvest quality non-glutinous rice
from the three types of drying methods. Milling degree of the samples ranged from
11.9% for shade drying to 13.2% for mechanical drying influencing the milling recovery
significantly.
Results showed that shade drying recovered more head rice at 48.6%, followed by
mechanical drying at 45.9% and sun drying at 44.8%.

101
Figure 10. Results of physical quality test of non-glutinous rice
Purplish blue (Black rice). Figure 11 shows the post-harvest quality of black rice
from the three types of drying methods. The milling recovery ranging from 73.9% from
mechanical drying to 74% fir shade drying and therefore was significantly higher than for
the two other varieties basically because in black rice less bran is removed in the milling
process, the milling degree ranged from 3.4% for the dun dried sample to 3.9% for the
mechanically dried sample.
Results showed that shade drying produced most head rice at 60.19% followed by
mechanical drying at 55.65% and sun drying which produced only 38.97% head rice.
It can concluded that for all varieties, shade drying, is the most effective drying
method that produced highest head rice with the exception of glutinous rice. Sun drying
was the least effective. Shade drying, however, would be difficult to adopt since it

102
requires a large amount of paddy and needs a large shaded area which would in turn
require a costly infrastructure investment.
Figure 11. Results of physical quality test of purplish-blue rice
Effect of the Variety on Quality for
the Three Drying Treatments
Analysis of Variance (ANOVA) was used to investigate tendency of three
different rice varieties and determine if paddy drying practices affect percent of milling
and head rice recovery across the different types of rice.
ANOVA (Table 38) shows highly significant relationship for all variables. Three
types of varieties, different treatments, and varieties versus drying treatment are
significant and affected percent of head rice recovery. This can be explained by the fact

103
that rice is more sensitive to milling process as evidenced by varying post harvest
management practices.
Table 38. The ANOVA table for quality
SOURCES OF VARIATION HEAD RICE RECOVERY
F value Pr>F
Varieties 20.83 <.0001*
Treatments 95.8 <.0001*
Varieties*Treatments 35.64 <.0001*
* Significant; ns Non-significant
Effect of the Variety on Quality
for the Three Drying Treatments
Getting insight of the varieties on quality for the drying treatments can be
observed by comparing three types of varieties. For mechanical drying treatment, percent
of milling recovery of glutinous and non-glutinous rice is normal (not significant) but
purplish-blue rice shows greatest significance compared to sun and shade drying
treatments. Farmers may have taken time to properly harvest purplish-blue rice unlike
glutinous and non-glutinous rice which may have been harvested when panicles were not
fully mature or occasional rain occurred. Table 39 below shows the details of the effect of
drying treatments on the grain quality.
The milling degree of the purplish blue rice was a lot higher for purplish blue rice
than for the other two varieties since it is undermilled to maintain its color.

104
Table 39: Milling recovery and head rice recovery results
RICE VARIETY
MILLING RECOVERY (%) HEAD RICE RECOVERY (%)
Mechanical
drying Sun drying
Shade
drying
Mechanical
drying Sun drying
Shade
drying
Glutinous rice 64.71 a 65.2 a 63.82 a 43.34 a 46.46 a 49.98 a Non-glutinous
rice 64.41 a 64.97 a 65.28 a 45.94 a 44.85 a 48.6 a
Purplish-blue rice 73.87 b 73.91 b 73.95 b 55.65 b 38.97 b 60.19 b Note: Means with the same letters are significantly the same.
Mechanical drying treatment. The milling recoveries of glutinous and non-
glutinous rice were not significantly different for mechanical drying. In shade drying,
non-glutinous rice had 2.2% higher milling recovery. Head rice recovery was 2.6%
higher for non glutinous rice compared to glutinous rice. Highest head rice recovery was
observed in purplish blue rice with 60.2%. This is mainly due to the gentle milling
process used for the undermilled purplish blue rice and with the limited data, cannot be
attributed to drying.
Generally it can be concluded that a significant effect of the variety on milling
recovery and head rice recovery could not be established as major differences in the data
were due to a different milling process.
Sun drying treatment. The milling recovery data for sun drying is similar; there
is no significant difference for glutinous and non-glutinous rice. On the other hand head
rice recovery was 1.6% higher for glutinous rice. For purplish blue rice, the head rice
recovery was significantly lower, indicating that the kernels of this variety might respond
crack very easily in uncontrolled drying conditions.

105
Shade drying treatment. Shade drying produced the highest milling recovery in
purplish blue rice but this was mainly due to the undermilling of the variety. Non
glutinous rice had 1.5% higher milling recovery than glutinous rice. On the other hand
glutinous rice had higher 1.4% higher head rice than non-glutinous rice. Head rice of
purplish blue rice was highest with 60.2%. This is caused by varietal properties since
shade drying is the gentlest drying process. The purplish-blue rice produced highest
recovery with 60.19%, while glutinous rice only with 49.98% and non-glutinous rice with
48.60%.
Contrary to the expectations, the increases in head rice recovery from mechanical
drying were minimal. This was due to the fact that the conditions for sun drying were
good during the time when the experiments were conducted. There was no delay in
drying caused by rain. Additional experiments to compare the mechanical drying
immediately after harvest with actual farmers’ practice which consists of several days of
field drying followed by threshing and then sun drying can be done to get a better picture.
Based on the results above and the data in Table 37 the following conclusions can
be drawn:
1.) Milling recovery was affected minimally by the drying process
2.) Head rice recovery was affected by the drying process. Shade drying produced
better head rice recovery than sun and mechanical drying for all three varieties.
3.) The varietal effect was minimal in all three drying treatments for glutinous rice
and non-glutinous rice. Purplish blue rice could not be directly compared since it

106
was undermilled and differences therefore are due to the different milling
procedure.
4.) Purplish blue rice had the biggest head rice reduction in sun drying and also in
mechanical drying compared to the control shade drying. The variety seems to be
very responsive to uncontrolled drying conditions.
Cost of Using Flatbed Dryer
One reason why users don’t use dryers is high cost and the use of flatbed dryers
requires a high capital investment. Although it has a relatively low labor cost, the
operation costs components like electricity and fuel, are ever increasing. Some farmers
address to this problem by using alternative fuels such as fuel wood, rice straw and rice
hull. Table 40 shows the operating expense related to the use of flat bed dryers.
The following assumptions were used for the economic analysis:
Number of batches dried per year: 23
Linear depreciation over 10 years with no rest value.
Under normal drying conditions, sun drying with a drying cost of 104 LKIP/kg
was found to be the cheapest method to dry rice grains. However, in wet season (rainy,
flooded, foggy or cloudy weathers), despite the cost, it is more practical to use
mechanical dryers especially in Natiem and Pialth where such facility is readily available.
To convince farmers to use the dryer to produce consistently good quality organic
rice, there must be a quality incentive in the price of paddy that not only provides a better
price but also pays for the cost of mechanical drying plus other additional costs e.g. for

107
the transport to and from the dryer. As a minimum requirement, there needs to be a
pricing scheme based on moisture content.
Table 40. Estimated operating expenses per batch of 208 Kg
DETAILS OF THE OPERATION FIXED COST EXPENSES
Drying time 0 11 hours
Labor Cost (pay for an eight hour work is 25,000 LKIP) 0 34,375 LKIP
Energy cost:
- Electricity consumption = 3 kWh (573 LKIP/kWh)
- Fuel consumption (Charcoal) = 20 kg
0
0
1,719 LKIP
20,000 LKIP
Depreciation:
- Cost of the dryer (including installation)
- anticipated years in use
- Annual depreciation
- Depreciation charge per season
- Depreciation cost per batch
20,000,000 LKIP
10 years
2,000,000 LKIP
1,000,000 LKIP
43,478 LKIP
Maintenance overhead:
- 10% of machine cost per annum
- Divided by number of batches per season:
1,000,000 LKIP
23 batches
43,478 LKIP
Total cost of drying per batch of 208 kg of paddy 21,739 LKIP
Cost of drying per 1 kg 104 LKIP
Drying service charged for farmer per 1 kg
104 LKIP
Development of a Market Based Price Incentive Scheme
for Inclusion in Extension Campaigns to
Encourage Better Post Harvest
Practices
In 2000 Lao PDR attained rice self-sufficiency at the national level for the first time
during the past two decades. Increasing rice production to maintain self-sufficiency and to
generate an exportable surplus is one of the eight priority programs in Lao PDR. Ideally, the
organic food price is typically at least 20 % higher price than conventional food price.
The best way to improve the organic quality paddy is to give organic certified
farmers a price incentive to dry paddy in time and properly reduce moisture content to

108
14% or less. The best way to do this is to introduce a farm gate price that gives farmers
incentives for producing and selling better quality paddy.
Volatility of Paddy Price in Sangthong Province
Access to rice market is the single most important factor determining the welfare
status of organic rice farmers. The Sangthong farmers have been involved in a conversion
process from subsistence-oriented to market-oriented production since rice self-
sufficiency was reached in 2000. The survey conducted in this study established that
organic rice is primarily produced by smallholder households that have an average farm
size of less than 2 ha with 62% of the rice produce sold. Figure 12 shows the paddy
prices for glutinous, non-glutinous and black rice from 2008-2010 based village
marketers’ book keeping and validated with SomPhone rice mill.
Farmers stored paddy in granaries and sold paddy rice gradually when in need for
cash. Study results showed that prices were higher from July to October which is
production season when rice in granaries was almost empty. Also, it was noted that the
prices were stable and low during the six months from January till June because of new
harvest of upland rice in October and rainfed rice in November to December. In addition
the irrigated rice was harvested in April. These varieties were produced for selling rather
than for home consumption and competed at the market. The competition drove prices of
paddy down. Figure 12. A and C also shows that non-glutinous rice price was steep at
5,000 LKIP (US$ 0.6) per 1 kg because Vietnam traders interfered with purchasing
system since they had international markets that gave higher price than Laos traders.
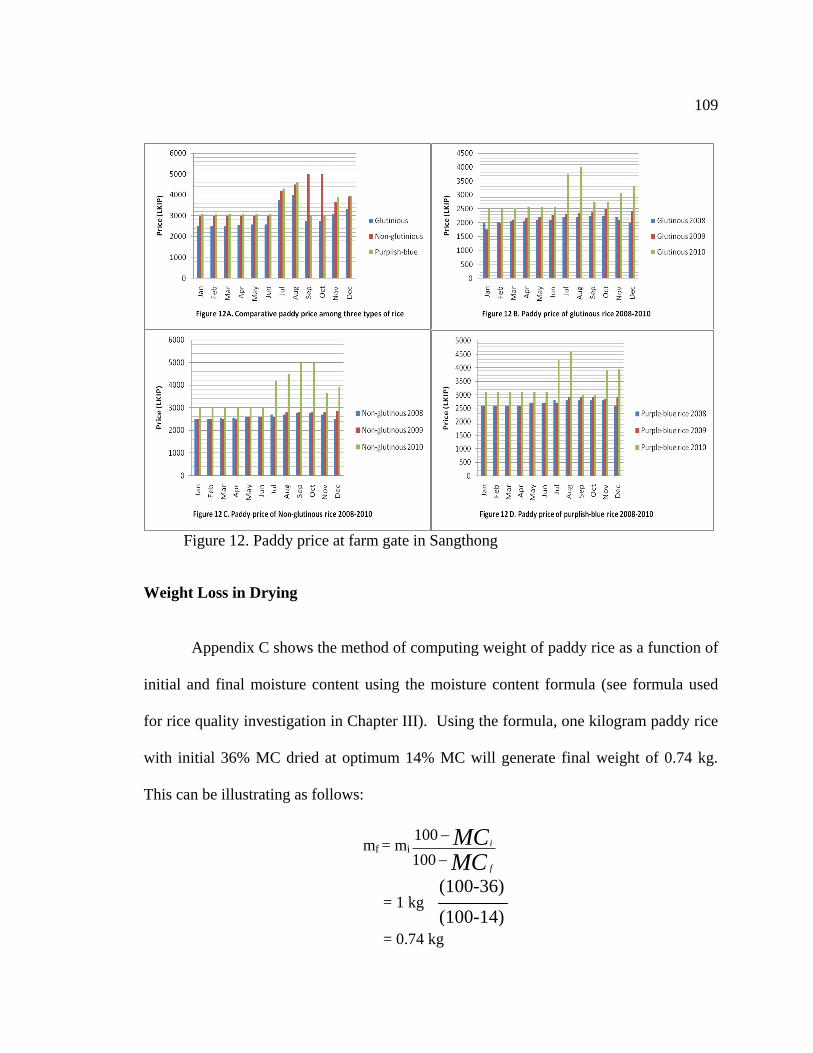
109
Figure 12. Paddy price at farm gate in Sangthong
Weight Loss in Drying
Appendix C shows the method of computing weight of paddy rice as a function of
initial and final moisture content using the moisture content formula (see formula used
for rice quality investigation in Chapter III). Using the formula, one kilogram paddy rice
with initial 36% MC dried at optimum 14% MC will generate final weight of 0.74 kg.
This can be illustrating as follows:
mf = mi
MCMC
f
i
100
100
= 1 kg
= 0.74 kg
(100-36)
(100-14)
110
The initial and final moisture content data was generated from the 80 sampled
granaries plus drying experiment in the field. The data is used to develop the quality
payment scheme.
Farmers Practice
Yield is the variable most noticed by farmers but when the product reaches the
market, quality becomes more crucial. Thus, organic rice actors (farmers, millers,
processors, etc) must be taught to meet quality requirement of advanced markets rather
than produce large quantities.
The survey showed that Sangthong farmers dry paddy at 17 – 21 % MC and
stored them at granaries above 21%MC. Farmers re-dried wet paddies using sun drying
on plastic mats. However, it took a long time to reach the 14% optimum MC.. In addition
to providing a price incentive based on moisture content, speeding up the drying for safe
storage without deterioration until the paddy is sold also needs to be given attention to
improve quality of rice price in the future.
In the case of Sangthong organic farmers, most buyers (GFMG, SFSE, LFP,)
check moisture content of paddy. If it is 17% or lower, they decide to buy from farmers
and re-dry the grains. If it is more than 17%, traders reject it, forcing farmers to re-dry the
rice. But even if moisture content is at optimum of 14% or better, prices were determined
without considering gradient percentage of MC. This means that at the current pricing
scheme, producers lose more money when they further dried the paddy. This also

111
affected the quality of the grains since it kept paddies longer at higher moisture content
then necessary.
In addition, prices should be set with compensation for weight loss during drying
activities to encourage farmers to maintain grain quality.
Grain Quality Payment Scheme
Based on MC Analysis
Based on the survey results, the loss in value was calculated for the three varieties
that were also used in the drying trials. Table 41 shows prices and weight calculation of
rice paddies of glutinous rice.
Table 41. Calculating weight and price as a function of moisture content (case of
HomSangthong glutinous rice)
MOISTURE CONTENT 17% 16% 15% 14% 13% 12% 11%
Paddy weight after drying (basis 1 Kg
at 17%) 1 0.99 0.98 0.97 0.95 0.94 0.93
Price should be paid (LKIP/kg) 2,500 2,525 2,551 2,577 2,631 2,659 2,688
Farm gate price (LKIP) 2,500 2,500 2,500 2,500 2,500 2,500 2,500
Price loss (LKIP) 0 25 51 77 131 159 188
Note: Farmers do not only loose by selling less weight but also by paying more or spending more time on
drying. An additional incentive should cover that additional cost component.
The first row of Table 41 shows the computed final weight using Appendix C.
The table above shows the price loss of farmers given improvements in moisture content
level which can yield increased paddy weight. Using the 17% standard requirement of
the millers and using the current farm gate price of 2,500, improvement in the moisture
content could lead to additional weight gain which should lead to additional farm gate
price. Using the calculation in Appendix C for final paddy weight, with a moisture

112
content of 14%, farmers should be paid justly at LKIP 2577/kg. However, given the lack
of current incentive scheme, farmers lose LKIP77 at optimum MC of 14%. This
therefore serves as a disincentive for farmers since they do not see any additional value
for improving quality.
For non-glutinous and black rice, Table 42 shows prices and weight calculation.
Since both varieties have the same farm gate prices, the table below summarized price as
a function of moisture content for both.
Similar to glutinous rice, weight loss during drying should be considered in
determining price in order to motivate improvement of quality of paddy. At optimum
moisture content of 14%, farmers should be paid LKIP86/kg.
Table 42. Calculating weight and price move as a function of moisture content (case of
HomSavanh non-glutinous and purplish-blue rice)
MOISTURE CONTENT 17% 16% 15% 14% 13% 12% 11%
Paddy weight after drying (basis 1 Kg
at 17%) 1 0.99 0.98 0.97 0.95 0.94 0.93
Price should be paid (LKIP/kg) 2,800 2,828 2,857 2,886 2,947 2,978 3,010
Farm gate price (LKIP) 2,800 2,800 2,800 2,800 2,800 2,800 2,800
Current loss (LKIP) 00 28 57 86 147 178 210
Proposed Paddy Pricing Scheme
Based on Moisture Content
Pushing stakeholders pay attention on quality and it will return benefit to them. In
order to develop ownership over the rice commodity chain, the moisture content based
pricing scheme (Table 43) should be introduced for both farmer and trader. This policy is

113
centered on equally shared interests and mutual growth for long term-developing chain
partners.
To be unbiased among stakeholders, base price is set at 14%MC as a control.
Whoever can produce below 14%, price incentive should be given to the farmers by the
wh . On the other hand, when MC higher than 14%, they have to pay less if they require
the farmers to re-dry the paddy rice. This will compensate farmers for the loss in weight
during drying and therefore provide an incentive to dry properly.
Table 43. Moisture content based pricing scheme
MOISTURE CONTENT
(basis 1 Kg at 14%MC) 18% 17% 16% 15% 14% 13% 12% 11%
Paddy weight after field drying
1.04 1.03 1.02 1.01 1 0.99 0.98 0.97
Glutinous rice
Price should be paid (LKIP/kg) 2,403 2,427 2,450 2,475 2,500 2,525 2,551 2,577
Farm gate price (LKIP) 2,500 2,500 2,500 2,500 2,500 2,500 2,500 2,500
Current gain and loss (LKIP) -97 -73 -50 -25 0 25 51 77
Non-glutinous rice
Price should be paid (LKIP/kg) 2,692 2,718 2,745 2,772 2,800 2,828 2,857 2,886
Farm gate price (LKIP) 2,800 2,800 2,800 2,800 2,800 2,800 2,800 2,800
Current gain and loss (LKIP) -108 -82 -55 -28 0 28 57 86
Break-even Computation of Prices
Determination of break-even prices consisted of two parts. The computation of
Total Cost (TC) and Total Revenue or total sales (TR) and the computation of TC =
Cost of buying paddy rice from farmers + Transport cost + Milling cost and TR = Head
rice sale + Half grain sale + Large broken + Small broken + Bran.

114
The costs were computed using data from Table 44. The weight lost cost is taken
from APPENDIX C at 17% MC; the current standard adhered to by millers. The
transport cost is actual cost of for purchased paddy in Sangthong within 55 km. But
milling cost is different between SFSE and GFMG2 which is why there are two
computations presented. Actual milling fee is 300 LKIP/kg but if they leave broken rice
and rice bran, milling fee is reduced to 100 LKIP/kg.
The items under revenue represents what the millers get from paddy rice as
computed from percentages of milling quality presented in Table 29. The prices for the
head, broken rice and rice bran are actual selling prices. The quantity refers to actual
purchases as presented in Table 32.
Tables 44 shows break even computation using glutinous milled rice at domestic
markets by SFSE and GFMG2.
For SFSE, it is estimated that around 49,919 kg was lost but was compensated by
milling recovery percentage and as such is not imputed in the total cost. In the case of
SFSE which does not have small broken rice and rice bran as it is used to pay in part for
milling charges to Somphone ricemill. Based on the above, the cost-revenue ratio was
1.11 for SFSE and 1.12 for GFMG2, which means to say that for every 100 LKIP
(US$ 0.12) invested it will generate a gross profit of 11 LKIP and 12 LKIP for SFSE and
GFMG respectively.

115
Table 44. Break even analysis using purchased paddy and computed revenue for
glutinous rice
DETAILED ITEMS
SFSE GFMG2
Unit
price
(LKIP/K
g)
Quantity
(Kg)
Total
(LKIP)
Unit
price
(LKIP/K
g)
Quantity
(Kg)
Total
(LKIP)
1. Cost ( C)
Purchased paddy cost 2,500 1,431,000 3,577,500,000 2,500 644,000 1,610,000,000
Weight lost cost 300 49,919 300 22,465
Transport cost 100 1,431,000 143,100,000 100 644,000 64,400,000
Milling cost 100 1,381,081 138,108,100 300 621,535 186,460,500
Total cost ( TC ) 3,858,708,100 1,860,860,500
2. Revenue ( R )
Head rice (40%) 5,800 552,432 3,204,105,600 5,800 248,614 1,441,961,200
Large broken (16%) 5,000 220,973 1,104,865,000 5,000 99,446 497,230,000
Small broken (4%) 3,000 5,524 3,000 24,861 74,583,000
Bran (8%) 1,500 110,486 1,500 49,723 74,584,500
Total revenue( TR ) 4,308,970,600 2,088,358,700
3. Profit = ( R ) - ( C ) 450,262,500 227,498,200
4. Cost-revenue ratio = TC/TR 1.11668737 1.122254301
5. Break-even paddy price at farm gate 2,814.648847 2,853.258075
Given the break-even price of 2,814 LKIP for SFSE at 17% MC, traders will
loose money if he pays farmers higher than this price. Given also that they pay only
2,500 LKIP at 17% MC, it means that traders can actually pay farmers higher and still
earn more. At 14% MC, Table 41 shows that at MC 14%, traders need to pay farmers
only 2,577 LKIP, still below the computed break-even price.

116
Given the break-even price of 3,779 LKIP at 17% MC for GFMG, traders will loose
money if he pays farmers higher than this price. Given also that they pay only 2,800 LKIP at
17% MC, it means that traders can actually pay farmers higher and still earn more. At 14%
MC, Table 45 shows that at MC 14%, traders need to pay farmers only 2,886 LKIP, way
below the computed break-even price.
Glutinous rice, non-glutinous and purplish-blue rice were sold at premium prices
in European market but domestic market cannot 500 LKIP (US$ 0.06) per 1 kg of price
incentive because they will loose money. Overseas, buyers could buy for as much as
3,741 LKIP (US$ 0.45) per 1 kg and 3,779 LKIP (US$ 0.46) per 1 kg at 17% of MC,
which makes export market profitable for millers.
Table 45. Non-glutinous milled rice sold within domestic markets
DETAILED ITEMS SFSE GFMG2
Unit price
(LKIP/Kg)
Quantity
(Kg)
Total
(LKIP)
Unit price
(LKIP/Kg)
Quantity
(Kg)
Total
(LKIP)
1. Cost ( C )
Purchased paddy cost 2,800 531,000 1,486,800,000 2,800 352,000 985,600,000
Weight lost cost 300 18,523 300 12,279
Transport cost 100 531,000 53,100,000 100 352,000 35,200,000
Milling cost 100 512,477 51,247,700 100 339,721 101,916,300
Total cost ( TC ) 1,591,147,700 1,122,716,300
2. Revenue ( R )
Head rice (40%) 7,800 204,991 1,598,929,800 7,800 135,888 1,059,926,400
Large broken (16%) 6,000 81,996 491,976,000 6,000 54,355 326,130,000
Small broken (4%) 3,000 20,499 3,000 13,589 40,767,000
Bran (8%) 1,500 40,998 1,500 27,178 40,767,000
Total revenue( TR ) 2,090,905,800 1,467,590,400
3. Profit = ( R ) - ( C ) 499,758,100 344,874,100
4. Cost-revenue ratio = TC/TR 1.314086555 1.307178314
5. Break-even paddy price at farm gate 3,741.16403 3,779.755966

117
In some villages, farmers produced rice with 14%-13% MC based on granary
survey. Theoretically, if farmers are given incentive for better quality and rice is exported,
both farmers and millers will earn more. .
Analysis of Milled Rice Exported
and Sold to Foreign Markets
The data below was taken from survey conducted with rice exporters. A limited
quantity of Lao rice was exported to foreign markets in the past years. For Lao rice to get
an edge in a competitive international rice market, the niche markets should be
considered. Markets for organically grown rice or high-quality purplish-blue rice must be
improved because it is the only variety with competitive potentials in the international
market.
For instance, Somhong exported 4 to 7 tons of purplish-blue rice to CLARO-fair
trade in Switzerland between 2008 and 2009. Two other containers (approximately 19.5
tons per each container) of organic milled rice were also brought by Well-Being Trade
Company (WBT) in Italy in 2009. As trade negotiations were made, 50 containers per
year of Laos-organic rice were ordered by WBT but unfortunately, Lao organic farmers
were capable of producing only two containers. However, in 2010, they were not able to
renew these market linkages.
Table 46 shows sales of Lao organic rice in international markets.

118
Table 46. Details of exportation for SomHong, Genoa, Italy, 2010
DESCRIPTION QUANTITY
(Ton)
UNIT PRICE
(US$/Ton)
AMOUNT
(US$)
Export
Organic glutinous rice, HomSangthong 19.5 512.52 9,994.11
Organic non-glutinous rice, HomSaVanh 19.5 512.52 9,994.11
Total 512.52 19,988.22
Export service charge/FOB
Documentation 39 32.06 1,250.17
Shipping (VTE-GENOA) 39 128.29 5,003.35
Insurance 39 1.94 75.49
Total 162.29 6,329.01
Miscellaneous requirement
Miller’s organic certification - GFMG 2,383.81
Farmer’s organic certification - 10 villages 3,339.98
CO2 fumigation 39 77.19 3,010.22
Total 8,734.00
Price per kg is 0.51 US$ (4,253.90 LKIP)
Note: 1 US$ = 8,300 LKIP
It must be noted that foreign buyers paid for organic certification of rice mills and
farmers and the GFMG conducted CO2 fumigation as a requirement of product
pasteurization before sending the products to other countries.
Table 47 shows SFSE export transactions of organic rice.

119
Table 47. Details of exportation for SFSE, Vietnam, 2010
DESCRIPTION QUANTITY
(Ton)
UNIT PRICE
(US$/Ton)
AMOUNT
(US$)
Export
Conventional glutinous rice 55 624.00 34,320.00
Conventional non-glutinous rice 35 747.00 26,145.00
Total 685.5 60,465.00
Shipping cost
Documentation 90 7.63 687.00
Logistic (Vietnam border) 90 24.22 2,180.00
Insurance 90 0.63 57.00
Total 32.48 2,924.00
Price per kg is 0.67 US$ (5,576.22 LKIP)
Note: 1 US$ = 8,300 LKIP
The SFSE bought organic paddy from Sangthong farmers and milled the paddy at
SomePhone rice mill but sold these as conventional milled rice to Vietnam. In such cases,
premium price cannot be set. However, it must be noted that prices paid by Vietnam
buyers are higher than Genoa, Italy. Incidentally, Vietnam bought these volumes of
glutinous rice in anticipation of New Year festivities in February and not for potential
export to European counties. The price of rice was approximately 5,576 LKIP (US$ 0.67)
per each kilogram of milled rice. As a result SFSE made more profit compared to
Somhong.
Table 48 shows LFP shipping transactions of organic rice.

120
Table 48. Details of exportation cost for LFP, European market
DESCRIPTION QUANTITY
(Ton)
UNIT
PRICE
(US$/Ton)
AMOUNT
(US$)
Product Cost
Glutinous+Non-glutinous rice, French 36 2,300.00 82,800.00
Glutinous+Non-glutinous rice, Belgium 18 2,300.00 41,400.00
Glutinous+Non-glutinous rice, Switzerland 5 2,300.00 11,500.00
Glutinous+Non-glutinous rice, Germany 15 2,300.00 34,500.00
Total 2,300.00 170,200.00
Export service charge/FOB
Documentation 74 32.05 2,371.89
Shipping (VTE-BKK-host countries) 74 128.28 9,492.85
Insurance 74 1.93 143.03
Total 162.26 12,007.77
Miscellaneous requirement
Processor’s organic certification LFP 1,300 1,721.64
SomPhone Miller’s organic certification GFMG 1,300 1,721.64
Farmer’s organic certification 10 villages 2,522 3,339.98
50°C heat-pasteurization 74 2,273 3,010.22
Total 9,793.47
Price per kg is 2.30 US$ (19,090 LKIP)
Note: 1 US$ = 8,300 LKIP
Lao Farmer Product (LFP) has longer experience in exportation and hence, has
more market linkages. LFP also was able to get better price per kg for organic rice
compared to both Somhong and SFSE. The negotiated price is almost four times the
price received by SFSE and almost five times that of Somhong. As a result, LFP was able
to generate more income.
Given the export market data, an analysis of cost and returns per kilogram was
made to come up with an estimation of projected cost and returns per kilogram using an
incentive of 500 LKIP, a premium price incentive that stakeholders agreed during the

121
meeting conducted in 2007 when PROFIL started. This premium price incentive is
currently subsidized by PROFIL and given directly to the farmers.
Table 49 shows the average calculated cost and return analysis of the three
organic export rice varieties.
Table 49. Calculation of actual cost and return analysis for traders (SOMHONG, SFSE,
and LFP)
CALCULATION OF PROFIT
UNIT PRICE
(LKIP/Kg)
SOMHONG SFSE LFP
1 PRICE FOR EXPORT ORGANIC RICE (REVENUE) 4,253.90 5,576.22 19,090.00
COST
PADDY PURCHASE COSTS FROM FARM GATE 2,750.00 2,750.00 2,750.00
2 Paddy price with moisture content between 17% - 13% 2,650.00 2,650.00 2,650.00 3Transport costs, materials 100 100 100 4
FREE ON BOARD-FOB/SHIPPING COST 1,346.94 269.66 2,555.50
Export margin, Documentation service charge 266.06 63.36 504.79
Insurance, export handling, etc. 16.07 5.26 30.44
Transport cost to harbor or border 1,064.81 201.04 2,020.27
TOTAL COST 4,096.94 3,019.66 5,305.50
NET PROFIT 156.96 2,556.56 13,784.50 1actual export price presented in Table; 2computed price based on survey; 3 actual cost based on survey; 4
actual cost based on export document.
Based on the above, all three exporters earned modest profit per kilogram, with
LFP earning the most profit. This can be attributed to the higher export price received
from established export markets.
In Table 50 shows adding up the 500 LKIP per kilogram premium price incentive
given as subsidy by PROFIL, it appears that SomHong will not be able to afford it.
However, SFSE and LFP can both afford to give the premium price incentive. At the

122
current export price of 4,2523.90 LKIP per kilogram, a premium price incentive cannot
be given to farmers as traders will loose money.
Table 50. Calculation of projected cost and return analysis for traders (SOMHONG,
SFSE, and LFP)
COST AND RETURN UNIT PRICE (LKIP/Kg)
SOMHONG SFSE LFP
1 PRICE FOR EXPORT ORGANIC RICE (REVENUE) 4,253.90 5,576.22 19,090.00
COST
PROJECTED PADDY PURCHASE COSTS FROM FARM GATE 3,250.00 3,250.00 3,250.00
2 Paddy price with moisture content between 17% - 13% 2,650 2,650 2,650
3 Proposed Premium price 500 500 500
4 Transport costs, materials 100 100 100
5 Free On Board-FOB/Shipping cost(2) 1,346.94 269.66 2,555.50
TOTAL COST 4,596.94 3,519.66 5,805.50
NET PROFIT = -343.04 2,056.56 13,284.50 1actual export price presented in Table; 2computed price based on survey; 3 stakeholder agreed premium
price based on consultation; 4 actual cost based on survey; 5 actual cost based on export document.
Proposed Extension Campaign Model
An extension campaign is key for convincing traders to pay a price incentive not
only because they gain good quality of paddy but also better quality of milled rice. These
benefits can fetch premium price in the organic market with US$ 2.3 per kg or equivalent
19,090 LKIP (100%) additional if importers are aware of this. The premium price can
also redound to the farmers who should be encouraged to practice good farming and
harvesting techniques. Based on the results, at least US$ 0.45 per kg or equivalent
3,760.82 LKIP (19%) of the profit should be equally shared to farmers and US$ 0.012 per
kg or equivalent 100 LKIP (0.5%) should go to farmer organization.

123
The extension campaign should target all stakeholders who have to ensure good
practices to benefit from getting premium prices. Figure 13 shows the extension
campaign model guided by the philosophy of participatory approach and supply chain
analysis:
Figure.13 Proposed extension campaign model
Model. This proposed extension campaign model believes that joint assessment,
planning, forging of agreement, implementation, sharing of learning and evaluation
empowers farmers by ensuring that they exercise their right to plan and decide for
themselves. While the intention is for the farmers to be paid according to the quality of

124
the output, at the heart of the extension campaign is the thrust to develop the capabilities
of the farmers to be able to work together, link with relevant stakeholders and ensure
improvements in their quality of lives.
Participatory rural appraisal analysis. Understanding the situation in the organic
supply chain requires joint assessment by both researchers and farmers on issues related
to production of quality rice. Research team consists of multi-discipline such as post
harvest expert from Department of Agriculture (DoA), Agro-processing and marketing
expert from Department of Production Promotion and Export (DPE), value chain expert
from Ministry of Commerce (MoC) and farmer organization and agricultural extension
expert from National Agriculture and Forestry Extension Service (NAFES) and farmer
leaders. To achieve the goal, experts will act as team leaders in their own field discipline.
This team of experts will lead in the assessment of the situation in the organic supply
chain by investigating issues on actors, technical capabilities, organizational situations
and socio-environmental situations.
Participatory planning. Active participation in the planning process by different
stakeholders ensures that various perspectives are taken into account. At this point,
common problems in relation to failures in the in the supply chain will be jointly
identified and prioritized. In this stage, actors will be identified according to experiences
and capabilities to lead in the programs and activities that may have potential solutions to
identified problems.

125
Forging of agreement. A crucial stage in any undertaking, this phase mandates
groups of experts, organizations to lay down the details of project plans, policies,
regulations, and make sure that these will be implemented. These groups of experts may
or may have been part of the planning phase which is why representations, networking
and linkaging are considered important activities for this stage. Traders, millers and
processors will likewise be contacted for involvement in pilot projects. At this point, it is a
must that a rice importer has been identified that will participate in the pilot project that will
sell good quality organic product in an export market which has already been initially
contacted.
Participatory implementation. Given that there will be issues identified with
regards to skills; one of the programs that will be implemented will be capability building.
Initially, it is perceived that capability building will revolve around three areas: soft skills
like leadership, facilitation, teambuilding, community organization, technical skills
related to production and post production, and rice processing and entrepreneurial skills
which will make use of rice discards like rice bran to be processed into products such as
cooking oils, soap and wine. Given that technical production skills will be identified,
farmer experimentation will be conducted in cooperation with farmers according to
groups of five to ten.
The importance of quality rice should be a major area of campaign in order to
penetrate a wider organic export rice market. This could be possible if all stakeholders
understand the importance of improving rice quality which could be achieved by better
post harvest practices. Moreover, stakeholders will be able to appreciate quality

126
improvement if they understand cost and return calculations. Given the results of the cost
and benefit analysis resulting from improved MC and export cost and returns, the
affordability of a premium price incentive for organic rice could be provided by traders
given the right export price. A special extension campaign should be launched to
involved all stakeholders to enhance collaboration that will ensure continuous learning,
enhance commitment towards attainment of improved quality by the farmers and millers
as well as ensure government support in obtaining better export markets for organic rice
through organized activities such as trade fairs. Identified traders, millers and processors
and exporters will form part of the initial project implementation that will provide
premium price incentive to quality rice products.
Sharing of learning. Field days are very meaningful for knowledge sharing;
outstanding farmers will be resource persons who are going to conduct discussion among
interested members. The success of post harvest experimentation will be shared with
other farmers. Aside from this, millers will also share results of the trials and feedback to
farmers and other millers. Open forum with stakeholders will be conducted across
institutes by inviting all organizations who are currently working on same purpose of
commodity development in order to present issues and potentials for scaling up of good
outputs of the project. Trade fairs will be organized to show case the products generated
by the farmers.

127
Participatory monitoring and evaluating (PME). To guarantee goals are met
efficiently and effectively, PME system is will be set up at the very beginning of the
phase.
Approach. Farmer centered extension is a key for this post harvest project to
become successful as such participatory approach will be adopted.
Extension approach here uses extension campaign model (Figure 13).
Participatory tools and techniques will be used in the whole process to ensure active
involvement of farmers.
Participatory market chain approach will be integrated in the post harvest
improvement; price for quality fosters to empower process running very well.
Strategies. Training on post harvest and quality of rice will be held in September
and participants include farmer group leaders, District Trade Office (DTO), District
Agriculture and Forestry Extension Service (DAFES), village cluster leaders, village
marketers, millers, and processors. This training does not only aim to improve knowledge
sharing among stakeholders but attempts to tighten relationship among the participants.
Resource persons can be national and/or international consulting agencies.
Farmer organizations play a key role in boosting sustainability in the organic rice
farming. Training of trainer module will be given a priority.
Farmers will legally be supported under farmer organization with guidance by
village marketers to produce rice quantity and quality based on market requirement.
Activities include of Farmer Field School, study tour, on the job training, class training,
trial, and demonstration.

128
Rice miller group will inform farmer groups about the amounts of rice they plan
to buy not later than March every year. This information will include types of rice,
quality needed and prices based on grades that they are going to buy in order to give
farmers advance idea about the market demand for their produce. It needs to be assured
that the rice millers are authorized by DTO, DAFES, and farmer leaders. These millers
will be assisted by project to play a role at potential niche markets.
Rice processors will introduce their business and market plan to farmers and
millers who are going to provide raw materials to their factories. The price scheme can be
assessed by stakeholders before processors proceed to collect paddy from farmers. In
order to retain premium price and quality price incentive for farmers, they will be assisted
to play a role at supermarkets, minimarts, fair-trade, and organic markets.
Campaign. The supply chain matrix below serves as a guide to attain better grain
quality by targeting farmers, traders, millers and exporters.
Table 51 summarizes the proposed extension campaign.
Table 51. Proposed extension campaign
ACTORS/SUPPLY
CHAIN
PRE-
PRODUCT-
ION
PRODUCT-
ION
POST-
PRODUCT-
ION
TRADING MILLING
AND SELLING
Rice processors
(LFP & SFSE)
Informing about
buying capacity for
next year crop
Creating a condition
for accessing Fair-
trade and organic
markets including
existing markets
Training on tech-
nical production:
-Warehouse
account & mgt
-Drying practice
-%MC and Price
-Milling quality
-Quality and profit
Purchasing paddy
thru systematic
village marketers
Milling rice from
certified millers
Traceability
requires using
organic vouchers
for reimbursement
of premium price
Ensuring quality of
-Pasteurizing
-Packaging
-Bagging
-Storage & hygiene
Developing new
products and
commercialization
Distributing rice
products to
Supermarkets,
minimarts, etc

129
Table 51 continued …
ACTORS/SUPPLY
CHAIN
PRE-
PRODUCT-
ION
PRODUCT-
ION
POST-
PRODUCT-
ION
TRADING MILLING
AND SELLING
PAFES/ Project
Farmer’s training
on
-Organic rule
-Supply chain
analysis
-Compost
production
-Business planning
Farmer’s training
on technical
production
(improved nutrient
management, pest
management with
concentration on
apple snail
management and
proper harvest)
Farmer’s training
on post harvest and
quality of rice:
-proper harvesting
procedures
-Drying practices
-Storage mgt
-Quality of rice
-%MC & Price
Trader’s training
on importance of
moisture content
Setting up of
initial funds for
trading of paddy
based on moisture
content
Technical meeting
with GFMG1 to pilot
selling of better
quality rice to
exporters at premium
prices
Development of
special market for
quality rice through
technical briefings
and representation
with exporters
regarding importance
of grain quality and
premium prices.
Organic rice farmer
organization
(DTO/DAFES/ Village
cluster, Farmer leaders)
TOT for farmer
leaders on organic
concept, rice
production, post
harvest and
marketing.
Participatory
drafting of policies
on synchronized
farmer harvesting
and drying
Joint harvesting
through clusters by
labor exchange
Collective selling
through certified
dealers
Establish and
participate in
agricultural fair
Village marketers
Informing farmers
grow rice based
market needed
Group trading and
marketing based
after harvest (based
on a certain
percentage of total
yield)
Training on rice
bran processing into
forms such as wine
and beauty products
as possible source
of increased income
Farmer trials on
broken rice
processing into
wine and beauty
products
Participatory
experimentation on
drying different
methods
Assisting to
develop module of
post harvest and
grain quality
Providing
moisture meters to
each village
Enhancing
marketing skills
and bargaining
capacity
Establish market
information board
in each village:
-Quality price/MC
-Premium price
-Volatility of price
Buying of addy with
<14%MC at
competitive price
130
CHAPTER V
SUMMARY, CONCLUSIONS,
IMPLICATION AND RECOMMENDATIONS
Summary
The study aimed to investigate the post-harvest procedures of organic rice farmers
in ten villages of Sangthong District in the Province of Vientiane capital, Lao PDR. The
specific objectives were: 1) describe the socio-economic characteristics of organic rice
farmers; 2) explain farmer practices in the organic rice postharvest system and
traceability; 3) describe processing and marketing aspect of the certified organic
processors 4) investigate paddy moisture content in the granaries of organic farmers; 5)
conduct grains quality milling test in laboratory with different types of paddy drying
practice; 6) develop a market-based price incentive scheme for inclusion in extension
campaigns to encourage better post harvest practices.
One hundred ninety seven (197) certified organic farmers served as respondents
of the study. Structured interview was conducted among respondents. Data was analyzed
using descriptive statistical tools such as percentages, means, standard deviation, and
ranges. The t-test and chi-square test of independence was used to determine significant
differences in manual harvest, machinery operation and harvest practices; frequency of
rice milling, milling recovery, mode of payment and types of rice mill; trading scheme
and sold paddy; training courses provided, training places and group of rice farmers; and

131
farmer’s training needs. The chi-square test was used to determine the relationship
between selected independent and dependent variables such as varietal use and utilization,
the relationship between method in use, ownership, frequency use of machine and types
of land preparation; and types of grain and utilization practices. Regression analysis was
used to predict the moisture content (MC) in the storage granaries of respondents.
Analysis of Variance (ANOVA) was used to investigate three different rice varieties
namely glutinous, non-glutinous and purplish-blue rice in order to examine the paddy
drying practices by Sangthong farmers that could affect the percent of milling recovery
and head rice recovery.
Socio-economic Profile
The respondents' ages ranged from 24 to 75 years with mean of 45 years. Of the
respondents, majority (82%) were male. Majority of the respondents (47%) finished
basic/elementary school while very few finished college. Majority of the income come
from rice production with a mean of 9,481,866.24 LKIP (US$1,142.39) followed by
livestock production with a mean of 3,531,482.23 LKIP (US$ 425.48) and commercial
tree plantation with mean of 1,604,060.96 KIP (US$ 193.36). Vegetables production,
poultry and fish rising, non-timber forest products collection, handicraft, and mini-trade,
served as minor sources of minimal income.

132
Farmer’s Practice in the Organic Rice Production
Sources of fund in rice production. Majority of the farmers used personal capital to
finance farm operations. However, for those who borrowed, the main source of fund for
operations in organic rice farms was from the bank which could be availed by submitting a
business plan. The Village Revolving Fund, which was set up to provide accessible loans for
farmers were not patronized by most farmers because the money that could be loaned was not
enough to cover the expenses for farming production.
Application preparedness, certification and traceability process. The highest number
of initial ICS inspection was found from May to June of the initial ICS inspection. Most of the
inspection was conducted in the house rather than farm sites. During the final ICS inspection, the
highest number of organic farmers inspected was found from December to January.
The LCB randomly inspected farmers, millers, processors at least two times a year
between July and December organic certification was issued to those who complied with standard
regulations and requirements.
Organic rice varieties used. Three main rice varieties were used for organic
production and certification namely: HomSangthong glutinous rice, HomSavanh non-
glutinous rice, and Purplish-blue rice.
Chi-Square test (2 = 282) also showed that there was an associate on between
utilization and types of grains used. Results show that farmers grew glutinous rice more for
home consumption compared with the two hybrid varieties which was significantly sold to
the market. While a large proportion of the glutinous variety was also sold, it was

133
done on a protracted basis because it was mainly reserved for food security and partly for
financial security.
Establishment of nursery. Wet bed nursery was widely practiced by respondents
using seed rate much higher than the required rate. This is because farmers use narrow
spacing and stock up on seedlings for use as replacement for seedlings that may possible
not grow or may be eaten by apples snails (Pomacea canaliculata). Organic fertilizers
were produced and used during nursery established because farmers consider this
important in producing vigorous seedlings.
Land preparation. Chi-Square test (2 = 0.173) of independence showed that the
method in use and the type of land preparation were not related but the type of ownership
and the type of land preparation was related. The land preparation task was primarily
performed by men around early or lately in June. Almost 50% of the farmers performed
soil tillage twice. Those who tilled twice did so because of bad silt-soil texture
compaction. Chi-Square test (2 = 452.6) showed that there is a significant relation
between machinery ownership and type of land preparation used.
Transplanting and seedling spacing. The healthy rice seedlings were pulled after
28 days and transplanted at the rate of 5 seedlings per hill with spacing of 15 × 15 cm.
Fertilizer application. Compost was the most widely used fertilizer but a
significant number of the respondents did not use fertilizer at all. Fertilizer was used
mostly during land preparation. Other farmers used bokashi and bio-extract and applied
manure.

134
Common pest in rice production. The golden or apple snail (Pomacea
canaliculata) was the most common pest in Sangthong district and 87% of the
respondents experienced difficulty in controlling the pest.
Harvesting/Cutting. Manual harvest was the predominant practiced of farmers
but threshing was done by machine operators. The T-test analysis also showed that
hauling is significantly different for the farmers who use manual harvest and machinery
operation.
Field drying, hauling and pilling. Most farmers used field dying primarily
because there was only one flat bed dryer available in all of ten sampled villages.
Accessibility to the flat bed dryer was therefore a major constraint.
Hand tractors were predominantly used to haul cut panicles in large farms and
those near main road.
Threshing and transporting. Mechanical threshers were operated by crewmen
and threshing. For every 10 sacks, one sack is paid to the threshing operator which made
the cost of using mechanical threshing expensive.
Storage. Almost 50% of granary was made of wooden walls and floors with roof
of steels. Another 24% were made from bamboo with dried grass roof and some few
granaries were made of concrete and tiles. Majority of the respondents (88%) had
granaries that could accommodate 10 tons below and 55% stored grains from 10 to 12
months. Chi-Square test (2 =60.241) showed that there is an association among the
utilization practices with the three varieties.

135
Village milling for home consumption. Majority of the respondents (76%) milled
rice once a month at village rice mill while others milled every two weeks in commercial rice
mill. The T-test analysis showed that the frequency in milling rice is not significant between
small village rice mill and commercial rice mill.
Paddy marketing through village collector. T-test analysis showed that there is no
significant difference on the mean paddy purchase between certified and non-certified
scheme. Farmers normally sell to traders right after harvest when prices of paddy rice is low.
The organic rice purchasing system is implemented without contract farming scheme.
Farmer’s training support system. Most of the farmers received training on
Module1 which was a course on requirements and regulation for certification of organic rice.
Close to half of the total number of respondents (43%) received training in the Sangthong
district while 35% received training in the Village cluster. The trainings were given using
knowledge technology transfer model for adult education.
The Laos central government supported training for pre-production while extension
agencies like PAFES and DAFES took charge of trainings in production part. ProRice
provided post-production training.
Farmers’ training needs. Most of the respondents expressed need for training in
making farm business plan and integrated pest management (IPM). Making a farm business
plan is important to avail of loans while IPM is seen necessary to control pests.
Certified organic processors. There are four processors, SomPhone (GFMG 1),
SomHong (GFMG 2), SFSE, and LFP.

136
GFMG is an active milling and trading company which could produce 580-600
Kg of white rice per ton. They can also produce good quality milled rice with a milling
recovery close to international standards. GFMG 1 (SomPhone) sells mainly to domestic
market while GFMG 2 (SomHong) was able to sell to international markets like
Switzerland. However, it is not able to maintain the market and has recently explored
selling to Genoa Italy.
Two new partners namely SFSE and LFP, are engaged in milling and trading of
organic rice in both foreign and domestic markets. SFSE and LFP have longer
international market exposure compared to GFMG.
Investigation of Paddy Moisture Content
in the Granaries of Organic Farmers
To examine moisture content of fresh harvest, eighty (80) samples were taken
from farms in the study area with 48 samples of glutinous rice and 16 samples each of
non-glutinous and purplish-blue rice from village granaries. Results show that farmers
often had to deal with cloudy skies and/or rain showers during harvest time. Farmers cut
and spread panicle and leave them for three days in the field to dry. But in cases of
occasional rain, farmers had to make small grapes of panicle bundle and tilt these in an
angle 30°C - 45°C on the cut standing straw.
Results showed that farmers failed to get optimum MC that could protect rice
harvest from potential storage problems like molds, insect damage and loss of viability.
However, farmers in the study area were dealing with protracted milling procedures and

137
therefore kept their rice paddies longer than three weeks. Although the ideal MC was
14% or less the MC of the grains collected in this study was above 14%.
Effect of availability of family labor on moisture content. Labor was not crucial
factor that influenced MC of the paddy. Results generally showed that there is no any
relationships of MC in granaries and family labor, farm size and field-drying practices
using regression analysis where MC is the predicting variable (dependent), and number
of active labor, farm size (Ha) and number of days in the field-drying days as
independent variables.
Examination on Three Different Paddy
Drying Practices and Grains Quality
Milling Test in Laboratory
Three drying methods were used in the experiment, namely: mechanical drying
using a flat be dryer, sun drying as farmers practice and shade drying as the most gentle
drying treatment which results in the best quality as control treatment. Three varieties of
rice, HomSangthong glutinous-rice, HomSaVanh non-glutinous rice and purplish-blue
rice were compared. Each treatment was replicated three times.
It can concluded that for all varieties, shade drying, is the most effective drying
method that produced highest head rice with the exception of glutinous rice. Sun drying
was the least effective. Shade drying, however, would be difficult to adopt since it
requires a large amount of paddy and needs a large shaded area which would in turn
require a costly infrastructure investment.

138
Effect of the variety on quality for the three drying treatments. Analysis of
Variance (ANOVA) was used to investigate tendency of three different rice varieties and
determine if paddy drying practices affect percent of milling and head rice recovery
across the different types of rice.
Contrary to the expectations, the increases in head rice recovery from mechanical
drying were minimal. This was due to the fact that the conditions for sun drying were good
during the time when the experiments were conducted. There was no delay in drying caused
by rain. Additional experiments to compare the mechanical drying immediately after harvest
with actual farmers’ practice which consists of several days of field drying followed by
threshing and then sun drying can be done to get a better picture.
Based on the results above and the data in Table 30 the following conclusions can be
drawn: 1) Milling recovery was affected minimally by the drying process 2) Head rice
recovery was affected by the drying process. Shade drying produced better head rice recovery
than sun and mechanical drying for all three varieties. 3)The varietal effect was minimal in
all three drying treatments for glutinous rice and non-glutinous rice. Purplish blue rice could
not be directly compared since it was undermilled and differences therefore are due to the
different milling procedure. 4) Purplish blue rice had the biggest head rice reduction in sun
drying and also in mechanical drying compared to the control shade drying. The variety
seems to be very responsive to uncontrolled drying conditions.
Cost of using flatbed dryer. Under normal drying conditions, sun drying with a
drying cost of 104 LKIP/kg was found to be the cheapest method to dry rice grains.
However, in wet season (rainy, flooded, foggy or cloudy weathers), despite the cost, it is

139
more practical to use mechanical dryers especially in Natiem and Pialth where such
facility is readily available.
Development of a Market Based Price
Incentive Scheme for Inclusion in
Extension Campaigns to Encourage
Better Post Harvest Practices
Volatility of paddy price in Sangthong. Paddy price was unstable throughout the
year, with the higher prices found from July to October and low prices from January to
June because new harvest of upland rice in October and rainfed rice in November to
December plus the irrigated rice was harvested in April.
Grain quality payment and its calculation for domestic markets. Farmers do not
only loose by selling less weight (Appendix C) but also by paying more or spending more
time on drying (Table 41-43). Results show that higher moisture content leads to
increased loses for the producer ranging from 25 LKIP per kilogram to 188 LKIP per
kilogram for glutinous rice because the current pricing scheme does not consider
moisture content nor grain quality. However, all stakeholders are not aware of the
current loses because of their lack of awareness regarding the importance of moisture
content in the final head rice count. Lack of premium price for organic rice and low
prices despite good quality of harvest have been persistently problems that must be
addressed. To encourage farmers to improve grain quality, prices should be set in
accordance with their performances as real weight of well-dried paddy, meaning,
compensation must compensate for weight loss during drying activities.

140
Exportation to foreign markets. Based on actual and projected cost and return
analysis, GFMG 2 could not pay premium prices for organic farmers, but the SFSE and
LFP could pay because of better profit obtained as a result of higher prices obtained from
their export partners.
Break-even computation All of the traders investigated had good cost revenue
ratio. Based on calculations, traders can pay price incentive to farmers and still earn a
profit margin.
Analysis of milled rice exported and sold to foreign markets. Given the export
market data, an analysis of cost and returns per kilogram was made to come up with an
estimation of projected cost and returns per kilogram using an incentive of 500 LKIP.
Based on cost and return analysis, SomHong cannot provide premium incentive price
to farmers given the export market price of organic rice at 4,253.90 LKIP (US$ 0.51). On the
other hand, SFSE and LFP can give premium prices and still earn more because of good
negotiated export market price they were able to fetch for their organic rice.
Proposed extension campaign model. The proposed extension campaign model
believes that joint assessment, planning, forging of agreement, implementation, sharing
of learning and evaluation empowers farmers by ensuring that they exercise their right to
plan and decide for themselves. While the intention is for the farmers to be paid
according to the quality of the output, at the heart of the extension campaign is the thrust
to develop the capabilities of the farmers to be able to work together, link with relevant
stakeholders and ensure improvements in their quality of lives. The model is guided by

141
the supply chain analysis, taking into consideration the constraints, capability needs,
potentials of significant actors per value chain.
Conclusions and Recommendations
1. Most of the respondents were male with an average age of 45 years, majority of
whom reached elementary and lower secondary school. Given this profile, it is
important to provide extension materials that are easy to understand. The use of
pictures accompanied with simple instructions would be most useful.
2. Organic rice farmers derive income mostly from rice. However, the income is
below the poverty line for LAO. Hence, it is important to ensure that organic rice
farmers are paid in accordance with the quality of organic rice produced.
Moreover, given the low income from rice, it is important to integrate cash crop
and livestock production.
3. The certification process is tedious for the farmers since they are investigated
three times. Given the low educational attainment of farmers, it is necessary for
the ICS to simplify the recording process and encourage more farmers to
religiously record practices.
4. Based on results, both hybrid rice performed poorly in comparison to inbred rice
because farmers reuse hybrid seeds more than three years. Farmers should be
educated on seed technology.

142
5. Results reveal that farmers transplant more seedlings than necessary due to apple
snails (Pomacea canaliculata) attack. There is therefore a need for training on
apple snails (Pomacea canaliculata) management to minimize seedling cost and
ensure survival rate of seedlings.
6. A significant number of farmers did not apply fertilizer at all. Moreover, for those
who applied organic fertilizer, most applied only once. There is a need to provide
additional training on the making of organic fertilizer. Moreover, there might be a
need to provide incentive for the organic farmer group to collectively produce
compost and explore the use of African night crawlers to speed up decomposition.
7. Apple snails (Pomacea canaliculata) is the dominant pest that attack farmer’s
field. Manual removal of apple snails (Pomacea canaliculata) and biologically
removal by integrated ducks and geese raising is recommended. Incidentally, IPM
was identified by farmers as foremost training need.
8. Many of respondents do not know the proper timing of harvest, hence they
harvest when panicle is not yet dried well. This affects the moisture content of
paddy rice at the granary which can lead to grain deterioration. It is therefore
important to educate farmers on proper harvest techniques in order to achieve
14%MC.
9. There is a need to educate the farmers regarding immediate threshing after
harvesting. Coupled with the educational intervention should be government
support in ensurance of accessibility of threshers during harvest time.

143
Government may provide support mechanisms through financing schemes for
farmer groups.
10. It can concluded that for all varieties, shade drying, is the most effective drying
method that produced highest head rice with the exception of glutinous rice. Sun
drying was the least effective. Shade drying, however, would be difficult to adopt
since it requires a large amount of paddy and needs a large shaded area which
would in turn require a costly infrastructure investment.
Laboratory tests show that grain quality is affected by drying procedures. While
shade drying results to better head recovery, the practice requires a large shade
area which might not be available for most farmers. Between sun and mechanical,
mechanical drying produces better grain quality.
There is therefore a need further explore and promote mechanical dryers to ensure
that farmers achieve the desired moisture content of 14%. The design of the
dryer should be improved such that heat cannot escape, and the fan should match
the capacity of the dryer so that the drying process can be significantly improved.
Government can consider providing financing schemes to farmer organizations to
improve accessibility of mechanical dryers with appropriate design.
11. The paddy moisture investigation in granaries revealed that moisture content is as
high as 21%. Given that farmers store rice for 8-12 months, this level of moisture
content is prone mold, insect attack and discoloration. Farmers should be
educated on the use of moisture meter. Accessibility of the moisture content

144
should be a major priority as this could also facilitate increased bargaining
capacity with the traders.
12. There are four locally and internationally organic rice certified processors. If
they sell at domestic markets, they will not be able to give premium price
incentive. If they sell at international market at a low price, they will still not be
able to give premium price incentive. But if they are able to negotiate
competitive prices, they can afford to give premium price incentive and still earn
more. Hence, there should be interventions that will help processors link with the
international market like joining trade fairs.
13. There is a need to organize a farmer associations that would negotiate bulk trying
and manage possible infrastructure facilities like mechanical dryers and threshers.
The association would serve as the link between farmers and other stakeholders.
14. Given the many educational interventions needed in order to produce premium
organic rice that meets international standards, an extension campaign that
integrates all capacity building needs of all actors in the organic rice supply chain
should be undertaken. The extension campaign should be broad based and
participatory that seeks to empower farmers and processors. As such,
participatory experimentation on varietal use, nutrient and pest management and
post harvest should form an integral part of the extension campaign. Market
orientation should likewise underline the extension campaign so that products and
rice by products that will be developed will have market base.

145
Suggestion for Further Study
1. Farmer experimentation should be conducted on seed varietal use since
farmers do not understand hybrid rice characteristics, hence, in this study,
purplish blue rice yielded the least production.
2. Conduct more in-depth experiment between field drying and mechanical
drying that would use more samples from different places and use a
mechanical dryer that is better designed.
3. Conduct a feasibility study that will investigate the possibility of establishing
a farmer organization managed village rice mill. Based on the results, milling
significantly affects rice quality. Aside from ensuring that all rice milled is
organic, this will enable farmers to directly sell organic rice to international
market.

146
LITERATURE CITED
ACT. 2008. Handling/Processing inspection report of SomHong and Somphone rice
mills, Vientiane, Lao PDR.
ACT. 2008. Inspection report of project with ICS: Organic rice production group in
Sangthong district, Vientiane, Lao PDR.
AKTERUZZAMAN. MD and J. PARVIN. 2002. Drying of Paddy in Wet Season by
Mechanical Dryer for Improving Farmers Income. This paper is derived from the
2nd
author’s Masters Thesis done in the Department of Agricultural Economics,
Bangladesh Agricultural University, Mymensingh. Bangladesh Journal of
Political Economy Vol. 20, No 1. Pp 162 – 163
ALLEJE, H. J and S. SACKLOKHAM, 2009. Planning document for continued
implementation under PROFIL Phase II (2009-2011)
ARNESS. R, 2005. Concepts of Integrated Pest Management. Improving livelihoods in
upland of the Lao PDR by NAFRI, NAFES, and NUOL.
ASEAN, 2009. Setting a course of action for ASEAN Good Agricultural Practices.
Jakarta 22 January 2009.
Available: http://www.card.com.vn/news/Projects/026VIE05/Appendixes%202-
7_Reports%20on%20Drying%20.pdf. Retrieved on March 10, 2011.
BALINGBING. C, 2010. IRRC training material for Cambodia, Laos and Vietnam.
Harvest and Postharvest Management of Rice and Markets. Postharvest Unit,
GQNPC, IRRI, Los Baños , Philippines.
BANTILES, B.R.2002. Basic Standards for Organic Rice Cultivation
BESTARI. N, G. et al., 2006, Lao PDR: An evaluation synthesis on rice, a Case Study
from the 2005 Sector Assistance Program Evaluation for the Agriculture and
Natural Resources Sector in the Lao People’s Democratic Republic. Asian
Development Bank.
BJORKQVIST, S. 2008. Tracking pesticides and promoting alternatives in Laos.
BOROMPISHAICHARTKUL, C. et al., 2007. Comparative Study of Effects of Drying
Methods and Storage Conditions on Aroma and Quality Attributes of Thai
Jasmine Rice. Publisher: Taylor & Francis. Pp 1186.

147
CARD, 2008. Vietnam Ministry of Agriculture and Rural Development. Section 2. Study
on the flat-bed dryer in the Mekong River Delta of Vietnam, the study on the flat-
bed dryer from 2006 to 2008.
CARD, 2010. MS14: PROJECT COMPLETION REPORT 026/05VIE. Investigation of
rice kernel cracking and its control in the field and during post-harvest processes
in the Mekong Delta of Vietnam. APPENDIX 1 Influence of harvesting time
around grain maturity on rice cracking and head rice yield in the Mekong River
Delta of Vietnam April 2010. Pp 64. Retrieved on March 14, 2011. Available at
http://www.card.com.vn/news/Projects/026VIE05.
CHUPUNGCO, A., et al., 2008. Two-stage grain drying in the Philippines. Published by
the Australian Centre for International Agricultural Research (ACIAR) Australia.
Pp 14.
DE PADUA. D. B, 1999. Postharvest Handling in Asia 1: Rice. International Rice
Research Institute-Philippines, 1999-02-01. Retrieved on April 3, 2010. Available
at http://www.agnet.org/library/eb/465a/
EARLES. R, 2005. Sustainable Agriculture: An Introduction
EMRIP. 2008. Project design document: Enhancing milled rice production in Laos PDR
EYHORN. F and S. SACKLOKHAM, 2008. ProRice-Promotion of Organic Rice from
Lao PDR. Mid-term evaluation 12 – 23 February 2008. Helvetas-
Laos/Department of Agriculture.
FAO, 1979. Extension Education in Agricultural and Rural Development: Role of
international organization-the FAO experiences.
FAO, 2003. Report of the Expert Consultation on a Good Agricultural Practice (GAP)
Approach. Food Agriculture Development Report, Food and Agriculture
Organization of the United Nations. Rome, 2003.
FAO-IPM, 2008. National Integrated Pest Management (IPM) Programme in Laos PDR,
Salakham Pest Protection Center.
FRISCO M. M, 2008. Transfer and adaptation of the Vietnamese reversible dryer in the
Philippines: A travel report on the observation trip to Vietnam.
GDS, 2005. Value Chain Analysis of Strategic Sectors in Lao Draft 1 prepared for the
World Bank: Integrated Value Chain Analysis of Selected Strategic Sectors in
Lao People’s Democratic Republic.

148
GENG. S, and R.M. SAUNDERS, 1987. Eighteenth annual report to the California rice
growers, May 1987. Rice Quality and Product Development-86. Department of
Agronomy and Range Science, University of California, Davis and Western
Regional Research Center, USDA, Albany, CA. Retrieved on February 20, 2011.
Available at web site: http://www.carrb.com/86rpt/Quality.htm
GREEN NET and EARTH NET FOUNDATION, 2008. History of Organic
Agriculture, and Regulation and Certification. Retrieved on March 15, 2011.
Available at web site :http://www.greennet.or.th/AsiaOrganic/Laos/Laos.htm
GUMMERT. M and B. CALING, 2007. Draft mission report: Technical and Economic
Assessment of four rice mills to produce exportable organic rice based on
international standard.
HAI-YAN. JIA et al., 2009. International Journal of Food Engineering Volume 5, Issue
2, 2009 Article 2. Thermomechanical Property of Rice Kernels Studied by DMA.
The Berkeley Electronic Press 2009. Pp 1
HARSIANTO. V. A, 1994. Comparative analysis of the economic effect of leasehold
and share tenancy in sugarcane land in three Barangays, Balayan, Batangas, The
Philippines. Master of Art in Agrarian studies. Pp 51 – 54.
IFOAM (2003), Smallholder group certification, Compilation of results, Theley,
Gemany.
INTHALANGSEE. B, 2009. The certification process in organic rice production: The
case of Sangthong district, Vientiane capital, Lao PDR.
IRRI, 1990. Field problems of tropical rice. ISBN971-22-0004-3
IRRI, 2009. Rice Knowledge Bank: Milling/Processing. Retrieved on March 15, 2011.
Available at http://www.knowledgebank.irri.org/rkb/index.php/rice-milling
IRRI, 2009. Rice Knowledge Bank: Paddy drying: Drying time of my flat bed dryer is
too long. Retrieved on February 18, 2011. Available at
http://www.knowledgebank.irri.org/rkb/index.php/faq-drying/116-rice-milling
IRRI, 2009. Rice Knowledge Bank: Paddy drying: Option for heated air dying. Retrieved
on March 15, 2011. Available at
http://www.knowledgebank.irri.org/rkb/index.php/paddy-drying-methods/heated-
air-drying

149
KHEMMRATH. S, 2008. Final report on assessment of postharvest process in the
“Green Field” rice production area of Sangthong.
KUNZE R. O, 2008. Effect of Drying on Grain Quality Moisture Readsorption Causes
Fissured Rice Grains. Presented at International Conference on Grain Drying East
Asia, Bangkok, Thailand 17-20 October, 1995; Updated and Revised, August,
2008. Agriculturl Engineering International: the CIGR E-journal. Invited
Overview No. 1. Vol. X. December, 2008. Pp 1.
LANTIN. R, 1997. Post-harvest Operations, IRRI- International Rice Research Institute,
Philippines. Retrieved on April 3, 2010. Available at
http://www.fao.org/inpho/content/compend/text/ch10-01.htm#TopOfPage
LAO PDR Country Paper, 2006. Workshop on utilization of Biomass for renewable
energy.
LEAP, 2004. Basic tool handbook for agricultural extension, Laos Extension for
Agriculture Project.
LOMLEK. C, 2006. Advocacy for and implementation of the good agricultural practice
(GAP) on baby corn (Zea mays L.) production in the kingdom of Thailand. p 38.
MAP, 2008. Making value chains, work better for the poor. A toolbook for practioners of
value chain analysis.
MAF, 1996. New agriculture extension policy of Bangladesh
MAIER E. D and F.W. BAKKER-ARKEMA, 2002. Grain drying system, written for
presentation at the 2002 facility design conference of the grain elevator and
processing society held July 28-31, 2002 in St. Charles, Illinois, USA. Pp 8.
MALAYKHAM, B. 2004. Current Status of Energy Consumption of factories and
Potential CDM Cogeneration Development Project in Laos
MEAS, P. 2008. Mathematical modeling and improvement of operating practices of sun
drying of rice. Retrieved on February 28, 2011. Available at
http://muir.massey.ac.nz/bitstream/10179/620/3/01front.pdf
MOIC (2006), Organic Product Strategy (2007 – 2009), Ministry of Industry and
Commerce, Vientiane, Lao PDR.
NAVARRO, S. and R. NOYES, 2001. The mechanics and physics of modern grain
aeration management. CRC Press, Boca Raton, FL. 647 p.

150
OBACH, B. K, 2006. Theoretical Interpretations of the Growth in Organic Agriculture:
Agricultural Modernization or an Organic Treadmill.
OCCP, 2009. Organic certification center of Philippine: Organic Certification.
Retrieved on February 20, 2010. Available at website:
http://www.occpphils.org/members.htm and
http://www.occpphils.org/Brief_Information_Group_Certification_OCCP-
QM_10.06.pdf
ONPHANHDALA. P, 2009. Journal of International Cooperation Studies, Vol.16, No.3
(2009.3). Farmer Education and Rice Production in Lao PDR, p 106-107.
PANYAKUL. V, 2009. Final organic agriculture in Lao PDR: Overview and
Development option. EARTH NET FOUNDATION/GREEN NET, January 2009.
International Trade Center’s project “support to trade promotion and export
development in Lao PDR” Project number LAO/61/89.
PHAM, T. H. T, 2009. The master thesis on collective Action of Organic Rice and
Vegetable Producers Groups in Vientiane, Lao PDR. University of Copenhagen,
faculty of life science. Department of Food business and Development. Pp 29.
PHILANGAM. K, and S. BOUNDOUANGCHANH, 2008. Facilitators Manual for
Organic Rice Production in Lao PDR , Department of Agriculture.
PHOUTHAVONG, X. 2010. The benefits of organic rice farming on the poverty
reduction at seven villages, Sangthong district, Lao PDR.
PPWG, 2007. Essential Components of a Business Plan, Irrigated Rice Research
Consortium (IRRC) post production Working Group.
PROCESSING OF FOOD, 2010. Postharvest Technology of Rice: Harvesting and
Threshing. Retrieved on February 20, 2011. Available at
http://processfood.blogspot.com/2010/11/postharvest-technology-of-rice.html
PROFIL, 2005. Organic Farming in Lao PDR, PROFIL, Vientiane.
PRORICE, 2005. Promotion of organic rice from Lao PDR (Phase I 2006-2008).
RAGUDO. T. F. M and L. R. PAMPLONA, 2009. CEM working paper series, Techno-
managerial study of the UPLB flat-Bed dryer. Working Paper No. 2009-18. Pp 3-
4, and 10.

151
RASHID, A and B. SZYNLSKI, 1995. Special report FAO/WFP – crop and food supply
assessment mission to Laos.
ROLLING, N. 2006. Communication for Development in Research, Extension and
Education, Thematic Paper no 2, Communication Roundtable, 6-9 September,
Rome: FAO.
ROOPA. V, 2006. Influence of post harvest handling techniques on seed quality and
storability of Muskmelon (Cucumis melo L.). Master of science (Agriculture) in
Seed science and technology. College of Agriculture Dharwad University of
Agricultural sciences, DHARWAD – 580005. Pp 11.
SACKLOKHAM. S, and P. MANIVONG, 2008. Assessment on Social and
Economical conditions of organic rice production in Sangthong district and its
domestic market with the support of ProRice. 24 December 2007- 15 January
2008.
SAMJHANA S, 2006. Sowing seeds in lab and field: the socioeconomic impact of the
Lao-IRRI Rice Research and Training Project.
SANTACOLOMA. P, 2007. Marketing strategies and organizational structures under
different organic certification schemes. Agricultural Management, Marketing and
Finance Service (AGSF, FAO). Pp 2. Retrieved on March 15, 2011. Available at
web site: http://www.fao.org/docs/eims/upload/233024 /marketing-strategies.pdf
SAUNDERS. R. M. et al., 1980. Rice post harvest losses in developing countries: Part 1.
A 1978 survey of post harvest losses during threshing drying, parboiling, milling
and the potential for reducing such losses in developing countries. U.S.
Department of Agriculture Science and Education Administration. Agricultural
reviews and manuals. ARM-W-12 April/1980. Pp 12.
SCHILLER, J.M. 2006. Rice in Laos, IRRI- International Rice Research Institute.
SIPASEUTH. K and A. WILSON, (2008), Organic Vegetable and Fruit Production in
Lao PDR: A Pre-feasibility Study Report, PROFIL.
SNV, 2000. Approaches to farmers-oriented agricultural extension: experiences from Tua
Chua district, Lai Chau province, Vietnam.

152
SOMADO. E. A, et al., 2006. Comparative studies of drying methods on the seed
quality of interspecific NERICA rice varieties (Oryza glaberrima x Oryza sativa)
and their parents. Africa Rice Center (WARDA), 01 Bp 2031 Cotonou, Republic
of Benin. African Journal of Biotechnology Vol. 5 (18), pp. 1619-1620, 18
September 2006.
SOMADO. E. A, et al., 2008. Harvest and Post-harvest operation. NERICA- The new
rice for Africa-a compendium. Africa Rice Center (WARDA). Edition 2008. Pp
112 – 115.
SULLIVAN. P, 2003. ATTRA: Applying the Principles of Sustainable Farming.
Fundamental of Sustainable Agriculture
SWANSON, B.E.1984. Agricultural extension a reference manual second edition. FAO
of the United Nations in Rome, Italy.
TAKAMATSU. S, 2002. Economic Analysis of Rice Market Integration in Laos.
Department of Economic Development and Policies, Graduate School of
International Cooperation Studies, Kobe University, January 2002. Pp 2 – 4.
TOLBERT, A. C, 2007. Thickness and cultivar effects on rice fissuring due to moisture
adsorption. Iowa State University. Ames, Iowa. Pp 3, 9, and 10.
TOURTE, L. et al., 2000. Organic certification farm planning, management, and
marketing. The Regents of the University of California. Division of Agriculture
and Natural Resources.
UASD-ARS, 2008. Cooperative extension service: Sustainable agriculture
UNEP-UNCTAP, 2008. Best Practices for Organic Policy. What developing country
Governments can do to promote the organic agriculture sector. Prepared under the
CBTF Project “Promoting Production and Trading Opportunities for Organic
Agricultural Products in East Africa” United Nations New York and Geneva. Pp
4-5.
VAN DER WULP, H. 2006. FAO Report on Pest and Pesticide Management in Lao
PDR: An initial assessment. Draft plant protection service, FAO. Rome, Italy.
VIET. N. Q, 2006. Study and application of crop harvesting mechanization in Vietnam.
The 2nd Session of the TC of APCAEM, November 20-21, 2006, Suwon, ROK.
Vietnam Institute of Agricultural Engineering and Post-harvest Technology.

153
VILLAGE EARTH. Village Earth-The Consortium for sustainable village-based
development. Crop drying, preservation and storage. Retrived on February 28,
2011. Available at
http://www.villageearth.org/pages/Appropriate_Technology/ATSourcebook/Crop
drying.php
WANDSCHNEIDER. T and N. K. YEN, 2007. Guide to agricultural marketing
extension with special reference to Vietnam, Module 1 March 2007.
YAMOTA and TAN-CRUZ, 2007. Farmers’ Adoption of Organic Rice Farming in
Magsaysay, Davao Del Sur: Factors and Practices. 10th National Convention on
Statistics (NCS) EDSA Shangri-La Hotel October 1-2, 2007. P 9.

154
APPENDICES

155
APPENDIX A
Organic Certification Processes
The main steps in the certification process are:
1. Certification Body (CB) sends application pack:
The LCB is under Standard Division of DoA that prepare a set of certification
application documents to the clients and those of application package is developed based
on IFOAM application with assistance of ACT due to LCB is member of Certification
Alliance (CertAll). A set of certification application will be provided by LCB consists of
eight application forms like:- Organic Standard, Registration Form, Farm History Record,
Farm Map, Cultivation Calendar, Farm Input Record, Inspection Reports, and
Conclusion Report. The clients who request for the organic certification should be
completed all required document above. Besides ICS-SU is under umbrella of CADC to
provide services regarding Internal Control System training and set up village ICS. Main
function of ICS is to help clients complete certification application.
2. Producers submit their application:
The clients have to record whole process of their activities since starting until the
end of product, this aims building trust to consumers. Thus, traceability should be tracked
in different batches. In order to help farmers or clients fulfill certification, they have to
note on application forms with supporting from village ICS and then those completed
filled forms will submit to Village ICS to review all member record keeping documents
and then The Village ICS operates like a small internal control body to visit each farm,

156
maximum one village ICS be able to inspect 3 members a day, Village ICS or internal
inspectors inspect the farms at least twice a year and an internal system of sanctions
against defaulting farmers. The final farm inspection will be written commitment of the
participating farmers and submit all member documents to LCB for further steps of
organic certification. The implementation of an internal control system (ICS) can help to
save costs for external inspection and certification.
3. Application will be screened by CB:
First draft of Village ICS document has done among farmers sending to LCB for
screening the overall situation. Then, LCB prepare to inspect the functioning of the
village ICS and randomly make a plan for re-inspecting at a certain percentage of the
farms.
4. Contract will be signed between CB and Producers:
Contracted party is the farmer group, Processor which also is the owner of the
certificate. In case certificate holder is farmer association, the product is organic paddy
but milled rice is not organic anymore because rice mill does not hold a certificate.
Another case, processor or rice mill is the owner of the certificate; the final product is of
course milled rice and farmers grow organic rice under sub contract with processor and
then LCB inspector will inspect whole process of processor or rice miller’ activities. In
the Sangthong district, Lao PDR, certificate owner is separately for farmer group and
processor group.

157
5. CB assigns Inspector:
An Internal Control System (ICS) is a part of a documented quality assurance
system as having mentioned above that allows the external certification body to delegate
the periodical inspection of individual group members to an identified body or unit within
the certified producers. This means that the third party certification bodies (LCB) only
have to inspect the well-functioning of the system of village ICS, as well as to perform a
few spot-check and re-inspections of individual smallholders.
6. Inspection visit:
The certification process requires visits by inspectors from LCB to verify that
production and handling are carried out in accordance with the standards. The inspector
must visit 100% of the farms and farmers, storage, processing, packaging and shipping at
least once per year. The inspection always has to include an interview with the farmer
and processor. The inspectors review the farmer’s paperwork with particular attention to
yields and farm inputs. For the processor, inspectors review farm product purchasing
system, storage management, and product processing lots before selling to markets.
7. Assessment of inspection report:
After inspection, inspector writes an assessment report with putting comment as
findings in each farmer based on the information gathered. This assessment of inspection
report has to attach in farmer’ record documents for an evidence when requires another
inspection from international certification Bodies like ACT, NOP, JAS, EU, BioAgriCert,
etc.

158
8. Producers comment the inspection report:
During inspection, LCB inspectors will gain information from member and non
member by conducting formal and informal interviews for additional data sources. All
comment is acceptable to complete inspection report.
9. Certification decision:
For a product to be certified organic, all operators in the product chain, including
farmers, processors, manufacturers, exporters, importers, wholesalers and retailers must
be certified as acting in conformity with the standards and regulations of the certification
program concerned. The process of certification decision is done into two levels:- firstly
in community level, Village ICS revises all results in consultation with village cluster
authority and report to whole community who deserve to certify organic or fail in
certification.
Secondly, the Village ICS transmits the results of the inspection to the
certification body which compares the results of the inspection from village ICS and LCB
with the requirements. A certification committee at national level decides whether
certification may be granted or not.
10. Producers commit to appliance with rules and regulation:
All operations in the agricultural product chain including producers, farmers,
processors, and distributors must be performed their activities in compliance with the
standard and regulation of certification program. Meaning to say creating integrity and
159
building trust between consumer group and producer group, the demand for organic
certification is to ensure that organic products produced strictly follow principles.
11. Certificate sent to Producers:
The certifier should have the international accreditation ISO 65, which is the
recognition of his ability to certify according to clearly defined procedures. The choice of
the certifier depends on the export markets and the requirements for certification
according to the national rules. Since 2006 till 2009, ACT certifier assisted LCB to
inspect organic farmers and processors because LCB certifier did not have yet the
international accreditation ISO 65. Inspection’s quality and reliability are tested at
random by repeated on-site inspections and interviews with randomly selected farmers.
However, laboratory testing is only one tool for inspection in cases of suspicion of
application of or contamination with prohibited substances.
In approvals of organic certification, farmer group who certified organic will
receive certificate on December of every year before selling paddy to Rice mills. Food
processor group will receive certificate lately on March in each year and no any
distribution to consumers before certified. In case of Lao PDR, LCB compromises clients
during certification development.
12. Producers requests information:
For more complex situations where there is cash cropping and even conventional
and organic activities on the same farm. So, crop must be certified annually but one time
for cultivated area, and then the key documents should be regularly updated and checked

160
by the Internal Controller. If the farmers keep most of the documentation themselves, the
village ICS operator must distribute the forms to the farmers. Village ICS must ensure
that the farmer completes the documentation required at the time of registration. The
village ICS operator must ensure that the farmers update the inputs lists, yield data, farm
management details, and map. Both the farmers and the Internal Inspector have
responsibilities for managing the data.

161
APPENDIX B
Research Instrument
QUESTIONAIRES ON ORGANIC RICE POSTHARVEST SYSTEM AND
GENERAL FARMING PRACTICES IN SANGTHONG, VIENTIANE
CAPITAL, LAOS.
Understanding current postharvest situations of organic rice stakeholder is the key aim
of this study in framework of ProRice intervention. The information provided is
confidential and used for social and scientific research only, not for any other purpose.
The active cooperation of interviewees plays a noble role contributing to the study’s
success and study’s results benefit to stakeholder itself.
1. GENERAL INFORMATION:
1.1. Name of rice grower:……………………..…; Age………; Male; Female
1.2. Year joining in organic group: Since……………………………………………
1.3. Interviewee: Husband; Wife; Cousin; Other………………………..
1.4. Location:…………………………village; unit…………; house No…………..
1.5. Highest education level:
Category of education in Laos Yes No No.of year
1. Elementary school
2. Lower secondary school
3. Upper Secondary school
4. High school
5. College
6. University
1.6. Responsibility in community:…………………………………………………...
1.7. Number of members living in family:………………..…………….…..persons
1.8. How many active labor helping in farm:………..…………………...…persons
2. SOCIAL ECONOMIC:
2.1. Vegetable production:
No. Type of
vegetables
% of Sold % of
Consumption
Annual income
(Kip)
1
2
3
4

162
2.2. Livestock and Fisheries:
No. Activities Head no.of
consumption
No.of
Sold out
Revenue
(Kip)
1 Water buffalo
2 Cattle
3 Swine raising
4 Goat raising
5 Poultry raising
6 Fish pond culture
3. RICE PRODUCTION PRACTICES AND INCOME:
3.1. Farming contract
3.1.1. Do you have any farming contract with rice mill?
No, why not………………………………………………...…………………
Yes, what benefit do you get?...........................................................................
Other comment……………………………………………………….………
3.2. Preparatory Activities and Varietal Information
3.2.1. Cost of Fencing ____________________
3.2.2. Varietal Use
Variety
Used
Hybrid? Inbred? Area
(Ha)
Kg use
of seeds
Cost
per kg
Actual
cost
Cost
per ha
Purplish-blue
Non-
glutinous
Glutinous
3.2.3. Explain the steps of certified seed varieties
…………………………………………………………………………………
…………………………………………………………………………………
…………………………………………………………………………………
………………………………………………………………………………….

163
3.2.4. Where do you get seed varieties?
Home collecting Project cousin/Neighbor
Government Private sector Other…………………
3.3. Land preparation
3.3.1. What method did you use to plow? (Machine or Draft Animal)
Encircle, Identify How many
times
How many
days all in all Ownership
1
A. Machine
B. Draft Animal
1
a own b rental
IF Renting
Machine only, without labor Machine and Labor
Cost of rental Cost per ha* Cost Cost perha*
*to be computed
IF Owned
Cost of Diesel Cost of labor: Family
Hired
Cost of rental Cost per ha* Cost Cost per ha*
*to be computed
3.3.2. What method did you use in harrowing: (Machine or Carabao)
Encircle, Identify How many
times
How many days
all in all Ownership
1
A. Machine
B. Draft Animal
1
a own b rental
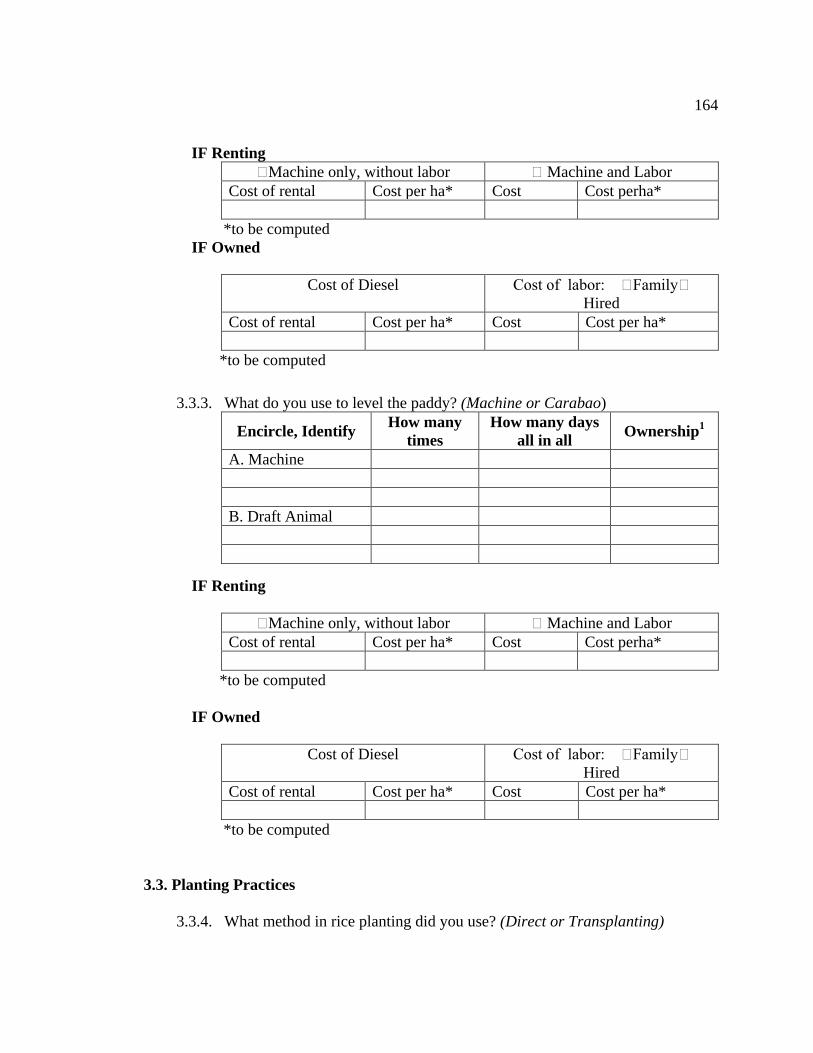
164
IF Renting
Machine only, without labor Machine and Labor
Cost of rental Cost per ha* Cost Cost perha*
*to be computed
IF Owned
Cost of Diesel Cost of labor: Family
Hired
Cost of rental Cost per ha* Cost Cost per ha*
*to be computed
3.3.3. What do you use to level the paddy? (Machine or Carabao)
Encircle, Identify How many
times
How many days
all in all Ownership
1
A. Machine
B. Draft Animal
IF Renting
Machine only, without labor Machine and Labor
Cost of rental Cost per ha* Cost Cost perha*
*to be computed
IF Owned
Cost of Diesel Cost of labor: Family
Hired
Cost of rental Cost per ha* Cost Cost per ha*
*to be computed
3.3. Planting Practices
3.3.4. What method in rice planting did you use? (Direct or Transplanting)

165
Transplanting
a. what age transplanted: __________
b. treatment, if any: chemical used_____________________ cost___________
c. how many seedlings per hill_______________
d. manpower used:
d.1 IF family labor
Number of people How many days Cost per/ha Total Cost*
* to be computed
d.2 IF hired labor: total cost___________________
3.4. Pest Management
3.4.1. Please tell me about the pests, diseases that attacked your rice field and your
control measures
Identify Alternative pest
management Actual cost* Cost per ha
Vegetative stage
1. Insects
2. Diseases
3. Weeds
Reproductive stage
1. Insects
2. Diseases
3. Weeds
Maturity stage
1. Insects
2. Diseases
3. Weeds
IF family labor
Number of people How many days Cost per/ha Total Cost*
* to be computed
IF hired labor: total cost___________________

166
3.5. Nutrient Management
Method of
Application
Kind of
Fertilizer
*Identify whether
Organic/Inorganic
Quantity
(kilograms
or liters)
Unit Cost
(kilogram
s or liters)
Actual
Cost**
Cost
per ha
Basal
Top dressing – 1
Top dressing – 2
Top dressing – 3
* 1 for organic, 2 for inorganic **to be computed
IF family labor
Number of people How many days Cost per/ha Total Cost*
* to be computed
IF hired labor: total cost___________________
3.5.1. How many organic fertilizers did you produce and put in rice field?
No. Types of organic fertilizer Produced in
ton/Kg/Liter
When did you put
in field?
1 Bokashi
2 Composts
3 Bio-Extract
3.6. Productivity and price
No. Rice production
Purplish-
blue rice
Non-
glutinous rice
Glutinous
rice Yield(Kg) Yield (Kg) Yield (Kg)
1 2008
2
2009
3.7. Disposal Practices
3.7.1. How many kilos do you retain for home consumption?
No. Rice variety Home
consumption (Kg)
Seed
(Kg)
Sold to
market Other
Kg price

167
1 purplish-blue
2 non-glutinous rice
3 glutinous rice
4
5

168
3.8. Harvesting Practices
3.8.1. Harvesting :
Harvesting operation Option Done by * Crop
sharing, % Cost/ha
Cutting Manual
Reaper
Hauling
Manual
Machine
Threshing Manual
Pedal
thresher
Mechanical
thresher
Drying Sun drying
Machine
Combined Reaper and
mechanical
thresher
Combine
harvester
* 1= family labor, 2= laborers, 3= machine rental, 4= contract service provider
3.8.2. Do you leave the rice crop in the field after cutting?
No Yes, how many day………………….
3.8.3. How do you do for field drying before threshing?
In pile spread in the field
3.8.4. Do you directly sell your rice after harvesting?
No Yes, how many % or ton………………………..
3.9. Post Harvest Practices
3.9.1. Handling system
3.9.1.1. How is your sacking system? Who is responsible for organic sack?
…………………………………………………………………………………
…………………………………………………………………………………
…………………………………………………………………………………

169
3.9.1.2. How do you transport paddy bags and separately which ones belong to
organic?
…………………………………………………………………………………
…………………………………………………………………………………
…………………………………………………………………………………
3.9.1.3. What problems did you face during harvesting period?
…………………………………………………………………………………
…………………………………………………………………………………
…………………………………………………………………………………
………………………………………………………………………………….
Drying
3.9.2. Where and how do you dry your rice?
Drying method Amount dried (% of total
production)
Distance to dryer (km)
Sun drying
Mechanical dryer
3.9.3. If you use a mechanical dryer, do you get a higher price for the paddy?
No Yes, how much………………….
Milling
3.9.4. How often do you mill rice?
Every week Two weeks Monthly
Other………………….
3.9.5. What is the milling recovery?
Type of rice How many kilos of paddy? How many kilos of milled rice?
3.9.6. Where do you mill rice, percent, and mode of payment?
Mill % specify Mode of payment
Home/manual mill
Village mill in cash………….Kip/Kg
In kind, Bran+broken rice
other….

170
Commercial mill in cash………….Kip/Kg
In kind, Bran+broken rice
other….
Storing
3.9.7. Where do you store your rice crop?
On the bags in house Granary Other……
3.9.8. If granary, what your granary made from?
Concrete and roofing by tile
Wooden and roofing by steel
Bamboo and roofing by grasses
other…………………………….
3.9.9. How much capacity?...........................................................................................
3.9.10. How many percent of moisture content?............................................................
3.9.11. How long do you store?
………………………………………………………………………………………
3.9.12. What are your problems in storage?
………………………………………………………………………………………
General Problems in Rice production
Major Problem this planting Season and how it was addressed: (climate, land prep,
seeds, pests, disease, labor, capital, others:
…………………………………………………………………………………………
…………………………………………………………………………………………
4. OTHER SOURCES OF INCOMES:
4.1. NTFPs collection: what kind of NTFPs do you usually collect for sale?
No. Items % of consumption % of sold Annual income 2009
1 Bamboo shoots
2 Rattan Shoots
3 Cardamom
4 Resin
5 Honey
6 Wild vegetables
7 Wildlife
8 Other………

171
4.2. Plantation: Do you have any commercial trees planting activity and what?
No. No. Yes No Items Commercial harvest Annual income 2009
1 Teak wood yes No
2 Rubber trees yes No
3 Agar wood yes No
4 Eucalyptus yes No
5 Other… yes No
4.3. Handicraft and weaving: what kind of the off-farming activity do you have?
No. Yes No Items Annual income 2009
1 Silk worm rising
2 Traditional cloths
3 Carving
4 Metal workshop
5 Bamboo weaving
6 Transport and service
7 Borehole driller
8 Other……………………
4.4. Trade: do you have any kind of trade below this? And how much did you
earn?
No. Yes No Items Annual income 2009
1 Small shop at house
2 small gas station at house
3 Plough machine
4 Threshing machine
5 Combined machine
6 Other……………………
4.5. Employment: Is there any your family member working with?
No. Yes No Items Annual income 2009
1 Local government
2 Garment
3 Wage Labor
4 House servant
5 Other……………………
4.6. CREDIT INFOMATION:
4.6.1. Where can you access sources of fund for rice cultivation investment?
Own fund Banks Village Revolving fund
Private sector Cousin Other financing…………

172
4.6.2. How about mechanism of payment a debt/loan?
pay back in kind pay back in cash Other…………..
Comment:………………………………………………………………………
…………………………………………………………………………………
…………………………………………………………………………………
4.7. TRAINING:
4.7.1. Kindly list down the training program you have attended since 2004 to
2009?
No. Training name When where Trained by
whom
1
2
3
4
5
4.7.2. Do you need training?
No Yes
4.7.3. If yes, what kind of training do you need?
1………………………………………………………………………………
2………………………………………………………………………………
3………………………………………………………………………………
4.8. ORGANIC CERTIFICATION:
4.8.1. When did you start recording farm?.....................................................................
4.8.2. How many time ICS inspects your farm per year? When? Where?
First time in the month of …………………….at house; Farm; other
Second time in the month of………………… at house; Farm; other
Third time in the month of…………………. at house; Farm; other
5. ORGANIC RICE FARMING CALENDAR No. Tasks Jan Feb Mar Apr May Jun Jul Aug Sep Oct Nov Dec
1 First plowing land
2 Leveling
3 Applying fertilizers
4 Seedling nursery
5 Second plowing land
6 Harrowing field
7 Uprooting seedlings

173
8 Transplanting
9 Weeding
10 Controlling pests
11 Harvesting
12 Drying
13 Threshing
14 Transporting
15 Storage
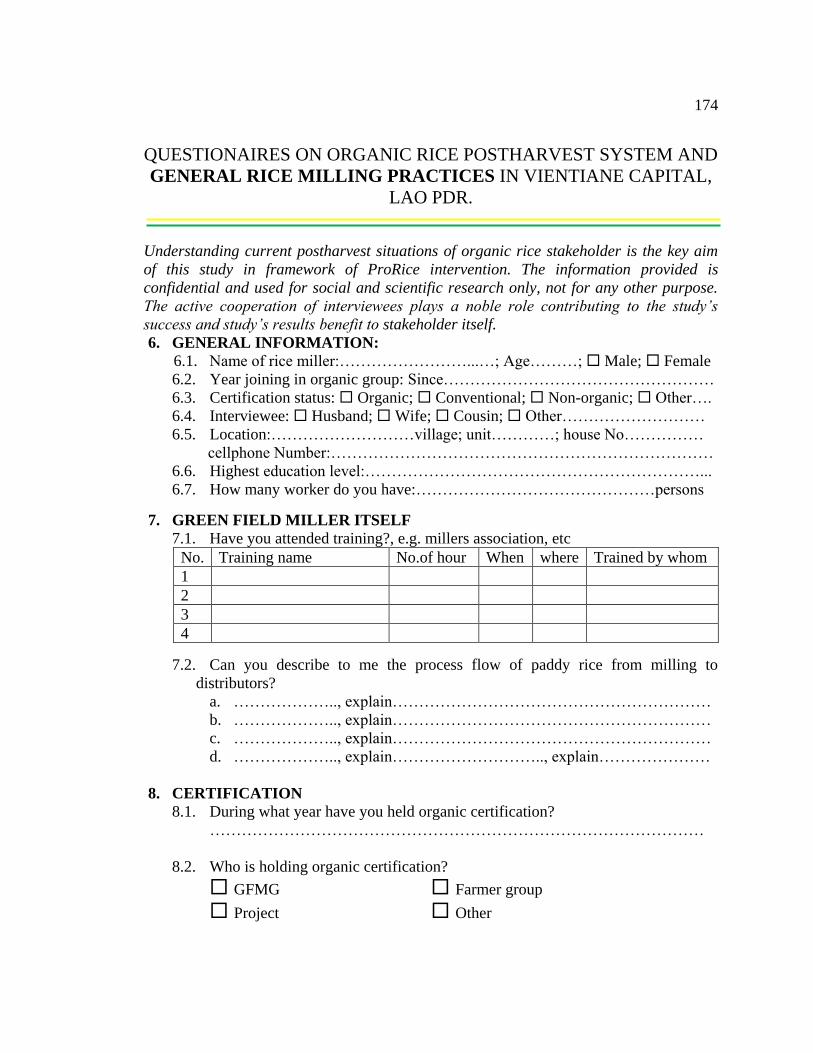
174
QUESTIONAIRES ON ORGANIC RICE POSTHARVEST SYSTEM AND
GENERAL RICE MILLING PRACTICES IN VIENTIANE CAPITAL,
LAO PDR.
Understanding current postharvest situations of organic rice stakeholder is the key aim
of this study in framework of ProRice intervention. The information provided is
confidential and used for social and scientific research only, not for any other purpose.
The active cooperation of interviewees plays a noble role contributing to the study’s
success and study’s results benefit to stakeholder itself.
6. GENERAL INFORMATION:
6.1. Name of rice miller:……………………...…; Age………; Male; Female
6.2. Year joining in organic group: Since……………………………………………
6.3. Certification status: Organic; Conventional; Non-organic; Other….
6.4. Interviewee: Husband; Wife; Cousin; Other………………………
6.5. Location:………………………village; unit…………; house No……………
cellphone Number:………………………………………………………………
6.6. Highest education level:………………………………………………………...
6.7. How many worker do you have:………………………………………persons
7. GREEN FIELD MILLER ITSELF
7.1. Have you attended training?, e.g. millers association, etc
No. Training name No.of hour When where Trained by whom
1
2
3
4
7.2. Can you describe to me the process flow of paddy rice from milling to
distributors?
a. ……………….., explain……………………………………………………
b. ……………….., explain……………………………………………………
c. ……………….., explain……………………………………………………
d. ……………….., explain……………………….., explain…………………
8. CERTIFICATION
8.1. During what year have you held organic certification?
…………………………………………………………………………………
8.2. Who is holding organic certification?
GFMG Farmer group
Project Other

175
8.3. Does you group have any inspection from external control body?
Yes No Who when How What to improve
8.4. Do you have a problem on organic certification?
No Yes
8.5. What kind of your problem? Please explain?
………………………………………………………………………………
9. SOURCE OF CREDIT
9.1. How do you finance your organization?
Personal money Government Cousin
Friends Microfinance Bank loan
9.2. How much credit is needed per year?....................................................................
9.3. What is your percentage of interest?
7% 12%
14% Other…………..
9.4. How is your payment back system?.......................................................................
10. PADDY COLLECTION:
10.1. Do you have any farming contract with organic farmers?
Yes No
10.2. If yes, how do you buy organic rice?
…………………………………………………………………………………
10.3. If no, how do you buy from organic farmers?
Clients make an order from you Farmers request
whenever farmers want to sell Other…………………………
10.4. How many tons of paddies can you purchase from farmers?
Conventional Organic
2008 2009 2008 2009
10.5. For organic rice, where do you purchase paddy?
Village 2008 (%) Village 2009 (%)
1. 1.
2. 2.

176
10.6. What materials did you provide to village collectors before purchasing?
Sacks Ropes Needles
Refilled phone card Money Grain quality tester
Moisture tester Other
10.7. Do you separately transport organic and non-organic paddy?
Yes we provide specific vehicle; No, we use same vehicle in the
same time
10.8. Do you reuse organic labeled sacks?
Yes No
10.9. If yes, how often one organic labeled bag use for paddy purchase?
……………………………………………………………………………………
10.10. What payment system do you deal with collectors?
Credits Cash Other
11. METHOD OF DRYING:
11.1. Do you dry paddy before milling?
Yes No
11.2. If yes, please specify your drying method
Mat drying drying pad machine
11.3. How many ton per year in amount of dried?.....................................................
12. MILLING PRACTICES:
12.1. Do you segregate organic from non-organic during milling?
Yes No
12.2. If yes, how do you clean machine before milling organic paddy?
…………………………………………………………………………………
12.3. In term of hygiene and cleaning, how often do you clean ricemill?
…………………………………………………………………………………
12.4. Do you have record keeping or audit trait?
Yes,…………………………………………………………………………
No,…………………………………………………………………………
13. RICE SORTING:
13.1. What are criteria for sorting?
…………………………………………………………………………………

177
13.2. How do you sort?
Manual sorting Machine sorting
13.3. What is capacity in ton of sorting per day?
…………………………………………………………………………………
13.4. If manual sorting, how many workers per day?.................................................
14. BAGGING:
14.1. What types of bag do you contain milled rice?
IRRI super bag Poly propylene Jute sack
Poly Ethylene other……………..
14.2. Do you separately bag for organic and non-organic?
Yes No
14.3. If yes, how do you label bags?
…………………………………………………………………………………
15. PACKAGING:
15.1. What type of pasteurized system do you use?
CO2 Heat Cool air
Vacuum Nothing other…
15.2. What size of rice packaging do you have?
½ Kg of plastic bag 1 Kg of plastic bag 1,5 Kgs of plastic bag
3 Kgs of plastic bag 6 Kgs of PE bag 12 Kgs of PE bag
25 Kgs of PE bag other…………………….
15.3. What type of packaging system do you use?
Vacuum packing Plastic enclosure packing
15.4. What is capacity in ton per day?
…………………………………………………………………………………
16. STORAGE MANAGEMENT:
16.1. What is paddy storage capacity?...................................................................Ton
16.2. What is your storage system?
Concrete floor on bags husk
Above ground wood pallets other……………………..

178
16.3. Do you separate storage for organic and non-organic commodity?
Yes No
16.4. If yes, how do you manage among paddy, milled rice commodities?
…………………………………………………………………………………
…………………………………………………………………………………
…………………………………………………………………………………
16.5. If no, what do you manage among paddy, milled rice commodities?
…………………………………………………………………………………
…………………………………………………………………………………
…………………………………………………………………………………
16.6. Does you group have any inspection from external control body?
Yes No
17. MARKETING CHANNELS:
17.1. Where do you get source of market information?
Search from media Families and friends other millers
Outside extension officers NGOs Private sectors
other……………
17.2. How do you market organic rice?
Advertising via media Discount sale Try out market
Credits sale Bonus given sellers Taste and sale
Joining any festival other…………………
17.3. To whom do you sell milled rice in 2008? Sold to whom Trading
contract
Qty Market Destination Mode of payment
A. Exporters Yes No Kg/T Domestic International Credit Cash Other
B. Private Yes No Kg/T Domestic International Credit Cash Other
C. Government Yes No Kg/T Domestic International Credit Cash Other

179
17.4. To whom do you sell milled rice in 2009? Sold to whom Trading
contract
Qty Market Destination Mode of payment
A. Exporters Yes No Kg/T Domestic International Credit Cash Other
B. Private Yes No Kg/T Domestic International Credit Cash Other
C. Government Yes No Kg/T Domestic International Credit Cash Other
17.5. Explain shipping steps?(international standard steps)
…………………………………………………………………………………
…………………………………………………………………………………
…………………………………………………………………………………
17.6. Describe quarantine process
…………………………………………………………………………………
…………………………………………………………………………………
…………………………………………………………………………………
17.7. Describe about fumigation step during shipping
…………………………………………………………………………………
…………………………………………………………………………………
…………………………………………………………………………………
17.8. What kind of documentation are you in process?
Phytosanitary Shipping contract
Business license Organic certification
HACCP GMP ISO9000 ISO14000 Fair-trade certification
Free chemical test result Other………………….
17.9. What problems do you have in organic rice supply chain?
…………………………………………………………………………………
…………………………………………………………………………………
…………………………………………………………………………………

180
17.10. What is your strategic plan in the future?
…………………………………………………………………………………
…………………………………………………………………………………
…………………………………………………………………………………
17.11. What is GFMG production capacity in average?
No. Milling
type
Milling
capacity
Tons/day
Operation hour per Milling
recovery % Whole grain in
white rice %
Broken rice %
day month year IN OUT Large Small
1
2
3
4
Total
17.12. Details of rice mill
Power source Power consumption Paddy through put per day
Diesel engine L/hr Kg
Electric motor KW/hr Ton
Other………
17.13. Rice mill model
Type Pre-
cleaner
Steel
huller
Rubber
roller
Paddy
separator
Steel
polisher
Stone
polisher
Rotary
sifter
Length
grader
Yes
No

181
Interview guideline for Village Collectors (marketers)
1. TRAINING ATTENDANCE
1.1. How long have you been working for village collector?......................................................
1.2. Since when?.........................................................................................................................
1.3. What training course do you receive during project cycle?
No. Training
name No. of day When where Trained by whom*
1
2
3
4
5 * trained by 1= DAFES; 2= FAFES; 3= Project; 4= Private company
1.4. Do you need training?
No Yes
1.5. If yes, what kind of training do you need?
1………………………………………………………………………………
2………………………………………………………………………………
3………………………………………………………………………………
2. POST HARVEST INFORMATION
A. MOISTURE CONTENT
2.1. How do you understand moisture content? Please explain?
……………………………………………………………………………………………
2.2. What is the importance of moisture content?
……………………………………………………………………………………………
2.3. Do you measure paddy moisture content before purchasing paddy?
No, why………………………………………………………………………………
Yes,
2.4. If yes, how and what kind of you moisture meter did you use?
Wooden grinder, explain………………………………………………………………
See and touch, explain…………………………………………………………………
Biting, explain…………………………………………………………………………
Other, …………………………………………………………………………..…….
2.5. Do you have different price for low or high moisture content?
No, why……………………………………………………………..………………..
Yes, How…………………………………………………………………………….

182
B. DRYING PRACTICES
2.6. Do farmers use flat bed dryers?
Yes,
No, why don’t farmers use…………………………………………………………….
2.7. If yes, how many of farmers use flat bed dryers which are installed by project?
……………………………………………………………………………………………
2.8. How much do farmers pay for mechanical drying service?
……………………………………………………………………………………………
2.9. Do you pay more for farmers who use of flat bed dryer?
Yes, how much per Kg?.................................................................................................
No, why don’t pay higher price……………………………………………………….
2.10. What is your recommendation regarding the use of flat bed dryer?
Extend, because………………………………………………………………………..
Reduce; stop…………………………………………………………………………...
Do no change…………………………………………………………………………..
Do not know…………………………………………………………………………...
Other…………………………………………………………………………………...
3. MARKET INFORMATION ACCESSIBILITY
3.1. Can you recall paddy price since you started as village collector?
Paddy price in Lao Kip
Year Jan Feb Mar Apr May Jun Jul Aug Sep Oct Nov Dec
2007
2008
2009
3.2. Do you inform farmers about rice price prior to buy?
Yes,
No, why and how………………………………………………………………………
3.3. If yes, how do you inform them?
Village Radio Village meeting
Put notice paper on village news board panel other………………………
3.4. Do farmers sell in bulk paddy for one time?
Yes,
No,
3.5. If no, which period do farmer usually sells a lot of paddy?
……………………………………………………………………………………………
3.6. Who identify you the pricing system?
Green Field Miller Groups Government
Project Farmers
Current marketing price other……………

183
4. PADDY PURCHASING MECHANISM
4.1. How do you sell rice?
Sale with contract, to whom………………………………………………………...
Sale without contract, to whom……………………………………………………..
4.2. Do you sell organic paddy to whom?
Somphone ricemill Somehong ricemill
Southas ricemill DaoPakay ricemill
Village collectors of ………………… Other…………….
4.3. What types of variety those indicate as organic?
Rice Varieties
Payment
scheme Sold paddy in 2009
(tons) Credit Cash
Homsangthong(Glutinous rice)
Homesavanh(Non-glutinous rice)
Homnangnuan(Non-glutinous rice)
KhaoKam(Purplish-Blue/black Rice)
4.4. How many farmers are in your group?
…………………………………………………………………………………………
4.5. How many farmer sell to GFMG directly?
No. Green Field Miller Group No.of farmers
1 Somphone ricemill
2 Somehong ricemill
3 Southas ricemill
4 DaoPakay ricemill
TOTAL
5. PAYMENT SYSTEM
5.1. Where do you get fund to pay paddy rice?
In 2008 In 2009
Source of fund Amount Interest
rate Source of fund Amount
Interest
rate
Bank Bank
Revolving fund Revolving fund
GFMG GFMG
Othe Other
6. RECEIPT/BILL USE FOR REIMBURSEMENT
6.1. Do you issue receipt?
No, Yes,

184
6.2. If yes, what is the purpose of issuing receipt?
………………………………………………………………………………………………
………………………………………………………………………………………………
6.3. Do you give premium price to certified farmers?
No,
Yes, how…………………………………………………………………………….
6.4. Which organization subsidise them for premium payment?
Government Project
Green Field Miller Groups International Organic Markets
Fair-Trade Other…………………………
7. TRANSPORTATION TO RICE MILLS
7.1. How many day paddy stay in your storage are before GFMG comes?
………………………………………………………………………………………………
………………………………………………………………………………………………
7.2. How do you transport paddy rice to milling company?
wait for GFMG vehicle, bring it by myself,
mainly GFMG, some myself mainly myself, some GFMG
Why?......................................................................................................................................
8. TRACEABILITY
8.1. How do you distinguish certified organic farmers in your group?
Coordinate ICS and ask a final approval list of certified farmers
Join inspection
Other………………………………………
8.2. How can you check the amount of annual crop yield from each certified organic farmer?
Check individual farm recorded documents, Ask summary sheets from
ICS,
ICS check and approve it, other……………………
8.3. What is your tracking system to ensure purity of organic commodity?
organic labelled bags, organic receipts,
ICS monitoring files, other……………………………..

185
FIELD EXPERIMENTAL RESEARCH IN LAO.PDR Duration: ……………………….
OBJECTIVES:
1. Determine how farm practices and labor availability attaches MC in storage
2. Assess functioning of flat-bed dryers and drying cost
3. Identify what potential benefits for farmers are
INSTRUMENTATION NEEDED:
Moisture meter, scale 60kg, scale 1kg, thermometer, humidity meter, anemometer,
laboratory husker, laboratory polisher, indented sheet sorter, measuring flask to
measuring fuel consumption, stopwatch, and pressure gage.
1. PADDY MOISTURE TESTS IN GRANARIES OF EACH VILLAGE.
Village and
Family
name
Types of
organic rice
Farm operation
Active
labor/ha
No.of day leaves
cut panicles in
field
RH
(%)
Temp
(°C)
MC
(%)
Location
of storage
Weather
during
harvest
Haitai1
Haitai2
Haitai3
Haitai4
Haitai5
Haitai6
Haitai7
Haitai8
NasaoNang1
NasaoNang2
NasaoNang3
NasaoNang4
NasaoNang5
NasaoNang6
NasaoNang7
NasaoNang8
Pakthep1
Pakthep2
Pakthep3
Pakthep4
Pakthep5
Pakthep6
Pakthep7
Pakthep8
Natarn1
Natarn2

186
Natarn3
Natarn4
Natarn5
Natarn6
Natarn7
Natarn8
Natiem1
Natiem2
Natiem3
Natiem4
Natiem5
Natiem6
Natiem7
Natiem8
Nalard1
Nalard2
Nalard3
Nalard4
Nalard5
Nalard6
Nalard7
Nalard8
Namieng1
Namieng2
Namieng3
Namieng4
Namieng5
Namieng6
Namieng7
Namieng8
TaoHai1
TaoHai2
TaoHai3
TaoHai4
TaoHai5
TaoHai6
TaoHai7
TaoHai8
TaoHai9
NaHoiPang1
NaHoiPang2
NaHoiPang3
NaHoiPang4
NaHoiPang5
NaHoiPang6

187
NaHoiPang7
NaHoiPang8
HaiNua1
HaiNua2
HaiNua3
HaiNua4
HaiNua5
HaiNua6
HaiNua7
HaiNua8
2. FLAT-BED DRYER EXAMINATION
2.1. Technical specifications (Reversible dryer)
2.1.1. Drying performance
No. Flat-bed dryer
(Pialath village)
Capacity
(T/batch)
Grain
depth (m)
Ambient
air temp
(°C)
Ambient
air RH
(°C)
Drying
air temp
(°C)
Drying air
velocity
(m/s)
Drying
rate
(%/hour)
1 Glutinous
2 Non-glutinous
3 Purplish-blue
2.1.2. Drying bin
No. Flat-bed dryer
Steel drying bin Perforated steel
sheet
Expanded steel
sheet
Length
(m)
Width
(m)
Height
(m)
Weight
(Ton)
Diameter
(mm)
Thick
(mm)
Mesh
(mm)
Thick
(mm)
1 FBD No.1
(Pialath village)
2.1.3. Fan and Heat Options
No. Fan (Axial vane
type)
Operation Dimensions
Diameter
(mm)
Speed
(r/min)
Airflow
(m3/h)
Pressure
(Pa)
Weight
(kg)
Length
(m)
Width
(m)
Height
(m)
1 FBD No.1
(Pialath village)
2.1.4. Drive Options
No. Flat-bed dryer
Gasoline engine Electric motor
Capacity
(hp)
Fuel Consumption
(L/hour) Capacity (hp)
Power Consumption
(Kw/h)
1 FBD No.1
(Pialath village)
- - 2.2

188
2.2. How to use and operate Flat-Bed Dryer
………………………………………………………………………………………
………………………………………………………………………………………
………………………………………………………………………………………
………………………………………………………………………………………
………………………………………………………………………………………
………………………………………………………………………………………
PADDY DRYING EXAMINATION AND SAMPLES COLLECTION
1. GLUTINOUS RICE
No. Treatment parameter Mechanical
drying
Sun drying
MC>14%
Air drying in
the shade
1 Initial weight (kg)
2 Final weight (kg)
3 Initial MC%
4 Final MC%
5 Grain depth (m)
6 Ambient air temperature (°C)
7 Drying air temperature (°C)
8 Drying air velocity (m/s)
9 Water removal from grain (kg)
10 Moisture reduction (%)
11 Drying time (hour)
12 Dryer’s capacity (t)
13 Drying rate (%/h)
14 Fuel consumption (L/batch or L/t)
15 Electricity consumption (kwh/batch or kwh/t)
16 Labor requirement (labor/batch or labor/t)
17 Cost of charcoal per batch (50 kg)
18 Milling recovery %
19 Discolorated grain %
20 Head rice recovery %
21 Broken %
22 Rice bran %
2. NON-GLUTINOUS RICE
No. Treatment parameter Mechanical
drying
Sun drying
MC>14%
Air drying in
the shade
1 Initial weight (kg)
2 Final weight (kg)
3 Initial MC%
4 Final MC%
5 Grain depth (m)
6 Ambient air temperature (°C)
7 Drying air temperature (°C)
8 Drying air velocity (m/s)

189
9 Water removal from grain (kg)
10 Moisture reduction (%)
11 Drying time (hour)
12 Dryer’s capacity (t)
13 Drying rate (%/h)
14 Fuel consumption (L/batch or L/t)
15 Electricity consumption (kwh/batch or kwh/t)
16 Labor requirement (labor/batch or labor/t)
17 Cost of charcoal per batch (37 kg)
18 Milling recovery %
19 Discolorated grain %
20 Head rice recovery %
21 Broken %
22 Rice bran %
3. PURPLISH-BLUE RICE
No. Treatment parameter Mechanical
drying
Sun drying
MC>14%
Air drying in
the shade
1 Initial weight (kg)
2 Final weight (kg)
3 Initial MC%
4 Final MC%
5 Grain depth (m)
6 Ambient air temperature (°C)
7 Drying air temperature (°C)
8 Drying air velocity (m/s)
9 Water removal from grain (kg)
10 Moisture reduction (%)
11 Drying time (hour)
12 Dryer’s capacity (t)
13 Drying rate (%/h)
14 Fuel consumption (L/batch or L/t)
15 Electricity consumption (kwh/batch or kwh/t)
16 Labor requirement (labor/batch or labor/t)
17 Cost of charcoal per batch (25 kg)
18 Milling recovery %
19 Discolorated grain %
20 Head rice recovery %
21 Broken %
22 Rice bran %
4. GRAIN SIZE AND SHAPE
No. Types of rice
PADDY SIZE
(mm)
BROWN RICE
SIZE (mm) GRAIN SHAPE
Length Width Length Width Slender Medium Bold Round
1 Glutinous rice
2 Glutinous rice
3 Glutinous rice
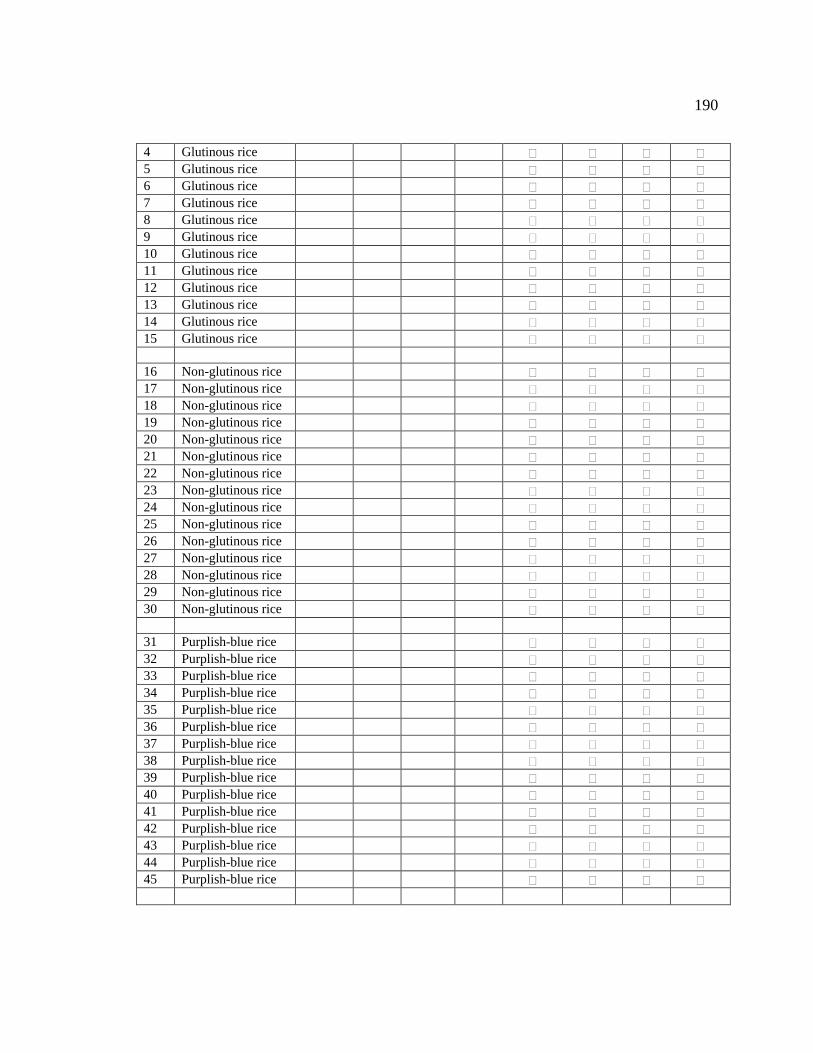
190
4 Glutinous rice
5 Glutinous rice
6 Glutinous rice
7 Glutinous rice
8 Glutinous rice
9 Glutinous rice
10 Glutinous rice
11 Glutinous rice
12 Glutinous rice
13 Glutinous rice
14 Glutinous rice
15 Glutinous rice
16 Non-glutinous rice
17 Non-glutinous rice
18 Non-glutinous rice
19 Non-glutinous rice
20 Non-glutinous rice
21 Non-glutinous rice
22 Non-glutinous rice
23 Non-glutinous rice
24 Non-glutinous rice
25 Non-glutinous rice
26 Non-glutinous rice
27 Non-glutinous rice
28 Non-glutinous rice
29 Non-glutinous rice
30 Non-glutinous rice
31 Purplish-blue rice
32 Purplish-blue rice
33 Purplish-blue rice
34 Purplish-blue rice
35 Purplish-blue rice
36 Purplish-blue rice
37 Purplish-blue rice
38 Purplish-blue rice
39 Purplish-blue rice
40 Purplish-blue rice
41 Purplish-blue rice
42 Purplish-blue rice
43 Purplish-blue rice
44 Purplish-blue rice
45 Purplish-blue rice

191
5. QRAIN QUALITY ANALYSIS IN RCRC-LABORATORY of NAPOK STATION
5.1. HomSangThong Aromatic Glutinous Rice: Rice
samples
Sample’s
weight (g)
Brown
rice (%)
Milled
rice (%) Hull (%)
Rice bran
(%)
Broken
(%)
Head rice
(%)
Mechanical Drying Treatment
Top1.1 250
Top1.2 250
Top1.3 250
Top2.1 250
Top2.2 250
Top2.3 250
Top3.1 250
Top3.2 250
Top3.3 250
SubMD1
Middle1.1 250
Middle1.2 250
Middle1.3 250
Middle2.1 250
Middle2.2 250
Middle2.3 250
Middle3.1 250
Middle3.2 250
Middle3.3 250
SubMD2
Bottom1.1 250
Bottom1.2 250
Bottom1.3 250
Bottom2.1 250
Bottom2.2 250
Bottom2.3 250
Bottom3.1 250
Bottom3.2 250
Bottom3.3 250
SubMD3
TotalMD
Sun Drying Treatment
SD1 250
SD2 250
SD3 250
TotalSD
Air Shade Drying Treatment
ASD1 250
ASD2 250
ASD3 250
TotalASD

192
5.2. HomSaVanh Aromatic Non-Glutinous Rice: Rice
samples
Sample’s
weight (g)
Brown
rice (%)
Milled
rice (%) Hull (%)
Rice bran
(%)
Broken
(%)
Head rice
(%)
Mechanical Drying Treatment
Top1.1 250
Top1.2 250
Top1.3 250
Top2.1 250
Top2.2 250
Top2.3 250
Top3.1 250
Top3.2 250
Top3.3 250
SubMD1
Middle1.1 250
Middle1.2 250
Middle1.3 250
Middle2.1 250
Middle2.2 250
Middle2.3 250
Middle3.1 250
Middle3.2 250
Middle3.3 250
SubMD2
Bottom1.1 250
Bottom1.2 250
Bottom1.3 250
Bottom2.1 250
Bottom2.2 250
Bottom2.3 250
Bottom3.1 250
Bottom3.2 250
Bottom3.3 250
SubMD3
Total MD
Sun Drying Treatment
SD1 250
SD2 250
SD3 250
TotalSD
Air Shade Drying Treatment
ASD1 250
ASD2 250
ASD3 250
TotalASD

193
5.3. Purplish-Blue Rice: Rice
samples
Sample’s
weight (g)
Brown
rice (%)
Milled
rice (%) Hull (%)
Rice bran
(%)
Broken
(%)
Head rice
(%)
Mechanical Drying Treatment
Top1.1 250
Top1.2 250
Top1.3 250
Top2.1 250
Top2.2 250
Top2.3 250
Top3.1 250
Top3.2 250
Top3.3 250
SubMD1
Middle1.1 250
Middle1.2 250
Middle1.3 250
Middle2.1 250
Middle2.2 250
Middle2.3 250
Middle3.1 250
Middle3.2 250
Middle3.3 250
SunMD2
Bottom1.1 250
Bottom1.2 250
Bottom1.3 250
Bottom2.1 250
Bottom2.2 250
Bottom2.3 250
Bottom3.1 250
Bottom3.2 250
Bottom3.3 250
SubMD3
TotalMD
Sun Drying Treatment
SD1 250
SD2 250
SD3 250
TotalSD
Air Shade Drying Treatment
ASD1 250
ASD2 250
ASD3 250
TotalASD

194
APPENDIX C
Paddy Weight Computation Uses for the Quality Payment (Table 41 – 43)
11 12 13 14 15 16 17 18 19 20 21 22 23 24
36 0.72 0.73 0.74 0.74 0.75 0.76 0.77 0.78 0.79 0.80 0.81 0.82 0.83 0.84
35 0.73 0.74 0.75 0.76 0.76 0.77 0.78 0.79 0.80 0.81 0.82 0.83 0.84 0.86
34 0.74 0.75 0.76 0.77 0.78 0.79 0.80 0.80 0.81 0.83 0.84 0.85 0.86 0.87
33 0.75 0.76 0.77 0.78 0.79 0.80 0.81 0.82 0.83 0.84 0.85 0.86 0.87 0.88
32 0.76 0.77 0.78 0.79 0.80 0.81 0.82 0.83 0.84 0.85 0.86 0.87 0.88 0.89
31 0.78 0.78 0.79 0.80 0.81 0.82 0.83 0.84 0.85 0.86 0.87 0.88 0.90 0.91
30 0.79 0.80 0.80 0.81 0.82 0.83 0.84 0.85 0.86 0.88 0.89 0.90 0.91 0.92
29 0.80 0.81 0.82 0.83 0.84 0.85 0.86 0.87 0.88 0.89 0.90 0.91 0.92 0.93
28 0.81 0.82 0.83 0.84 0.85 0.86 0.87 0.88 0.89 0.90 0.91 0.92 0.94 0.95
27 0.82 0.83 0.84 0.85 0.86 0.87 0.88 0.89 0.90 0.91 0.92 0.94 0.95 0.96
26 0.83 0.84 0.85 0.86 0.87 0.88 0.89 0.90 0.91 0.93 0.94 0.95 0.96 0.97
25 0.84 0.85 0.86 0.87 0.88 0.89 0.90 0.91 0.93 0.94 0.95 0.96 0.97 0.99
24 0.85 0.86 0.87 0.88 0.89 0.90 0.92 0.93 0.94 0.95 0.96 0.97 0.99 1.00
23 0.87 0.88 0.89 0.90 0.91 0.92 0.93 0.94 0.95 0.96 0.97 0.99 1.00
22 0.88 0.89 0.90 0.91 0.92 0.93 0.94 0.95 0.96 0.98 0.99 1.00
21 0.89 0.90 0.91 0.92 0.93 0.94 0.95 0.96 0.98 0.99 1.00
20 0.90 0.91 0.92 0.93 0.94 0.95 0.96 0.98 0.99 1.00
19 0.91 0.92 0.93 0.94 0.95 0.96 0.98 0.99 1.00
18 0.92 0.93 0.94 0.95 0.96 0.98 0.99 1.00
17 0.93 0.94 0.95 0.97 0.98 0.99 1.00
16 0.94 0.95 0.97 0.98 0.99 1.00
15 0.96 0.97 0.98 0.99 1.00
14 0.97 0.98 0.99 1.00
13 0.98 0.99 1.00
12 0.99 1.00
11 1.00
% Final MC of 1 kg paddy
% In
itial
MC
of 1
kg
padd
y

195
APPENDIX D
Results of Statistical Analysis with SAS 9.1
Regression analysis
of %MC correlated with Labor, ha, field drying, and drying methods The SAS System 12:58 Friday, March 11, 2011 19 ----------------------------------------------- type=1 ---------------------------------- The GLM Procedure Number of Observations Read 16 Number of Observations Used 16 The SAS System 12:58 Friday, March 11, 2011 20 ----------------------------------------------- type=1 ---------------------------------- The GLM Procedure Dependent Variable: mc Sum of Source DF Squares Mean Square F Value Pr > F Model 4 5.01365818 1.25341455 0.35 0.8401 Error 11 39.62384182 3.60216744 Corrected Total 15 44.63750000 R-Square Coeff Var Root MSE mc Mean 0.112319 13.59311 1.897938 13.96250 Source DF Type I SS Mean Square F Value Pr > F labor 1 4.12408228 4.12408228 1.14 0.3075 ha 1 0.10143041 0.10143041 0.03 0.8698 days 1 0.27716590 0.27716590 0.08 0.7866 kind 1 0.51097959 0.51097959 0.14 0.7136 Source DF Type III SS Mean Square F Value Pr > F labor 1 3.89996511 3.89996511 1.08 0.3204 ha 1 0.00030305 0.00030305 0.00 0.9928 days 1 0.04195466 0.04195466 0.01 0.9160 kind 1 0.51097959 0.51097959 0.14 0.7136 Standard Parameter Estimate Error t Value Pr > |t| Intercept 15.52911812 4.04270785 3.84 0.0027 labor -0.50125147 0.48173394 -1.04 0.3204 ha -0.00437582 0.47707238 -0.01 0.9928 days 0.09481843 0.87858671 0.11 0.9160 kind -0.35308773 0.93748171 -0.38 0.7136

196
The SAS System 12:58 Friday, March 11, 2011 21 ----------------------------------------------- type=2 ---------------------------------- The GLM Procedure Number of Observations Read 16 Number of Observations Used 16 The SAS System 12:58 Friday, March 11, 2011 22 ----------------------------------------------- type=2 ---------------------------------- The GLM Procedure Dependent Variable: mc Sum of Source DF Squares Mean Square F Value Pr > F Model 4 20.24506390 5.06126597 2.80 0.0791 Error 11 19.85243610 1.80476692 Corrected Total 15 40.09750000 R-Square Coeff Var Root MSE mc Mean 0.504896 8.716406 1.343416 15.41250 Source DF Type I SS Mean Square F Value Pr > F labor 1 13.38775641 13.38775641 7.42 0.0198 ha 1 4.75515386 4.75515386 2.63 0.1328 days 1 1.63558786 1.63558786 0.91 0.3616 kind 1 0.46656577 0.46656577 0.26 0.6212 Source DF Type III SS Mean Square F Value Pr > F labor 1 12.37116040 12.37116040 6.85 0.0239 ha 1 3.38215626 3.38215626 1.87 0.1983 days 1 2.09970631 2.09970631 1.16 0.3038 kind 1 0.46656577 0.46656577 0.26 0.6212 Standard Parameter Estimate Error t Value Pr > |t| Intercept 20.10390474 1.63730389 12.28 <.0001 labor -1.19694344 0.45717131 -2.62 0.0239 ha -0.36321241 0.26532270 -1.37 0.1983 days -0.06121189 0.05675016 -1.08 0.3038 kind -0.46623015 0.91696864 -0.51 0.6212

197
The SAS System 12:58 Friday, March 11, 2011 23 ----------------------------------------------- type=3 ---------------------------------- The GLM Procedure Number of Observations Read 52 Number of Observations Used 52 The SAS System 12:58 Friday, March 11, 2011 24 ----------------------------------------------- type=3 ---------------------------------- The GLM Procedure Dependent Variable: mc Sum of Source DF Squares Mean Square F Value Pr > F Model 4 8.3893005 2.0973251 0.51 0.7271 Error 47 192.5005072 4.0957555 Corrected Total 51 200.8898077 R-Square Coeff Var Root MSE mc Mean 0.041761 12.64721 2.023797 16.00192 Source DF Type I SS Mean Square F Value Pr > F labor 1 1.79345279 1.79345279 0.44 0.5114 ha 1 0.00185527 0.00185527 0.00 0.9831 days 1 0.14662301 0.14662301 0.04 0.8507 kind 1 6.44736945 6.44736945 1.57 0.2158 Source DF Type III SS Mean Square F Value Pr > F labor 1 1.88251318 1.88251318 0.46 0.5011 ha 1 0.04410716 0.04410716 0.01 0.9178 days 1 0.01053809 0.01053809 0.00 0.9598 kind 1 6.44736945 6.44736945 1.57 0.2158 Standard Parameter Estimate Error t Value Pr > |t| Intercept 16.92925236 1.18624748 14.27 <.0001 labor -0.15914358 0.23474001 -0.68 0.5011 ha -0.03173291 0.30578936 -0.10 0.9178 days -0.00774209 0.15263147 -0.05 0.9598 kind -0.61169682 0.48754191 -1.25 0.2158

198
Analysis of variance (ANOVA)
Three treatments: mechanical, sun, and shade drying
(3 treatments in 1 run: unbalanced)
The SAS System 21:39 Saturday, March 12, 2011 21 The GLM Procedure
Class Level Information
Class Levels Values
Var 3 1 2 3
Trt 3 1 2 3 Number of Observations Read 99 Number of Observations Used 99 The SAS System 21:39 Saturday, March 12, 2011 22 The GLM Procedure Dependent Variable: MR Sum of Source DF Squares Mean Square F Value Pr > F Model 8 1897.417298 237.177162 230.14 <.0001 Error 90 92.752370 1.030582 Corrected Total 98 1990.169669 R-Square Coeff Var Root MSE MR Mean 0.953395 1.499577 1.015176 67.69747 Source DF Type I SS Mean Square F Value Pr > F Var 2 1891.649287 945.824643 917.76 <.0001 trt 2 1.069091 0.534545 0.52 0.5971 var*trt 4 4.698921 1.174730 1.14 0.3429 Source DF Type III SS Mean Square F Value Pr > F Var 2 1891.649287 945.824643 917.76 <.0001 trt 2 1.069091 0.534545 0.52 0.5971 var*trt 4 4.698921 1.174730 1.14 0.3429 The SAS System 21:39 Saturday, March 12, 2011 23 The GLM Procedure
Least Squares Means
LSMEAN Var MR LSMEAN Number
1 64.5769136 1 2 64.8864198 2 3 73.0981481 3

199
Least Squares Means effect var
Pr > |t| for H0 : LSMEAN (i) = LSMEAN (j)
Dependent Variable: MR
i/j 1 2 3
1 0.4427 <.0001 2 0.4427 <.0001 3 <.0001 <.0001 NOTE: To ensure overall protection level, only probabilities associated with pre-planned comparisons should be used.
LSMEAN trt MR LSMEAN Number
1 67.6625926 1 2 68.0255556 2 3 67.6833333 3
Least Squares Means effect trt Pr > |t| for H0 : LSMEAN (i) = LSMEAN (j)
Dependent Variable: MR
i/j 1 2 3
1 0.3116 0.9538 2 0.4427 0.4764 3 0.9538 0.4764 NOTE: To ensure overall protection level, only probabilities associated with pre-planned comparisons should be used. The SAS System 21:39 Saturday, March 12, 2011 24 The GLM Procedure
Least Squares Means
LSMEAN var trt MR LSMEAN Number 1 1 64.7140741 1 1 2 65.1966667 2 1 3 63.2800000 3 2 1 64.4059259 4 2 2 64.9700000 5 2 3 65.2833333 6 3 1 73.8677778 7 3 2 73.9100000 8 3 3 73.9466667 9

200
Least Squares Means effect var*trt Pr > |t| for H0 : LSMEAN (i) = LSMEAN (j)
Dependent Variable: MR
i/j 1 2 3 4 5 6 7 8 9 1 0.4368 0.1513 0.2677 0.6797 0.3593 <.0001 <.0001 <.0001 2 0.4368 0.1002 0.2039 0.7851 0.9170 <.0001 <.0001 <.0001 3 0.1513 0.1002 0.3455 0.1687 0.0809 <.0001 <.0001 <.0001 4 0.2677 0.2039 0.3455 0.3637 0.1590 <.0001 <.0001 <.0001 5 0.6797 0.7851 0.1687 0.3637 0.7063 <.0001 <.0001 <.0001 6 0.3593 0.9170 0.0809 0.1590 0.7063 <.0001 <.0001 <.0001 7 <.0001 <.0001 <.0001 <.0001 <.0001 <.0001 0.9457 0.8987 8 <.0001 <.0001 <.0001 <.0001 <.0001 <.0001 0.9457 0.9648 9 <.0001 <.0001 <.0001 <.0001 <.0001 <.0001 0.8987 0.9648 NOTE: To ensure overall protection level, only probabilities associated with pre-planned comparisons should be used. ----------------------------------------------------------------------------------------- The SAS System 21:39 Saturday, March 12, 2011 26 The GLM Procedure
Dependent Variable: HR Sum of Source DF Squares Mean Square F Value Pr > F Model 8 1713.619270 214.202409 76.63 <.0001 Error 90 251.562459 2.795138 Corrected Total 98 1965.181729 R-Square Coeff Var Root MSE MR Mean 0.871990 3.304170 1.671867 50.59869 Source DF Type I SS Mean Square F Value Pr > F Var 2 779.6017354 389.8008677 139.46 <.0001 trt 2 535.5722009 267.7861004 95.80 <.0001 var*trt 4 398.4453338 99.6113334 35.64 <.0001 Source DF Type III SS Mean Square F Value Pr > F Var 2 116.4354083 58.2177042 20.83 <.0001 trt 2 535.5722009 267.7861004 95.80 <.0001 var*trt 4 398.4453338 99.6113334 35.64 <.0001 The SAS System 21:39 Saturday, March 12, 2011 27

201
The GLM Procedure
Least Squares Means
LSMEAN Var MR LSMEAN Number
1 48.2366667 1 2 47.6469136 2 3 51.6017284 3
Least Squares Means effect var Pr > |t| for H0 : LSMEAN (i) = LSMEAN (j)
Dependent Variable: HR
i/j 1 2 3
1 0.3748 <.0001 2 0.3748 <.0001 3 <.0001 <.0001 NOTE: To ensure overall protection level, only probabilities associated with pre-planned comparisons should be used.
LSMEAN trt MR LSMEAN Number
1 51.1375309 1 2 43.4233333 2 3 52.9244444 3
Least Squares Means effect trt Pr > |t| for H0 : LSMEAN (i) = LSMEAN (j)
Dependent Variable: HR
i/j 1 2 3
1 <.0001 0.0031 2 <.0001 <.0001 3 0.0031 <.0001 NOTE: To ensure overall protection level, only probabilities associated with pre-planned comparisons should be used.

202
The SAS System 21:39 Saturday, March 12, 2011 28 The GLM Procedure
Least Squares Means
LSMEAN var trt MR LSMEAN Number 1 1 48.2700000 1 1 2 46.4566667 2 1 3 49.9833333 3 2 1 49.4940741 4 2 2 44.8466667 5 2 3 48.6000000 6 3 1 55.6485185 7 3 2 38.9666667 8 3 3 60.1900000 9
Least Squares Means effect var*trt Pr > |t| for H0 : LSMEAN (i) = LSMEAN (j)
Dependent Variable: HR
i/j 1 2 3 4 5 6 7 8 9 1 0.0781 0.0957 0.0085 0.0011 0.7464 <.0001 <.0001 <.0001 2 0.0781 0.0114 0.0036 0.2413 0.1199 <.0001 <.0001 <.0001 3 0.0957 0.0114 0.6318 0.0003 0.3136 <.0001 <.0001 <.0001 4 0.0085 0.0036 0.6318 <.0001 0.3819 <.0001 <.0001 <.0001 5 0.0011 0.2413 0.0003 <.0001 0.0072 <.0001 <.0001 <.0001 6 0.7464 0.1199 0.3136 0.3819 0.0072 <.0001 <.0001 <.0001 7 <.0001 <.0001 <.0001 <.0001 <.0001 <.0001 <.0001 <.0001 8 <.0001 <.0001 <.0001 <.0001 <.0001 <.0001 <.0001 <.0001 9 <.0001 <.0001 <.0001 <.0001 <.0001 <.0001 <.0001 <.0001 NOTE: To ensure overall protection level, only probabilities associated with pre-planned comparisons should be used.

203
APPENDIX E
Pictures of study location where conducted in Sangthong district
(Pakthep village) (NaSaoNang village)
Figure 1. Harvesting/cutting
Small grasp of bundle (HaiNeua village) Spreading of cut panicles (NaHoiPang village)
Figure 2. Field drying practices
(HaiTai village) (Pakthep village)
Figure 3. Piling

204
(NaSaoNang village) (Natarn village)
Figure 4. Hauling
(HaiTai village) (NaHoiPang village)
Figure 5. Threshing, bagging, and transporting
(TaoHai village) (NaHoiPang village)
Figure 6. Sun drying practices

205
(Namieng village) (HaiNeua village)
Figure 7. village granaries
(HaiTai village) (Pakthep village)
Figure 8. village rice mills
(TaoHai village) (NaHoiPang village)
Figure 9. Village paddy trading

206
(SomePhone rice mill) (SomeHong rice mill)
Figure 10. Green Field Miller Group (GFMG)
(Lao Farmer Product) (State Food Stuff Enterprise)
Figure 11. Rice processors and exporters
(Lao Farmer Product) (GFMG2)
Figure 12. Sorting and packaging

207
(SFSE) (GFMG2) (LFP)
Figure 13. Organically certified products
(Supermarkets) (SFSE minimarts)
Figure 14. Domestic markets
(European market channels) (ASEAN market channels)
Figure 15. Foreign markets

208
APPENDIX F
Pictures of instrument using in field trial and laboratory
kett-Riceter m401 (Moisture meter) (Digital tachometer)
(Multi-function thermometer) (Ambient temperature meter)
(Scale 1 kg and 60 kg) (Measuring tap )
Figure 16. Field research on moisture content in granaries and drying trial
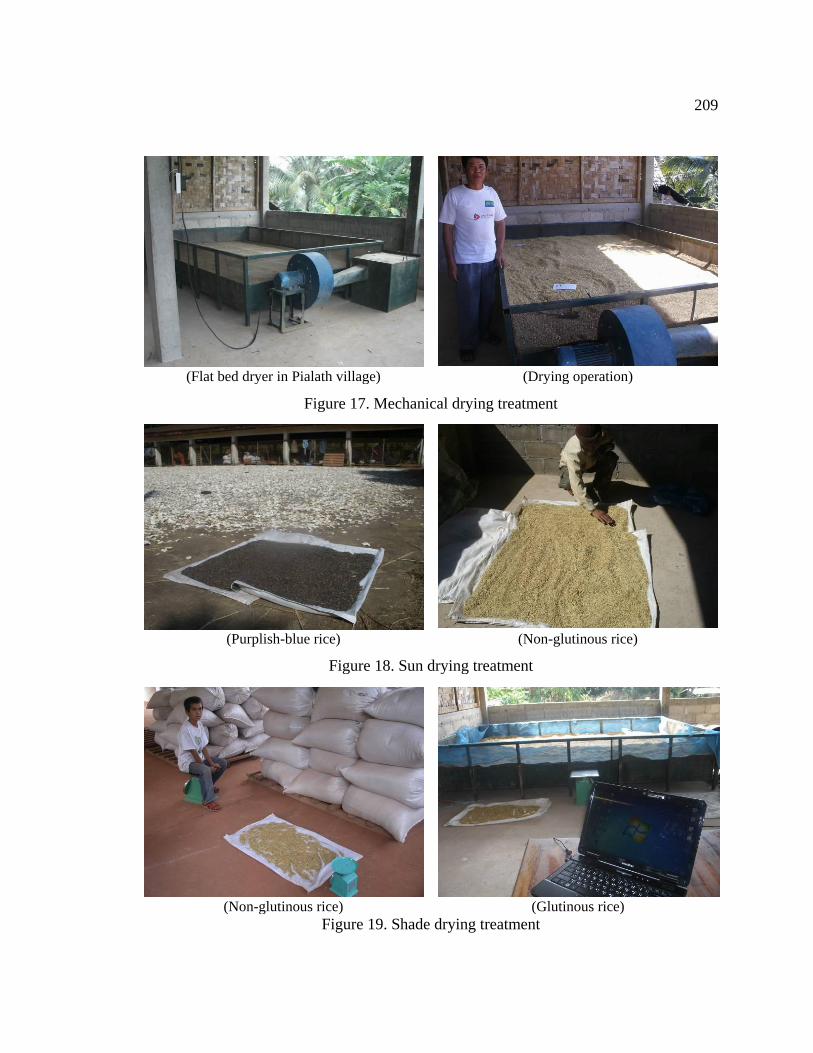
209
(Flat bed dryer in Pialath village) (Drying operation)
Figure 17. Mechanical drying treatment
(Purplish-blue rice) (Non-glutinous rice)
Figure 18. Sun drying treatment
(Non-glutinous rice) (Glutinous rice)
Figure 19. Shade drying treatment

210
(Lab scale, max 210 g) (Lab husker)
(Lab polisher) (Indented sheet sorter)
(Grain size measuring meter) (Stopwatch)
Figure 20. Laboratory instrument