Embed Size (px)
Citation preview
Capital Mobility Incentives: Foreign Direct Investment and Shareholder Protection under Periods of Financial Distress
Carlos Ramos de la Vega
May 5, 2017
Advisor: Professor Barry J. Eichengreen
1

To my advisor, Prof. Barry Eichengreen, for helping me understand.
To my friends, for showing me there is no other way but forward.
To my parents, Carlos and Claudia, for making it all possible.
2
1 Introduction
What is the importance of a country’s corporate governance framework and what influence does it have on foreigninvestors’ capital allocation decisions after a period of financial distress?
Throughout the past decades, scholars have been able to conclude that a financial crisis might cause a significantincrease in the level of a country’s Foreign Direct Investment inflows. One of the most prevalent explanationsfor this is that a crisis can ignite a heated period of fire-sale FDI; a phenomenon prompted by the post-crisisdepreciation of domestic firms’ assets, leading foreign entities to mobilize capital into the host country motivatedby an increase in expected returns, ultimately causing inward FDI flows to increase in the form of heightened M&Aactivity (Krugman 2000, Acharya et al. (2010), Stoddard et al. (2015)).
Others such as Albuquerque (2003) have elaborated on a potentially positive association between FDI and theseverity of a financial crises, based on the flows’ inalienability, which severely limits them from being expropriatedduring periods of distress. Albuquerque’s findings were confirmed one year later by Berg et al.(2004), who claimedthat FDI’s relatively low risk and high stability present an attractive opportunity for emerging economies to obtainexternal financing, given that it is less likely to trigger a financial crisis than inflows such as portfolio equity andbank lending flows.
Additional to the study of the behavior of FDI patterns during periods of financial distress, a separate bodyof research has focused heavily on the influence of a country’s corporate governance mechanisms in attractinghigher levels of Foreign Direct Investment. Farooque (2010) found, for example, that at the moment of executinginvesting decisions, the international investor community has become increasingly concerned about the financialaccountability of the capital-recipient firms in the host country, as well as the strength of the corporate bylaws thatwill be intended to protect their equity ownerships. Additionally, the author was able to confirm a bi-directionalrelationship between measures of country-level corporate governance, including enforcement of property rights andlegal infrastructure, and the economy’s level of Foreign Direct Investment. Gibson (2003) was able to establishthe same relationship than Farooque between the level of these inflows and the strength of the country’s corporategovernance framework, also noting that some institutional investors had identified the soundness of a shareholderprotection framework as a particularly important factor affecting their willingness to invest in emerging markets. Apossible explanation for this is provided by La Porta et al. (1999); the authors argue that given the predominantlyfamily-centered nature of firms in emerging markets, the controlling shareholders have less restrictions and moreinfluence surrounding the expropriation of the company’s minority shareholders which could potentially be foreigncapital providers.
However insightful, Farooque and Gibson’s findings do not contemplate whether the relationship between FDI andcorporate governance changes in the midst of a period of financial instability, which might shed further light into theimportance of emerging economies implementing a sound and resilient corporate regulatory structure. Additionally,the contributions of La Porta are only able to draw conclusions of the relationship between a country’s corporategovernance and its overall economic growth, without analyzing or stressing the particular importance of any typeof capital inflow or key channels of external financing. Finally, to the best of my knowledge, there is no researchthat examines the behavior of the relationship between Foreign Direct Investment and corporate governance orshareholder right’s protection under crisis episodes that have originated through different channels. For instance,it would be insightful to understand if there is any difference between the relationship of FDI and shareholderprotection when the country is impacted by a currency crisis, an inflation crisis, or a sovereign debt crisis.
1.1 The Agency Problem: Improving Shareholder and Management Alignment
It is crucial to understand that attaining better legal protection for foreign investors (both shareholders and credi-tors) is no trivial pursuit for host countries, particulary when they are emerging and developing economies. Investorregulatory protection has in fact been considered one of the key factors that promotes a country’s financial infras-tructure development by reducing the agency problem to which investors are exposed due to the separation ofresponsibilities and control between them en the company’s management. These governance deficiencies, as theIMF (2016) defines them, allow corporate insiders to divert resources for their personal use, or to commit funds to
3
unprofitable projects that provide greater private benefits, even if it is in violation of their fiduciary duty and atthe expense of the corporation.
When investor’s rights are better protected by law, foreign investors are willing to pay more for financial assets inthe host country, such as equity and debt. Their increased willigness to pay comes about because they recognizethat with a stronger regulatory framework protecting them, they have a higher chance of obtaining more of thevalue created by the enterprise they fund in the form of dividends or interest payments. This in turn reduced themisalignments existent between the investors and the management of the company or the entrepreneurs in chargeof the day to day operations of the business, which in an environment where lack of investor protection is pervasivemight have excess power and control over the company’s decisions which could lead them to expropriate the benefitsto which the capital providers are entitled.
Shareholder protection is intented to prevent exactly this problem: the misalignment between the incentives andintentions of investors and the decision-makers who control a given business entity on a daily basis. By limitingexpropriation and reducing misalignment, shareholder protection regulations have the power to raise the price ofsecurities in the marketplace by reducing the risk exposure of investors, which in turn enables more entrepreneursto finance their investments externally, leading to the expansion of financial markets (La Porta et al. (1999)).
This agency problem is especially important to address for emerging market economies. While advanced economiesare known to generally have diffuse or highly fragmented ownership on their largest conglomerates, Morck et al.(2005) document that there is a clear predominance of a significantly high ownership concentration in emergingmarets. Moreover, this controlling stakes are usually in the hands of wealthy families that perpetuate their man-agement style and operating thesis through generations as legacy owners of the entities. This stark difference wtihmore developed economies portrays a distinctive landscape where the high concentration of ownership forces usto think about the agency problem slightly differently: in the case of emerging markets, the misalignment mightexist not only between the foreign providers of capital and the management of the company, but also might bepresent between these investors and the business’ domestic majority shareholders, which sometimes might createadditional problems for their stance to have influence on the operations of the company. This dynamic was furtherconfirmed in the specific case of China by Luo et al. (2014), where the authors document that many of the country’scontrolling families have used their high ownership to expropriate minority shareholders, which ultimately has hadthe effect of reducing the corporate value of the private entities.
The foreign ownership landscape in Mexico is no different in terms of the problems it has faced since the last decadeof the XXth century. The country’s bank privatization experience beginning in 1992 can serve as a clear exampleto understand the extent to which foreign investors regard as important the existence of a framework that protectstheir interests when channeling financial resources abroad.
1.2 On Banking Crises and the Importance of Shareholder Protection: The Case ofMexico
For President Carlos Salinas de Gortari, circumstances had changed since in 1982 the Mexican government underLopez Portillo decided to nationalize the banking system. Ten years later, Salina’s administration saw privatizationas the only way forward for Mexico to face its macroeconomic challenges and “confront with sovereignty a worldthat was more competitive and technologically revolutionized”.
The reality was not that optimistic: the government was faced with a dire fiscal crisis that originated at the beginningof the 1970’s and had not been stifled ever since due to the poor implementation of an effective taxation system.Through the auction and sale of a broad range of state-owned enterprises, the goverment sought to maximize thenon-recurring revenues of assets that might otherwise be capital-draining for the public budget.
In order to get Mexico’s domestic bankers to pay high prices for the auctioned entities, the government madedecisions that would both portray the financial industry as a highly profitable de facto oligopoly1 and reduce theprudent risk-taking and reporting of the bank directors and regulators that were managing and surveilling the now-private institutions. Regulatory leniency was pervasive indeed: during the bidding process, the government aimed
1In 1991, the banking industry was composed of 18 banks, 4 of which controlled 70% of total bank assets in the country.
4
to reduce the amount of equity capital that bankers needed to invest upfront and risk themselves. For some of thetransactions, Mexican investors were even allowed to acquire banks’ assets with borrowed funds that sometimeswere taken from the same banks they were purchasing (Unal et al. (1999).
The government authorities were not ignorant of the high risks that these policies and arrangements would bring, butthey were convinced these incentives in order to maximize the prices paid for the financial institutions, particularlybecause they feared bankers would underbid for the assets given the ease of expropriation of private assets bythe Mexican government and its few limits on its authority. After all, the government had already expropriatedbusinessmen from their banking assets twice before in the same century.2. Under this strategy President Salinas deGortari was succesful in reaching his objective, at some points having groups of investors bidding almost 29 timeswhat the bank had earned in the previous year3.
However, the lack of rigor in bank monitoring and accountability from bankers and enforcement authorities did notimprove after the adjudication of the assets on sale. Once privately owned, commercial banks were subject to weakaccounting standard requirements that allowed them to roll over the principal of their non-performing loans andcount it as performing assets, while only taking into account the interest in arrears as non-performing. Needless tosay, this severely overestimated the overall health of the banking system and has been confirmed to be the primaryreason4 for the inminent banking crisis and collapse that was triggered by the peso crisis that started in Decemberof 1994.
It is important to note that under the North American Free Trade Agreement (NAFTA) established in 1994, foreignentities could not own more than 30% of a Mexican bank’s capital, which would automatically categorize them asminority shareholders given the characteristically low ownership fragmentation of the industry.
18 banks needed to be rescued by the Mexican government, and while the authorities were willing to clean thebank’s balance sheets off their non-performing loans thorugh a loan repurchase program run by the FOBAPROA(the Fund for the Protection of Bank Savings), both domestic and foreign bank shareholders had to agree that forevery peso granted they would have to invest 50 cents of new equity to recapitalize the banks. Furthermore, forsome of the banks that were in serious financial distress, the National Banking and Securities Commission decidedto intervene and immediately suspend the rights of shareholders to make management decisions. After the fact,the Commision would remove the bank’s management and arrange another financial institution to invest or acquirecontrol of the bank.
These two strategies (FOBAPROA funding and management removal) only worsened the situation however, as thegovernment intervention and the cleaning of the institution’s non-performing loans only provided further incentivesfor some of the new bank executives to issue large loans to themselves and then default on them without incurringany major penalty, ultimately harming shareholders even more and aggravating the already serious agency problem5.
After the collapse of the banking system Mexico made it a point to reform key institutions that promoted bankingmonitoring and decided to open the industry to Foreign Direct Investment. Between 1995 and 1996, the Mexicangovernment decided to lift the 30% bank ownership restriction for foreign investors in an additional effort torecapitalize the industry. As a result, foreign banks began purchasing significant shares that ultimately amountedto controlling interests in Mexico’s largest banks.
2The first banking expropriation was carried out by President Venustiano Carranza, the second one by President Lopez Portillo.3A group of investors bid $845 million dollars (at 1992 prices) for the medium-sized bank Somex.4Gonzalez-Hermosillo et al.(1997) studied how the accumulation and increase of non-performing loans from 13% to 16% of Mexican
banks’ portfolios during the period of 1991 to 1993 was the primary cause of the increased fragility and imminent insolvency of thefinancial institutions.
5The problem was quantified in La Porta et al. (2003), where it is shown that 20% of all large loans from 1995 to 1998 were channeledto the banks’ directors.
5
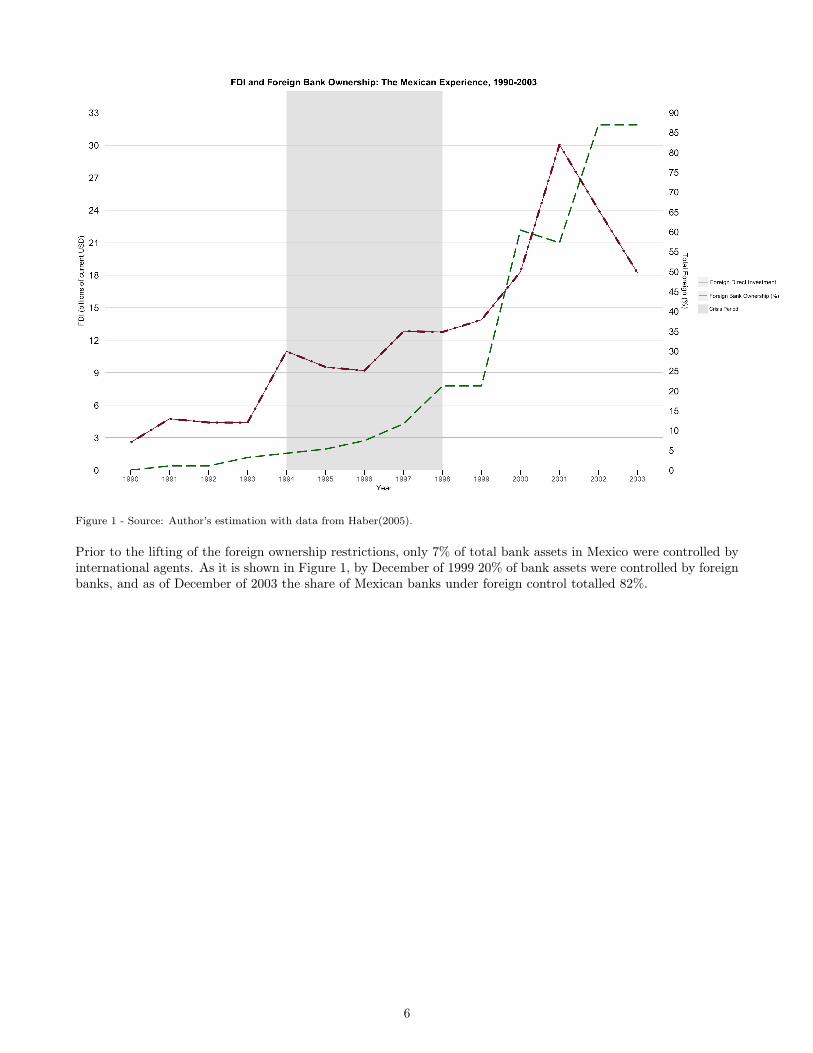
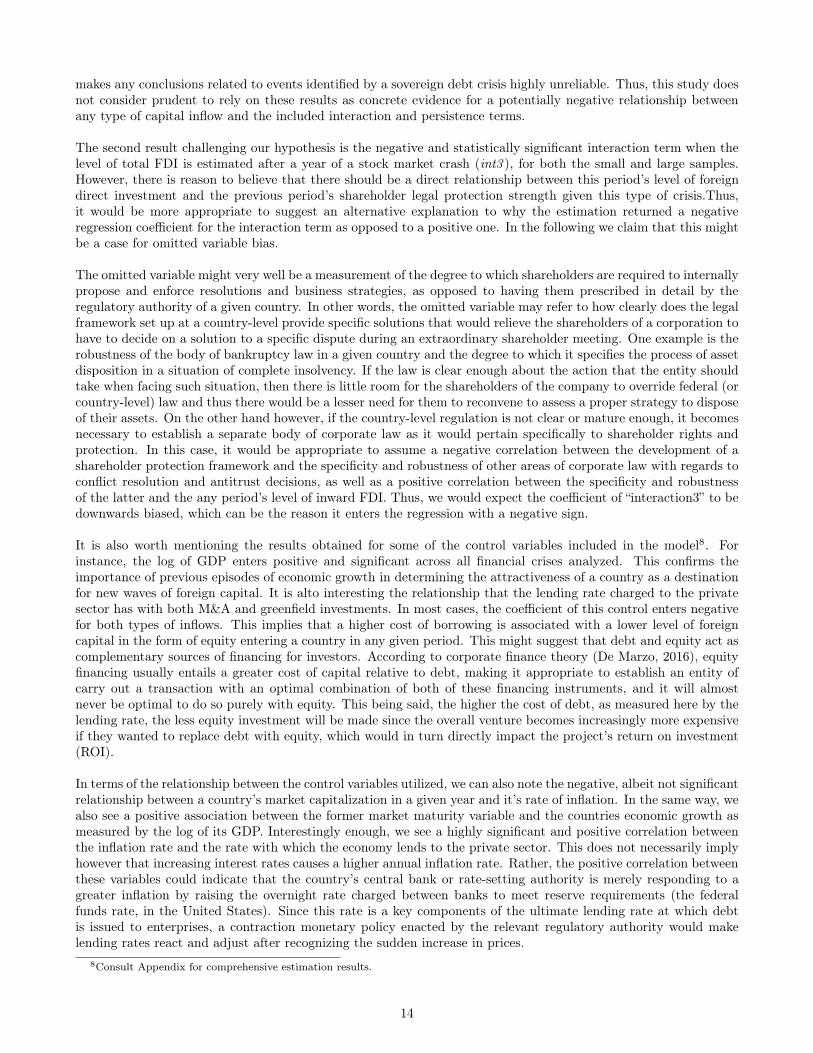
Figure 1 - Source: Author’s estimation with data from Haber(2005).
Prior to the lifting of the foreign ownership restrictions, only 7% of total bank assets in Mexico were controlled byinternational agents. As it is shown in Figure 1, by December of 1999 20% of bank assets were controlled by foreignbanks, and as of December of 2003 the share of Mexican banks under foreign control totalled 82%.
6
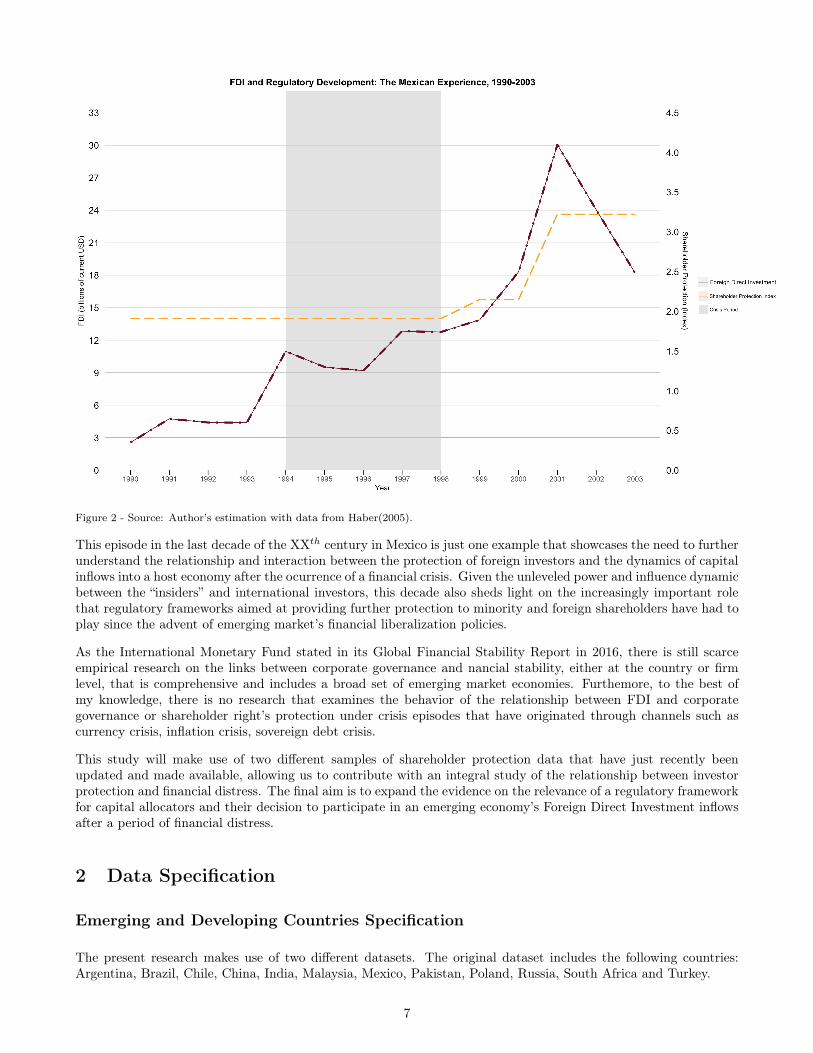
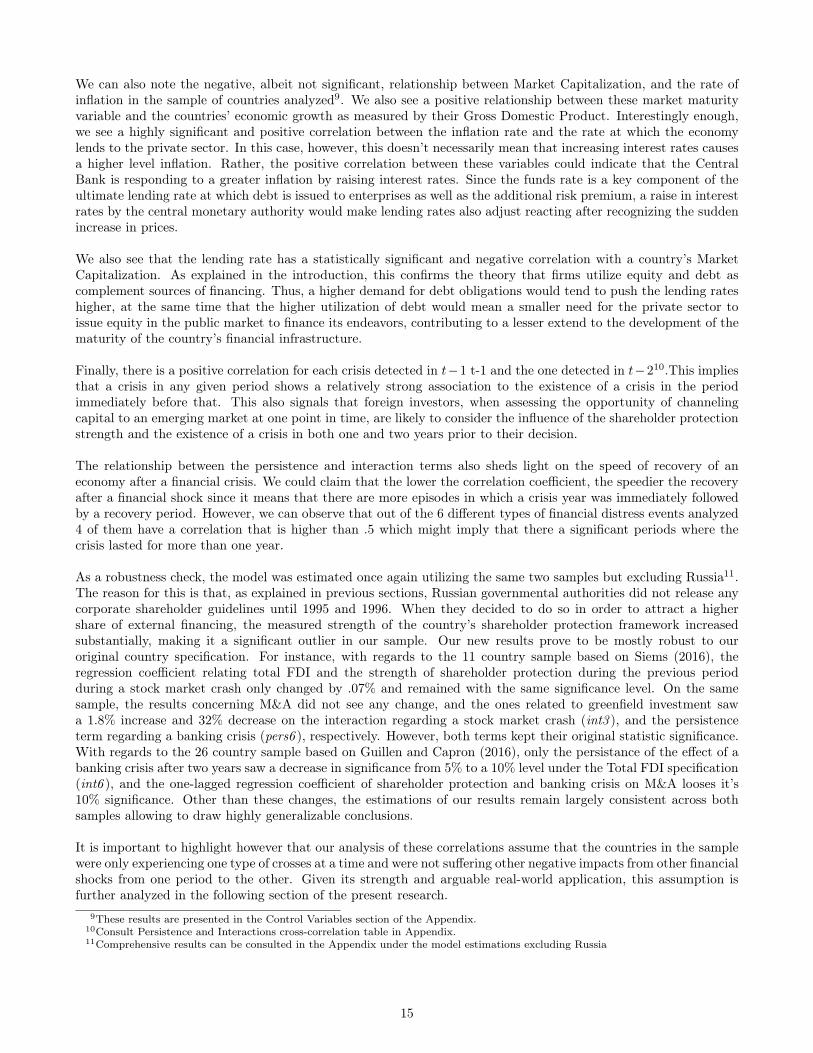
Figure 2 - Source: Author’s estimation with data from Haber(2005).
This episode in the last decade of the XXth century in Mexico is just one example that showcases the need to furtherunderstand the relationship and interaction between the protection of foreign investors and the dynamics of capitalinflows into a host economy after the ocurrence of a financial crisis. Given the unleveled power and influence dynamicbetween the “insiders” and international investors, this decade also sheds light on the increasingly important rolethat regulatory frameworks aimed at providing further protection to minority and foreign shareholders have had toplay since the advent of emerging market’s financial liberalization policies.
As the International Monetary Fund stated in its Global Financial Stability Report in 2016, there is still scarceempirical research on the links between corporate governance and nancial stability, either at the country or firmlevel, that is comprehensive and includes a broad set of emerging market economies. Furthemore, to the best ofmy knowledge, there is no research that examines the behavior of the relationship between FDI and corporategovernance or shareholder right’s protection under crisis episodes that have originated through channels such ascurrency crisis, inflation crisis, sovereign debt crisis.
This study will make use of two different samples of shareholder protection data that have just recently beenupdated and made available, allowing us to contribute with an integral study of the relationship between investorprotection and financial distress. The final aim is to expand the evidence on the relevance of a regulatory frameworkfor capital allocators and their decision to participate in an emerging economy’s Foreign Direct Investment inflowsafter a period of financial distress.
2 Data Specification
Emerging and Developing Countries Specification
The present research makes use of two different datasets. The original dataset includes the following countries:Argentina, Brazil, Chile, China, India, Malaysia, Mexico, Pakistan, Poland, Russia, South Africa and Turkey.
7
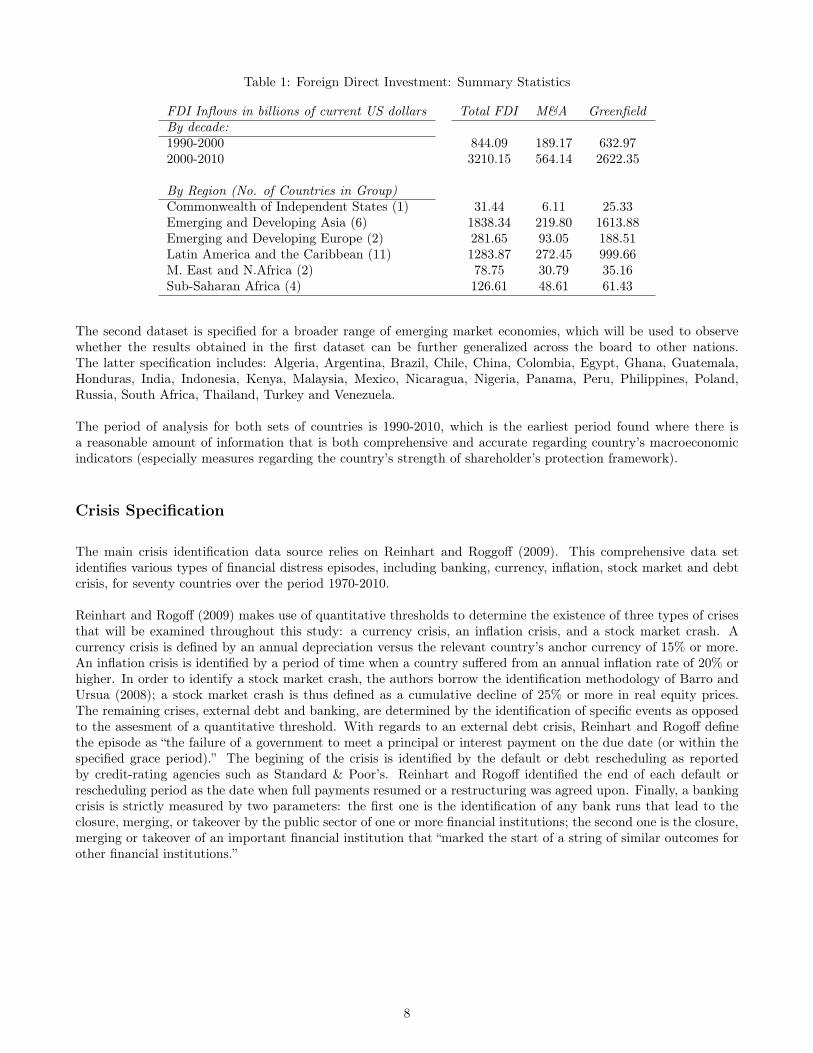
Table 1: Foreign Direct Investment: Summary Statistics
FDI Inflows in billions of current US dollars Total FDI M&A GreenfieldBy decade:1990-2000 844.09 189.17 632.972000-2010 3210.15 564.14 2622.35
By Region (No. of Countries in Group)Commonwealth of Independent States (1) 31.44 6.11 25.33Emerging and Developing Asia (6) 1838.34 219.80 1613.88Emerging and Developing Europe (2) 281.65 93.05 188.51Latin America and the Caribbean (11) 1283.87 272.45 999.66M. East and N.Africa (2) 78.75 30.79 35.16Sub-Saharan Africa (4) 126.61 48.61 61.43
The second dataset is specified for a broader range of emerging market economies, which will be used to observewhether the results obtained in the first dataset can be further generalized across the board to other nations.The latter specification includes: Algeria, Argentina, Brazil, Chile, China, Colombia, Egypt, Ghana, Guatemala,Honduras, India, Indonesia, Kenya, Malaysia, Mexico, Nicaragua, Nigeria, Panama, Peru, Philippines, Poland,Russia, South Africa, Thailand, Turkey and Venezuela.
The period of analysis for both sets of countries is 1990-2010, which is the earliest period found where there isa reasonable amount of information that is both comprehensive and accurate regarding country’s macroeconomicindicators (especially measures regarding the country’s strength of shareholder’s protection framework).
Crisis Specification
The main crisis identification data source relies on Reinhart and Roggoff (2009). This comprehensive data setidentifies various types of financial distress episodes, including banking, currency, inflation, stock market and debtcrisis, for seventy countries over the period 1970-2010.
Reinhart and Rogoff (2009) makes use of quantitative thresholds to determine the existence of three types of crisesthat will be examined throughout this study: a currency crisis, an inflation crisis, and a stock market crash. Acurrency crisis is defined by an annual depreciation versus the relevant country’s anchor currency of 15% or more.An inflation crisis is identified by a period of time when a country suffered from an annual inflation rate of 20% orhigher. In order to identify a stock market crash, the authors borrow the identification methodology of Barro andUrsua (2008); a stock market crash is thus defined as a cumulative decline of 25% or more in real equity prices.The remaining crises, external debt and banking, are determined by the identification of specific events as opposedto the assesment of a quantitative threshold. With regards to an external debt crisis, Reinhart and Rogoff definethe episode as “the failure of a government to meet a principal or interest payment on the due date (or within thespecified grace period).” The begining of the crisis is identified by the default or debt rescheduling as reportedby credit-rating agencies such as Standard & Poor’s. Reinhart and Rogoff identified the end of each default orrescheduling period as the date when full payments resumed or a restructuring was agreed upon. Finally, a bankingcrisis is strictly measured by two parameters: the first one is the identification of any bank runs that lead to theclosure, merging, or takeover by the public sector of one or more financial institutions; the second one is the closure,merging or takeover of an important financial institution that “marked the start of a string of similar outcomes forother financial institutions.”
8
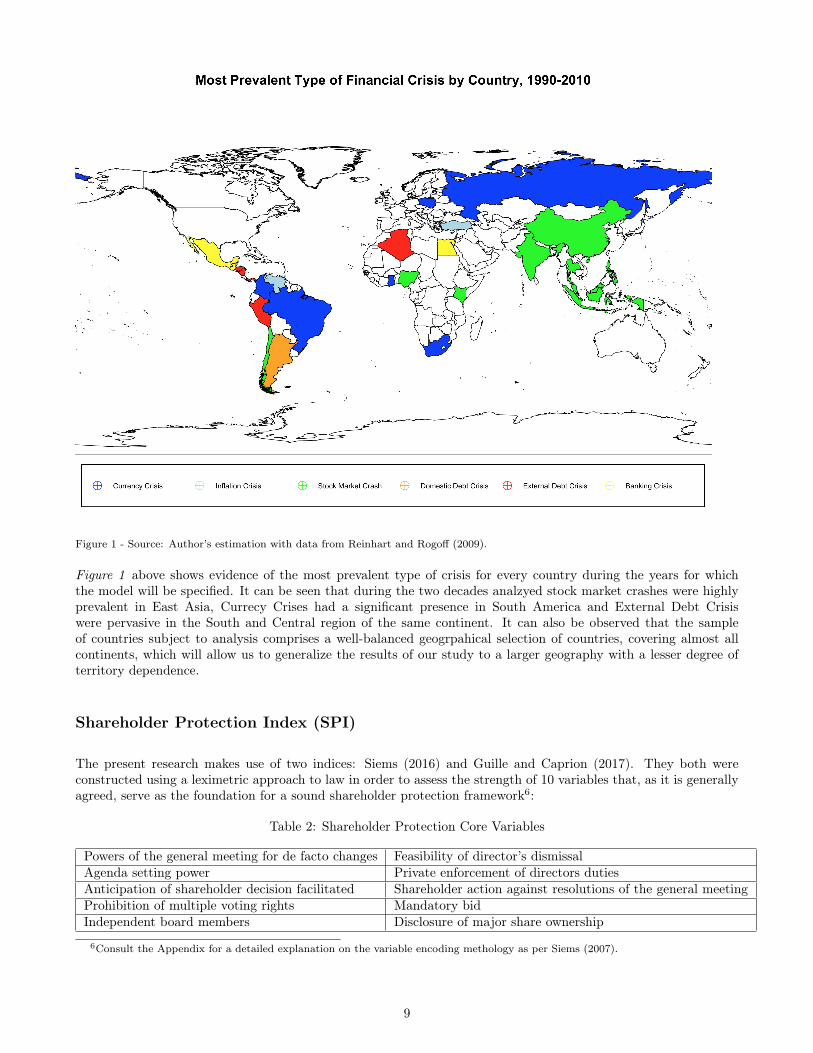
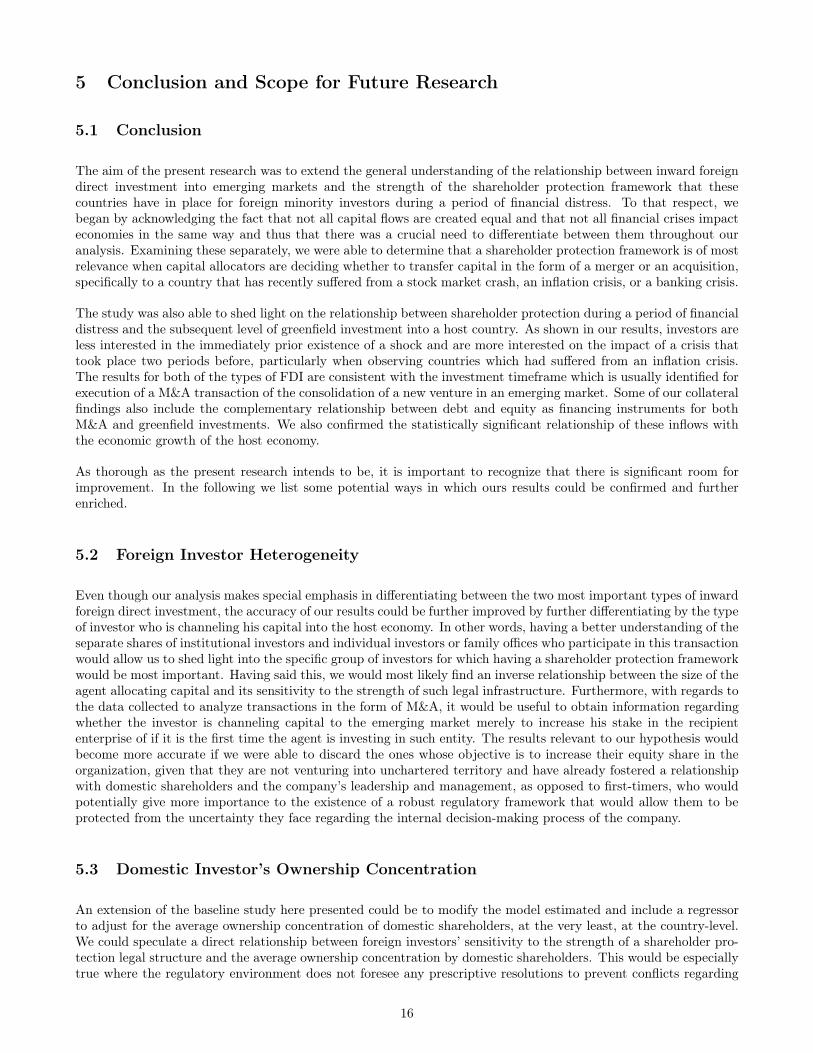
Figure 1 - Source: Author’s estimation with data from Reinhart and Rogoff (2009).
Figure 1 above shows evidence of the most prevalent type of crisis for every country during the years for whichthe model will be specified. It can be seen that during the two decades analzyed stock market crashes were highlyprevalent in East Asia, Currecy Crises had a significant presence in South America and External Debt Crisiswere pervasive in the South and Central region of the same continent. It can also be observed that the sampleof countries subject to analysis comprises a well-balanced geogrpahical selection of countries, covering almost allcontinents, which will allow us to generalize the results of our study to a larger geography with a lesser degree ofterritory dependence.
Shareholder Protection Index (SPI)
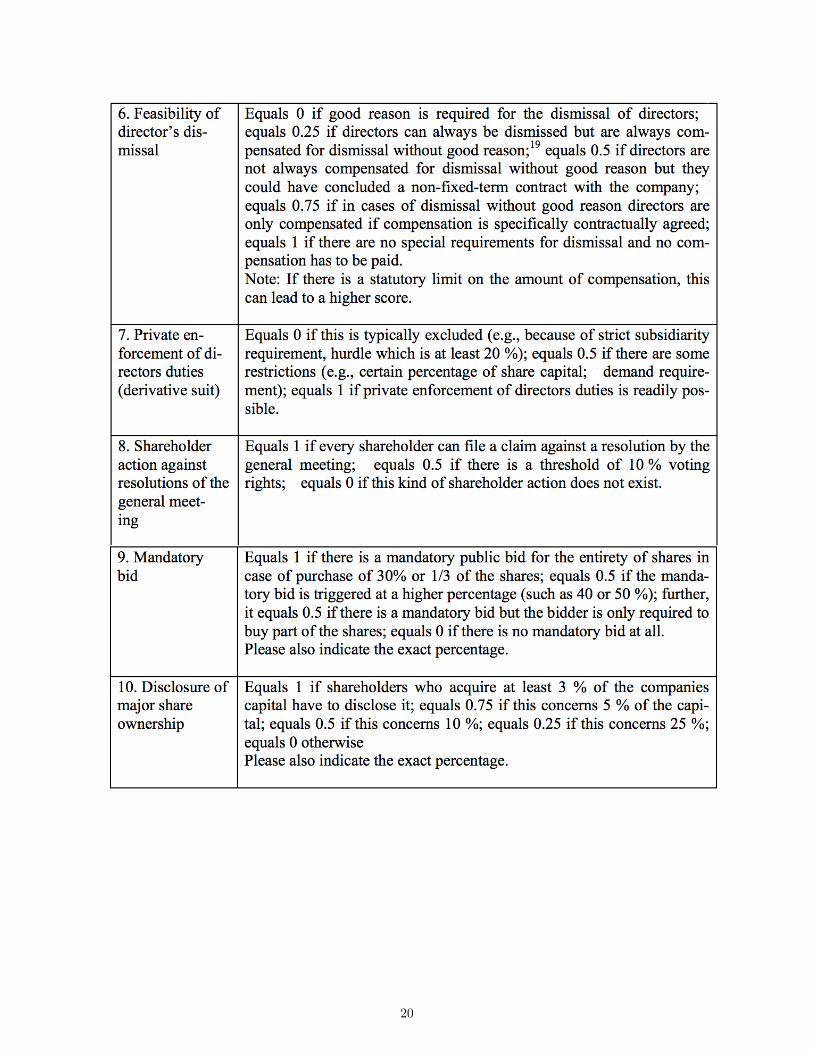
The present research makes use of two indices: Siems (2016) and Guille and Caprion (2017). They both wereconstructed using a leximetric approach to law in order to assess the strength of 10 variables that, as it is generallyagreed, serve as the foundation for a sound shareholder protection framework6:
Table 2: Shareholder Protection Core Variables
Powers of the general meeting for de facto changes Feasibility of director’s dismissalAgenda setting power Private enforcement of directors dutiesAnticipation of shareholder decision facilitated Shareholder action against resolutions of the general meetingProhibition of multiple voting rights Mandatory bidIndependent board members Disclosure of major share ownership
6Consult the Appendix for a detailed explanation on the variable encoding methology as per Siems (2007).
9
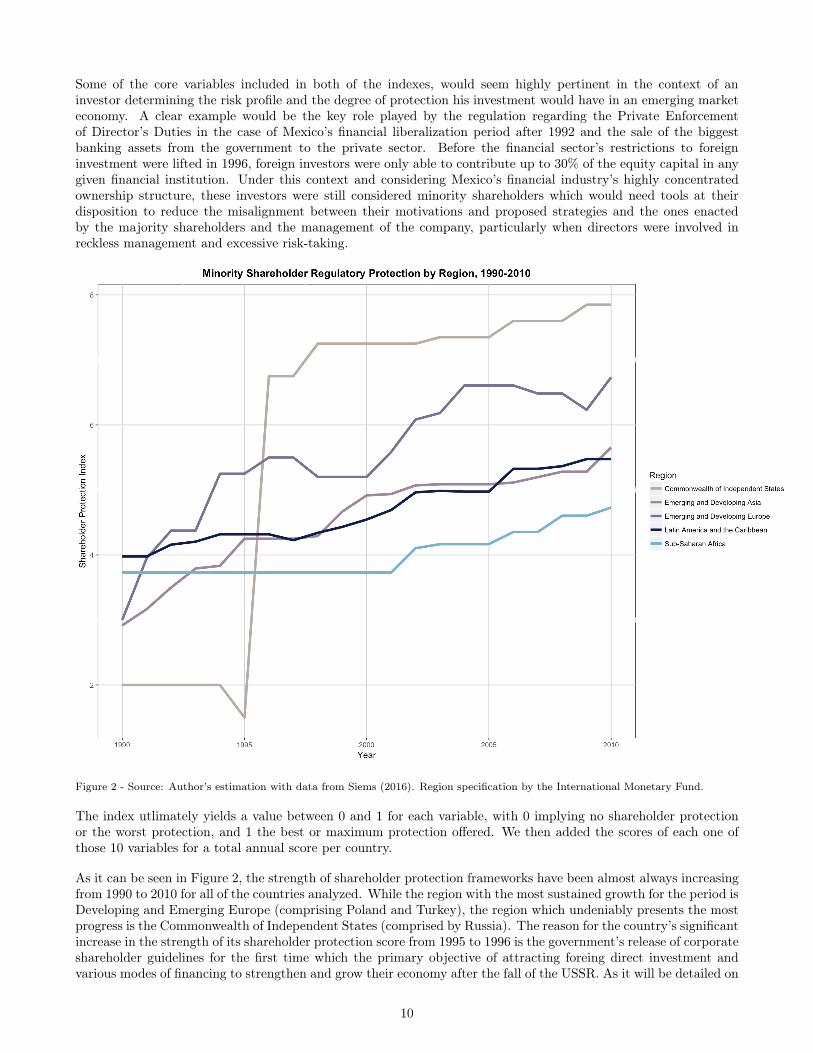
Some of the core variables included in both of the indexes, would seem highly pertinent in the context of aninvestor determining the risk profile and the degree of protection his investment would have in an emerging marketeconomy. A clear example would be the key role played by the regulation regarding the Private Enforcementof Director’s Duties in the case of Mexico’s financial liberalization period after 1992 and the sale of the biggestbanking assets from the government to the private sector. Before the financial sector’s restrictions to foreigninvestment were lifted in 1996, foreign investors were only able to contribute up to 30% of the equity capital in anygiven financial institution. Under this context and considering Mexico’s financial industry’s highly concentratedownership structure, these investors were still considered minority shareholders which would need tools at theirdisposition to reduce the misalignment between their motivations and proposed strategies and the ones enactedby the majority shareholders and the management of the company, particularly when directors were involved inreckless management and excessive risk-taking.
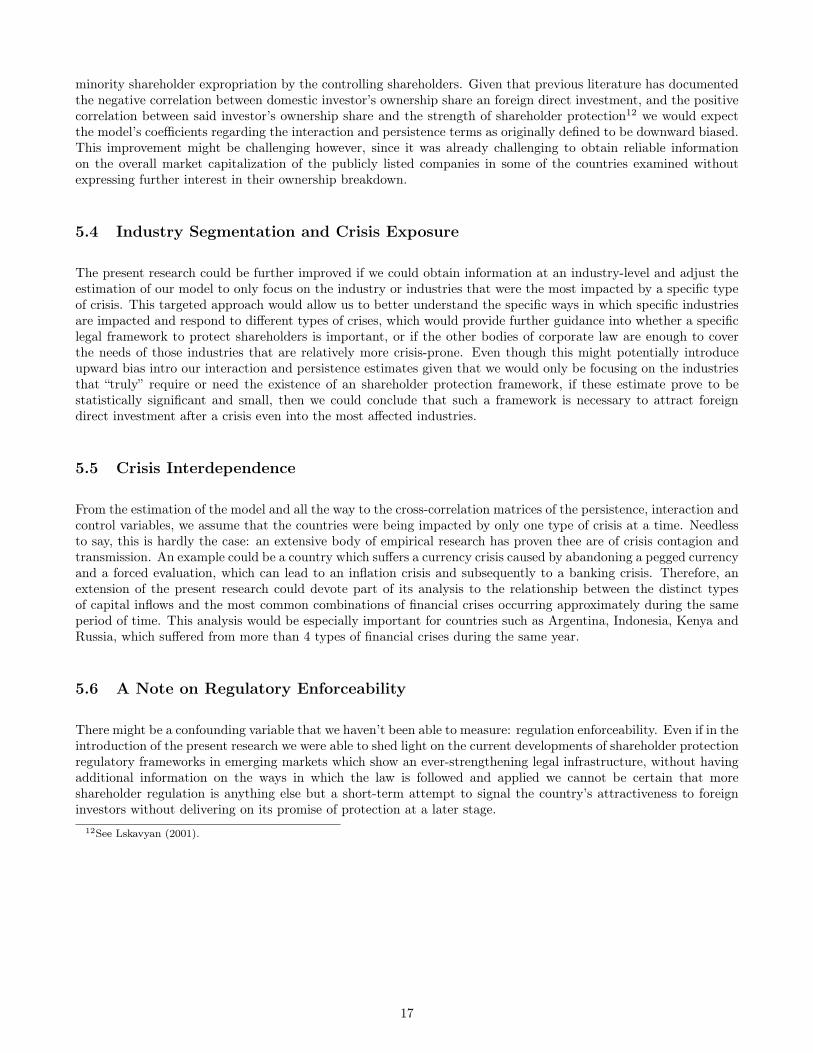
Figure 2 - Source: Author’s estimation with data from Siems (2016). Region specification by the International Monetary Fund.
The index utlimately yields a value between 0 and 1 for each variable, with 0 implying no shareholder protectionor the worst protection, and 1 the best or maximum protection offered. We then added the scores of each one ofthose 10 variables for a total annual score per country.
As it can be seen in Figure 2, the strength of shareholder protection frameworks have been almost always increasingfrom 1990 to 2010 for all of the countries analyzed. While the region with the most sustained growth for the period isDeveloping and Emerging Europe (comprising Poland and Turkey), the region which undeniably presents the mostprogress is the Commonwealth of Independent States (comprised by Russia). The reason for the country’s significantincrease in the strength of its shareholder protection score from 1995 to 1996 is the government’s release of corporateshareholder guidelines for the first time which the primary objective of attracting foreing direct investment andvarious modes of financing to strengthen and grow their economy after the fall of the USSR. As it will be detailed on
10
a later stage, since Russia represents a significant outlier to the trends shown by the other countries in the sample,the model specification will be run both with and without it to avoid a severe degree of sample bias.
It is important to note that both the original and the extended indices are concerned specifically to flows of equitycapital and reinvestment of earnings and do not consider the implications for of regulatory protection for debtholders.
Foreign Direct Investment Specification
The source of FDI inflows and cross-border M&A measurements is the United Nations Conference on Trade andDevelopment’s FDI database compiled in its annual World Investment Report, which will be sourced from 1990-2010in order to match the information obtained for the shareholder’s protection index (SPI). Moreover, following Wangand Wong (2009), we construct a measure of greenfield investment by subtracting cross-border M&A from eachcountry’s total FDI inflows.
3 Econometric Specification
The dependent variable of interest is annual level of inward Foreign Direct Investment by country, regressed on thethe Shareholder Protection Index, along with a vector of crisis dummies (set to 1 when a given country is sufferinga specific type of crisis for a particular year, and zero otherwise), as well as an interaction term between the vectorof crisis and the value of the Shareholder Protection Index. The model will also include a vector of control variablesa la Stoddard (2015), which aims to control for a broad set of macroeconomic conditions, as well as for the political,socioeconomic, and business environment in the host country. The data for this factors relies on indicators providedby the Freedom House and International Country Risk Guide sourced from the ICRG-PRS databases, as well asthe World Bank’s World Development Indicators (WDI).
The model is thus defined as follows:
FDITit = �1+�2SPIit�1+�3CRISISPit�1+�4(SPIit�1⇥CRISISP
it�1)+�5(SPIit�2⇥CRISISPit�2)+�6Xit+�7Zit+"it
Where FDITit is the measure of FDI inflows into country i in year t and of type T (either M&A or Greenfieldinvestments), SPIit�1 the Shareholder Protection Index relevant for country i in year t� 1, CRISISP
it�1 the crisisdummy for country i in year t � 1 relative to the specific type of crisis P as identified by Reinhart and Rogoff(2009), Xit a vector of control variables as previously defined, and Zit, a vector of one and two-time lagged valuesof the relevant mode of Foreign Direct Investment (M&A or Greenfield investments) and SPI, respectively.
The present research will employ a country panel regression approach using an Arellano-Bond Generalized Methodof Moments with a within estimator. The algorithm allows to disregard the time-invariant institutional, legal andcultural environment in which FDI projects are implemented and which may have an important impact on FDIinflows, but will allow us to capture the effect of the variability of the relevant country’s corporate governance as perthe Shareholder Protection Index included in the specification. It is worth stating that the Arellano-Bond GMMestimation has been proven to yield more efficient estimators than the traditional fixed effects specification whenfacing time series with a potential endogeneity problem, and has been more effective when dealing with problems ofunkown heteroskedasticity. Given the likely correlation between the dependent variable and the error of the model,we include lagged levels of FDI in the specification, once again exploiting the properties of Arellano-Bond whichalso allows to prevent estimation bias due to limited data availability. In our case, the data restrictions come in theform of both a relatively short time horizon, encompassing 20 years, as well as a fairly limited number of 11 and26 emerging and developing countries considered in the samples, respectively. We utilize a one-lagged value of theShareholder Protection Index as an instrumental variable as a strategy to control for the endogeneity of the Indexand level of FDI; with this model specification, it is clear that a prior regulatory framework might be able to explainthe future behavior of Foreign Direct Invesment, and there is no real possibility for the future level of capital toexplain ther regulatory strength in existence one period before. Furthermore, since it is plausible that the errors ofthe estimation across time won’t have the same variance, we use heteroscedasticity-consistent standard errors.
11
3.1 Expected Results
The most relevant regression coefficients we are interested in estimating are �4 and �5, which are intended to reflectthe association between FDI and the interaction term of one and two lagged values of SPI and the Crisis dummy.
The estimate �4 , which will be addressed as the interaction term in the following analysis, is intended to capturethe impact of the crisis on the relationship between the country’s Shareholder Protection Index and the level ofForeign Direct Investment as if minority shareholders only had access to one year of information prior to decidingwhether to commit a certain amount of capital in the form of equity financing to an emerging economy. On theother hand, �5, which will be addressed as the persistence term, will intend to capture the extent at which previousvalues of both the Shareholder Protection Index and the existence of a crisis two periods before have any influencein the level of FDI.
We thus expect these estimates to have a positive sign, implying the increased importance that the appropriateprotection of shareholder rights play in determining FDI inflows after a period of financial instability. Furthermore,the insight will become richer when comparing the magnitude and significance of the coefficients with the differenttypes of crises identified by Reinhart and Rogoff, allowing us to conclude the types of crises that have a greatereffect on strengthening the influence that a country’s shareholder’s protection framework has in explaining its levelof FDI.
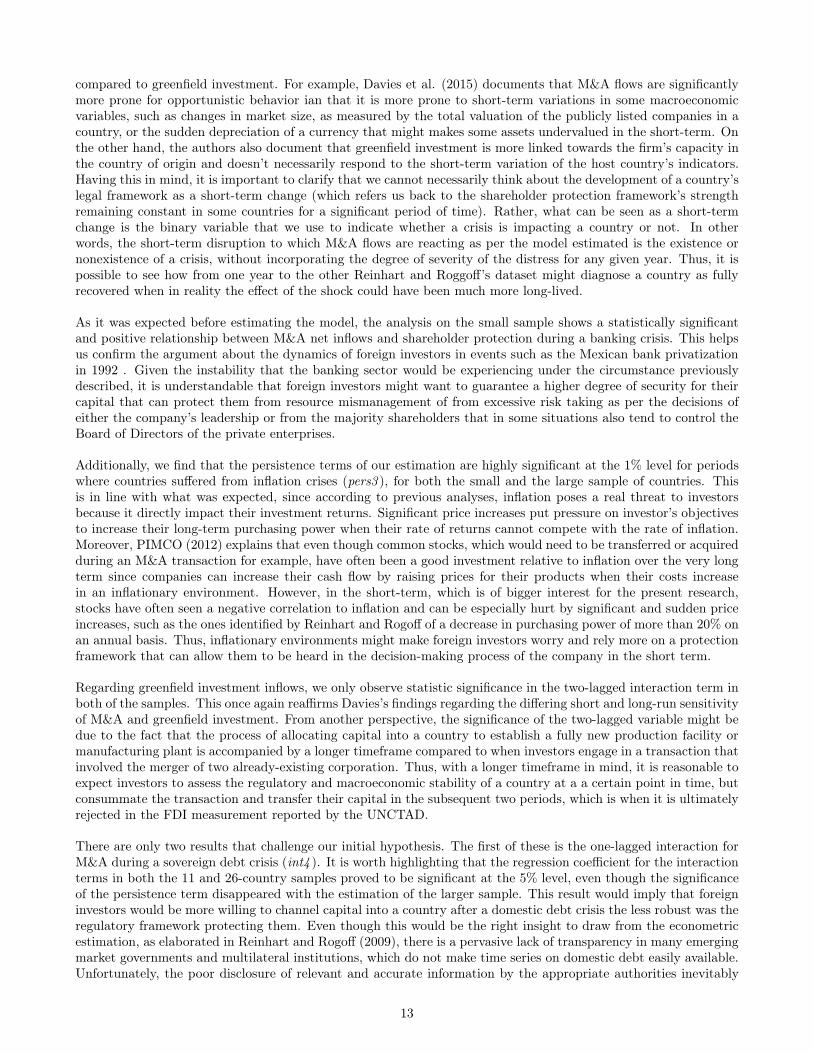
4 General Findings and Analysis
7
Table 3
Estimations Based on Siems (2016)11 Country Sample
Regressor Total FDI M&A GF Inv.
pers1 0.03 0.06 �0.06int1 �0.35 0.18 �0.47
pers2 �0.22 0.50*** 0.05int2 0.58 0.03 0.35
pers3 0.50 0.04 0.51int3 �1.29** 0.15** 1.10**
pers4 0.10 0.20*** �0.46int4 0.14 �0.17** 0.02
pers5 0.58 �0.18 0.50int5 �0.45 �0.001 �0.52
pers6 0.32 �0.10 0.31*
int6 0.39 0.32** 0.05
Table 4
Estimations Based on Guillen & Capron (2016)26 Country Sample
Regressor Total FDI M&A GF Inv.
pers1 0.02 0.06 �0.11int1 �0.15 0.16 �0.35
pers2 0.23 0.41*** 0.29int2 0.16 0.05 �0.08
pers3 0.35 0.05 0.39int3 �0.79** 0.12** �0.64
pers4 0.05 0.09 �0.17int4 0.10 �0.17** 0.06
pers5 0.37 �0.08 0.29int5 �0.05 �0.06 �0.20
pers6 0.32** �0.10 0.22**
int6 0.34 0.08* 0.23
* p<0.10 , ** p<0.05 , *** p<0.01.
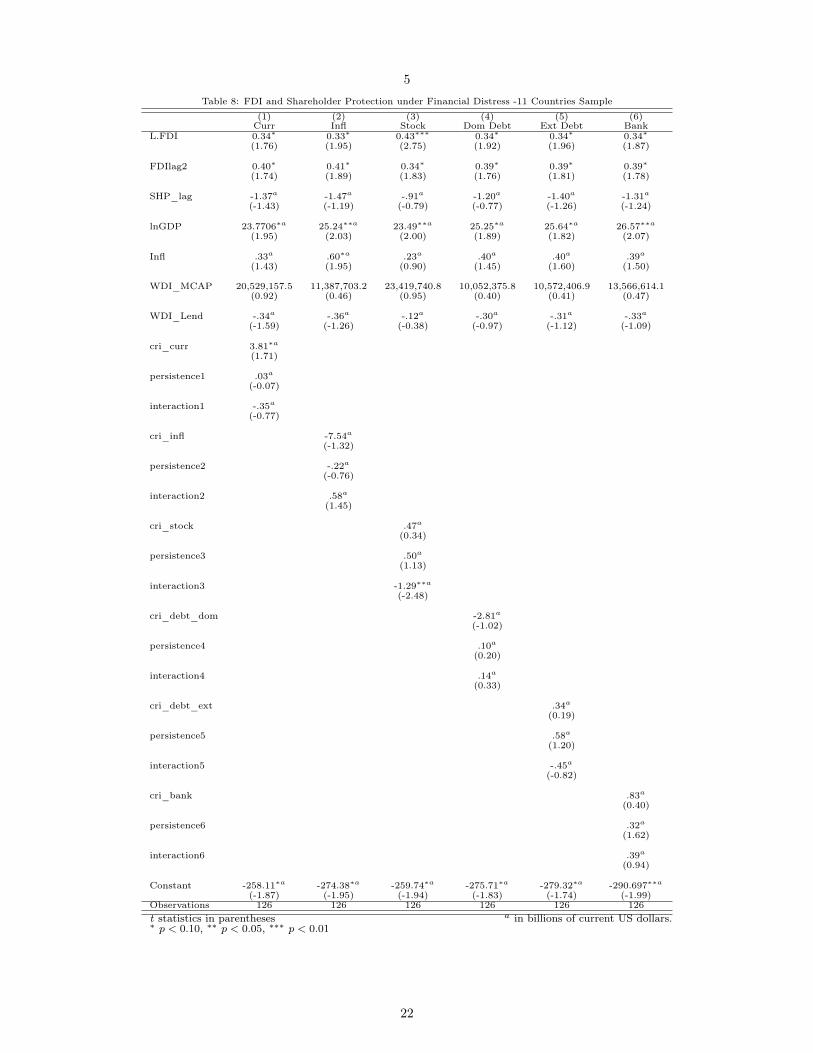
When analyzing our results per type of inflow, we observe that Mergers and Acquisitions is the most of inwardcapital that is more sensitive towards the strength of a country’s shareholder protection score after a period offinancial distress. This happens to be true for both 11 and 26 country samples where we find 5 and 4 statisticallysignificant terms, respectively. In particular, these terms refer to inflation and banking crises (pers2, pers6, int6 ) aswell as stock market crashes (int3 ). The same trend cannot be observed in our results when analyzing the estimatedinteraction and persistence terms with regards to post-crisis greenfield investment decisions, where only a bankingcrisis and stock market crashes seem to be relevant as per their statistic significance. This result agrees with previousresearch findings that have concluded that M&A flows might respond relatively faster to a financial shock when
7The tables on this section only showcase the relevant interaction and persistence terms. The full specification including all controlvariables can be found in the Appendix. Coefficient estimates in billions of current USD.
12
compared to greenfield investment. For example, Davies et al. (2015) documents that M&A flows are significantlymore prone for opportunistic behavior ian that it is more prone to short-term variations in some macroeconomicvariables, such as changes in market size, as measured by the total valuation of the publicly listed companies in acountry, or the sudden depreciation of a currency that might makes some assets undervalued in the short-term. Onthe other hand, the authors also document that greenfield investment is more linked towards the firm’s capacity inthe country of origin and doesn’t necessarily respond to the short-term variation of the host country’s indicators.Having this in mind, it is important to clarify that we cannot necessarily think about the development of a country’slegal framework as a short-term change (which refers us back to the shareholder protection framework’s strengthremaining constant in some countries for a significant period of time). Rather, what can be seen as a short-termchange is the binary variable that we use to indicate whether a crisis is impacting a country or not. In otherwords, the short-term disruption to which M&A flows are reacting as per the model estimated is the existence ornonexistence of a crisis, without incorporating the degree of severity of the distress for any given year. Thus, it ispossible to see how from one year to the other Reinhart and Roggoff’s dataset might diagnose a country as fullyrecovered when in reality the effect of the shock could have been much more long-lived.
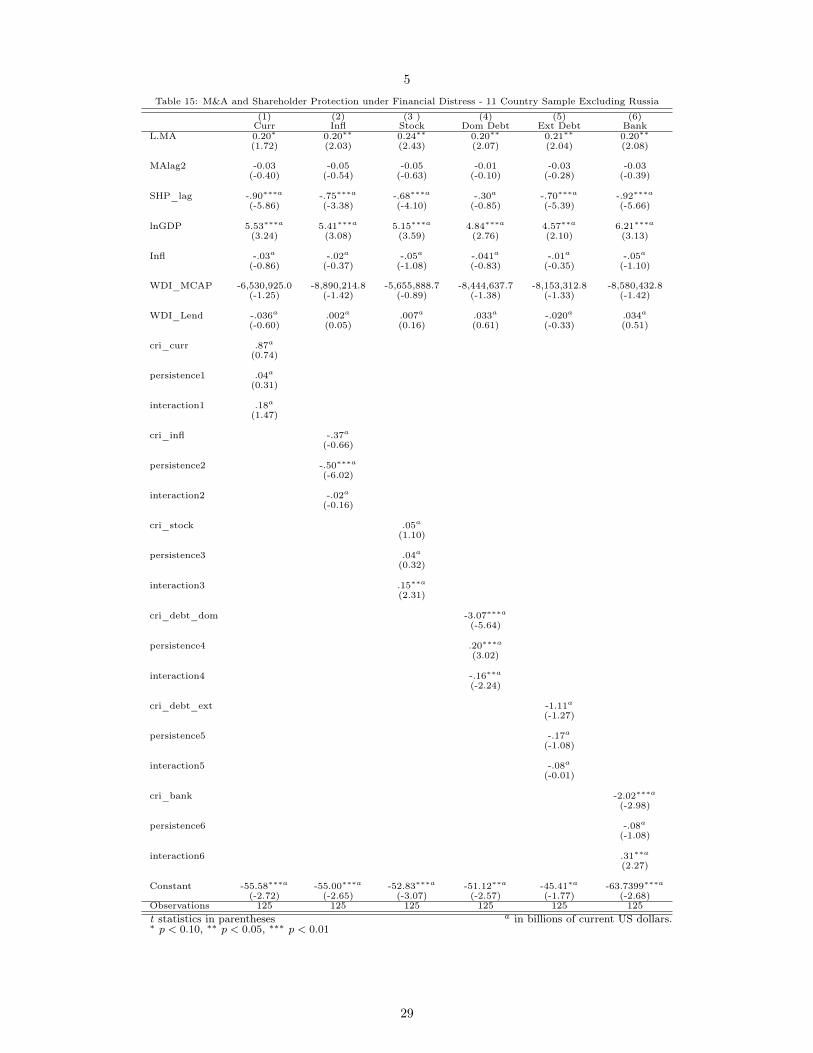
As it was expected before estimating the model, the analysis on the small sample shows a statistically significantand positive relationship between M&A net inflows and shareholder protection during a banking crisis. This helpsus confirm the argument about the dynamics of foreign investors in events such as the Mexican bank privatizationin 1992 . Given the instability that the banking sector would be experiencing under the circumstance previouslydescribed, it is understandable that foreign investors might want to guarantee a higher degree of security for theircapital that can protect them from resource mismanagement of from excessive risk taking as per the decisions ofeither the company’s leadership or from the majority shareholders that in some situations also tend to control theBoard of Directors of the private enterprises.
Additionally, we find that the persistence terms of our estimation are highly significant at the 1% level for periodswhere countries suffered from inflation crises (pers3 ), for both the small and the large sample of countries. Thisis in line with what was expected, since according to previous analyses, inflation poses a real threat to investorsbecause it directly impact their investment returns. Significant price increases put pressure on investor’s objectivesto increase their long-term purchasing power when their rate of returns cannot compete with the rate of inflation.Moreover, PIMCO (2012) explains that even though common stocks, which would need to be transferred or acquiredduring an M&A transaction for example, have often been a good investment relative to inflation over the very longterm since companies can increase their cash flow by raising prices for their products when their costs increasein an inflationary environment. However, in the short-term, which is of bigger interest for the present research,stocks have often seen a negative correlation to inflation and can be especially hurt by significant and sudden priceincreases, such as the ones identified by Reinhart and Rogoff of a decrease in purchasing power of more than 20% onan annual basis. Thus, inflationary environments might make foreign investors worry and rely more on a protectionframework that can allow them to be heard in the decision-making process of the company in the short term.
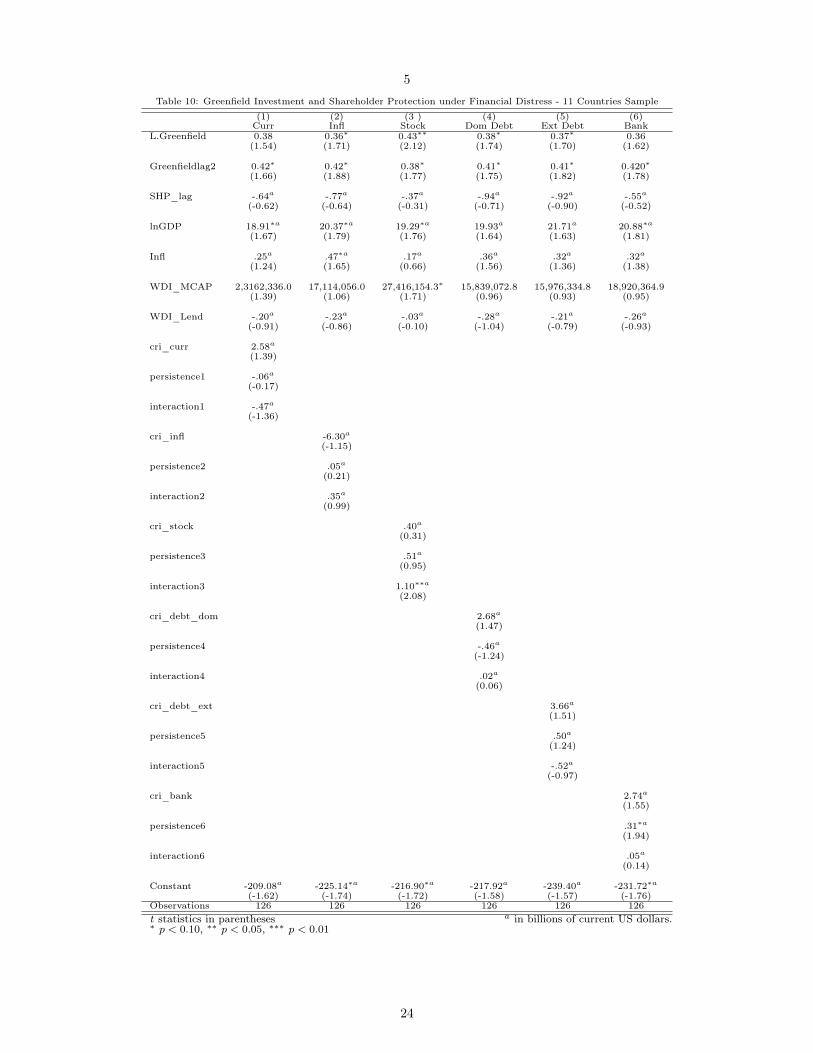
Regarding greenfield investment inflows, we only observe statistic significance in the two-lagged interaction term inboth of the samples. This once again reaffirms Davies’s findings regarding the differing short and long-run sensitivityof M&A and greenfield investment. From another perspective, the significance of the two-lagged variable might bedue to the fact that the process of allocating capital into a country to establish a fully new production facility ormanufacturing plant is accompanied by a longer timeframe compared to when investors engage in a transaction thatinvolved the merger of two already-existing corporation. Thus, with a longer timeframe in mind, it is reasonable toexpect investors to assess the regulatory and macroeconomic stability of a country at a a certain point in time, butconsummate the transaction and transfer their capital in the subsequent two periods, which is when it is ultimatelyrejected in the FDI measurement reported by the UNCTAD.
There are only two results that challenge our initial hypothesis. The first of these is the one-lagged interaction forM&A during a sovereign debt crisis (int4 ). It is worth highlighting that the regression coefficient for the interactionterms in both the 11 and 26-country samples proved to be significant at the 5% level, even though the significanceof the persistence term disappeared with the estimation of the larger sample. This result would imply that foreigninvestors would be more willing to channel capital into a country after a domestic debt crisis the less robust was theregulatory framework protecting them. Even though this would be the right insight to draw from the econometricestimation, as elaborated in Reinhart and Rogoff (2009), there is a pervasive lack of transparency in many emergingmarket governments and multilateral institutions, which do not make time series on domestic debt easily available.Unfortunately, the poor disclosure of relevant and accurate information by the appropriate authorities inevitably
13
makes any conclusions related to events identified by a sovereign debt crisis highly unreliable. Thus, this study doesnot consider prudent to rely on these results as concrete evidence for a potentially negative relationship betweenany type of capital inflow and the included interaction and persistence terms.
The second result challenging our hypothesis is the negative and statistically significant interaction term when thelevel of total FDI is estimated after a year of a stock market crash (int3 ), for both the small and large samples.However, there is reason to believe that there should be a direct relationship between this period’s level of foreigndirect investment and the previous period’s shareholder legal protection strength given this type of crisis.Thus,it would be more appropriate to suggest an alternative explanation to why the estimation returned a negativeregression coefficient for the interaction term as opposed to a positive one. In the following we claim that this mightbe a case for omitted variable bias.
The omitted variable might very well be a measurement of the degree to which shareholders are required to internallypropose and enforce resolutions and business strategies, as opposed to having them prescribed in detail by theregulatory authority of a given country. In other words, the omitted variable may refer to how clearly does the legalframework set up at a country-level provide specific solutions that would relieve the shareholders of a corporation tohave to decide on a solution to a specific dispute during an extraordinary shareholder meeting. One example is therobustness of the body of bankruptcy law in a given country and the degree to which it specifies the process of assetdisposition in a situation of complete insolvency. If the law is clear enough about the action that the entity shouldtake when facing such situation, then there is little room for the shareholders of the company to override federal (orcountry-level) law and thus there would be a lesser need for them to reconvene to assess a proper strategy to disposeof their assets. On the other hand however, if the country-level regulation is not clear or mature enough, it becomesnecessary to establish a separate body of corporate law as it would pertain specifically to shareholder rights andprotection. In this case, it would be appropriate to assume a negative correlation between the development of ashareholder protection framework and the specificity and robustness of other areas of corporate law with regards toconflict resolution and antitrust decisions, as well as a positive correlation between the specificity and robustnessof the latter and the any period’s level of inward FDI. Thus, we would expect the coefficient of “interaction3” to bedownwards biased, which can be the reason it enters the regression with a negative sign.
It is also worth mentioning the results obtained for some of the control variables included in the model8. Forinstance, the log of GDP enters positive and significant across all financial crises analyzed. This confirms theimportance of previous episodes of economic growth in determining the attractiveness of a country as a destinationfor new waves of foreign capital. It is alto interesting the relationship that the lending rate charged to the privatesector has with both M&A and greenfield investments. In most cases, the coefficient of this control enters negativefor both types of inflows. This implies that a higher cost of borrowing is associated with a lower level of foreigncapital in the form of equity entering a country in any given period. This might suggest that debt and equity act ascomplementary sources of financing for investors. According to corporate finance theory (De Marzo, 2016), equityfinancing usually entails a greater cost of capital relative to debt, making it appropriate to establish an entity ofcarry out a transaction with an optimal combination of both of these financing instruments, and it will almostnever be optimal to do so purely with equity. This being said, the higher the cost of debt, as measured here by thelending rate, the less equity investment will be made since the overall venture becomes increasingly more expensiveif they wanted to replace debt with equity, which would in turn directly impact the project’s return on investment(ROI).
In terms of the relationship between the control variables utilized, we can also note the negative, albeit not significantrelationship between a country’s market capitalization in a given year and it’s rate of inflation. In the same way, wealso see a positive association between the former market maturity variable and the countries economic growth asmeasured by the log of its GDP. Interestingly enough, we see a highly significant and positive correlation betweenthe inflation rate and the rate with which the economy lends to the private sector. This does not necessarily implyhowever that increasing interest rates causes a higher annual inflation rate. Rather, the positive correlation betweenthese variables could indicate that the country’s central bank or rate-setting authority is merely responding to agreater inflation by raising the overnight rate charged between banks to meet reserve requirements (the federalfunds rate, in the United States). Since this rate is a key components of the ultimate lending rate at which debtis issued to enterprises, a contraction monetary policy enacted by the relevant regulatory authority would makelending rates react and adjust after recognizing the sudden increase in prices.
8Consult Appendix for comprehensive estimation results.
14
We can also note the negative, albeit not significant, relationship between Market Capitalization, and the rate ofinflation in the sample of countries analyzed9. We also see a positive relationship between these market maturityvariable and the countries’ economic growth as measured by their Gross Domestic Product. Interestingly enough,we see a highly significant and positive correlation between the inflation rate and the rate at which the economylends to the private sector. In this case, however, this doesn’t necessarily mean that increasing interest rates causesa higher level inflation. Rather, the positive correlation between these variables could indicate that the CentralBank is responding to a greater inflation by raising interest rates. Since the funds rate is a key component of theultimate lending rate at which debt is issued to enterprises as well as the additional risk premium, a raise in interestrates by the central monetary authority would make lending rates also adjust reacting after recognizing the suddenincrease in prices.
We also see that the lending rate has a statistically significant and negative correlation with a country’s MarketCapitalization. As explained in the introduction, this confirms the theory that firms utilize equity and debt ascomplement sources of financing. Thus, a higher demand for debt obligations would tend to push the lending rateshigher, at the same time that the higher utilization of debt would mean a smaller need for the private sector toissue equity in the public market to finance its endeavors, contributing to a lesser extend to the development of thematurity of the country’s financial infrastructure.
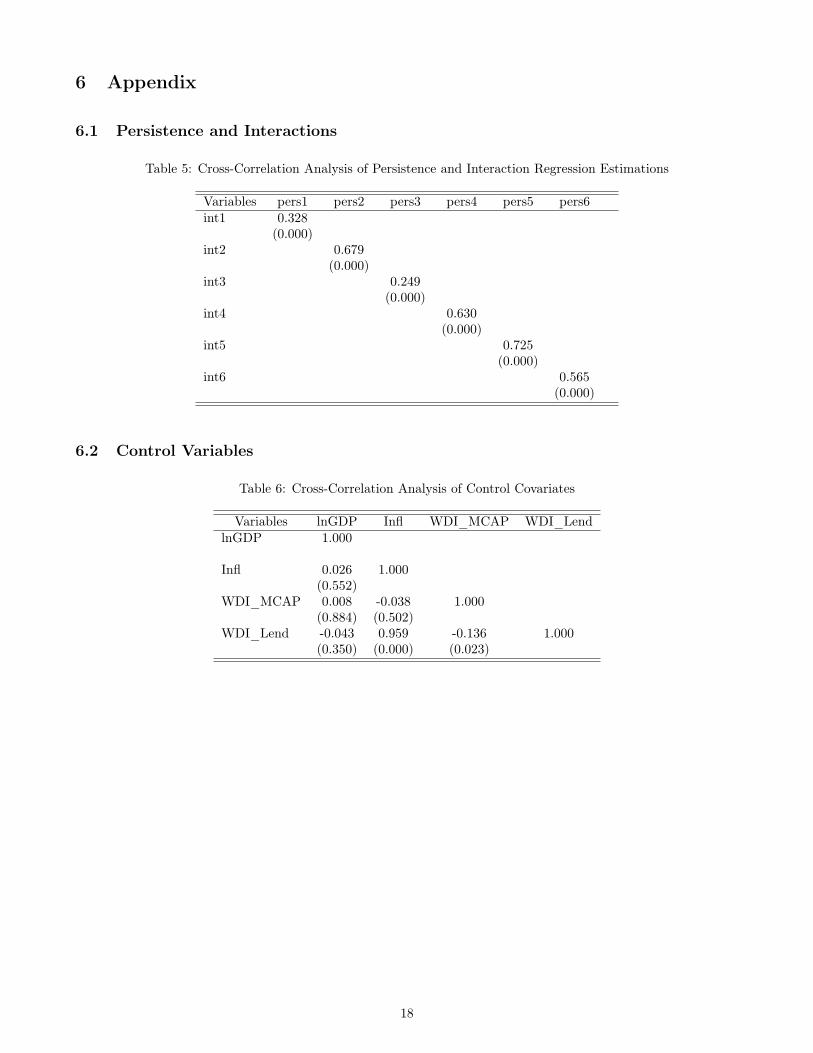
Finally, there is a positive correlation for each crisis detected in t�1 t-1 and the one detected in t�210.This impliesthat a crisis in any given period shows a relatively strong association to the existence of a crisis in the periodimmediately before that. This also signals that foreign investors, when assessing the opportunity of channelingcapital to an emerging market at one point in time, are likely to consider the influence of the shareholder protectionstrength and the existence of a crisis in both one and two years prior to their decision.
The relationship between the persistence and interaction terms also sheds light on the speed of recovery of aneconomy after a financial crisis. We could claim that the lower the correlation coefficient, the speedier the recoveryafter a financial shock since it means that there are more episodes in which a crisis year was immediately followedby a recovery period. However, we can observe that out of the 6 different types of financial distress events analyzed4 of them have a correlation that is higher than .5 which might imply that there a significant periods where thecrisis lasted for more than one year.
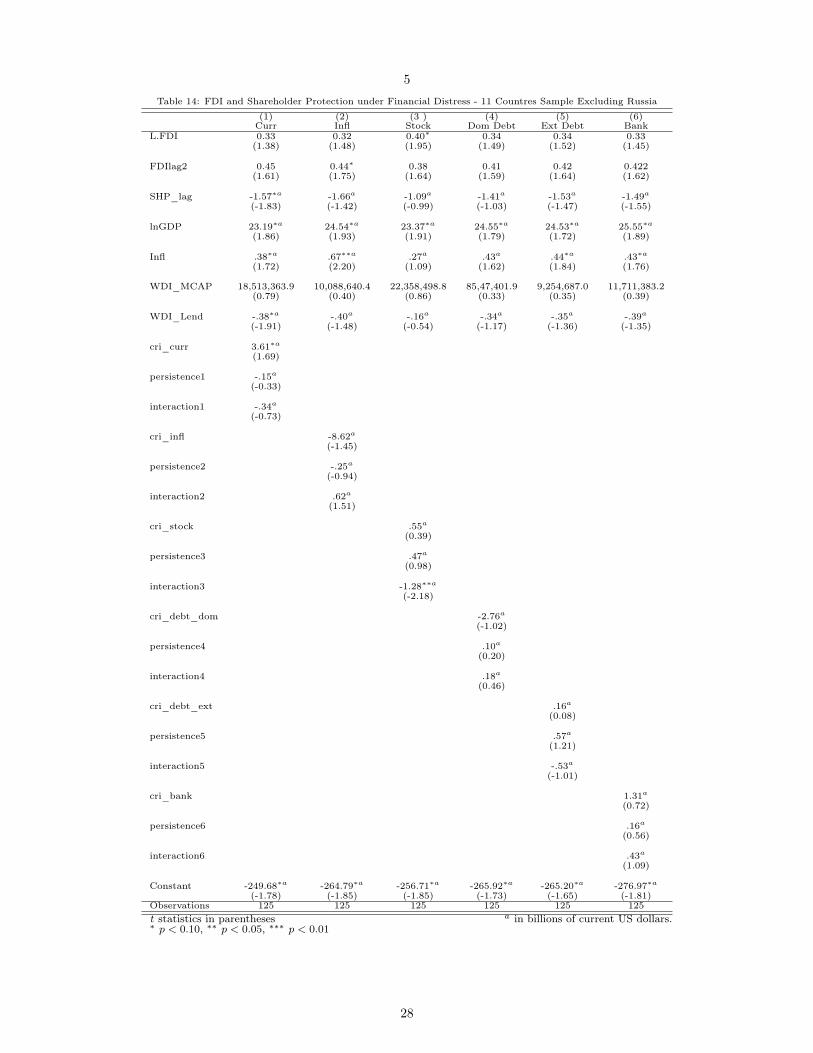
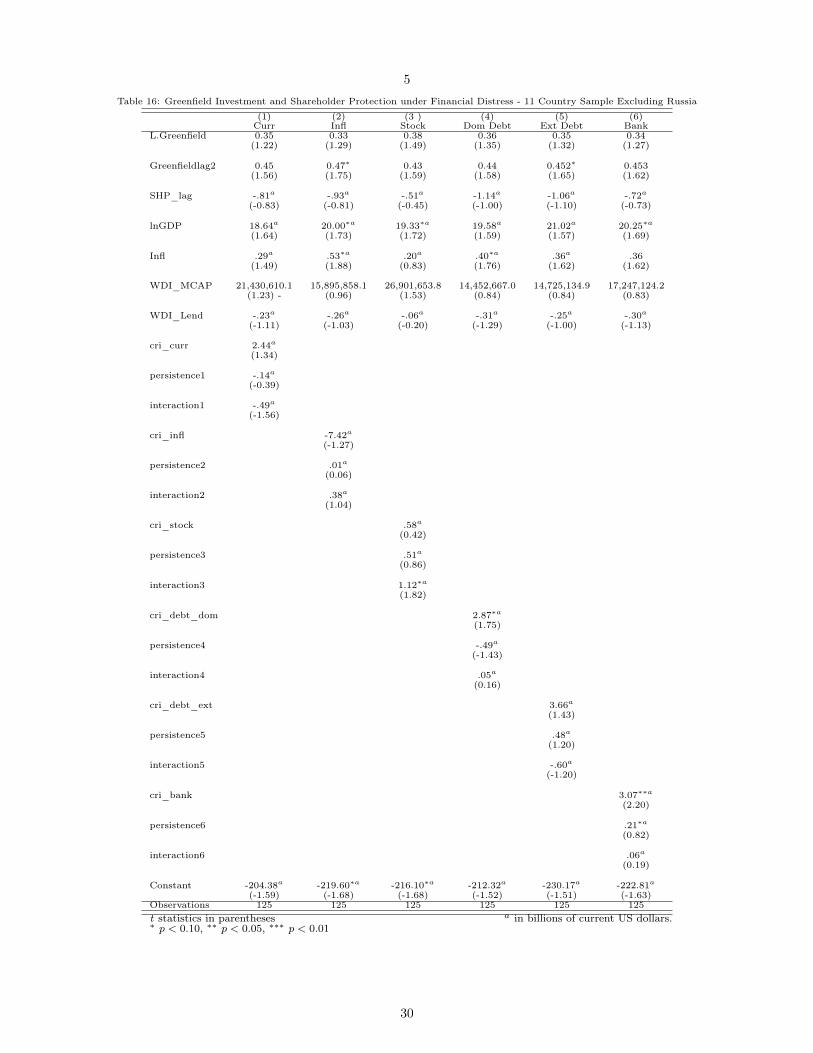
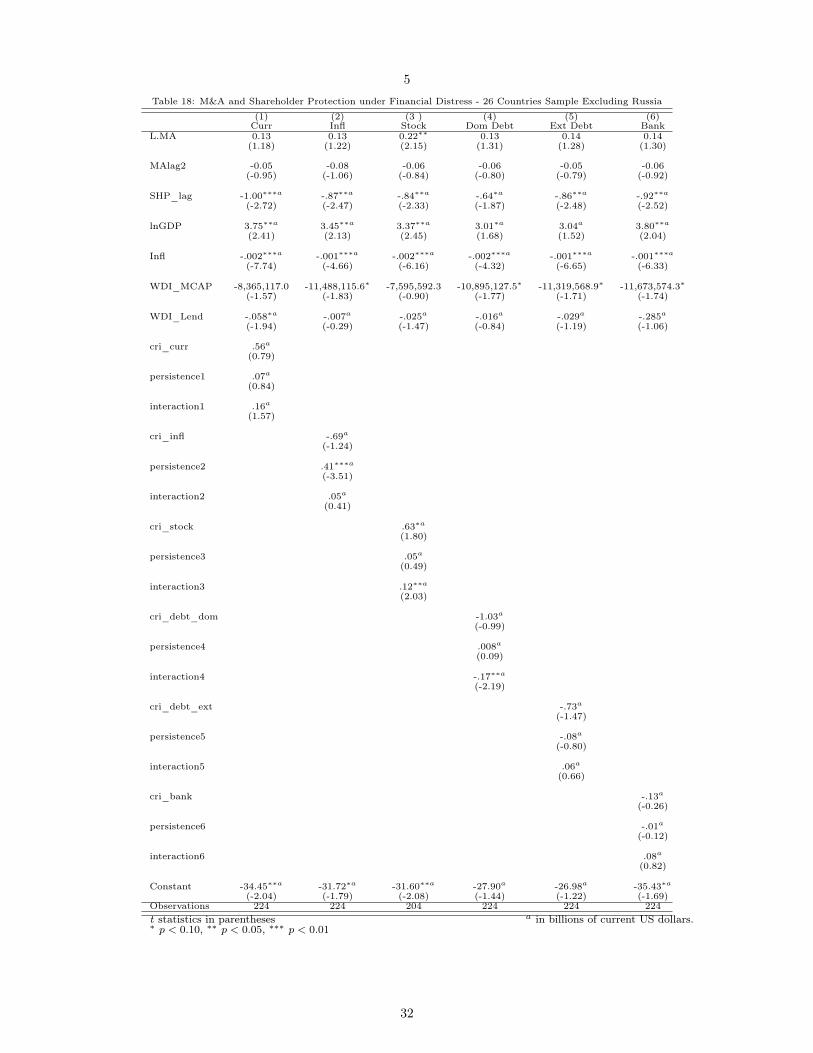
As a robustness check, the model was estimated once again utilizing the same two samples but excluding Russia11.The reason for this is that, as explained in previous sections, Russian governmental authorities did not release anycorporate shareholder guidelines until 1995 and 1996. When they decided to do so in order to attract a highershare of external financing, the measured strength of the country’s shareholder protection framework increasedsubstantially, making it a significant outlier in our sample. Our new results prove to be mostly robust to ouroriginal country specification. For instance, with regards to the 11 country sample based on Siems (2016), theregression coefficient relating total FDI and the strength of shareholder protection during the previous periodduring a stock market crash only changed by .07% and remained with the same significance level. On the samesample, the results concerning M&A did not see any change, and the ones related to greenfield investment sawa 1.8% increase and 32% decrease on the interaction regarding a stock market crash (int3 ), and the persistenceterm regarding a banking crisis (pers6 ), respectively. However, both terms kept their original statistic significance.With regards to the 26 country sample based on Guillen and Capron (2016), only the persistance of the effect of abanking crisis after two years saw a decrease in significance from 5% to a 10% level under the Total FDI specification(int6 ), and the one-lagged regression coefficient of shareholder protection and banking crisis on M&A looses it’s10% significance. Other than these changes, the estimations of our results remain largely consistent across bothsamples allowing to draw highly generalizable conclusions.
It is important to highlight however that our analysis of these correlations assume that the countries in the samplewere only experiencing one type of crosses at a time and were not suffering other negative impacts from other financialshocks from one period to the other. Given its strength and arguable real-world application, this assumption isfurther analyzed in the following section of the present research.
9These results are presented in the Control Variables section of the Appendix.10Consult Persistence and Interactions cross-correlation table in Appendix.11Comprehensive results can be consulted in the Appendix under the model estimations excluding Russia
15
5 Conclusion and Scope for Future Research
5.1 Conclusion
The aim of the present research was to extend the general understanding of the relationship between inward foreigndirect investment into emerging markets and the strength of the shareholder protection framework that thesecountries have in place for foreign minority investors during a period of financial distress. To that respect, webegan by acknowledging the fact that not all capital flows are created equal and that not all financial crises impacteconomies in the same way and thus that there was a crucial need to differentiate between them throughout ouranalysis. Examining these separately, we were able to determine that a shareholder protection framework is of mostrelevance when capital allocators are deciding whether to transfer capital in the form of a merger or an acquisition,specifically to a country that has recently suffered from a stock market crash, an inflation crisis, or a banking crisis.
The study was also able to shed light on the relationship between shareholder protection during a period of financialdistress and the subsequent level of greenfield investment into a host country. As shown in our results, investors areless interested in the immediately prior existence of a shock and are more interested on the impact of a crisis thattook place two periods before, particularly when observing countries which had suffered from an inflation crisis.The results for both of the types of FDI are consistent with the investment timeframe which is usually identified forexecution of a M&A transaction of the consolidation of a new venture in an emerging market. Some of our collateralfindings also include the complementary relationship between debt and equity as financing instruments for bothM&A and greenfield investments. We also confirmed the statistically significant relationship of these inflows withthe economic growth of the host economy.
As thorough as the present research intends to be, it is important to recognize that there is significant room forimprovement. In the following we list some potential ways in which ours results could be confirmed and furtherenriched.
5.2 Foreign Investor Heterogeneity
Even though our analysis makes special emphasis in differentiating between the two most important types of inwardforeign direct investment, the accuracy of our results could be further improved by further differentiating by the typeof investor who is channeling his capital into the host economy. In other words, having a better understanding of theseparate shares of institutional investors and individual investors or family offices who participate in this transactionwould allow us to shed light into the specific group of investors for which having a shareholder protection frameworkwould be most important. Having said this, we would most likely find an inverse relationship between the size of theagent allocating capital and its sensitivity to the strength of such legal infrastructure. Furthermore, with regards tothe data collected to analyze transactions in the form of M&A, it would be useful to obtain information regardingwhether the investor is channeling capital to the emerging market merely to increase his stake in the recipiententerprise of if it is the first time the agent is investing in such entity. The results relevant to our hypothesis wouldbecome more accurate if we were able to discard the ones whose objective is to increase their equity share in theorganization, given that they are not venturing into unchartered territory and have already fostered a relationshipwith domestic shareholders and the company’s leadership and management, as opposed to first-timers, who wouldpotentially give more importance to the existence of a robust regulatory framework that would allow them to beprotected from the uncertainty they face regarding the internal decision-making process of the company.
5.3 Domestic Investor’s Ownership Concentration
An extension of the baseline study here presented could be to modify the model estimated and include a regressorto adjust for the average ownership concentration of domestic shareholders, at the very least, at the country-level.We could speculate a direct relationship between foreign investors’ sensitivity to the strength of a shareholder pro-tection legal structure and the average ownership concentration by domestic shareholders. This would be especiallytrue where the regulatory environment does not foresee any prescriptive resolutions to prevent conflicts regarding
16
minority shareholder expropriation by the controlling shareholders. Given that previous literature has documentedthe negative correlation between domestic investor’s ownership share an foreign direct investment, and the positivecorrelation between said investor’s ownership share and the strength of shareholder protection12 we would expectthe model’s coefficients regarding the interaction and persistence terms as originally defined to be downward biased.This improvement might be challenging however, since it was already challenging to obtain reliable informationon the overall market capitalization of the publicly listed companies in some of the countries examined withoutexpressing further interest in their ownership breakdown.
5.4 Industry Segmentation and Crisis Exposure
The present research could be further improved if we could obtain information at an industry-level and adjust theestimation of our model to only focus on the industry or industries that were the most impacted by a specific typeof crisis. This targeted approach would allow us to better understand the specific ways in which specific industriesare impacted and respond to different types of crises, which would provide further guidance into whether a specificlegal framework to protect shareholders is important, or if the other bodies of corporate law are enough to coverthe needs of those industries that are relatively more crisis-prone. Even though this might potentially introduceupward bias intro our interaction and persistence estimates given that we would only be focusing on the industriesthat “truly” require or need the existence of an shareholder protection framework, if these estimate prove to bestatistically significant and small, then we could conclude that such a framework is necessary to attract foreigndirect investment after a crisis even into the most affected industries.
5.5 Crisis Interdependence
From the estimation of the model and all the way to the cross-correlation matrices of the persistence, interaction andcontrol variables, we assume that the countries were being impacted by only one type of crisis at a time. Needlessto say, this is hardly the case: an extensive body of empirical research has proven thee are of crisis contagion andtransmission. An example could be a country which suffers a currency crisis caused by abandoning a pegged currencyand a forced evaluation, which can lead to an inflation crisis and subsequently to a banking crisis. Therefore, anextension of the present research could devote part of its analysis to the relationship between the distinct typesof capital inflows and the most common combinations of financial crises occurring approximately during the sameperiod of time. This analysis would be especially important for countries such as Argentina, Indonesia, Kenya andRussia, which suffered from more than 4 types of financial crises during the same year.
5.6 A Note on Regulatory Enforceability
There might be a confounding variable that we haven’t been able to measure: regulation enforceability. Even if in theintroduction of the present research we were able to shed light on the current developments of shareholder protectionregulatory frameworks in emerging markets which show an ever-strengthening legal infrastructure, without havingadditional information on the ways in which the law is followed and applied we cannot be certain that moreshareholder regulation is anything else but a short-term attempt to signal the country’s attractiveness to foreigninvestors without delivering on its promise of protection at a later stage.
12See Lskavyan (2001).
17
6 Appendix
6.1 Persistence and Interactions
Table 5: Cross-Correlation Analysis of Persistence and Interaction Regression Estimations
Variables pers1 pers2 pers3 pers4 pers5 pers6int1 0.328
(0.000)int2 0.679
(0.000)int3 0.249
(0.000)int4 0.630
(0.000)int5 0.725
(0.000)int6 0.565
(0.000)
6.2 Control Variables
Table 6: Cross-Correlation Analysis of Control Covariates
Variables lnGDP Infl WDI_MCAP WDI_LendlnGDP 1.000
Infl 0.026 1.000(0.552)
WDI_MCAP 0.008 -0.038 1.000(0.884) (0.502)
WDI_Lend -0.043 0.959 -0.136 1.000(0.350) (0.000) (0.023)
18
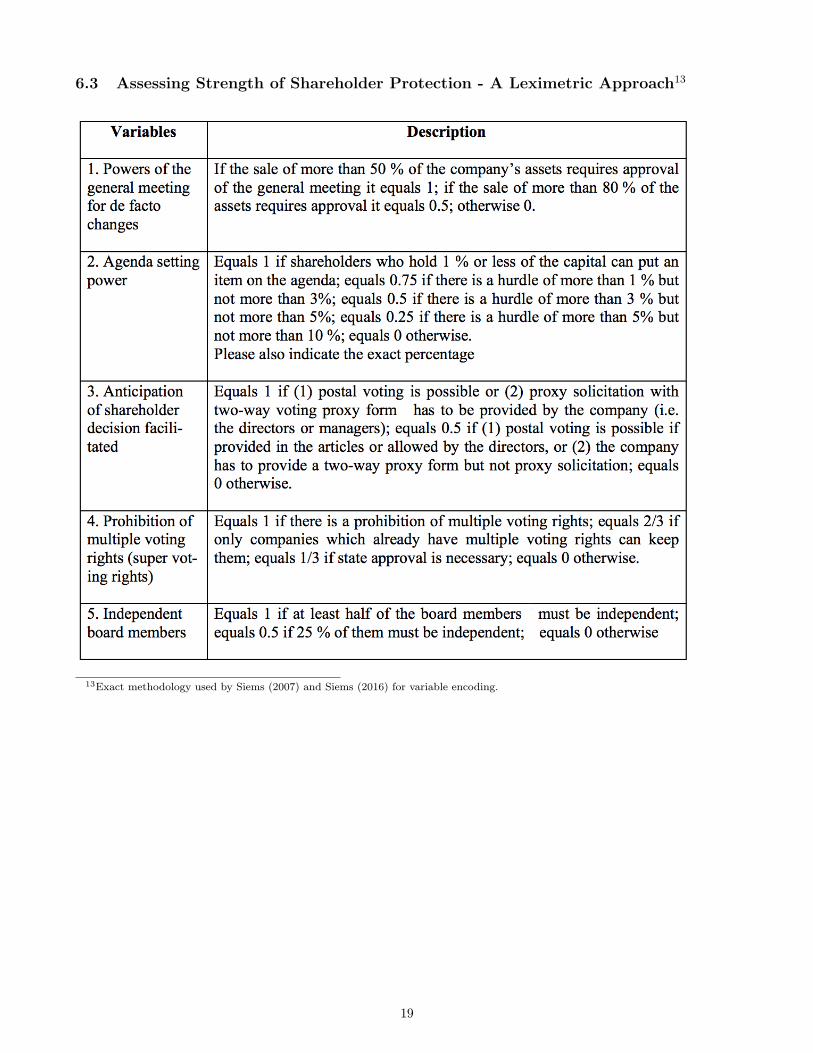
6.3 Assessing Strength of Shareholder Protection - A Leximetric Approach13
13Exact methodology used by Siems (2007) and Siems (2016) for variable encoding.
19
20
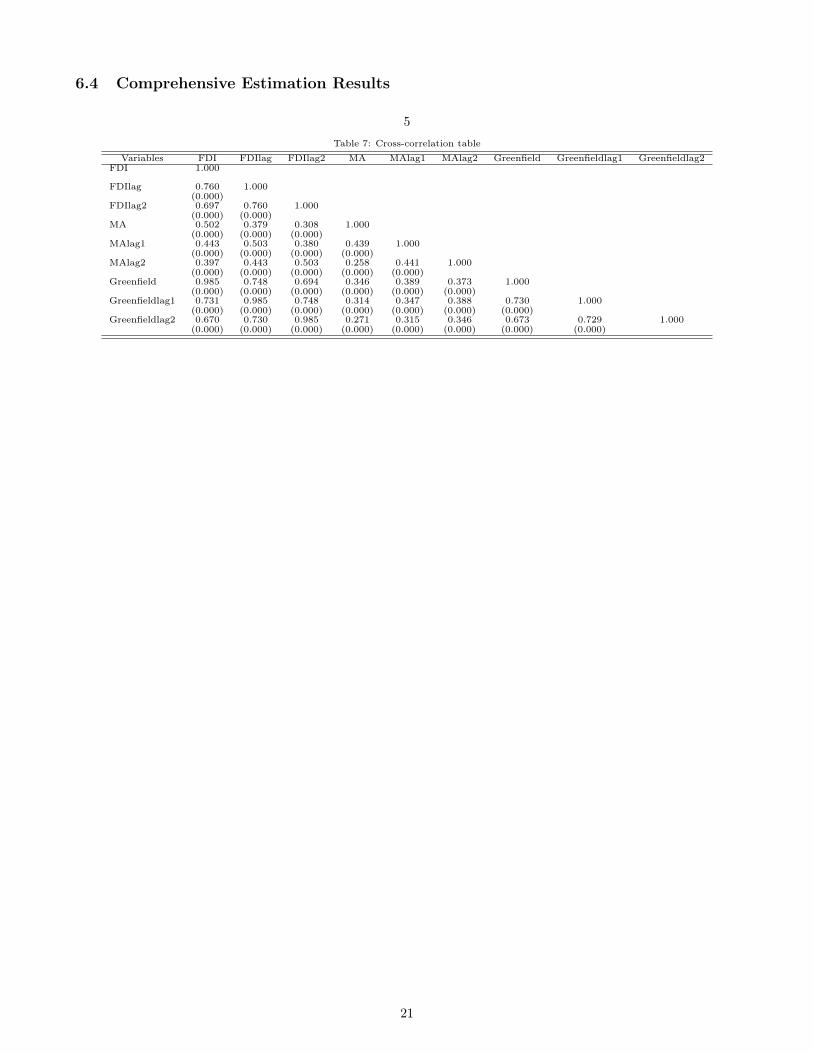
6.4 Comprehensive Estimation Results
5Table 7: Cross-correlation table
Variables FDI FDIlag FDIlag2 MA MAlag1 MAlag2 Greenfield Greenfieldlag1 Greenfieldlag2FDI 1.000
FDIlag 0.760 1.000(0.000)
FDIlag2 0.697 0.760 1.000(0.000) (0.000)
MA 0.502 0.379 0.308 1.000(0.000) (0.000) (0.000)
MAlag1 0.443 0.503 0.380 0.439 1.000(0.000) (0.000) (0.000) (0.000)
MAlag2 0.397 0.443 0.503 0.258 0.441 1.000(0.000) (0.000) (0.000) (0.000) (0.000)
Greenfield 0.985 0.748 0.694 0.346 0.389 0.373 1.000(0.000) (0.000) (0.000) (0.000) (0.000) (0.000)
Greenfieldlag1 0.731 0.985 0.748 0.314 0.347 0.388 0.730 1.000(0.000) (0.000) (0.000) (0.000) (0.000) (0.000) (0.000)
Greenfieldlag2 0.670 0.730 0.985 0.271 0.315 0.346 0.673 0.729 1.000(0.000) (0.000) (0.000) (0.000) (0.000) (0.000) (0.000) (0.000)
21
5Table 8: FDI and Shareholder Protection under Financial Distress -11 Countries Sample
(1) (2) (3) (4) (5) (6)Curr Infl Stock Dom Debt Ext Debt Bank
L.FDI 0.34⇤ 0.33⇤ 0.43⇤⇤⇤ 0.34⇤ 0.34⇤ 0.34⇤
(1.76) (1.95) (2.75) (1.92) (1.96) (1.87)
FDIlag2 0.40⇤ 0.41⇤ 0.34⇤ 0.39⇤ 0.39⇤ 0.39⇤
(1.74) (1.89) (1.83) (1.76) (1.81) (1.78)
SHP_lag -1.37a -1.47a -.91a -1.20a -1.40a -1.31a
(-1.43) (-1.19) (-0.79) (-0.77) (-1.26) (-1.24)
lnGDP 23.7706⇤a 25.24⇤⇤a 23.49⇤⇤a 25.25⇤a 25.64⇤a 26.57⇤⇤a
(1.95) (2.03) (2.00) (1.89) (1.82) (2.07)
Infl .33a .60⇤a .23a .40a .40a .39a
(1.43) (1.95) (0.90) (1.45) (1.60) (1.50)
WDI_MCAP 20,529,157.5 11,387,703.2 23,419,740.8 10,052,375.8 10,572,406.9 13,566,614.1(0.92) (0.46) (0.95) (0.40) (0.41) (0.47)
WDI_Lend -.34a -.36a -.12a -.30a -.31a -.33a
(-1.59) (-1.26) (-0.38) (-0.97) (-1.12) (-1.09)
cri_curr 3.81⇤a
(1.71)
persistence1 .03a
(-0.07)
interaction1 -.35a
(-0.77)
cri_infl -7.54a
(-1.32)
persistence2 -.22a
(-0.76)
interaction2 .58a
(1.45)
cri_stock .47a
(0.34)
persistence3 .50a
(1.13)
interaction3 -1.29⇤⇤a
(-2.48)
cri_debt_dom -2.81a
(-1.02)
persistence4 .10a
(0.20)
interaction4 .14a
(0.33)
cri_debt_ext .34a
(0.19)
persistence5 .58a
(1.20)
interaction5 -.45a
(-0.82)
cri_bank .83a
(0.40)
persistence6 .32a
(1.62)
interaction6 .39a
(0.94)
Constant -258.11⇤a -274.38⇤a -259.74⇤a -275.71⇤a -279.32⇤a -290.697⇤⇤a
(-1.87) (-1.95) (-1.94) (-1.83) (-1.74) (-1.99)Observations 126 126 126 126 126 126t statistics in parentheses a in billions of current US dollars.⇤ p < 0.10, ⇤⇤ p < 0.05, ⇤⇤⇤ p < 0.01
22

5Table 9: M&A and Shareholder Protection under Financial Distress- 11 Countries Sample
(1) (2) (3) (4) (5) (6)Curr Infl Stock Dom Debt Ext Debt Bank
L.MA 0.19⇤ 0.20⇤⇤ 0.24⇤⇤ 0.20⇤⇤ 0.21⇤⇤ 0.21⇤⇤
(1.73) (2.13) (2.53) (2.15) (2.13) (2.24)
MAlag2 -0.03 -0.06 -0.05 -0.01 -0.03 -0.03(-0.41) (-0.56) (-0.64) (-0.12) (-0.31) (-0.42)
SHP_lag -.91⇤⇤⇤a -.75⇤⇤⇤a -.68⇤⇤⇤a -.31a -.70⇤⇤⇤a -.92⇤⇤⇤a
(-5.70) (-3.41) (-4.13) (-0.86) (-5.19) (-5.50)
lnGDP 5.56⇤⇤⇤a 5.43⇤⇤⇤a 5.14⇤⇤⇤a 4.86⇤⇤⇤a 4.59⇤⇤a 6.16⇤⇤⇤a
(3.31) (3.12) (3.58) (2.80) (2.13) (3.26)
Infl -.04a -.02a -.05a -.04a -.02a -.06a
(-0.88) (-0.37) (-1.09) (-0.83) (-0.35) (-1.11)
WDI_MCAP -6,587,116.3 -8,924,959.6 -5,691,404.7 -8,481,227.3 -8,190,727.7 -8,602,461.1(-1.27) (-1.42) (-0.89) (-1.39) (-1.34) (-1.42)
WDI_Lend -.03a .002a .007a .03a -.02a .03a
(-0.60) (0.05) (0.16) (0.60) (-0.34) (0.51)
cri_curr .87a
(0.74)
persistence1 .06a
(0.43)
interaction1 .18a
(1.45)
cri_infl .37a
(0.67)
persistence2 .50⇤⇤⇤a
(-6.02)
interaction2 .03a
(0.16)
cri_stock .52a
(1.10)
persistence3 .04a
(0.30)
interaction3 .15⇤⇤a
(2.35)
cri_debt_dom -3.05⇤⇤⇤a
(-5.57)
persistence4 .20⇤⇤⇤a
(2.88)
interaction4 -.17⇤⇤a
(-2.29)
cri_debt_ext -1.09a
(-1.25)
persistence5 -.18a
(-1.09)
interaction5 -.001a
(-0.01)
cri_bank -1.97⇤⇤⇤a
(-3.26)
persistence6 -.10a
(-1.57)
interaction6 .32⇤⇤a
(2.12)
Constant -55.99⇤⇤⇤a -55.13⇤⇤⇤a -52.66⇤⇤⇤a -51.36⇤⇤⇤a -45.63⇤a -63.15⇤⇤⇤a
(-2.77) (-2.68) (-3.06) (-2.59) (-1.79) (-2.79)Observations 126 126 126 126 126 126t statistics in parentheses a in billions of current US dollars.⇤ p < 0.10, ⇤⇤ p < 0.05, ⇤⇤⇤ p < 0.01
23
5Table 10: Greenfield Investment and Shareholder Protection under Financial Distress - 11 Countries Sample
(1) (2) (3 ) (4) (5) (6)Curr Infl Stock Dom Debt Ext Debt Bank
L.Greenfield 0.38 0.36⇤ 0.43⇤⇤ 0.38⇤ 0.37⇤ 0.36(1.54) (1.71) (2.12) (1.74) (1.70) (1.62)
Greenfieldlag2 0.42⇤ 0.42⇤ 0.38⇤ 0.41⇤ 0.41⇤ 0.420⇤
(1.66) (1.88) (1.77) (1.75) (1.82) (1.78)
SHP_lag -.64a -.77a -.37a -.94a -.92a -.55a
(-0.62) (-0.64) (-0.31) (-0.71) (-0.90) (-0.52)
lnGDP 18.91⇤a 20.37⇤a 19.29⇤a 19.93a 21.71a 20.88⇤a
(1.67) (1.79) (1.76) (1.64) (1.63) (1.81)
Infl .25a .47⇤a .17a .36a .32a .32a
(1.24) (1.65) (0.66) (1.56) (1.36) (1.38)
WDI_MCAP 2,3162,336.0 17,114,056.0 27,416,154.3⇤ 15,839,072.8 15,976,334.8 18,920,364.9(1.39) (1.06) (1.71) (0.96) (0.93) (0.95)
WDI_Lend -.20a -.23a -.03a -.28a -.21a -.26a
(-0.91) (-0.86) (-0.10) (-1.04) (-0.79) (-0.93)
cri_curr 2.58a
(1.39)
persistence1 -.06a
(-0.17)
interaction1 -.47a
(-1.36)
cri_infl -6.30a
(-1.15)
persistence2 .05a
(0.21)
interaction2 .35a
(0.99)
cri_stock .40a
(0.31)
persistence3 .51a
(0.95)
interaction3 1.10⇤⇤a
(2.08)
cri_debt_dom 2.68a
(1.47)
persistence4 -.46a
(-1.24)
interaction4 .02a
(0.06)
cri_debt_ext 3.66a
(1.51)
persistence5 .50a
(1.24)
interaction5 -.52a
(-0.97)
cri_bank 2.74a
(1.55)
persistence6 .31⇤a
(1.94)
interaction6 .05a
(0.14)
Constant -209.08a -225.14⇤a -216.90⇤a -217.92a -239.40a -231.72⇤a
(-1.62) (-1.74) (-1.72) (-1.58) (-1.57) (-1.76)Observations 126 126 126 126 126 126t statistics in parentheses a in billions of current US dollars.⇤ p < 0.10, ⇤⇤ p < 0.05, ⇤⇤⇤ p < 0.01
24

5Table 11: FDI and Shareholder Protection under Financial Distress - 26 Countries Sample
(1) (2) (3 ) (4) (5) (6)Curr Infl Stock Dom Debt Ext Debt Bank
L.FDI 0.30⇤ 0.31⇤ 0.32 0.31⇤ 0.31⇤ 0.30⇤
(1.67) (1.80) (1.52) (1.76) (1.78) (1.72)
FDIlag2 0.49⇤ 0.48⇤⇤ 0.49⇤ 0.48⇤⇤ 0.48⇤⇤ 0.48⇤⇤
(1.91) (1.97) (1.83) (1.96) (1.99) (1.98)
SHP_lag -1.11a -1.18a -.81a -1.05a -1.19a -1.27a
(-1.28) (-1.10) (-0.93) (-1.14) (-1.18) (-1.28)
lnGDP 13.78⇤⇤a 14.25⇤⇤a 146.75⇤⇤a 14.14⇤⇤a 15.06⇤a 17.53⇤⇤a
(2.03) (1.97) (2.03) (2.02) (1.94) (2.11)
Infl -.001a -.001a -.002⇤a -.001⇤a -.001a -.043a
(-1.42) (-1.37) (-1.70) (-1.72) (-1.30) (-0.03)
WDI_MCAP 14,312,399.6 8,397,307.5 9,062,894.1 78,66,109.8 70,09,750.1 10,248,683.1(1.39) (0.77) (0.60) (0.77) (0.67) (0.82)
WDI_Lend -.12a -.07a .02a -.06a -.06a -.08a
(-1.06) (-0.49) (0.17) (-0.55) (-0.59) (-0.71)
cri_curr 2.52⇤⇤a
(2.31)
persistence1 .02a
(0.06)
interaction1 -.15a
(-0.50)
cri_infl -.52a
(-0.17)
persistence2 .23a
(0.91)
interaction2 .16a
(1.30)
cri_stock .39a
(0.50)
persistence3 .35a
(1.06)
interaction3 -.79⇤⇤a
(-1.97)
cri_debt_dom -1.43a
(-0.75)
persistence4 .05a
(0.28)
interaction4 .10a
(0.30)
cri_debt_ext .25a
(0.18)
persistence5 .37a
(1.55)
interaction5 -.05a
(-0.23)
cri_bank 1.04a
(0.66)
persistence6 .32⇤⇤a
(2.41)
interaction6 .34a
(1.51)
Constant -144.37⇤⇤a -149.60⇤a -157.94⇤⇤a -148.99⇤⇤a -158.64⇤a -186.10⇤⇤a
(-1.99) (-1.96) (-2.01) (-1.99) (-1.91) (-2.09)Observations 248 248 223 248 248 248t statistics in parentheses a in billions of current US dollars.⇤ p < 0.10, ⇤⇤ p < 0.05, ⇤⇤⇤ p < 0.01
25

5Table 12: M&A and Shareholder Protection under Financial Distress - 26 Countries Sample
(1) (2) (3 ) (4) (5) (6)Curr Infl Stock Dom Debt Ext Debt Bank
L.MA 0.14 0.13 0.22⇤⇤ 0.13 0.14 0.15(1.28) (1.30) (2.15) (1.40) (1.36) (1.37)
MAlag2 -0.05 -0.08 -0.06 -0.06 -0.05 -0.06(-0.96) (-1.06) (-0.84) (-0.80) (-0.79) (-0.93)
SHP_lag -.99⇤⇤⇤a -.87⇤⇤a -.84⇤⇤a -.64⇤a -.86⇤⇤a -.92⇤⇤a
(-2.69) (-2.46) (-2.33) (-1.87) (-2.47) (-2.49)
lnGDP 3.74⇤⇤a 3.44⇤⇤a 3.36⇤⇤a 3.00⇤a 3.03a 3.78⇤⇤a
(2.43) (2.14) (2.45) (1.69) (1.53) (2.10)
Infl -.001⇤⇤⇤a -.001⇤⇤⇤a -.002⇤⇤⇤a -.002⇤⇤⇤a -.001⇤⇤⇤a -.001⇤⇤⇤a
(-8.05) (-4.70) (-6.14) (-4.29) (-6.63) (-6.31)
WDI_MCAP -81,60,721.0 -11,470,022.8⇤ -7,549,857.8 -10,890,110.9⇤ -11,320,169.0⇤ -11,647,981.2⇤
(-1.51) (-1.83) (-0.89) (-1.77) (-1.72) (-1.76)
WDI_Lend -.052⇤a -.007a -.025a -.016a -.029a -.028a
(-1.89) (-0.29) (-1.46) (-0.83) (-1.18) (-1.12)
cri_curr .573a
(0.80)
persistence1 .06a
(0.76)
interaction1 .16a
(1.63)
cri_infl -.69a
(-1.25)
persistence2 .41⇤⇤⇤a
(3.51)
interaction2 .05a
(0.41)
cri_stock .63⇤a
(1.80)
persistence3 .05a
(0.49)
interaction3 .12⇤⇤a
(2.04)
cri_debt_dom -1.03a
(-0.99)
persistence4 .009a
(0.10)
interaction4 -.17⇤⇤a
(-2.19)
cri_debt_ext -.73a
(-1.50)
persistence5 -.08a
(-0.80)
interaction5 -.06a
(0.66)
cri_bank -.12a
(-0.24)
persistence6 -.10a
(-0.19)
interaction6 .08⇤a
(1.83)
Constant -34.40⇤⇤a -31.62⇤a -31.56⇤⇤a -27.85a -26.95a -35.23⇤a
(-2.06) (-1.80) (-2.08) (-1.44) (-1.22) (-1.73)Observations 225 225 203 225 225 225t statistics in parentheses a in billions of current US dollars.⇤ p < 0.10, ⇤⇤ p < 0.05, ⇤⇤⇤ p < 0.01
26

5Table 13: Greenfield Investment and Shareholder Protection under Financial Distress - 26 Countries Sample
(1) (2) (3 ) (4) (5) (6)Curr Infl Stock Dom Debt Ext Debt Bank
L.Greenfield 0.31 0.32⇤ 0.29 0.31 0.32⇤ 0.314(1.49) (1.69) (1.18) (1.64) (1.67) (1.60)
Greenfieldlag2 0.52⇤⇤ 0.50⇤⇤ 0.54⇤ 0.51⇤⇤ 0.50⇤⇤ 0.50⇤⇤
(2.06) (2.14) (1.90) (2.14) (2.17) (2.14)
SHP_lag -.98a -1.14a -.85a -1.18a -1.23a -1.16a
(-0.99) (-1.06) (-0.97) (-1.20) (-1.24) (-1.18)
lnGDP 12.67⇤⇤a 13.99⇤⇤a 14.11⇤a 13.84⇤⇤a 14.84⇤⇤a 15.94⇤⇤a
(2.01) (2.12) (1.95) (2.09) (2.09) (2.26)
Infl -.08a -.11a -.002a -.001a -.008a -.006a
(-0.83) (-1.41) (-1.22) (-1.19) (-0.98) (-0.91)
WDI_MCAP 20,259,241.0 16,228,276.6 16,690,550.2 16,372,427.3 16,452,392.6 21,088,768.7(1.57) (1.61) (1.53) (1.54) (1.55) (1.55)
WDI_Lend -.02a -.01a .05a -.03a -.01a -.02a
(-0.31) (-0.10) (0.39) (-0.32) (-0.20) (-0.29)
cri_curr 1.44a
(1.10)
persistence1 -.11a
(-0.37)
interaction1 -.35a
(-1.45)
cri_infl -.76a
(-0.23)
persistence2 .29a
(1.35)
interaction2 -.08a
(-0.53)
cri_stock .33a
(0.42)
persistence3 .39a
(0.88)
interaction3 -.64a
(-1.43)
cri_debt_dom .91a
(0.86)
persistence4 -.17a
(-1.13)
interaction4 .06a
(0.19)
cri_debt_ext 1.76a
(1.32)
persistence5 .29⇤a
(1.74)
interaction5 -.20a
(-0.84)
cri_bank 1.08a
(0.95)
persistence6 .22⇤⇤a
(2.15)
interaction6 .23a
(1.05)
Constant -135.51⇤⇤a -149.69⇤⇤a -154.26⇤a -147.58⇤⇤a -158.95⇤⇤a -171.95⇤⇤a
(-2.02) (-2.13) (-1.93) (-2.09) (-2.08) (-2.27)Observations 225 225 203 225 225 225t statistics in parentheses a in billions of current US dollars.⇤ p < 0.10, ⇤⇤ p < 0.05, ⇤⇤⇤ p < 0.01
27
5Table 14: FDI and Shareholder Protection under Financial Distress - 11 Countres Sample Excluding Russia
(1) (2) (3 ) (4) (5) (6)Curr Infl Stock Dom Debt Ext Debt Bank
L.FDI 0.33 0.32 0.40⇤ 0.34 0.34 0.33(1.38) (1.48) (1.95) (1.49) (1.52) (1.45)
FDIlag2 0.45 0.44⇤ 0.38 0.41 0.42 0.422(1.61) (1.75) (1.64) (1.59) (1.64) (1.62)
SHP_lag -1.57⇤a -1.66a -1.09a -1.41a -1.53a -1.49a
(-1.83) (-1.42) (-0.99) (-1.03) (-1.47) (-1.55)
lnGDP 23.19⇤a 24.54⇤a 23.37⇤a 24.55⇤a 24.53⇤a 25.55⇤a
(1.86) (1.93) (1.91) (1.79) (1.72) (1.89)
Infl .38⇤a .67⇤⇤a .27a .43a .44⇤a .43⇤a
(1.72) (2.20) (1.09) (1.62) (1.84) (1.76)
WDI_MCAP 18,513,363.9 10,088,640.4 22,358,498.8 85,47,401.9 9,254,687.0 11,711,383.2(0.79) (0.40) (0.86) (0.33) (0.35) (0.39)
WDI_Lend -.38⇤a -.40a -.16a -.34a -.35a -.39a
(-1.91) (-1.48) (-0.54) (-1.17) (-1.36) (-1.35)
cri_curr 3.61⇤a
(1.69)
persistence1 -.15a
(-0.33)
interaction1 -.34a
(-0.73)
cri_infl -8.62a
(-1.45)
persistence2 -.25a
(-0.94)
interaction2 .62a
(1.51)
cri_stock .55a
(0.39)
persistence3 .47a
(0.98)
interaction3 -1.28⇤⇤a
(-2.18)
cri_debt_dom -2.76a
(-1.02)
persistence4 .10a
(0.20)
interaction4 .18a
(0.46)
cri_debt_ext .16a
(0.08)
persistence5 .57a
(1.21)
interaction5 -.53a
(-1.01)
cri_bank 1.31a
(0.72)
persistence6 .16a
(0.56)
interaction6 .43a
(1.09)
Constant -249.68⇤a -264.79⇤a -256.71⇤a -265.92⇤a -265.20⇤a -276.97⇤a
(-1.78) (-1.85) (-1.85) (-1.73) (-1.65) (-1.81)Observations 125 125 125 125 125 125t statistics in parentheses a in billions of current US dollars.⇤ p < 0.10, ⇤⇤ p < 0.05, ⇤⇤⇤ p < 0.01
28
5Table 15: M&A and Shareholder Protection under Financial Distress - 11 Country Sample Excluding Russia
(1) (2) (3 ) (4) (5) (6)Curr Infl Stock Dom Debt Ext Debt Bank
L.MA 0.20⇤ 0.20⇤⇤ 0.24⇤⇤ 0.20⇤⇤ 0.21⇤⇤ 0.20⇤⇤
(1.72) (2.03) (2.43) (2.07) (2.04) (2.08)
MAlag2 -0.03 -0.05 -0.05 -0.01 -0.03 -0.03(-0.40) (-0.54) (-0.63) (-0.10) (-0.28) (-0.39)
SHP_lag -.90⇤⇤⇤a -.75⇤⇤⇤a -.68⇤⇤⇤a -.30a -.70⇤⇤⇤a -.92⇤⇤⇤a
(-5.86) (-3.38) (-4.10) (-0.85) (-5.39) (-5.66)
lnGDP 5.53⇤⇤⇤a 5.41⇤⇤⇤a 5.15⇤⇤⇤a 4.84⇤⇤⇤a 4.57⇤⇤a 6.21⇤⇤⇤a
(3.24) (3.08) (3.59) (2.76) (2.10) (3.13)
Infl -.03a -.02a -.05a -.041a -.01a -.05a
(-0.86) (-0.37) (-1.08) (-0.83) (-0.35) (-1.10)
WDI_MCAP -6,530,925.0 -8,890,214.8 -5,655,888.7 -8,444,637.7 -8,153,312.8 -8,580,432.8(-1.25) (-1.42) (-0.89) (-1.38) (-1.33) (-1.42)
WDI_Lend -.036a .002a .007a .033a -.020a .034a
(-0.60) (0.05) (0.16) (0.61) (-0.33) (0.51)
cri_curr .87a
(0.74)
persistence1 .04a
(0.31)
interaction1 .18a
(1.47)
cri_infl -.37a
(-0.66)
persistence2 -.50⇤⇤⇤a
(-6.02)
interaction2 -.02a
(-0.16)
cri_stock .05a
(1.10)
persistence3 .04a
(0.32)
interaction3 .15⇤⇤a
(2.31)
cri_debt_dom -3.07⇤⇤⇤a
(-5.64)
persistence4 .20⇤⇤⇤a
(3.02)
interaction4 -.16⇤⇤a
(-2.24)
cri_debt_ext -1.11a
(-1.27)
persistence5 -.17a
(-1.08)
interaction5 -.08a
(-0.01)
cri_bank -2.02⇤⇤⇤a
(-2.98)
persistence6 -.08a
(-1.08)
interaction6 .31⇤⇤a
(2.27)
Constant -55.58⇤⇤⇤a -55.00⇤⇤⇤a -52.83⇤⇤⇤a -51.12⇤⇤a -45.41⇤a -63.7399⇤⇤⇤a
(-2.72) (-2.65) (-3.07) (-2.57) (-1.77) (-2.68)Observations 125 125 125 125 125 125t statistics in parentheses a in billions of current US dollars.⇤ p < 0.10, ⇤⇤ p < 0.05, ⇤⇤⇤ p < 0.01
29
5Table 16: Greenfield Investment and Shareholder Protection under Financial Distress - 11 Country Sample Excluding Russia
(1) (2) (3 ) (4) (5) (6)Curr Infl Stock Dom Debt Ext Debt Bank
L.Greenfield 0.35 0.33 0.38 0.36 0.35 0.34(1.22) (1.29) (1.49) (1.35) (1.32) (1.27)
Greenfieldlag2 0.45 0.47⇤ 0.43 0.44 0.452⇤ 0.453(1.56) (1.75) (1.59) (1.58) (1.65) (1.62)
SHP_lag -.81a -.93a -.51a -1.14a -1.06a -.72a
(-0.83) (-0.81) (-0.45) (-1.00) (-1.10) (-0.73)
lnGDP 18.64a 20.00⇤a 19.33⇤a 19.58a 21.02a 20.25⇤a
(1.64) (1.73) (1.72) (1.59) (1.57) (1.69)
Infl .29a .53⇤a .20a .40⇤a .36a .36(1.49) (1.88) (0.83) (1.76) (1.62) (1.62)
WDI_MCAP 21,430,610.1 15,895,858.1 26,901,653.8 14,452,667.0 14,725,134.9 17,247,124.2(1.23) - (0.96) (1.53) (0.84) (0.84) (0.83)
WDI_Lend -.23a -.26a -.06a -.31a -.25a -.30a
(-1.11) (-1.03) (-0.20) (-1.29) (-1.00) (-1.13)
cri_curr 2.44a
(1.34)
persistence1 -.14a
(-0.39)
interaction1 -.49a
(-1.56)
cri_infl -7.42a
(-1.27)
persistence2 .01a
(0.06)
interaction2 .38a
(1.04)
cri_stock .58a
(0.42)
persistence3 .51a
(0.86)
interaction3 1.12⇤a
(1.82)
cri_debt_dom 2.87⇤a
(1.75)
persistence4 -.49a
(-1.43)
interaction4 .05a
(0.16)
cri_debt_ext 3.66a
(1.43)
persistence5 .48a
(1.20)
interaction5 -.60a
(-1.20)
cri_bank 3.07⇤⇤a
(2.20)
persistence6 .21⇤a
(0.82)
interaction6 .06a
(0.19)
Constant -204.38a -219.60⇤a -216.10⇤a -212.32a -230.17a -222.81a
(-1.59) (-1.68) (-1.68) (-1.52) (-1.51) (-1.63)Observations 125 125 125 125 125 125t statistics in parentheses a in billions of current US dollars.⇤ p < 0.10, ⇤⇤ p < 0.05, ⇤⇤⇤ p < 0.01
30

5Table 17: FDI and Shareholder Protection under Financial Distress - 26 Countries Sample Excluding Russia
(1) (2) (3 ) (4) (5) (6)Curr Infl Stock Dom Debt Ext Debt Bank
L.FDI 0.29 0.31 0.32 0.30 0.30 0.30(1.31) (1.40) (1.57) (1.37) (1.38) (1.32)
FDIlag2 0.50⇤ 0.50⇤ 0.48⇤ 0.50⇤ 0.50⇤ 0.500⇤
(1.76) (1.76) (1.83) (1.75) (1.78) (1.78)
SHP_lag -1.09a -1.14a -.83a -1.00a -1.12a -1.23a
(-1.19) (-1.05) (-0.95) (-1.09) (-1.10) (-1.22)
lnGDP 13.45⇤a 13.74⇤a 14.76⇤⇤a 13.64⇤a 14.34⇤a 16.99⇤⇤a
(1.94) (1.86) (2.04) (1.91) (1.83) (1.96)
Infl -.001a -.001a -.002⇤a -.001⇤a -.002a -.003a
(-1.44) (-1.32) (-1.70) (-1.65) (-1.29) (-0.03)
WDI_MCAP 14,611,119.7 8,864,487.0 8,749,218.3 8,229,629.2 7,653,274.4 10,680,636.0(1.42) (0.86) (0.56) (0.86) (0.78) (0.91)
WDI_Lend -.12a -.71a .01a -.06a -.06a -.91a
(-1.07) (-0.46) (0.16) (-0.54) (-0.57) (-0.75)
cri_curr 2.52⇤⇤a
(2.16)
persistence1 .10a
(0.32)
interaction1 -.16a
(-0.54)
cri_infl -.72a
(-0.23)
persistence2 .23a
(0.90)
interaction2 .16a
(1.33)
cri_stock .38a
(0.49)
persistence3 .35a
(1.06)
interaction3 -.79⇤⇤a
(-1.97)
cri_debt_dom -1.56a
(-0.79)
persistence4 .06a
(0.35)
interaction4 .09a
(0.27)
cri_debt_ext -.11a
(-0.08)
persistence5 .37a
(1.56)
interaction5 -.07a
(-0.30)
cri_bank 1.21a
(0.79)
persistence6 .26⇤a
(1.81)
interaction6 .35a
(1.56)
Constant -140.66⇤a -144.05⇤a -158.90⇤⇤a -143.57⇤a -150.90⇤a -179.62⇤a
(-1.91) (-1.85) (-2.01) (-1.88) (-1.80) (-1.94)Observations 247 247 224 247 247 247t statistics in parentheses a in billions of current US dollars.⇤ p < 0.10, ⇤⇤ p < 0.05, ⇤⇤⇤ p < 0.01
31
5Table 18: M&A and Shareholder Protection under Financial Distress - 26 Countries Sample Excluding Russia
(1) (2) (3 ) (4) (5) (6)Curr Infl Stock Dom Debt Ext Debt Bank
L.MA 0.13 0.13 0.22⇤⇤ 0.13 0.14 0.14(1.18) (1.22) (2.15) (1.31) (1.28) (1.30)
MAlag2 -0.05 -0.08 -0.06 -0.06 -0.05 -0.06(-0.95) (-1.06) (-0.84) (-0.80) (-0.79) (-0.92)
SHP_lag -1.00⇤⇤⇤a -.87⇤⇤a -.84⇤⇤a -.64⇤a -.86⇤⇤a -.92⇤⇤a
(-2.72) (-2.47) (-2.33) (-1.87) (-2.48) (-2.52)
lnGDP 3.75⇤⇤a 3.45⇤⇤a 3.37⇤⇤a 3.01⇤a 3.04a 3.80⇤⇤a
(2.41) (2.13) (2.45) (1.68) (1.52) (2.04)
Infl -.002⇤⇤⇤a -.001⇤⇤⇤a -.002⇤⇤⇤a -.002⇤⇤⇤a -.001⇤⇤⇤a -.001⇤⇤⇤a
(-7.74) (-4.66) (-6.16) (-4.32) (-6.65) (-6.33)
WDI_MCAP -8,365,117.0 -11,488,115.6⇤ -7,595,592.3 -10,895,127.5⇤ -11,319,568.9⇤ -11,673,574.3⇤
(-1.57) (-1.83) (-0.90) (-1.77) (-1.71) (-1.74)
WDI_Lend -.058⇤a -.007a -.025a -.016a -.029a -.285a
(-1.94) (-0.29) (-1.47) (-0.84) (-1.19) (-1.06)
cri_curr .56a
(0.79)
persistence1 .07a
(0.84)
interaction1 .16a
(1.57)
cri_infl -.69a
(-1.24)
persistence2 .41⇤⇤⇤a
(-3.51)
interaction2 .05a
(0.41)
cri_stock .63⇤a
(1.80)
persistence3 .05a
(0.49)
interaction3 .12⇤⇤a
(2.03)
cri_debt_dom -1.03a
(-0.99)
persistence4 .008a
(0.09)
interaction4 -.17⇤⇤a
(-2.19)
cri_debt_ext -.73a
(-1.47)
persistence5 -.08a
(-0.80)
interaction5 .06a
(0.66)
cri_bank -.13a
(-0.26)
persistence6 -.01a
(-0.12)
interaction6 .08a
(0.82)
Constant -34.45⇤⇤a -31.72⇤a -31.60⇤⇤a -27.90a -26.98a -35.43⇤a
(-2.04) (-1.79) (-2.08) (-1.44) (-1.22) (-1.69)Observations 224 224 204 224 224 224t statistics in parentheses a in billions of current US dollars.⇤ p < 0.10, ⇤⇤ p < 0.05, ⇤⇤⇤ p < 0.01
32
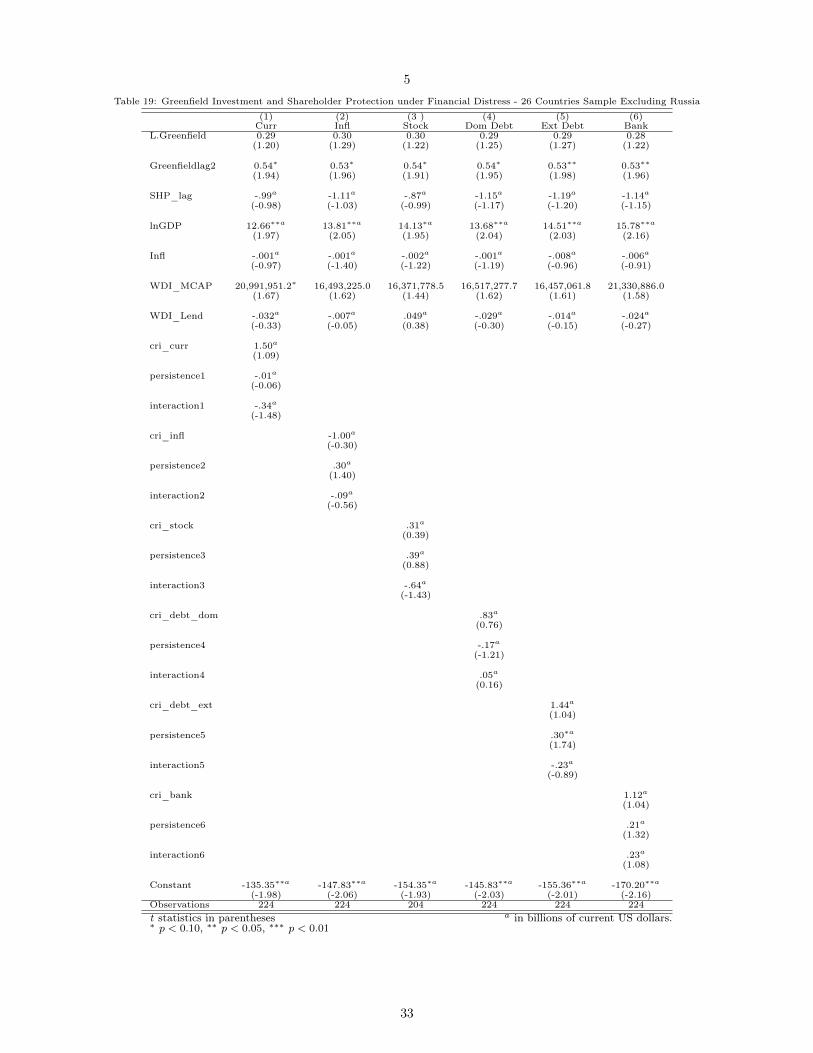
5Table 19: Greenfield Investment and Shareholder Protection under Financial Distress - 26 Countries Sample Excluding Russia
(1) (2) (3 ) (4) (5) (6)Curr Infl Stock Dom Debt Ext Debt Bank
L.Greenfield 0.29 0.30 0.30 0.29 0.29 0.28(1.20) (1.29) (1.22) (1.25) (1.27) (1.22)
Greenfieldlag2 0.54⇤ 0.53⇤ 0.54⇤ 0.54⇤ 0.53⇤⇤ 0.53⇤⇤
(1.94) (1.96) (1.91) (1.95) (1.98) (1.96)
SHP_lag -.99a -1.11a -.87a -1.15a -1.19a -1.14a
(-0.98) (-1.03) (-0.99) (-1.17) (-1.20) (-1.15)
lnGDP 12.66⇤⇤a 13.81⇤⇤a 14.13⇤a 13.68⇤⇤a 14.51⇤⇤a 15.78⇤⇤a
(1.97) (2.05) (1.95) (2.04) (2.03) (2.16)
Infl -.001a -.001a -.002a -.001a -.008a -.006a
(-0.97) (-1.40) (-1.22) (-1.19) (-0.96) (-0.91)
WDI_MCAP 20,991,951.2⇤ 16,493,225.0 16,371,778.5 16,517,277.7 16,457,061.8 21,330,886.0(1.67) (1.62) (1.44) (1.62) (1.61) (1.58)
WDI_Lend -.032a -.007a .049a -.029a -.014a -.024a
(-0.33) (-0.05) (0.38) (-0.30) (-0.15) (-0.27)
cri_curr 1.50a
(1.09)
persistence1 -.01a
(-0.06)
interaction1 -.34a
(-1.48)
cri_infl -1.00a
(-0.30)
persistence2 .30a
(1.40)
interaction2 -.09a
(-0.56)
cri_stock .31a
(0.39)
persistence3 .39a
(0.88)
interaction3 -.64a
(-1.43)
cri_debt_dom .83a
(0.76)
persistence4 -.17a
(-1.21)
interaction4 .05a
(0.16)
cri_debt_ext 1.44a
(1.04)
persistence5 .30⇤a
(1.74)
interaction5 -.23a
(-0.89)
cri_bank 1.12a
(1.04)
persistence6 .21a
(1.32)
interaction6 .23a
(1.08)
Constant -135.35⇤⇤a -147.83⇤⇤a -154.35⇤a -145.83⇤⇤a -155.36⇤⇤a -170.20⇤⇤a
(-1.98) (-2.06) (-1.93) (-2.03) (-2.01) (-2.16)Observations 224 224 204 224 224 224t statistics in parentheses a in billions of current US dollars.⇤ p < 0.10, ⇤⇤ p < 0.05, ⇤⇤⇤ p < 0.01
33
7 References
• Acharya, Ram C et al. Outward FDI from Canada and Its Policy Context. Transnational CorporationsReview. 2010.
• Albuquerque, Rui. The Composition of Intenational Capital Flows: Risk Sharing Through Foreign DirectInvestment. Journal of International Economics. Volme 61, Issue 2. 2003. p.353-383.
• Barro, Robert J. et al. Macroeconomic Crises since 1870. National Bureau of Economic research. WorkingPaper No. 13940. 2008.
• Davies, Ronald B. et al. Greenfield versus Merger and Acquisition FDI: Same Wine, Different Bottles? UCDCentre for Economic Research Working Paper Series. University College Dublin. School of Economics. 2015.
• DeMarzo, Peter. Corporate Finance: The Core. Pearson Higher Education. 4th edition. 2017.
• Farooque, Omar Al et al. Corporate Governance and Foreign Direct Investment Inflows: Cross-SectionalInternational Evidence. American Journal of Finance and Accounting. Volume 2, Issue 1. 2010.
• Gibson, Michael S. Is Corporate Governance Ineffective in Emerging Markets? Journal of Financial andQuantitative Analysis. Volume 38, Issue 1. 2003. p.231-250.
• Global Financial Stability Report. Stronger Emerging Market Corporate Governance Enhances FinancialResilience. International Monetary Fund. 2016.
• Guillén, Mauro F. et al. State Capacity, Minority Shareholder Protections, and Stock Market Development.Administrative Science Quarterly. 2016. p. 125-160.
• Haber, Stephen. Mexico’s experiments with bank privatization and liberalization 1991-2003. Journal of Bank-ing & Finance. Volume 29, Issues 8-9. 2005. p. 2325-2353.
• Krugman, Paul. Fire-Sale FDI. Capital Flows and the Emerging Economies; Theory, Evidence, and Contro-versies. 2000. p.43-58.
• La Porta, Rafael et al. Investor Protection: Origins, Consequences, and Reform. National Bureau of EconomicResearch. Working Paper No.7428. 1999.
• La Porta, Rafael et al. Related Lending. The Quarterly Journal of Economics. 2003. p. 231-268.
• Lskavyan, Vahe et al. Shareholder Protection, Ownership Concentration and FDI. Journal of Economics andBusiness. Volume 63, Issue 1. 2011. p. 69-85.
• Luo, Jin-Hui et al. Family-Concentrated Ownership in Chinese PLCs: Does Ownership Concentration AlwaysEnhance Corporate Value? International Journal of Financial Studies. Volume 2, Issue 1. p. 103-121.
• Morck, Randall K. The Global History of Corporate Governance: An Introduction. A History of Corpo-rate Governance around the World: Family Business Groups to Professional Managers. National Bureau ofEconomic Research. 2005.
• PIMCO. Inflation and its Impact on Investments. Investment Basics. 2012.
• Reinhart, Carmen et al. This Time is Different: Eight Centuries of Financial Folly. Princeton UniversityPress. Princeton and Oxford. 2009.
• Siems, Mathias et al. Shareholder Protection: A Leximetric Approach. Journal of Corporate Law Studies.Volume 7, Issue 1. 2007. p. 17-50.
• Stoddard et al. Fire-Sale FDI? The Impact of Financial Crises on Foreign Direct Investment. Review ofDevelopment Economices. Volume 19, Issue 2. 2015. p. 387-399.
• Unal, Haluk et al. Policy Paper: The Tehnical Process of Bank Privatization in Mexico. Journal of FinancialServices Research. Volume 16, Issue 1. p. 61-83.
• Wang, Miao et al. What Drives Economic Growth? The Case of Cross-Border M&A and Greenfield Activities.International Review of Social Sciences. Volume 62, Issue 2. 2009. p. 316-330.
34