Embed Size (px)
Citation preview

34
International Journal of Computing Academic Research (IJCAR) ISSN 2305-9184 Volume 4, Number 2 (April2015), pp. 34-45 © MEACSE Publications http://www.meacse.org/ijcar
Advisory System for Student Enrollment in University Based on Variety of Machine
Learning Algorithms
Mohamed M. Ezz Systems & Computers Engineering Department
Faculty of Engineering, Al-Azhar University, Nasr City, Cairo, Egypt
Abstract
The enrollment process of students in the Egyptian universities is mainly based on student final grades in
high school. The high school final grade doesn’t reflect promising student to admit in specific faculty
such as engineering and science, which requires specific student skills and knowledge. In this paper, we
present a predictive model for student to help him select the best suitable faculty based on his grades for
different subjects in high school. Moreover, the model takes into consideration the country state, in which
the student is located, and the gender of the student. The proposed model acts as an advisory and
recommendation system for the student, helping him make a mature decision. The model is applied on
selective case study, namely, the student enrollment process in faculty of Engineering, Al-Azhar
University in Egypt. The enrollment process in the aforementioned university only accepts students
graduated from Al-Azhar high schools, which employs different courses, beside the Islamic and Arabic
subjects. The experimental results showed that, the model will effectively help faculty management in
identifying the key success features in each student, and thus, can filter applicants based on intelligent
predictive criteria. The model was intensively tested, and promising results were obtained.
Keywords: Classification, Predictive model, Student enrollment, Advisory model; Data mining, Machine
learning
1. Introduction
Al-Azhar University is one of the first universities in the world and the oldest degree-granting university
in Egypt, which was founded in 970 as a center of Islamic learning. The university has started by studying
the Qur'an and Islamic law in detail, along with Arabic grammar, and rhetoric. It is considered today the
chief center of Arabic literature and Islamic learning in the world. In 1961 additional non-religious
subjects were added to its curriculum and scientific faculties such as medical, engineering, and science,
which were established to graduate students mixing scientific and Islamic educations. Al-Azhar
University accepts enrollment of students from Al-Azhar high schools which have three categories of
courses in its curriculum, namely, Islamic, Arabic, and scientific courses. The analysis and prediction of
student success in Al-Azhar University faculties are totally new. To our knowledge, we propose the first
data mining and classification on Al-Azhar University. The case study for the proposed model was
applied in the faculty of Engineering for students in the year2013/2014.
Table 1 presents an analysis of previous students’ data. The analysis showed that there is no relation
between the succeeded students in the faculty, and their final grades in the high school. The result entails
that there are other implicit factors that govern the successful and failure of students in the faculty.

International Journal of Computing Academic Research (IJCAR), Volume 4, Number 2, April 2015
35
Table 1: Faculty student's segmentation based on their high school final grades marks
High school
Overall
final grade
segments
No. of Successful
student in the
faculty
No. of unsuccessful
student in the
faculty
610 263 236
620 377 188
630 296 86
640 7 5
650 4 4
The proposed model in this paper utilizes different machine learning algorithms for classification and
prediction of student performance and successfulness. Several machine learning algorithms are applied
during the research work, and three of them were selected because –based on the obtained results- they
have high potential to yield good results. These algorithms are Alternative Decision Tree (ADTree)[1],
Support Vector Machines (SVM)[2], Fuzzy Unordered Rule Induction Algorithm (FURIA)
[4]algorithms to predict the successful students in their first year of the faculty. The WEKA tool kit was
used training, building and evaluating the model.
The rest of the paper is organized as follows: Section 2 summaries related work in predicting student
model using data mining and classification techniques in educational environments. Section 3 describes
the proposed enrollment advisory model and brief review of the components and methods of
classification. Section 4 gives a description of data set and features that were used in this research, and
describes the preprocessing step for data analysis. Section 5 presents the experimental results, and
section 6 concludes the proposed model.
1. Related Work Many studies have been proposed, which attempt to predict the student performance using machine
learning and data mining techniques. All these research area common goal for predicting student
performance, and each research has its discriminator on the data set, features, No. of classes, and
machine learning technique. In the following section, we will analyze these researches based on
discriminator featured mentioned earlier, in addition to the accuracy measure for each research. The
accuracy measure is either the overall model accuracy (correctly classified instances), or the true positive
rate of each class in the model.
Table 2: Related work summary
Research Objective of Research Machine
Learning
algorithm
Dataset &
Features used Type of
Classification Accuracy Measure (Overall accuracy or
individual class
accuracy)
[5] Create student model for
measure
the student's performance
in a specific courses (
C++ language )
ID3, ,C4.5,
and Naive
Bayes used
and
compared
Undergraduate
students took
the C++
courses. 12
attributes
collected using a
questionnaire
Four classes as
Course grade : A,
B, C, D
ID3 (38% Overall
accuracy)
C4.5 (35%Overall
accuracy(
Naive Bayes
(33%Overall accuracy)
[6] Knowing the reasons of
failure of student in
Engineering faculty to
help to take necessary
J48 decision
tree
algorithms
346 engineering
student.
16 attributes
selected from
Two classes :
Promoted, and
Failed
69.94 %Overall
accuracy

International Journal of Computing Academic Research (IJCAR), Volume 4, Number 2, April 2015
36
actions to improve the
success percentage
high school
final results and
some subject
results
[7] Predict the final grades of
students based on
behavioral (psychometric
factors) of students
Smooth
Support
Vector
Machine
(SSVM)
algorithm
1000 students
from faculty of
computer
system and
software. 5
attributes from
behavioral
variables used
are Interest, Study Behavior,
Engage Time,
Believe, and
Family Support.
Five classes for
final grade:
- Excellent,
- Very Good,
- Good,
- Average,
- Poor
Excellent (92%
TP rate),
Very Good(75%
TP rate),
Good(61% TP
rate),
Average(69% TP
rate),
Poor(93% TP rate)
[8] Predict the suitable track
for the students in high
school based on previous
result in basic school
J48 decision
tree
algorithm
248 students
from basic
schools. Three
attributes used;
the average
grade of the last
year class (N),
the average
grade of classes (N, N-1,N-2),
the minimum
grade
acceptable for
each track.
Four classes:
Science,
Management,
Academic,
Profession,
Science(54% TP
rate),
Management(90%
TP rate),
Academic(100%
TP rate),
Profession(98%
TP rate)
[9] Predict the final grades of
students based on socio-
demographic, high school
final result, and study
attitudes of students
C4.5,
Multilayer
Perceptron ,
Naive
Bayes
270 students
from Faculty of
Economics.
11 attributes
selected from
students' socio-
demographic,
high school
final result, and study attitudes
Two classes :
Pass,
Fail
C4.5 (73.93
Overall accuracy),
Multilayer
Perceptron
(71.20% Overall
accuracy),
Naive
Bayes(76.65% Overall accuracy)
[10] Predict the performance of students in engineering
faculties to identifying the
students that are most
likely to fail to improve
their performance
C4.5, ID3 and CART
decision
tree
algorithms
90 students from faculty of
engineering. 16
attributes from
student
demographic
data, plus
student grade in
high school and
senior
secondary
schoo;d
Three classes: Pass,
Fail, promoted
ID3 (62% Overall accuracy),
C4.5(67% Overall
accuracy),
CART (62%
Overall accuracy)
[11] Studying the data mining
techniques for predicting student performance
J48,
Naïve Bayes,
Bayes Net,
OneR,
JRip
10330 students
from 9 faculties, 13
attributes from
student personal
data such as
gender and age
Bad
Average Good
Very Good
Excellent
J48(66% Overall
accuracy),
Naïve Bayes(59%
Overall accuracy),
Bayes Net(59%
Overall accuracy),
One R(54%
International Journal of Computing Academic Research (IJCAR), Volume 4, Number 2, April 2015
37
and grade of
high school in
addition to
some
characteristics
of high school.
Overall accuracy),
JRip(63% Overall
accuracy)
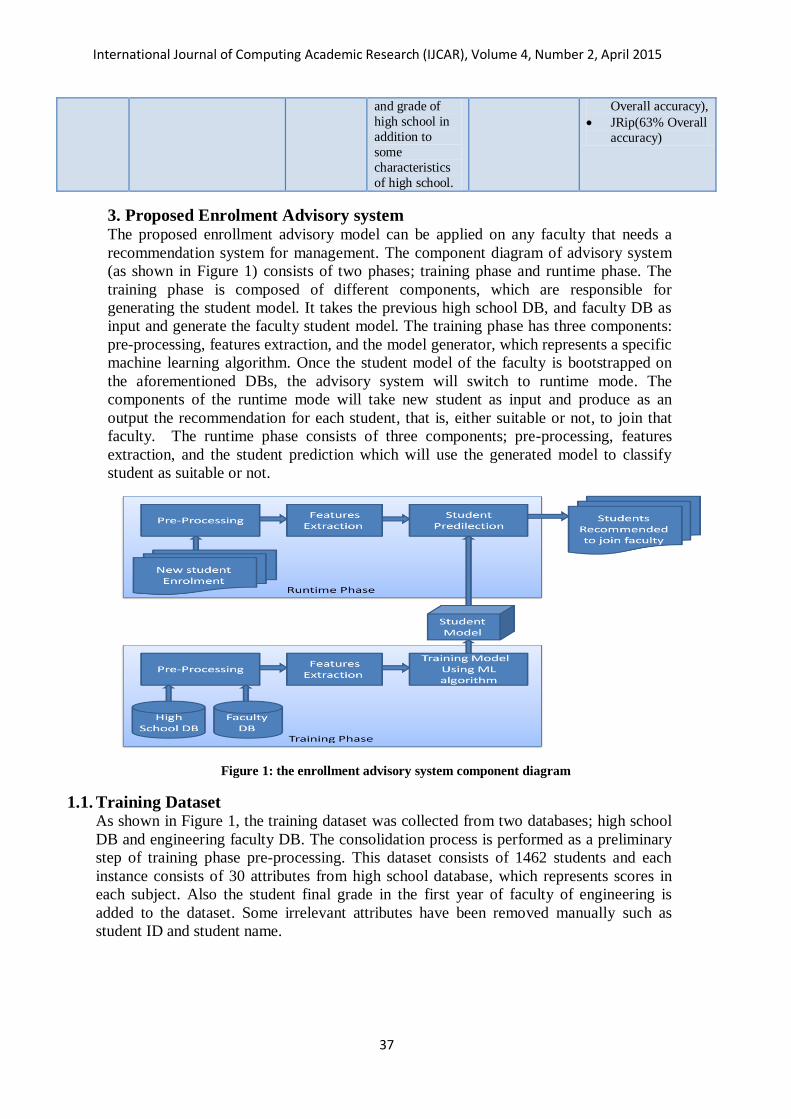
3. Proposed Enrolment Advisory system The proposed enrollment advisory model can be applied on any faculty that needs a
recommendation system for management. The component diagram of advisory system
(as shown in Figure 1) consists of two phases; training phase and runtime phase. The
training phase is composed of different components, which are responsible for
generating the student model. It takes the previous high school DB, and faculty DB as
input and generate the faculty student model. The training phase has three components:
pre-processing, features extraction, and the model generator, which represents a specific
machine learning algorithm. Once the student model of the faculty is bootstrapped on
the aforementioned DBs, the advisory system will switch to runtime mode. The
components of the runtime mode will take new student as input and produce as an
output the recommendation for each student, that is, either suitable or not, to join that
faculty. The runtime phase consists of three components; pre-processing, features
extraction, and the student prediction which will use the generated model to classify
student as suitable or not.
Figure 1: the enrollment advisory system component diagram
1.1. Training Dataset As shown in Figure 1, the training dataset was collected from two databases; high school
DB and engineering faculty DB. The consolidation process is performed as a preliminary
step of training phase pre-processing. This dataset consists of 1462 students and each
instance consists of 30 attributes from high school database, which represents scores in
each subject. Also the student final grade in the first year of faculty of engineering is
added to the dataset. Some irrelevant attributes have been removed manually such as
student ID and student name.
International Journal of Computing Academic Research (IJCAR), Volume 4, Number 2, April 2015
38
Table 3: Training dataset, which consists of 1462 students from engineering faculty, Al-Azhar
University, year 2013/2014
Classes Boys Girls Total
Excellent 11 48 59
Very Good 159 241 400
Good 259 132 391
Pass 72 25 97
Pass with one Subject 65 36 101
Pass with two subjects 170 57 227
Failed 142 45 187
Grand total 878 584 1462
Table 4: Dataset attributes categorization
Category of
attributes
Attributes Attributes type
Personal data gender, state code Nominal attributes (28 state codes and
2 gender codes)
Islamic Subjects Jurisprudence, Quran Explanation,
Hadith, total of Hadith & Explanation,
Theology, Quran oral, Quran written,
total Quran, Hadith Oral, total Islamic
Numeric attributes
Arabic Subjects Arabic grammar, Arabic Exchange, total
grammar & Exchange, Rhetoric,
Literature, Total Rhetoric & Literature,
Arabic Total
Numeric attributes
Science Subjects English Language, advanced subjects,
Algebra, Calculus, Mechanics, Total
Mathematics,
Physics, Chemistry, Biology,Total
Scientific
Numeric attributes
Total marks High school Final Result, Numeric attributes
Total marks 1stEngineering Faculty Final Grade Nominal attributes ( excellent, very good, good, pass, pass with one
subject, pass with two subjects, and
failed )
1.2. Pre-processing The pre-processing step of training phase consolidates the high school DB and
engineering faculty DB using student name to join records from both databases. Next,
irrelevant attributes is removed such as student name, student ID which don’t affect the
classification process. Also part of pre-processing is converting the data into two
classes (suitable for faculty or not) instead of 7 classes (grades) as shown in table 5,
and the summary of students dataset after mapping , which is shown in table 6.

International Journal of Computing Academic Research (IJCAR), Volume 4, Number 2, April 2015
39
Table 5: Mapping of 1st Engineering Faculty Final Grade to classes
Grade Mapped to
Excellent Suitable for Engineering Faculty (Suitable to join )
Very Good Suitable for Engineering Faculty (Suitable to join )
Good Suitable for Engineering Faculty (Suitable to join )
Pass Suitable for Engineering Faculty (Suitable to join )
Pass with one Subject Not Suitable for Engineering Faculty (Not Suitable to join )
Pass with two subjects Not Suitable for Engineering Faculty (Not Suitable to join )
Failed Not Suitable for Engineering Faculty (Not Suitable to join )
Table 6: Dataset summary after Mapping 7 Grade to 2 classes
Classes Boys Girls Total
Suitable to join 501 446 947
Not Suitable to join 377 138 515
Total 878 584 1462
1.3. Features Extraction The features extraction component filters the most relevant (effective) attributes for
learning phase, by measuring the rank of each attribute. After filtration, only11
relevant attributes (as shown in table 7) have been selected. The ranking algorithms
measure the most affective attributes (courses scores attributes only)which affect the
1styear Engineering Faculty Final Grade as follows:
- Sort the dataset using the 1st year Engineering Faculty Final Grade
- For each attributes (course score), perform the following:
o Selected first 25% of data and calculate the average of the attribute
(F)
o Selected last 25% of data and calculate the average of the attribute
(L)
o Calculate the effective (Ranking)factor measure as Abs(F-
L)/Maximum of subject mark
International Journal of Computing Academic Research (IJCAR), Volume 4, Number 2, April 2015
40
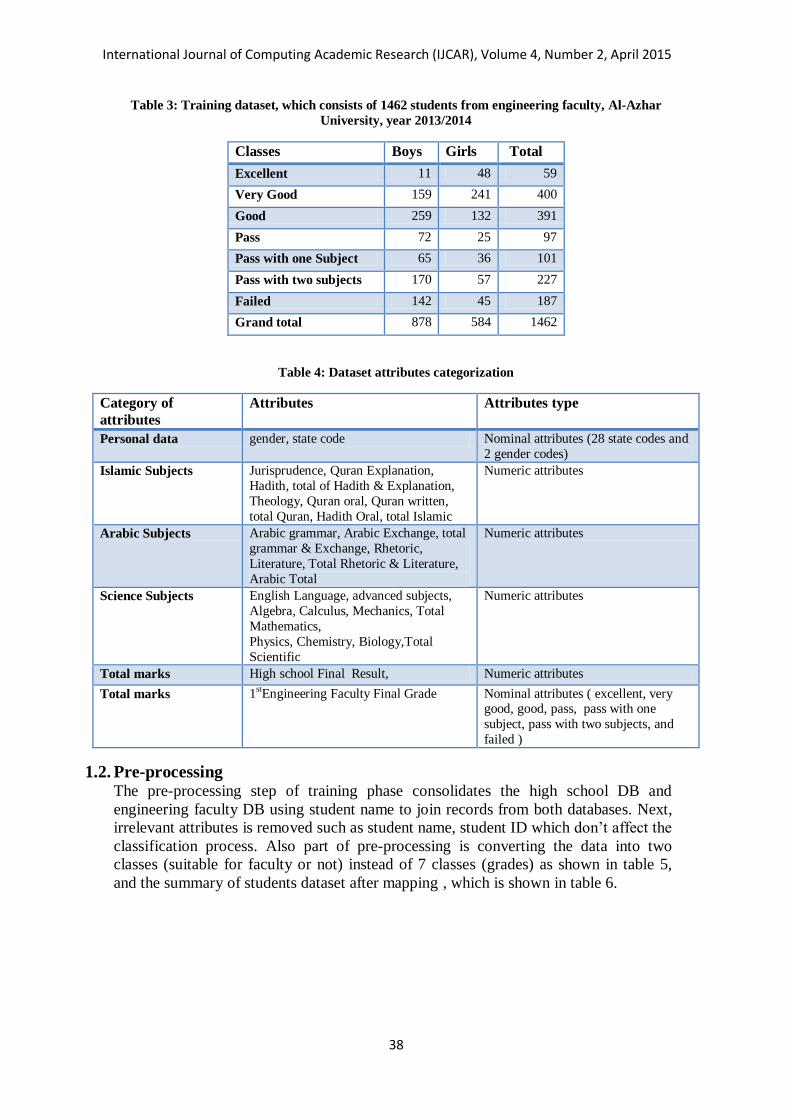
Figure 2: Selected attributes
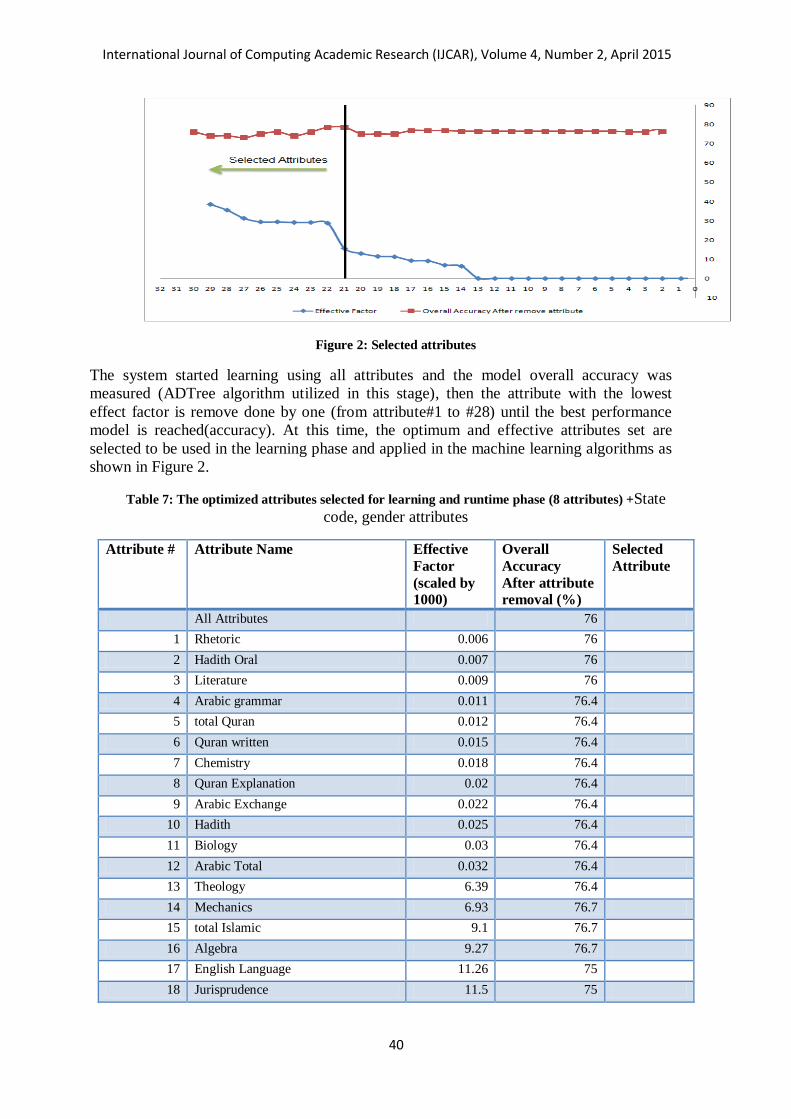
The system started learning using all attributes and the model overall accuracy was
measured (ADTree algorithm utilized in this stage), then the attribute with the lowest
effect factor is remove done by one (from attribute#1 to #28) until the best performance
model is reached(accuracy). At this time, the optimum and effective attributes set are
selected to be used in the learning phase and applied in the machine learning algorithms as
shown in Figure 2.
Table 7: The optimized attributes selected for learning and runtime phase (8 attributes) +State
code, gender attributes
Selected
Attribute
Overall
Accuracy
After attribute
removal (%)
Effective
Factor
(scaled by
1000)
Attribute Name Attribute #
76 All Attributes
76 0.006 Rhetoric 1
76 0.007 Hadith Oral 2
76 0.009 Literature 3
76.4 0.011 Arabic grammar 4
76.4 0.012 total Quran 5
76.4 0.015 Quran written 6
76.4 0.018 Chemistry 7
76.4 0.02 Quran Explanation 8
76.4 0.022 Arabic Exchange 9
76.4 0.025 Hadith 10
76.4 0.03 Biology 11
76.4 0.032 Arabic Total 12
76.4 6.39 Theology 13
76.7 6.93 Mechanics 14
76.7 9.1 total Islamic 15
76.7 9.27 Algebra 16
75 11.26 English Language 17
75 11.5 Jurisprudence 18

International Journal of Computing Academic Research (IJCAR), Volume 4, Number 2, April 2015
41
75 12.97 Quran oral 19
78.4 15.66 Calculus 20
Yes 78.4 28.74 Total Scientific 21
Yes 76 29.09 Total Rhetoric & Literature 22
Yes 74 29.09 Total Mathematics 23
Yes 76 29.38 total grammar & Exchange 24
Yes 75 29.38 total of Hadith & Explanation 25
Yes 73 31.24 Physics 26
Yes 74 35.51 advanced subjects 27
Yes 74 38.49 High school Final Result 28
1.4. Training Model using machine leaning algorithms Machine learning algorithms[12] operate by building a system model from training examples
and using the generated model to make predictions or decisions. The important component of
the advisory system is the training component that employs different machine learning
algorithm after student dataset consolidation and optimization. After that, the student model
is built, which will act as anadvisory system that outputs one of two classes (suitable/not
suitable). In this paper, three types of machine learning algorithms were employed, that
outputs the best performance among other techniques.
1.4.1. ADTree algorithm Decision trees are powerful and popular tools for classification. A decision tree is a tree-like
structure, which starts from root attributes, and ends with leaf nodes. Generally, a decision
tree has several branches consisting of different attributes, the leaf node on each branch
representing a class or a kind of class distribution. Decision tree algorithms describe the
relationship among attributes, and the relative importance of attributes. The first algorithm
used in this research is the Alternative decision tree (ADTree) algorithm [1]which use decision
trees with multiple linear regression models at the leaf nodes, and additive regression using
forward stage-wise modeling is applied to grow the tree. The advantages of decision trees
are that they represent rules which could easily be understood and interpreted by users. The
WEKA ADTree classification is applied on the dataset during the experimental study. The
result tree from the ADTree algorithms as shown in figure 3, the negative leaf means "Not
Suitable to join", while the positive leaf means "Suitable to join". The generated tree size is
31 (total number of nodes) and Leaves are 21 (number of predictor nodes)

International Journal of Computing Academic Research (IJCAR), Volume 4, Number 2, April 2015
42
Figure 1: The generated ADTree model
2.4.2 SVM algorithm The second algorithm used in this research is the Support Vector Machines(SVM) algorithm
[3]which builds a model that assigns new examples into one class or the other, making it a non-
probabilistic binary linear classifier. The model is a representation of the examples as points in space, mapped so that the examples of the separate classes are divided by a clear gap that is as
wide as possible. New examples are then mapped into that same space and predicted to belong to a
class based on which side of the gap they fall on. The SVM polynomial kernel version of SVM used which is a kernel function commonly used with support vector machines and other kernelized
models, that represents the similarity of training samples in a feature space over polynomials of
the original variables, allowing learning of non-linear models. The polynomial kernel looks not
only at the given features of input samples to determine their similarity, but also combinations of these. In the context of regression analysis, such combinations are known as interaction features.
The feature space of a polynomial kernel is equivalent to that of polynomial regression, but
without the combinatorial blowup in the number of parameters to be learned. The WEKA LibSVM classification is applied on the dataset during the experimental study.
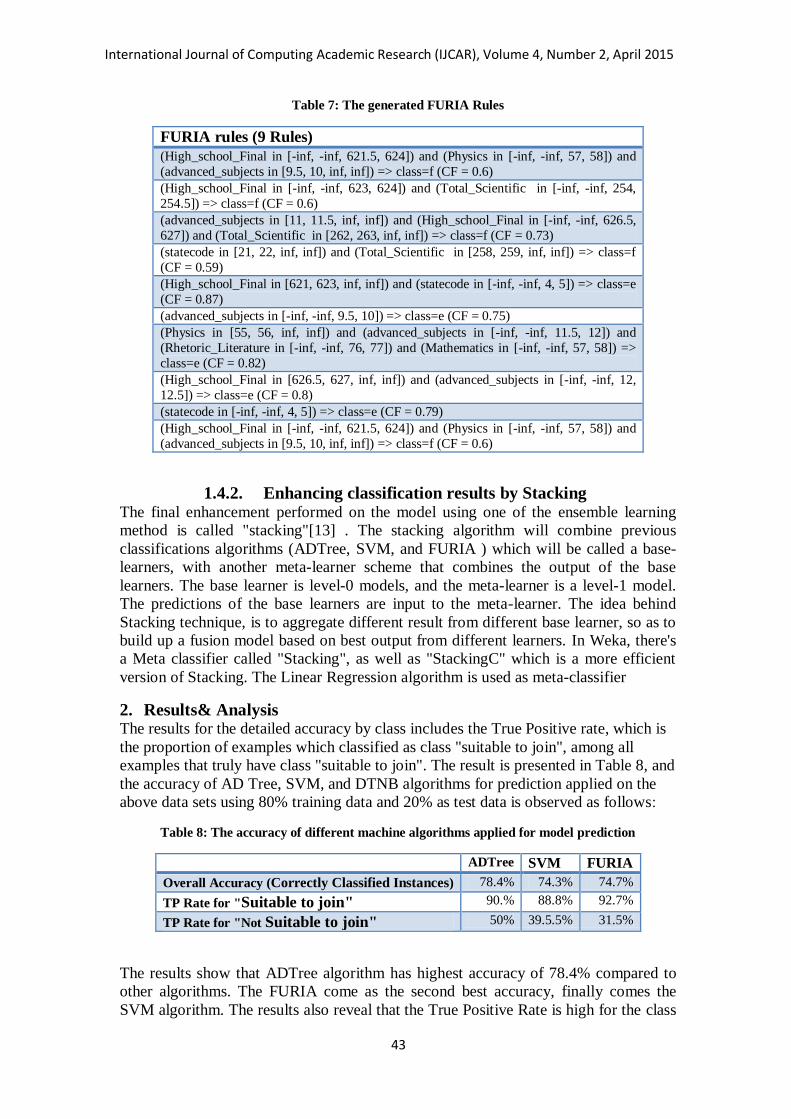
FURIA algorithm The third second algorithm used in this research is rule based algorithm which is named the Fuzzy
Unordered Rule Induction Algorithm (FURIA) algorithm [4].The algorithm extends the well-
known RIPPER algorithm (kind of rule learner), while preserving its advantages, such as simple
and comprehensible rule sets. In addition, it includes a number of modifications and extensions. The FURIA learns fuzzy rules instead of conventional rules and unordered rule sets instead of rule
lists. Moreover, to deal with uncovered examples, it makes use of an efficient rule stretching
method. The advantages of rule based are that they represent rules which could easily be
understood and interpreted by users. The WEKA FURIA classification is applied on the dataset
during the experimental study. The resultant rules from the FURIA algorithms as shown in Table
8, the "f" leaf class mean " Not Suitable to join" while "e" class mean "Suitable to join".
International Journal of Computing Academic Research (IJCAR), Volume 4, Number 2, April 2015
43
Table 7: The generated FURIA Rules
FURIA rules (9 Rules)
(High_school_Final in [-inf, -inf, 621.5, 624]) and (Physics in [-inf, -inf, 57, 58]) and
(advanced_subjects in [9.5, 10, inf, inf]) => class=f (CF = 0.6)
(High_school_Final in [-inf, -inf, 623, 624]) and (Total_Scientific in [-inf, -inf, 254,
254.5]) => class=f (CF = 0.6)
(advanced_subjects in [11, 11.5, inf, inf]) and (High_school_Final in [-inf, -inf, 626.5,
627]) and (Total_Scientific in [262, 263, inf, inf]) => class=f (CF = 0.73)
(statecode in [21, 22, inf, inf]) and (Total_Scientific in [258, 259, inf, inf]) => class=f
(CF = 0.59)
(High_school_Final in [621, 623, inf, inf]) and (statecode in [-inf, -inf, 4, 5]) => class=e
(CF = 0.87)
(advanced_subjects in [-inf, -inf, 9.5, 10]) => class=e (CF = 0.75)
(Physics in [55, 56, inf, inf]) and (advanced_subjects in [-inf, -inf, 11.5, 12]) and
(Rhetoric_Literature in [-inf, -inf, 76, 77]) and (Mathematics in [-inf, -inf, 57, 58]) =>
class=e (CF = 0.82)
(High_school_Final in [626.5, 627, inf, inf]) and (advanced_subjects in [-inf, -inf, 12,
12.5]) => class=e (CF = 0.8)
(statecode in [-inf, -inf, 4, 5]) => class=e (CF = 0.79)
(High_school_Final in [-inf, -inf, 621.5, 624]) and (Physics in [-inf, -inf, 57, 58]) and
(advanced_subjects in [9.5, 10, inf, inf]) => class=f (CF = 0.6)
1.4.2. Enhancing classification results by Stacking The final enhancement performed on the model using one of the ensemble learning
method is called "stacking"[13] . The stacking algorithm will combine previous
classifications algorithms (ADTree, SVM, and FURIA ) which will be called a base-
learners, with another meta-learner scheme that combines the output of the base
learners. The base learner is level-0 models, and the meta-learner is a level-1 model.
The predictions of the base learners are input to the meta-learner. The idea behind
Stacking technique, is to aggregate different result from different base learner, so as to
build up a fusion model based on best output from different learners. In Weka, there's
a Meta classifier called "Stacking", as well as "StackingC" which is a more efficient
version of Stacking. The Linear Regression algorithm is used as meta-classifier
2. Results& Analysis The results for the detailed accuracy by class includes the True Positive rate, which is
the proportion of examples which classified as class "suitable to join", among all
examples that truly have class "suitable to join". The result is presented in Table 8, and
the accuracy of AD Tree, SVM, and DTNB algorithms for prediction applied on the
above data sets using 80% training data and 20% as test data is observed as follows:
Table 8: The accuracy of different machine algorithms applied for model prediction
ADTree SVM FURIA
Overall Accuracy (Correctly Classified Instances) 78.4% 74.3% 74.7%
TP Rate for "Suitable to join" 90.% 88.8% 92.7%
TP Rate for "Not Suitable to join" 50% 39.5.5% 31.5%
The results show that ADTree algorithm has highest accuracy of 78.4% compared to
other algorithms. The FURIA come as the second best accuracy, finally comes the
SVM algorithm. The results also reveal that the True Positive Rate is high for the class

International Journal of Computing Academic Research (IJCAR), Volume 4, Number 2, April 2015
44
“Suitable to join" (88-92 %), while it is very low for the " Not Suitable to join" class
Average (32-50 %). The achieved results are slightly better for the percentage split
testing option. From the above results, it was concluded that AD Tree outperforms
other algorithms. To better enhance the obtained result, the three algorithms were
stacked by the Stacking technique [13] and achieved 80.1% overall accuracy
Conclusions In this paper, an advisory model has been proposed for predicting and recommending
the best suitable faculty for student, based on different learning criteria, namely,
student grades, country, and gender. The proposed model is applied on selective case
study, that is, the enrollment process for faculty of Engineering, Al-Azhar University.
Four machine learning algorithms were employed and compared, and it was concluded
–based on the obtained result- that AD tree algorithm outperforms other algorithms,
and is considered as the best algorithm to employ in the proposed model. The overall
accuracy of the model approaches 80%, which would later be enhanced by utilizing
other learning techniques. The model faculty management staff to predict and identify
weak students and can take appropriate decision to prevent them from failure.
References
[1] Y. Freund and L. Mason, “The Alternating Decision Tree Learning Algorithm,”
in the 16th International Conference on Machine Learning, 1999, pp. 124–133.
[2] Y. Goldberg and M. Elhadad, “splitSVM: fast, space-efficient, non-heuristic,
polynomial kernel computation for NLP applications,” HLT ’08 Proc. 46th
Annu. Meet. Assoc. Comput. Linguist. Hum. Lang. Technol., no. June, pp. 237–
240, 2008.
[3] C. Chang and C. Lin, “LIBSVM : A Library for Support Vector
Machines,”ACM Trans. Intell. Syst. Technol., vol. 2, pp. 1–39, 2011.
[4] J. Hühn and E. Hüllermeier, “FURIA: An algorithm for unordered fuzzy rule
induction,” Data Min. Knowl. Discov., vol. 19, pp. 293–319, 2009.
[5] Q. a Al-Radaideh, E. M. Al-Shawakfa, and M. I. Al-Najjar, “Mining student
data using decision trees,” in International Arab Conference on Information
Technology (ACIT’2006)., 2006.
[6] R. Kabra and R. Bichkar, “Performance Prediction of Engineering Students
using Decision Trees.,” Int. J. Comput. Appl., vol. 36, no. 11, pp. 8–12, 2011.
[7] S. Sembiring, M. Zarlis, D. Hartama, S. Ramliana, and E. Wani, “Prediction of
Student Academic Performance By an Application of Data Mining
Techniques.,” Int. Conf. Manag. Artif. Intell., vol. 6, pp. 110–114, 2011.
[8] Q. a Al-radaideh, A. Al Ananbeh, and E. M. Al-shawakfa, “a Classification
Model for Predicting the Suitable Study Track for School Students,” Ijrras, vol.
8, no. August, pp. 247–252, 2011.
[9] E. Review, “Data mining approach for predicting student performance,” J.
Econ. Bus., vol. X, no. 1, pp. 3–12, 2012.
[10] S. K. Yadav and S. Pal, “Data Mining : A Prediction for Performance
Improvement of Engineering Students using Classification,”Wcsit, vol. 2, no. 2,
pp. 51–56, 2012.
[11] D. Kabakchieva, “Predicting student performance by using data mining
methods for classification,” Cybern. Inf. Technol., vol. 13, no. 1, pp. 61–72,
2013.
[12] R. Kovahi; and F. Provost, “Glossary of Terms,” Mach. Learn., vol. 30, no. 2–3,
pp. 271–274, Feb. 1998.

International Journal of Computing Academic Research (IJCAR), Volume 4, Number 2, April 2015
45
[13] A. K. Seewald, “How to Make Stacking Better and Faster While Also Taking
Care of an Unknown Weakness,” pp. 554–561, Jul. 2002.