Embed Size (px)
Citation preview
lable at ScienceDirect
Atmospheric Environment 80 (2013) 281e289
Contents lists avai
Atmospheric Environment
journal homepage: www.elsevier .com/locate/atmosenv
Aeolian dust deposition rates in Northern French forests and inputs totheir biogeochemical cycles
Émeline Lequy a,b, Arnaud Legout a, Sébastien Conil b, Marie-Pierre Turpault a,*a INRA, Biogéochimie des Ecosystèmes Forestiers, F-54280 Champenoux, FrancebANDRA, Centre Meuse Haute Marne, F-55290 Bure, France
h i g h l i g h t s
� Atmospheric particulate deposition (APD) is poorly known in French forests.� APD could be a source of nutrients for forests growing on acidic soils.� Mineralogical and elemental compositions were established in APD.� The sequence of nutrient inputs is: dissolved deposition > rock decay > APD.
a r t i c l e i n f o
Article history:Received 24 January 2013Received in revised form26 July 2013Accepted 31 July 2013
Keywords:Atmospheric depositionAeolian dust mineralogyElemental compositionNutrient budgets
* Corresponding author. Tel.: þ33 383394075.E-mail addresses: [email protected] (É.
(A. Legout), [email protected] (S. Co(M.-P. Turpault).
1352-2310/$ e see front matter � 2013 Elsevier Ltd.http://dx.doi.org/10.1016/j.atmosenv.2013.07.075
a b s t r a c t
This study describes the Aeolian dust deposition (ADD) in 4 sites of Northern France. Between December2009 andMarch 2012, we sampled (i) Aeolian dust every four weeks, and (ii) 6 episodes of forecasted highatmospheric dust load mainly from the Saharan desert, the largest source of Aeolian dust in the world.These samples were treated with oxygen peroxide to remove organic matter so as to only compare themineral fraction of the samples in the 4 sampling sites and to analyze their mineralogy. The solid samplescontained the hardly soluble part of Aeolian dust (H-ADD). Its depositionwas of 1.9� 0.3 gm�2 year�1witha seasonal pattern of high deposition from spring to early autumn and a low deposition in winter. H-ADDdeposition during the forecasted episodes of high atmospheric load did not systematically exceed thedeposition rate during the rest of the sampling period. This indicates that such episodes little contributed tothe annual H-ADD rate. The mineralogy revealed a heterogeneous set of minerals dominated by silicateswith a common basis of major types (quartz, feldspars, mica, chlorite, kaolinite and interlayered clayminerals in every sample) with randomly trace minerals (Fe-oxides, sulfates, amphibole, talc, gibbsite andcarbonates). The chemistry of H-ADD led to a dominant input of Si (up to 4.4 kg ha�1 year�1), while thenutrients inputs of Ca, K, Mg and P from ADD and the atmospheric organics (APD) in openfield weretogether of 1.5 � 0.5 kg ha�1 year�1 with a high contribution of soluble minerals and organic matter of ca.40% for Mg and K, and of ca. 80% for Ca and P. Nutrient inputs from APD are especially an interesting sourceof P for forests developed on acidic soils.
� 2013 Elsevier Ltd. All rights reserved.
1. Introduction
Atmospheric particulate deposition (APD) influences the func-tioning and the nutrient cycling of aqueous ecosystems such asoceans (Jickells et al., 2005; Mahowald et al., 2005) and of terres-trial ecosystems such as forests (Avila et al., 1998). However, the
Lequy), [email protected]), [email protected]
All rights reserved.
role of APD on forest nutrition remains poorly understood (Lequyet al., 2012). APD remains insufficiently analyzed and lacks forlong-term continuous samplings and measurements (Lawrenceand Neff, 2009; Shao et al., 2011). The mineral fraction of APD isoften referred to as Aeolian Dust Deposition (ADD). In Europe,Aeolian dust comes from large dust sources such as the SaharaDesert, from volcanic eruptions and from the regional erosion ofsoils. Because of its proximity to the Sahara Desert, several studieswere carried out in Southern Europe to evaluate the regionalimpact of ADD on the environment (Loye-Pilot et al., 1986; Herutand Krom, 1996; Mattsson and Nihlen, 1996; Avila et al., 1997;Guerzoni et al., 1997; Avila et al., 1998; Avila and Penuelas, 1999;
É. Lequy et al. / Atmospheric Environment 80 (2013) 281e289282
Guieu et al., 2002). In these areas, Saharan dust outbreaks largelyinfluence annual ADD rates, as they varied from 4.0 to26.2 g m�2 year�1, depending on the occurrence of such Saharanoutbreaks (Loye-Pilot andMartin, 1996). Several studies and reviewpapers have highlighted the role of ADD and atmospheric long-range transport in the inputs of nutrients to global biogeochem-ical cycles and biosphere functioning (Jickells et al., 2005, p. 20;Mahowald et al., 2005; Lawrence and Neff, 2009). However, little isknown in the North of Europe (here defined as Europe above 46�N)with the exception of huge and rare Saharan episodes reachingScandinavia (Franzen et al., 1994; Ansmann et al., 2003).
To determine the element inputs of ADD to forest ecosystems farfrom large sources, a two-year sampling was conducted in fourbeech stands in the North of France. The deposition rates of Aeoliandust were measured on a monthly basis, and six forecasted epi-sodes of high atmospheric load were also sampled. The mineral-ogical and chemical compositions of the samples were determinedand the total element inputs of ADD to the forest ecosystems werecalculated.
2. Material and methods
2.1. Sites description
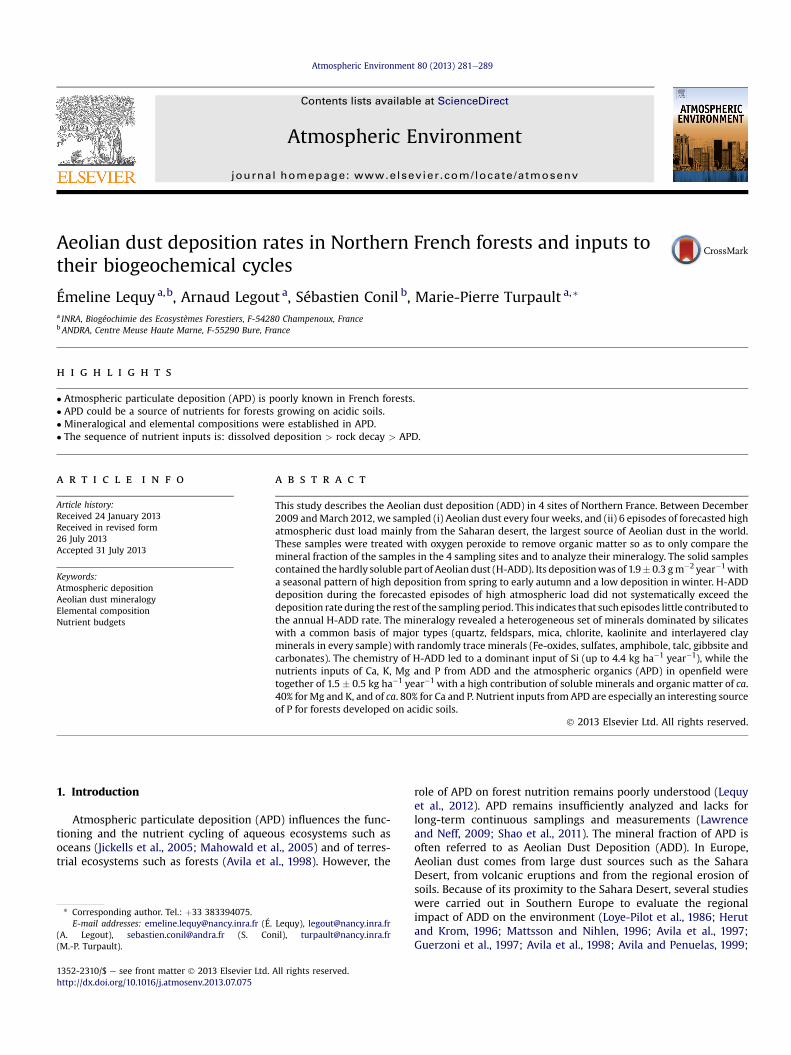
Four beech (Fagus sylvatica L.) stands were equipped to sampleADD (Fig. 1 and Table 1). The four sampling sites, located in thecountryside inside forests, are sheltered from local urban andanthropogenic pollution, except the site of Hesse (H), which is 5 kmwest of a cement factory. Breuil-Chenue (B), Montiers-sur-Saulx(M) and H are inland sites located in the Northeastern France,while Fougères (F) is located on the Atlantic coast. The forests of theB and F sites are developed on acidic soils (pHwater ¼ 4.3 and 3.8 forthe 0e5 cm topsoil, respectively) with a base saturation under 20%,while the soils of the H and M sites are slightly acidic (pHwater ¼ 5.0and 5.1 for the 0e5 cm topsoil, respectively) with a base saturationabove 60%. These sites were chosen because they belong to theFrench network SOERE F-ORE-T (long-term observation andexperiment system for the environmental research which studiesthe functioning of forest ecosystems), so they have been equipped
Fig. 1. Localization and characteristics of the four study sites. The broken lines markthe northwestern and northeastern quarters of France.
to study biogeochemical cycles since at least the 2000’s for B, H andF. The M site also belongs to the SOERE OPE (long-term environ-mental monitoring system) managed by Andra (the French Na-tional Radioactive Waste Management Agency).
2.2. Sampling and sample preparation
2.2.1. Continuous sampling during two yearsThe APD sampling started in December 2009 and ended in
March 2012, except in the F site, where it ended in December 2011.The collectors were placed within the forests, at 12 km of the edgeof the forest for B and at about 1 km for F, H and M. APD wascontinuously collected and sampled every four weeks, on a 30 mhigh tower in the H and F sites and in a clearing covered by lowherbaceous vegetation in the B and M sites (Table 1) to minimizethe remobilization of soil particles just around the collectors. Col-lectors in B and M were at 1.5 m above ground level. The F and Hsites had one collector during all the sampling. The sites B and Mhad one collector in December 2009 and January 2010, then 4collectors from February 2010 to March 2012.
Data are also available fromMay to December 2009 in the H andM sites and are used only as supporting data, as it corresponded tothe development phase of the sampling.
2.2.2. Episodic sampling during one yearDuring the sampling period December 2009eMarch 2011, high
atmospheric dust load episodes were monitored. This monitoringwas based on the 24 h to 72 h forecasts provided by the modelCHIMERE-Dust (Menut et al., 2009), and the model Dust RegionalAtmospheric Modeling DREAM (Nickovic et al., 2001), both avail-able online. When an episode with an atmospheric load over0.05 g m�2 day�1 was forecasted, an extra sampling of the episodewas organized at the M and B sites. A dedicated collector was usedin M and B during the ADD episode to analyze it individually andquantify its contribution to the current monthly ADD. Six Saharanoutbreaks occurred during the sampling period and were sampledat M (only three at B due to logistical matters) between January2010 and March 2011. Besides, atmospheric deposition during theeruption of the Eyjafjallajokull volcano was sampled in both sites inApril 2010. This eruption lasted from 14 to 20 April 2010, while ashwas covering large areas of northern Europe (Table 2).
2.2.3. Sample collection and preparationAPD was sampled by passive collectors. Openfield bulk deposi-
tion samplers consisted in 0.22 m2 polyethylene funnels directlyconnected to 20 L high-density polyethylene collecting containers,with a nylon sieve to protect samples from coarse pollution such asleaves, twigs and insects. A dark protection limited the influence oflight in the collection bottles and notably prevented algal devel-opment. Collectors dedicated to the sample of episodes of highatmospheric load consisted in assembling four funnels of 0.22 m2
connected to a 20 L collecting container.According to the model of Lequy (2012), APD is made of the
mineral fraction ADD and of particulate organic matter (POM).POM makes proper mineralogical analyses impossible, but mayalso contain elements that enter the biogeochemical cycles. Toget the ADD fraction, we solubilized POM with H2O2 on heatingplates (35 �C). This also solubilized the rapidly soluble fraction ofADD, S-ADD, while the hardly soluble ADD (H-ADD) was leftintact. Thus
APD ¼ H� ADDþ S� ADDþ POM: (1)
In field, the supernatant of rainwater was sampled and siphonedand the collection surfaces thoroughly cleaned with deionized
Table 1Characterization of the four study sites and of the sampling material in the field.
Site Localization Collectors
Latitude(North)
Longitude(East)
Altitude (m) Number Set up Period of sampling
Breuil-Chenue (B) 47�180 04�040 650 4 Clearing December 2009eMarch 2012Montiers-sur-Saulx (M) 48�320 05�180 380 4 ClearingHesse (H) 48�400 07�050 300 1 TowerFougères (F) 48�230 01�090 180 1 Tower December 2009e2011
É. Lequy et al. / Atmospheric Environment 80 (2013) 281e289 283
water and plastic brushes into collection containers. In the labo-ratory, the sample of supernatant was filtrated at 0.45 mm andstored at 4 �C for elemental analyses. Then the rest of supernatant,which contains APD, is centrifuged (40 min at 3500 tr min�1),treated with 8$10�5 mol of H2O2 three times a week on heatingplates (35 �C) until visible removal of POM. This led to the solubi-lization of S-ADD. Then a sample of the solution of POM removal istaken, filtrated at 0.45 mm and stored at 4 �C for chemical analyses.The rest of the sample, which contains the solid H-ADD and theremaining supernatant solution, is centrifuged (40 min at3500 tr min�1). The sample of H-ADD is then transferred in plastictubes and dried at 35 �C in a ventilated oven and weighted to getthe mass of H-ADD. The detailed protocol is described in Lequy(2012). In the end, we could quantify (i) H-ADD under a solidform, and (ii) the nutrients in the soluble fractions S-ADD and POMin the solution of POM removal.
Physical losses could not be avoided due to the numerous stepsof the protocol. They were quantified by tests with hardly solubleminerals (quartz, chlorite, kaolinite, white mica, vermiculite, K-feldspar, albite and Ti-oxides) with a diameter less than 50 mm fromthe soil of the site F and showed a recovery of 69 � 3% of the testedminerals’ mass (Lequy, 2012). This will be referred to as E, theprotocol efficiency, and used to correct the measured depositionrates.
2.3. Analyses of the mineralogical composition of H-ADD
In order to spare the samples for the chemistry analyses, themineralogical analyses were performed by X-Ray diffraction (XRD).Mineralogical analysis was skipped for samples with too lowmasses. For the same reason, no additional treatment was realizedto precise the types of phyllosilicates. It was not necessary toground the samples in agate mortar, as the particle size of oursamples was silty clay. XRD analyses were performed onungrounded H-ADD, which were mounted on glass slides.
XRD analyses were performed on 29 samples of H-ADD betweenMarch and October 2011, using a Siemens D5000 diffractometer,equipped with a graphite monochromator and a Cu tube (Cu-Ka
Table 2List of the forecasted and sampled episodes of high atmospheric load in the Breuil-Chenue and Montiers-sur-Saulx sites from December 2009 to March 2011.
Episodestarts
Duration ofepisode (days)
Rain amountin M (mm)
Samplingduration inM (days)
Samplingduration inB (days)
10/01/2010 3 0.2 (snow) 1014/04/2010a 7 8.8 10 1507/05/2010 1 6.2 10 1410/06/2010 1 6.8 610/10/2010 1 0.2 708/03/2011 2 0 614/03/2011 3 5 6 6
a Episodic sample during the volcanic eruption of the Eyjafjallajokull.
radiation). The samples were analyzed within the range 1.5e70�2-theta with the followings set-ups: a 0.01�2-theta step, a countingtime of 3s per step and power of 40 kV and 30 mA. Diffractogramswere recorded using a DACO-MP recorder associated with amicrocomputer using Diffrac AT software (Socabim, Champs-SurMarne, France), which allowed us to identify the main mineralsby using the ASTM files of the minerals.
The phyllosilicates with peaks of 1.40 nm and 0.710 nm wereidentified as chlorite minerals. However, in the absence of comple-mentary analyses, it is impossible to distinguish vermiculite orsmectite. Chlorite and kaolinite were discriminated by the peaks of0.70 and 0.35 nm dividing into two peaks. The large band corre-sponding to interlayered clay minerals varied in intensity, depend-ing on the analyzed sample, and its major peaks varied between 1.4and 1.0 nm.
Nineteen samples were also analyzed by Scanning ElectronMicroscopy (SEM), after carbon metallization, with a Hitachi S-4800 equipped with an energy-dispersive system (EDS) at thelaboratory SCMEM (University of Lorraine). These complementarySEM-EDS analyses were used to individually study the appearanceand composition of the minerals.
2.4. Analysis of the chemical composition of APD
The concentration of the solutions containing the solubilizedfractions POM þ S-ADD was quantified for 9 chemical elements(Al, Ca, Fe, K, Mg, Mn, Na, P and Si) by ICP-AES (Agilent Technol-ogies 700 series ICP-OES) with uncertainties of measurement lessthan 10%.
The fraction H-ADD was determined by inductively coupledplasma (ICP-AES), after alkaline fusion with LiBO2 and dissolutionin HNO3, at the laboratory SARM (CNRS, Vandoeuvre-lès-Nancy) toensure precise results. This technique requires at least 20 mg ofsample. Chemical analyses were performed on annual compositesamples of the four sites. The composite samples were a propor-tional mix of each 4-week sample according to their contribution tothe annual H-ADD. Before analysis, samples were dried at 105 �C toexpress results as % of total dry weight. Loss on ignition at 1000 �Cand total analyses were also determined. The undetermined frac-tion corresponds to the non analyzed elements, such as sulfates andchlorides.
2.5. Calculations of H-ADD rates and elemental contents in APD
H-ADD rates were calculated on different time scales: at a yearlyscale (Ry), at a daily scale for each 4-weeks period (Rc), during aforecast Saharan dust episode (Re) and the complementary of Reoutside the episode (Ro).
Annual H-ADD rates (Ry) in g m�2 year�1were calculated as thetotal weight of the samples of the year, normalized to 365 days.
Daily and episodic H-ADD rates Ri in mg m�2 day�1 werecalculated for each site between two dates of sampling according tothe Equation (2).
É. Lequy et al. / Atmospheric Environment 80 (2013) 281e289284
Rj ¼ Wi=ðE$Si$DiÞ (2)
where j ¼ d or e, where Wi is the weight of the sample during theperiod of sampling, in milligrams, Si is the collection surface insquare meters, E is the efficiency of the protocol (69%) and Di is thesampling duration in days.
The H-ADD of the 4-week sampling outside the episode, Ro, wascalculated according to the Equation (3):
Ro ¼ ðRd$Dc � Re$DeÞ=Dc (3)
where Rd and Re are the daily and episodic H-ADD rates, respec-tively, Dd is the duration of the 4-week sampling in days and De isthe duration of the episodic sampling in days. Rd, Re and Ro are inmg m�2 day�1.
The yearly deposition rates of the chemical element X in H-ADD,XH-ADD, was calculated as follows:
XH�ADD ¼ %XH�ADD$Ry (4)
where Ry is the annual H-ADD rate in g m�2 year�1 and %XH-ADD thecontent of X in H-ADD in % of mass of the composite annualsamples.
The deposition rates of the chemical element X in APD, XAPD, wascalculated as follows:
XAPD ¼ XH�ADD þ XS�ADDþPOM (5)
where XH-ADD was calculated after the Equation (4) and XS-ADDþPOMis the deposition rate from the dissolved particles in the solution ofPOM removal.
3. Results and discussion
3.1. Aeolian dust deposition rates
3.1.1. Annual depositionAnnual H-ADD rates (Ry) were relatively homogeneous in the
four sites with 1.8 � 0.3 and 2.0 � 0.4 g m�2 year�1 in 2010 and2011, respectively (Table 3). The average Ry on northern France overthe two years 2010e2011 was 1.9� 0.3 g m�2 year�1. This rate is upto ten times lower than the ADD rates observed in Southern Europe.In the south-eastern Iberian Peninsula, the rate of ADD was26.0 g m�2 year�1, while in northern Spain, APD reached5.2 g m�2 year�1. In Sardinia, ADD reached 13 g m�2 year�1 and, inCorsica, ADD was comprised between 5.9 and 12.5 g m�2 year�1
and could also reach 25 g m�2 year�1 (Bergametti et al., 1989; Avila,1996; Loye-Pilot and Martin, 1996; Guieu et al., 2002; Diaz-Hernandez et al., 2011).
The rates of our study are however in good agreement withprevious works in northerner Europe. The rate of ADD was 2.1 inthe Alps, while that of APD was less than 1.0 in central France(Bücher and Lucas, 1984; Deangelis and Gaudichet, 1991).
The Ry in the present study are also consistent with the esti-mations given by the global models for this area, which suggested
Table 3Hardly soluble Aeolian dust deposition (H-ADD) rates for the four sites for the years2010 and 2011 and their annual average (standard deviation in brackets).
H-ADD rate(g m�2 year�1)
Breuil-Chenue Montiers-sur-Saulx
Hesse Fougères Average
2010 1.7 1.7 1.5 2.1 1.8 (0.3)2011 1.5 2.0 2.5 2.0 2.0 (0.4)
that ADD rates between 1 and 5 g m�2 year�1 (Jickells et al., 2005;Mahowald et al., 2005).
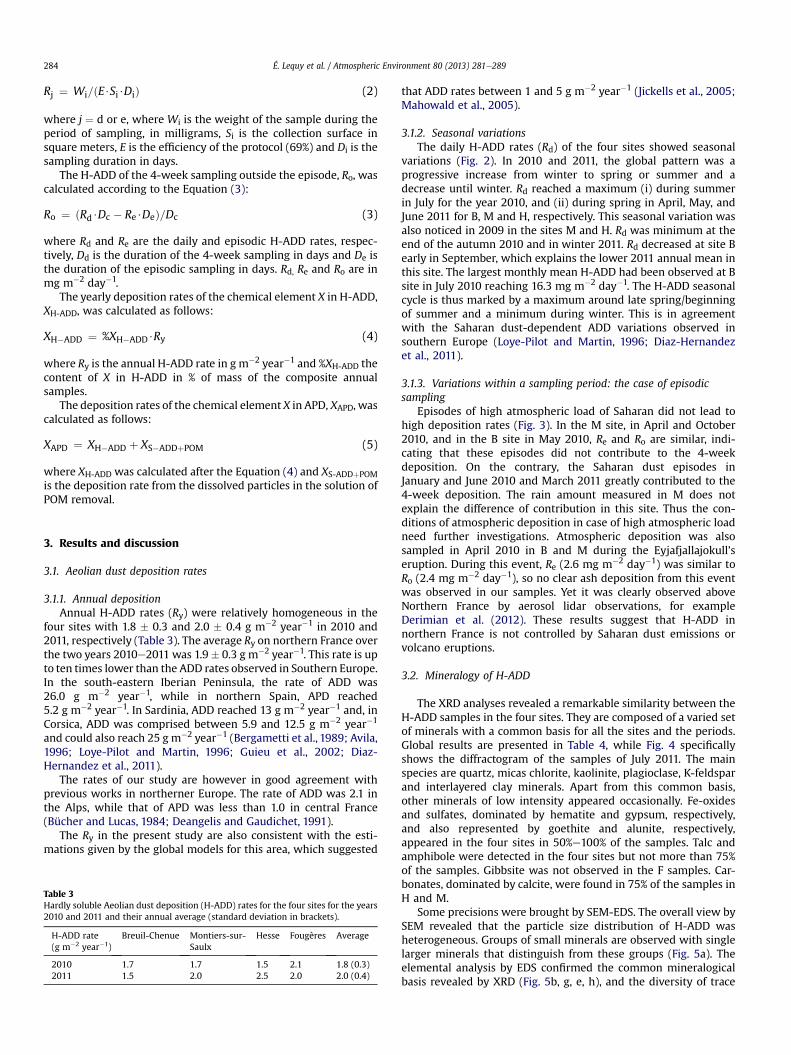
3.1.2. Seasonal variationsThe daily H-ADD rates (Rd) of the four sites showed seasonal
variations (Fig. 2). In 2010 and 2011, the global pattern was aprogressive increase from winter to spring or summer and adecrease until winter. Rd reached a maximum (i) during summerin July for the year 2010, and (ii) during spring in April, May, andJune 2011 for B, M and H, respectively. This seasonal variation wasalso noticed in 2009 in the sites M and H. Rd was minimum at theend of the autumn 2010 and in winter 2011. Rd decreased at site Bearly in September, which explains the lower 2011 annual mean inthis site. The largest monthly mean H-ADD had been observed at Bsite in July 2010 reaching 16.3 mg m�2 day�1. The H-ADD seasonalcycle is thus marked by a maximum around late spring/beginningof summer and a minimum during winter. This is in agreementwith the Saharan dust-dependent ADD variations observed insouthern Europe (Loye-Pilot and Martin, 1996; Diaz-Hernandezet al., 2011).
3.1.3. Variations within a sampling period: the case of episodicsampling
Episodes of high atmospheric load of Saharan did not lead tohigh deposition rates (Fig. 3). In the M site, in April and October2010, and in the B site in May 2010, Re and Ro are similar, indi-cating that these episodes did not contribute to the 4-weekdeposition. On the contrary, the Saharan dust episodes inJanuary and June 2010 and March 2011 greatly contributed to the4-week deposition. The rain amount measured in M does notexplain the difference of contribution in this site. Thus the con-ditions of atmospheric deposition in case of high atmospheric loadneed further investigations. Atmospheric deposition was alsosampled in April 2010 in B and M during the Eyjafjallajokull’seruption. During this event, Re (2.6 mg m�2 day�1) was similar toRo (2.4 mg m�2 day�1), so no clear ash deposition from this eventwas observed in our samples. Yet it was clearly observed aboveNorthern France by aerosol lidar observations, for exampleDerimian et al. (2012). These results suggest that H-ADD innorthern France is not controlled by Saharan dust emissions orvolcano eruptions.
3.2. Mineralogy of H-ADD
The XRD analyses revealed a remarkable similarity between theH-ADD samples in the four sites. They are composed of a varied setof minerals with a common basis for all the sites and the periods.Global results are presented in Table 4, while Fig. 4 specificallyshows the diffractogram of the samples of July 2011. The mainspecies are quartz, micas chlorite, kaolinite, plagioclase, K-feldsparand interlayered clay minerals. Apart from this common basis,other minerals of low intensity appeared occasionally. Fe-oxidesand sulfates, dominated by hematite and gypsum, respectively,and also represented by goethite and alunite, respectively,appeared in the four sites in 50%e100% of the samples. Talc andamphibole were detected in the four sites but not more than 75%of the samples. Gibbsite was not observed in the F samples. Car-bonates, dominated by calcite, were found in 75% of the samples inH and M.
Some precisions were brought by SEM-EDS. The overall view bySEM revealed that the particle size distribution of H-ADD washeterogeneous. Groups of small minerals are observed with singlelarger minerals that distinguish from these groups (Fig. 5a). Theelemental analysis by EDS confirmed the common mineralogicalbasis revealed by XRD (Fig. 5b, g, e, h), and the diversity of trace
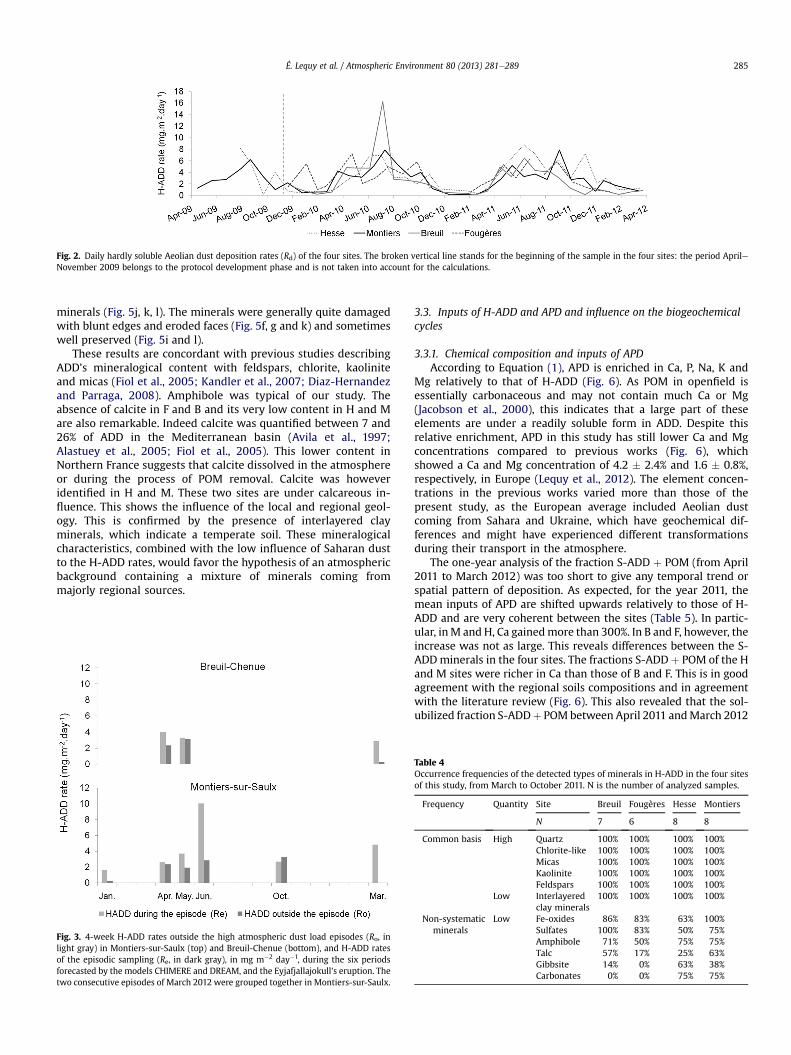
Fig. 2. Daily hardly soluble Aeolian dust deposition rates (Rd) of the four sites. The broken vertical line stands for the beginning of the sample in the four sites: the period AprileNovember 2009 belongs to the protocol development phase and is not taken into account for the calculations.
É. Lequy et al. / Atmospheric Environment 80 (2013) 281e289 285
minerals (Fig. 5j, k, l). The minerals were generally quite damagedwith blunt edges and eroded faces (Fig. 5f, g and k) and sometimeswell preserved (Fig. 5i and l).
These results are concordant with previous studies describingADD’s mineralogical content with feldspars, chlorite, kaoliniteand micas (Fiol et al., 2005; Kandler et al., 2007; Diaz-Hernandezand Parraga, 2008). Amphibole was typical of our study. Theabsence of calcite in F and B and its very low content in H and Mare also remarkable. Indeed calcite was quantified between 7 and26% of ADD in the Mediterranean basin (Avila et al., 1997;Alastuey et al., 2005; Fiol et al., 2005). This lower content inNorthern France suggests that calcite dissolved in the atmosphereor during the process of POM removal. Calcite was howeveridentified in H and M. These two sites are under calcareous in-fluence. This shows the influence of the local and regional geol-ogy. This is confirmed by the presence of interlayered clayminerals, which indicate a temperate soil. These mineralogicalcharacteristics, combined with the low influence of Saharan dustto the H-ADD rates, would favor the hypothesis of an atmosphericbackground containing a mixture of minerals coming frommajorly regional sources.
Fig. 3. 4-week H-ADD rates outside the high atmospheric dust load episodes (Ro, inlight gray) in Montiers-sur-Saulx (top) and Breuil-Chenue (bottom), and H-ADD ratesof the episodic sampling (Re, in dark gray), in mg m�2 day�1, during the six periodsforecasted by the models CHIMERE and DREAM, and the Eyjafjallajokull’s eruption. Thetwo consecutive episodes of March 2012 were grouped together in Montiers-sur-Saulx.
3.3. Inputs of H-ADD and APD and influence on the biogeochemicalcycles
3.3.1. Chemical composition and inputs of APDAccording to Equation (1), APD is enriched in Ca, P, Na, K and
Mg relatively to that of H-ADD (Fig. 6). As POM in openfield isessentially carbonaceous and may not contain much Ca or Mg(Jacobson et al., 2000), this indicates that a large part of theseelements are under a readily soluble form in ADD. Despite thisrelative enrichment, APD in this study has still lower Ca and Mgconcentrations compared to previous works (Fig. 6), whichshowed a Ca and Mg concentration of 4.2 � 2.4% and 1.6 � 0.8%,respectively, in Europe (Lequy et al., 2012). The element concen-trations in the previous works varied more than those of thepresent study, as the European average included Aeolian dustcoming from Sahara and Ukraine, which have geochemical dif-ferences and might have experienced different transformationsduring their transport in the atmosphere.
The one-year analysis of the fraction S-ADD þ POM (from April2011 to March 2012) was too short to give any temporal trend orspatial pattern of deposition. As expected, for the year 2011, themean inputs of APD are shifted upwards relatively to those of H-ADD and are very coherent between the sites (Table 5). In partic-ular, inM and H, Ca gainedmore than 300%. In B and F, however, theincrease was not as large. This reveals differences between the S-ADDminerals in the four sites. The fractions S-ADDþ POM of the Hand M sites were richer in Ca than those of B and F. This is in goodagreement with the regional soils compositions and in agreementwith the literature review (Fig. 6). This also revealed that the sol-ubilized fraction S-ADDþ POM between April 2011 andMarch 2012
Table 4Occurrence frequencies of the detected types of minerals in H-ADD in the four sitesof this study, from March to October 2011. N is the number of analyzed samples.
Frequency Quantity Site Breuil Fougères Hesse Montiers
N 7 6 8 8
Common basis High Quartz 100% 100% 100% 100%Chlorite-like 100% 100% 100% 100%Micas 100% 100% 100% 100%Kaolinite 100% 100% 100% 100%Feldspars 100% 100% 100% 100%
Low Interlayeredclay minerals
100% 100% 100% 100%
Non-systematicminerals
Low Fe-oxides 86% 83% 63% 100%Sulfates 100% 83% 50% 75%Amphibole 71% 50% 75% 75%Talc 57% 17% 25% 63%Gibbsite 14% 0% 63% 38%Carbonates 0% 0% 75% 75%

Fig. 4. X-Ray diffractograms of the H-ADD samples of July 2011 in the four sampling sites. The identified minerals are showed with arrows. The numeric value is the interplanarspacing of the peaks, in nm. Plain arrows represent the major peaks of the minerals; dotted arrows represent the second and third orders of chlorite, kaolinite and micas, as well asthe second peak of quartz (0.426 nm). Amp: amphibole, Chl: chlorite, Hem: hematite, Kfs: K-feldspar, Kln: kaolinite, Ms/Bt: micas, Pl: plagioclase, Qz: quartz.
É. Lequy et al. / Atmospheric Environment 80 (2013) 281e289286
contained the average main part of soluble Ca (79 � 8%), Na(61 � 9%) and P (86 � 4%) and a non-negligible part of soluble K(43 � 9%) and Mg (39 � 7%) in the 4 sampling sites.
3.3.2. Comparison of the three inputs of nutrients in forestecosystems
Classically, nutrient inputeoutput budgets are calculated asfollows:
Budget (X) ¼ Soil Weathering (X) þ Atmospheric Deposition(X) � Leaching (X) � Uptake (X) (7)
All fluxes and budgets are expressed in kg ha�1 year�1 (Ranger andTurpault, 1999).
Atmospheric Deposition (AD) takes into account the elements inthe <0.45 mm fraction of the mean deposition in bulk rainfall inopenfield to which the dry deposition induced by the canopy isadded, after being estimated using the equations defined by Ulrich(1983). For these equations, Na in throughfall is considered as aninert ion regarding to canopy, i.e. not influenced by canopy ex-change, and therefore used as a proxy of dry deposition in thecanopy for the other elements.
Here we compare the nutrient inputs by APD assessed in thepresent study to those by atmospheric dissolved deposition (AD)and soil weathering (SW) computed in previous studies (Table 6).However, few AD and SW data are available for these sites (Legout,2008; Van der Heijden et al., 2013), so few comparisons werepossible: (i) APD can be compared to AD calculated following the
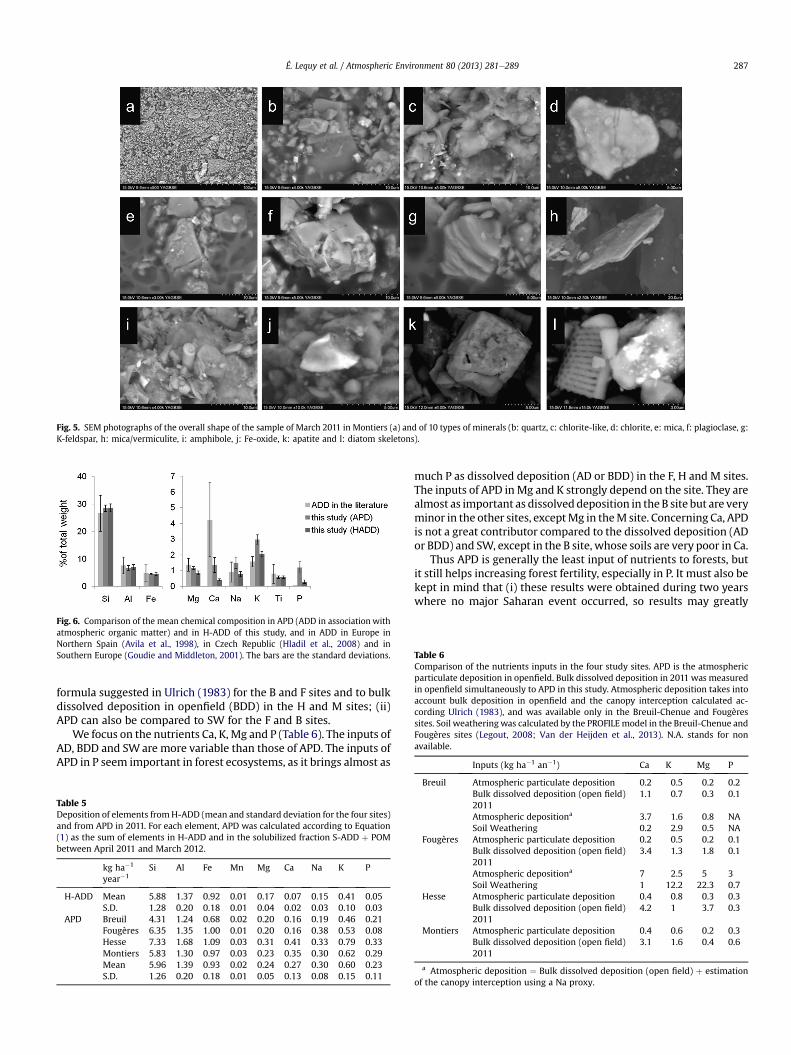
Fig. 5. SEM photographs of the overall shape of the sample of March 2011 in Montiers (a) and of 10 types of minerals (b: quartz, c: chlorite-like, d: chlorite, e: mica, f: plagioclase, g:K-feldspar, h: mica/vermiculite, i: amphibole, j: Fe-oxide, k: apatite and l: diatom skeletons).
Fig. 6. Comparison of the mean chemical composition in APD (ADD in association withatmospheric organic matter) and in H-ADD of this study, and in ADD in Europe inNorthern Spain (Avila et al., 1998), in Czech Republic (Hladil et al., 2008) and inSouthern Europe (Goudie and Middleton, 2001). The bars are the standard deviations. Table 6
Comparison of the nutrients inputs in the four study sites. APD is the atmosphericparticulate deposition in openfield. Bulk dissolved deposition in 2011 was measuredin openfield simultaneously to APD in this study. Atmospheric deposition takes intoaccount bulk deposition in openfield and the canopy interception calculated ac-cording Ulrich (1983), and was available only in the Breuil-Chenue and Fougèressites. Soil weathering was calculated by the PROFILEmodel in the Breuil-Chenue andFougères sites (Legout, 2008; Van der Heijden et al., 2013). N.A. stands for nonavailable.
Inputs (kg ha�1 an�1) Ca K Mg P
É. Lequy et al. / Atmospheric Environment 80 (2013) 281e289 287
formula suggested in Ulrich (1983) for the B and F sites and to bulkdissolved deposition in openfield (BDD) in the H and M sites; (ii)APD can also be compared to SW for the F and B sites.
We focus on the nutrients Ca, K, Mg and P (Table 6). The inputs ofAD, BDD and SWare more variable than those of APD. The inputs ofAPD in P seem important in forest ecosystems, as it brings almost as
Table 5Deposition of elements fromH-ADD (mean and standard deviation for the four sites)and from APD in 2011. For each element, APD was calculated according to Equation(1) as the sum of elements in H-ADD and in the solubilized fraction S-ADD þ POMbetween April 2011 and March 2012.
kg ha�1
year�1Si Al Fe Mn Mg Ca Na K P
H-ADD Mean 5.88 1.37 0.92 0.01 0.17 0.07 0.15 0.41 0.05S.D. 1.28 0.20 0.18 0.01 0.04 0.02 0.03 0.10 0.03
APD Breuil 4.31 1.24 0.68 0.02 0.20 0.16 0.19 0.46 0.21Fougères 6.35 1.35 1.00 0.01 0.20 0.16 0.38 0.53 0.08Hesse 7.33 1.68 1.09 0.03 0.31 0.41 0.33 0.79 0.33Montiers 5.83 1.30 0.97 0.03 0.23 0.35 0.30 0.62 0.29Mean 5.96 1.39 0.93 0.02 0.24 0.27 0.30 0.60 0.23S.D. 1.26 0.20 0.18 0.01 0.05 0.13 0.08 0.15 0.11
much P as dissolved deposition (AD or BDD) in the F, H and M sites.The inputs of APD in Mg and K strongly depend on the site. They arealmost as important as dissolveddeposition in the B site but are veryminor in the other sites, exceptMg in theM site. Concerning Ca, APDis not a great contributor compared to the dissolved deposition (ADor BDD) and SW, except in the B site, whose soils are very poor in Ca.
Thus APD is generally the least input of nutrients to forests, butit still helps increasing forest fertility, especially in P. It must also bekept in mind that (i) these results were obtained during two yearswhere no major Saharan event occurred, so results may greatly
Breuil Atmospheric particulate deposition 0.2 0.5 0.2 0.2Bulk dissolved deposition (open field)2011
1.1 0.7 0.3 0.1
Atmospheric depositiona 3.7 1.6 0.8 NASoil Weathering 0.2 2.9 0.5 NA
Fougères Atmospheric particulate deposition 0.2 0.5 0.2 0.1Bulk dissolved deposition (open field)2011
3.4 1.3 1.8 0.1
Atmospheric depositiona 7 2.5 5 3Soil Weathering 1 12.2 22.3 0.7
Hesse Atmospheric particulate deposition 0.4 0.8 0.3 0.3Bulk dissolved deposition (open field)2011
4.2 1 3.7 0.3
Montiers Atmospheric particulate deposition 0.4 0.6 0.2 0.3Bulk dissolved deposition (open field)2011
3.1 1.6 0.4 0.6
a Atmospheric deposition ¼ Bulk dissolved deposition (open field) þ estimationof the canopy interception using a Na proxy.

É. Lequy et al. / Atmospheric Environment 80 (2013) 281e289288
differ during years with a large Saharan dust deposition episodebringing nutrient bearing minerals, and (ii) this study does not takeinto account the APD below the canopy, which needs furtherinvestigations.
4. Conclusions
This two-year study of Aeolian dust deposition in the North ofFrance, without any major direct Saharan outbreak, revealed ahomogenous annual H-ADD rate of 1.9 � 0.3 g m�2 year�1 withseasonal variations: high deposition in spring and summer and lowdeposition in winter. Contrary to ADD in Southern France, thesevariations are not due to the Saharan desert outbreaks, but wouldrather result from the regional erosion of temperate soils. Despitethese seasonal variations, the mineralogical composition wasremarkably similar between the sites and the sampling periods. Allthe samples are based on quartz, chlorite, mica, kaolinite, feldsparsand interlayered clay minerals. This basis was completed by non-systematic minerals with very low contribution to the mass of H-ADD: Fe-oxides, sulfates, amphiboles, talc, gibbsite and carbonates(only in the sites on calcareous bedrock). The chemistry of thesamples was consistent with the mineralogy, revealing a domi-nance of Si, Al and Fe, contributing to 39.6 � 1.5% of APD. Theorganic matter and soluble minerals (according to our protocol)contained 79� 8%, 61�9%, 86� 4%, 43� 9%, 39� 7% of Ca, Na, P, Kand Mg, respectively. However, it was impossible to distinguishwhich part came from soluble minerals or from organic matter. Thenutrient inputs of APD to forest ecosystems did not exceed 0.5, 0.8,0.3 and 0.4 kg ha�1 year�1 of Ca, K, Mg and P respectively, high-lighting it is a minor flux of nutrients in forests compared to thoseof atmospheric dissolved deposition and soil weathering (exceptfor Ca on very acidic soils, and for P). This two-year sampling andanalysis will be pursued using a lighter protocol in order to com-plement the results presented here but also to analyze the long-term temporal trend of ADD in the North of France and betterisolate the soluble minerals from atmospheric organic matter.Further investigations are still necessary to quantify to what extentthese inputs contribute to the biogeochemical cycles of forestecosystems and to determine the sources of ADD.
Acknowledgments
We would like to thank the Andra and the GIP ECOFOR forfunding the present study.We are grateful to the ONF (French Officefor Forest Management) for allowing the access to the study sites,and the Inra for the technical support: Jérôme Demaison and SergeDidier for designing and setting up the samplers; Chris Fléchardand Yannick Fauvel (INRA SAS), Patrick Gross and Pascal Courtois(Inra EEF), Gregory van der Heijden (Inra BEF) and Maxime Simon(Andra), for the sampling in the field; Pasclale Battung, PerrineMathieu, Claire Pantigny, for both sampling in the field and thepreparation in the laboratory; Carine Cochet for the sampling an-alyses.We are also very grateful to Christophe Calvaruso for his helpin the field and his useful discussion, and to Anna Avila (CREAFBarcelona) as well as to two anonymous reviewers for theirprecious suggestions improving the manuscript.
References
Alastuey, A., Querol, X., Castillo, S., Escudero, M., Avila, A., Cuevas, E., Torres, C.,Romero, P.M., Exposito, F., Garcia, O., Diaz, J.P., Van Dingenen, R., Putaud, J.P.,2005. Characterisation of TSP and PM2.5 at Izana and Sta. Cruz de Tenerife(Canary Islands, Spain) during a Saharan Dust Episode (July 2002). Atmos.Environ. 39, 4715e4728.
Ansmann, A., Bosenberg, J., Chaikovsky, A., Comeron, A., Eckhardt, S., Eixmann, R.,Freudenthaler, V., Ginoux, P., Komguem, L., Linne, H., Marquez, M.A.L.,
Matthias, V., Mattis, I., Mitev, V., Muller, D., Music, S., Nickovic, S., Pelon, J.,Sauvage, L., Sobolewsky, P., Srivastava, M.K., Stohl, A., Torres, O., Vaughan, G.,Wandinger, U., Wiegner, M., 2003. Long-range transport of Saharan dust tonorthern Europe: the 11e16 October 2001 outbreak observed with EARLINET.J. Geophys. Res. Atmos. 108, 15.
Avila, A., 1996. Time trends in the precipitation chemistry at a mountain site innortheastern Spain for the period 1983e1994. Atmos. Environ. 30, 1363e1373.
Avila, A., Alarcon, M., Queralt, I., 1998. The chemical composition of dust trans-ported in red rains e its contribution to the biogeochemical cycle of a Holm oakforest in Catalonia (Spain). Atmos. Environ. 32, 179e191.
Avila, A., Penuelas, J., 1999. Increasing frequency of Saharan rains over northeasternSpain and its ecological consequences. Sci. Total Environ. 228, 153e156.
Avila, A., QueraltMitjans, I., Alarcon, M., 1997. Mineralogical composition of Africandust delivered by red rains over northeastern Spain. J. Geophys. Res. Atmos. 102,21977e21996.
Bergametti, G., Dutot, A.-L., Buat-Menard, P., Losno, R., Remoudaki, E., 1989. Seasonalvariability of the elemental composition of atmospheric aerosol particles over thenorthwestern Mediterranean. Tellus Ser. B Chem. Phys. Meteorol. 41, 353e361.
Bücher, A., Lucas, C., 1984. Aeolian intercontinental sedimentation, Saharan dustand geology. Bull. Centres Rech. Explor. Prod. Elf Aquitaine 8, 151e165.
Deangelis, M., Gaudichet, A., 1991. Saharan dust deposition over Mont-Blanc(French Alps) during the last 30 years. Tellus Ser. B Chem. Phys. Meteorol. 43,61e75.
Derimian, Y., Dubovik, O., Tanre, D., Goloub, P., Lapyonok, T., Mortier, A., 2012.Optical properties and radiative forcing of the Eyjafjallajokull volcanic ash layerobserved over Lille, France, in 2010. J. Geophys. Res. Atmos. 117, D00U25.
Diaz-Hernandez, J.L., Martin-Ramos, J.D., Lopez-Galindo, A., 2011. Quantitativeanalysis of mineral phases in atmospheric dust deposited in the south-easternIberian Peninsula. Atmos. Environ. 45, 3015e3024.
Diaz-Hernandez, J.L., Parraga, J., 2008. The nature and tropospheric formation ofiberulites: pinkish mineral microspherulites. Geochim. Cosmochim. Acta 72,3883e3906.
Fiol, L.A., Fornos, J.J., Gelabert, B., Guijarro, J.A., 2005. Dust rains in Mallorca(Western Mediterranean): their occurrence and role in some recent geologicalprocesses. Catena 63, 64e84.
Franzen, L.G., Hjelmroos, M., Kallberg, P., Brorstromlunden, E., Juntto, S.,Savolainen, A.L., 1994. The yellow-snow episode of northern Fennoscandia,march-1991 e a case-study of long-distance transport of soil, pollen and stableorganic-compounds. Atmos. Environ. 28, 3587e3604.
Goudie, A.S., Middleton, N.J., 2001. Saharan dust storms: nature and consequences.Earth Sci. Rev. 56, 179e204.
Guerzoni, S., Molinaroli, E., Chester, R., 1997. Saharan dust inputs to the westernMediterranean Sea: depositional patterns, geochemistry and sedimentologicalimplications. Deep Sea Res. Part II Top. Stud. Oceanogr. 44, 631e654.
Guieu, C., Bozec, Y., Blain, S., Ridame, C., Sarthou, G., Leblond, N., 2002. Impact ofhigh Saharan dust inputs on dissolved iron concentrations in the MediterraneanSea. Geophys. Res. Lett. 29, 4.
Herut, B., Krom, M., 1996. Atmospheric input of nutrients and dust to the SEMediterranean. In: Guerzoni, S., Chester, R. (Eds.), The Impact of Desert Dustacross the Mediterranean. Kluwer Academic Publisher, Dordrecht, pp. 349e358.
Hladil, J., Strnad, L., Salek, M., Jankovska, V., Simandl, P., Schwarz, J., Smolik, J.,Lisa, L., Koptikova, L., Rohovec, J., Bohmova, V., Langrova, A., Kocianova, M.,Melichar, R., Adamovic, J., 2008. An anomalous atmospheric dust depositionevent over Central Europe, 24 March 2007, and fingerprinting of the SEUkrainian source. Bull. Geosci. 83, 175e206.
Jacobson, M.C., Hansson, H.C., Noone, K.J., Charlson, R.J., 2000. Organic atmosphericaerosols: review and state of the science. Rev. Geophys. 38, 267e294.
Jickells, T.D., An, Z.S., Andersen, K.K., Baker, A.R., Bergametti, G., Brooks, N., Cao, J.J.,Boyd, P.W., Duce, R.A., Hunter, K.A., Kawahata, H., Kubilay, N., laRoche, J.,Liss, P.S., Mahowald, N., Prospero, J.M., Ridgwell, A.J., Tegen, I., Torres, R., 2005.Global iron connections between desert dust, ocean biogeochemistry, andclimate. Science 308, 67e71.
Kandler, K., Benker, N., Bundke, U., Cuevas, E., Ebert, M., Knippertz, P., Rodriguez, S.,Schutz, L., Weinbruch, S., 2007. Chemical composition and complex refractiveindex of Saharan Mineral Dust at Izana, Tenerife (Spain) derived by electronmicroscopy. Atmos. Environ. 41, 8058e8074.
Lawrence, C.R., Neff, J.C., 2009. The contemporary physical and chemical flux ofaeolian dust: a synthesis of direct measurements of dust deposition. Chem.Geol. 267, 46e63.
Legout, A., 2008. Cycles biogéochimiques et bilans de fertilité minérale en hêtraiesde plaine.
Lequy, É., Conil, S., Turpault, M.-P., 2012. Impacts of Aeolian dust deposition onEuropean forest sustainability: a review. For. Ecol. Manag. 267, 240e252.
Lequy, É., 2012. Dépôts atmosphériques particulaires sur les écosystèmes forestiersde la moitié nord de la France: influence sur les cycles biogéochimiques. Uni-versité de Lorraine, Nancy, France.
Loye-Pilot, M.D., Martin, J.M., 1996. Saharan dust input to the western Mediterra-nean: an eleven years record in Corsica. In: Guerzoni, S., Chester, R. (Eds.), TheImpact of African Dust across the Mediterranean. Kluwer Academic Publisher,Dordrecht, pp. 191e199.
Loye-Pilot, M.D., Martin, J.M., Morelli, J., 1986. Influence of Saharan dust on the rainacidity and atmospheric input to the Mediterranean. Nature 321, 427e428.
Mahowald, N.M., Baker, A.R., Bergametti, G., Brooks, N., Duce, R.A., Jickells, T.D.,Kubilay, N., Prospero, J.M., Tegen, I., 2005. Atmospheric global dust cycle andiron inputs to the ocean. Glob. Biogeochem. Cycles 19, GB4025.

É. Lequy et al. / Atmospheric Environment 80 (2013) 281e289 289
Mattsson, J.O., Nihlen, T., 1996. The transport of Saharan dust to southern Europe: ascenario. J. Arid Environ. 32, 111e119.
Menut, L., Chiapello, I., Moulin, C., 2009. Predictability of mineral dust concentra-tions: the African Monsoon Multidisciplinary Analysis first short observationperiod forecasted with CHIMERE-DUST. J. Geophys. Res. Atmos. 114.
Nickovic, S., Kallos, G., Papadopoulos, A., Kakaliagou, O., 2001. A model for predic-tion of desert dust cycle in the atmosphere. J. Geophys. Res. Atmos. 106, 18113e18129.
Ranger, J., Turpault, M.P., 1999. Input-output nutrient budgets as a diagnostic toolfor sustainable forest management. For. Ecol. Manag. 122, 139e154.
Shao, Y.P., Wyrwoll, K.H., Chappell, A., Huang, J.P., Lin, Z.H., McTainsh, G.H.,Mikami, M., Tanaka, T.Y., Wang, X.L., Yoon, S., 2011. Dust cycle: an emerging coretheme in Earth system science. Aeolian Res. 2, 181e204.
Ulrich, B., 1983. Interaction of forest canopies with atmospheric constituents: SO2,alkali and earth alkali cations and chloride. Eff. Accumul. Air Pollut. For. Eco-syst., 33e45.
Van der Heijden, G., Legout, A., Pollier, B., Mareschal, L., Turpault, M.-P., Ranger, J.,Dambrine, E., 2013. Assessing Mg and Ca depletion from broadleaf forest soilsand potential causes e a case study in the Morvan Mountains. For. Ecol. Manag.293, 65e78.