Embed Size (px)
Citation preview
1
The Relationship of Perceived Social Support with Well-Being in Individuals with Visual Impairments
AER International Conference 2010Amy R. McKenzie, Ed.D. & Susan Miller Smedema, Ph.D., CRC
Florida State University
2
Presentation Outline
Terminology Prior Research Methodology Results Implications & Recommendations
The authors kindly request that attendees not distribute the contents of this presentation, as a manuscript based on the study has been submitted for publication.
3
Terminology
Quality of Life is “individuals’ perceptions of their
position in the context of the culture and value systems in which they love and in relation to their goals, expectations, standards, and concerns” (World Health Organization, 1995, p. 1405)
is one of the most important outcomes related to disability service provision (Bishop, Chapin, & Miller, 2008)
4
Terminology
Subjective Quality of Life is the measure of one’s feelings
about his or her life situation; overall and in various life domains
often includes the measurement of sense of well-being, life satisfaction, and depressive symptoms
matches the subjective nature of the WHO’s definition of QOL
5
Prior Research
In the field of visual impairments, social support and well-being have been investigated with focus on their relationship with:
perceived overprotection (Cimarolli, 2006; Cimarolli, Reinhardt, & Horowitz, 2006; Cimarolli & Wang, 2006)
employment (Cimarolli & Wang, 2006) life goals (Boerner & Cimarolli, 2005) life changes (Boerner, Wang, & Cimarolli, 2006), adaptation of vision loss (McIlvane & Reinhardt, 2001;
Reinhardt, 1996; Cimarolli, Reinhardt, & Horowitz, 2006)
frequency and type of internet use (Smedema & McKenzie, 2010)
6
Current Study
The current study is a partial replication of Cimarolli & Boerner’s (2005) investigation of the link between psychological well-being of 86 adults with visual impairments in the New York metropolitan area and positive and negative social support.
However, differences include national recruitment, larger number of participants, the use of regression analysis, measurement of percieved social support on a continuum (rather than positive vs. negative) and the measurement of specific sense of well-being factors through an additional scale.
7
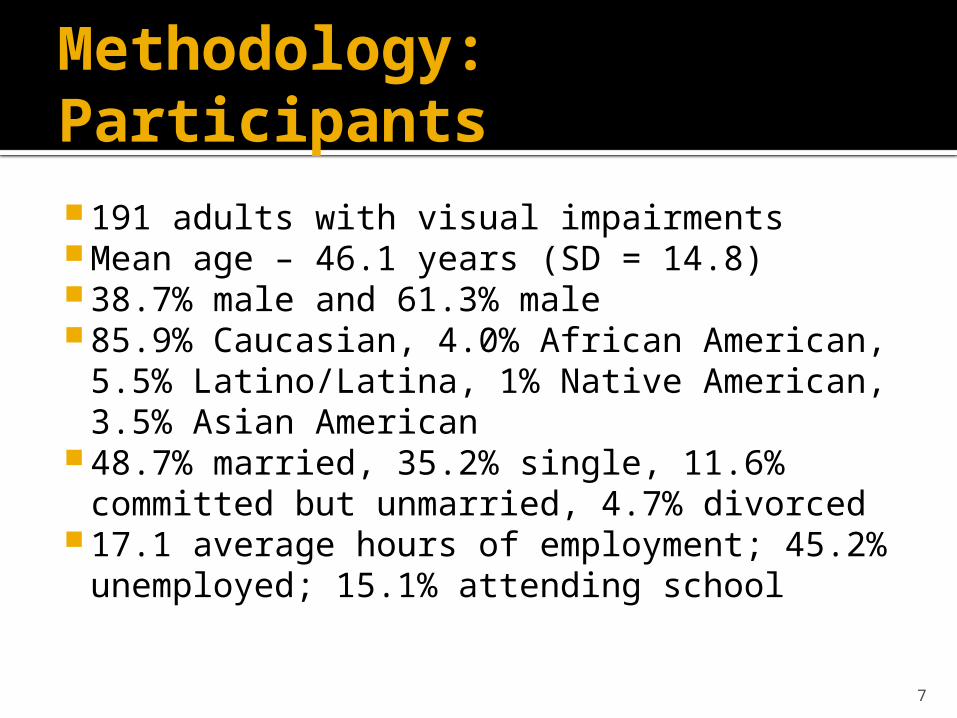
Methodology: Participants 191 adults with visual impairments Mean age – 46.1 years (SD = 14.8) 38.7% male and 61.3% male 85.9% Caucasian, 4.0% African American,
5.5% Latino/Latina, 1% Native American, 3.5% Asian American
48.7% married, 35.2% single, 11.6% committed but unmarried, 4.7% divorced
17.1 average hours of employment; 45.2% unemployed; 15.1% attending school
8
Methodology: Participants
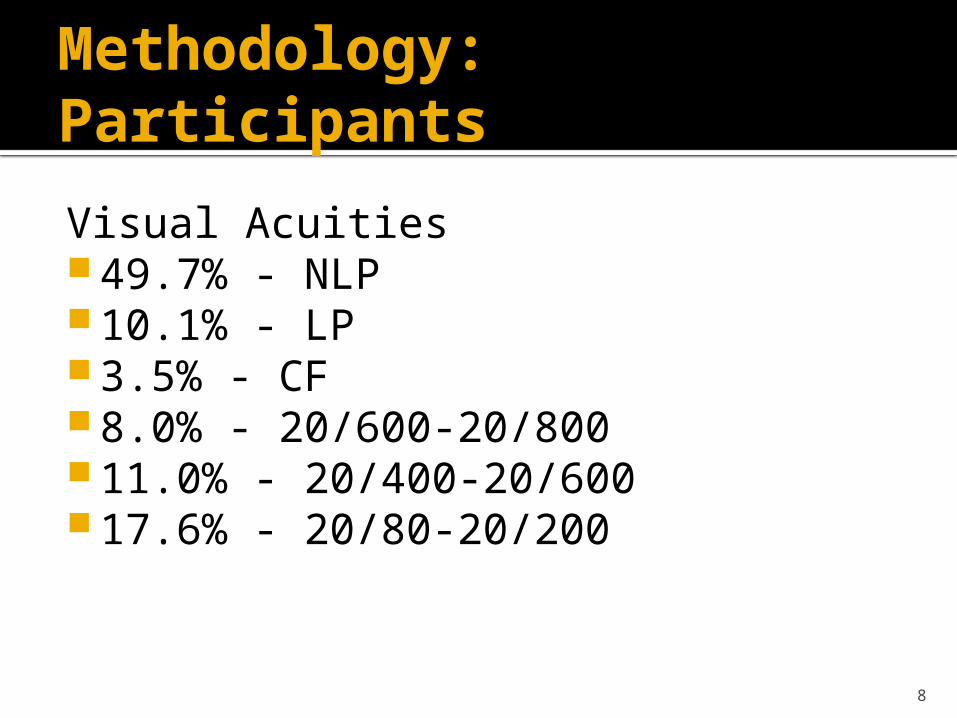
Visual Acuities 49.7% - NLP 10.1% - LP 3.5% - CF 8.0% - 20/600-20/800 11.0% - 20/400-20/600 17.6% - 20/80-20/200
9
Methodology: Participants
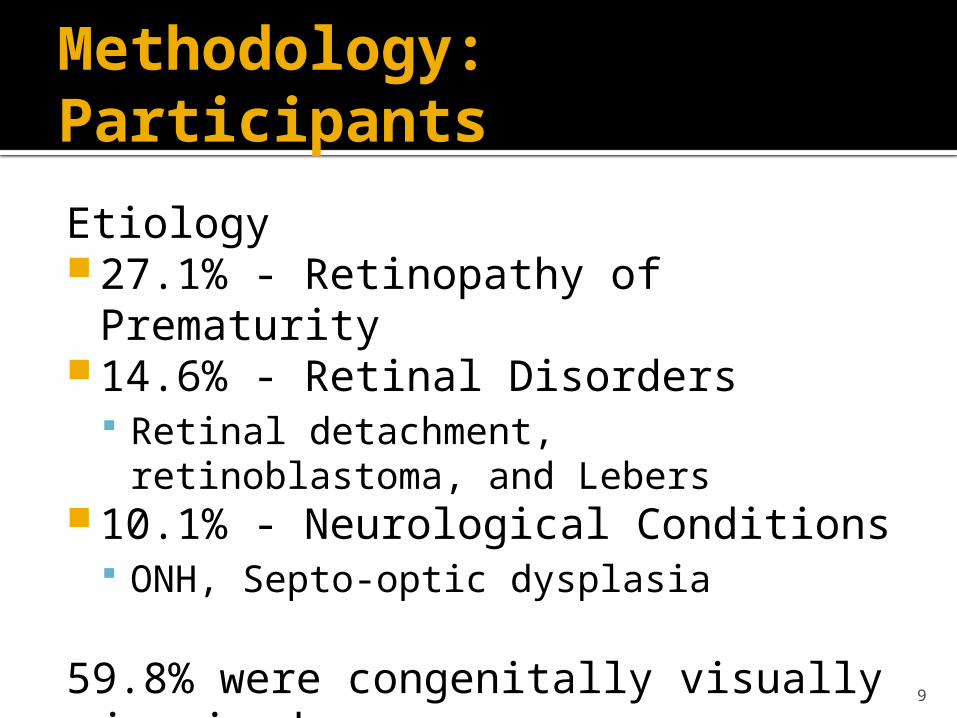
Etiology 27.1% - Retinopathy of Prematurity 14.6% - Retinal Disorders
Retinal detachment, retinoblastoma, and Lebers
10.1% - Neurological Conditions ONH, Septo-optic dysplasia
59.8% were congenitally visually impaired
10
Methodology: Instruments
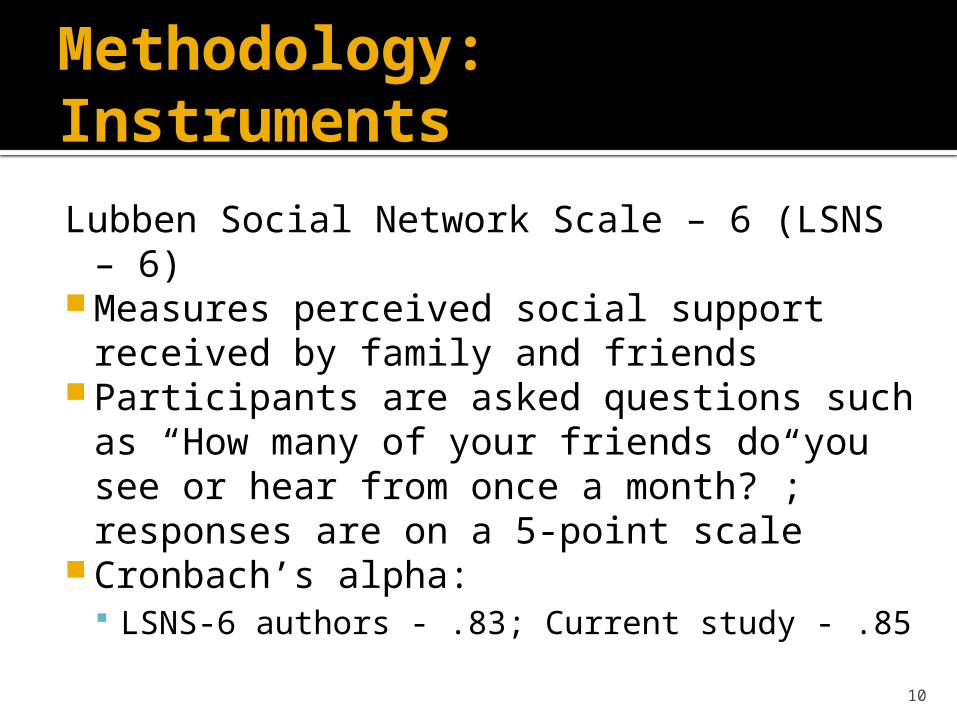
Lubben Social Network Scale – 6 (LSNS – 6)
Measures perceived social support received by family and friends
Participants are asked questions such as “How many of your friends do you see or hear from once a month?”; responses are on a 5-point scale
Cronbach’s alpha: LSNS-6 authors - .83; Current study - .85
11
Methodology: Instruments
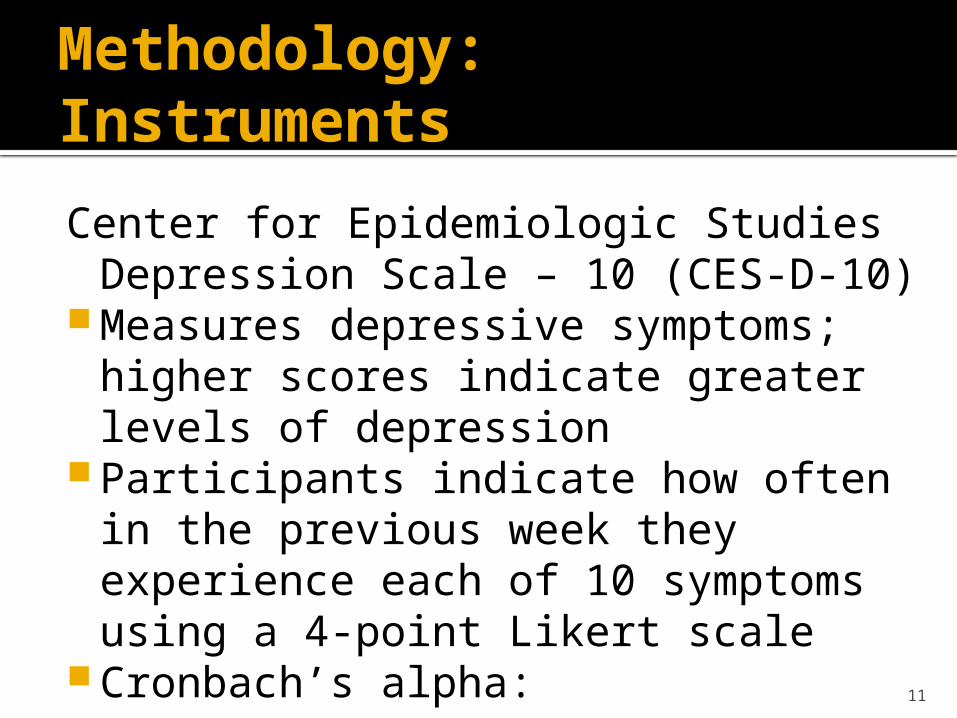
Center for Epidemiologic Studies Depression Scale – 10 (CES-D-10)
Measures depressive symptoms; higher scores indicate greater levels of depression
Participants indicate how often in the previous week they experience each of 10 symptoms using a 4-point Likert scale
Cronbach’s alpha: CES-D-6 authors - .84; Current study - .92
12
Methodology: Instruments
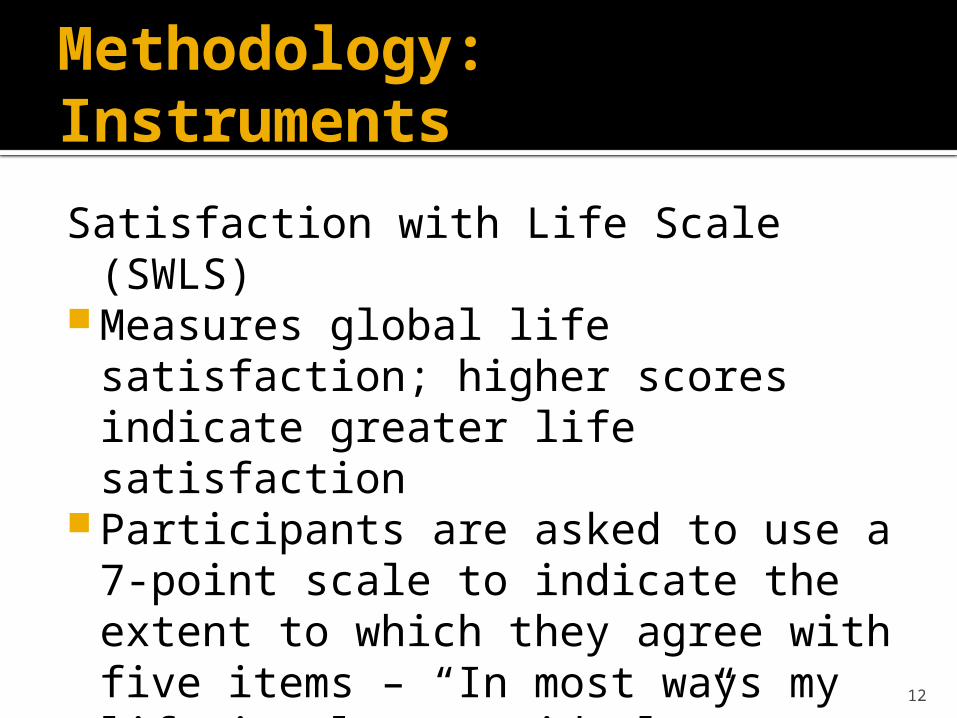
Satisfaction with Life Scale (SWLS) Measures global life satisfaction;
higher scores indicate greater life satisfaction
Participants are asked to use a 7-point scale to indicate the extent to which they agree with five items – “In most ways my life is close to ideal.”
Cronbach’s alpha SWLS authors - .87; Current study - .91
13
Methodology: Instruments
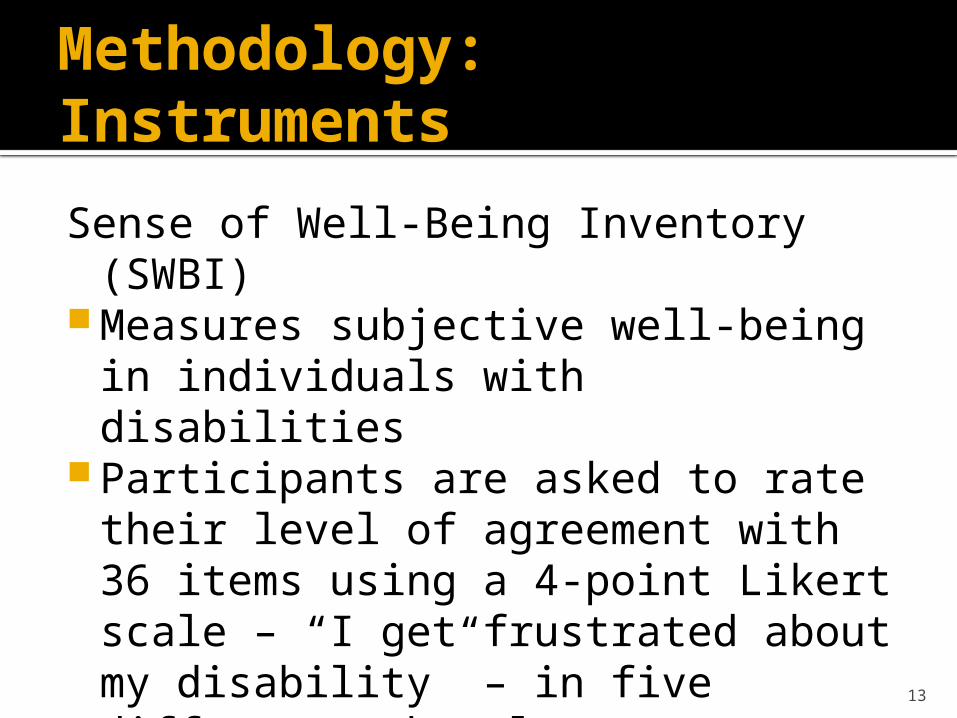
Sense of Well-Being Inventory (SWBI) Measures subjective well-being in
individuals with disabilities Participants are asked to rate their
level of agreement with 36 items using a 4-point Likert scale – “I get frustrated about my disability” – in five different subscales Physical , psychological, financial,
family and social, and medical
14
Methodology: Instruments
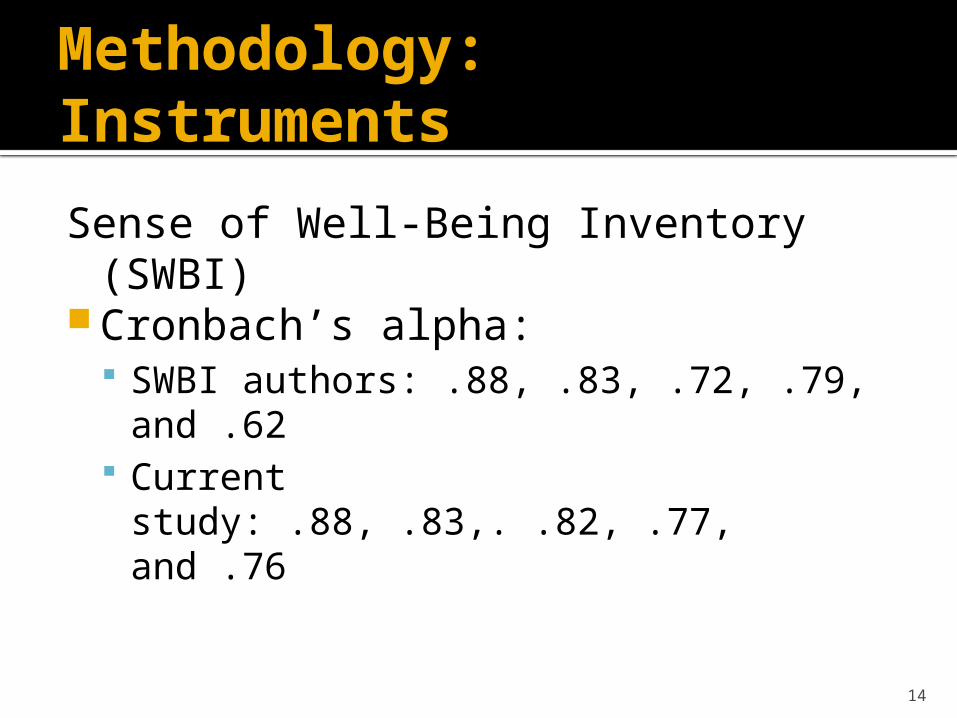
Sense of Well-Being Inventory (SWBI) Cronbach’s alpha:
SWBI authors: .88, .83, .72, .79, and .62 Current study: .88, .83,. .82, .77, and .76
15
Methodology: Recruitment
FSU IRB approval was obtained Participant recruitment occurred via
listserv and online forums used by adults with visual impairments (46) as well as an announcement placed in an online newsletter
The study was conducted through the use of an online survey, for which accessibility of screen reading programs was tested prior to distribution
16
Data Analysis
Bivariate correlations for all measures in the study were calculated using Pearson’s r values.
Hierarchical regression analysis was used to calculate the relationship of perceived social support and well-being variables (depression, life satisfaction, sense of well-being factors), controlling for demographic and disability variables (age, employment, visual acuity, visual field restriction, and age of disability onset),
17
Results: Bivariate
Overall, it is interesting to note that disability characteristics, such as visual acuity, were not significantly associated with levels of depression, life satisfaction, total sense of well-being, or social support.
Social support was significantly associated at the p<.001 level with all well-being variables in the predicted directions (negatively with depression, positively with life satisfaction and total sense of well-being)
18
Results: Depression Regression
CES-D Overall model was significant (R² = .25,
p<.001) Age – Significant negative association
(β=-.22, p<.01)▪ As age increased, depressive symptoms
decreased Social Supports - Significant negative
association (β=-.44, p<.001)▪ Lower levels of social support were associated
with higher levels of depressive symptoms
19
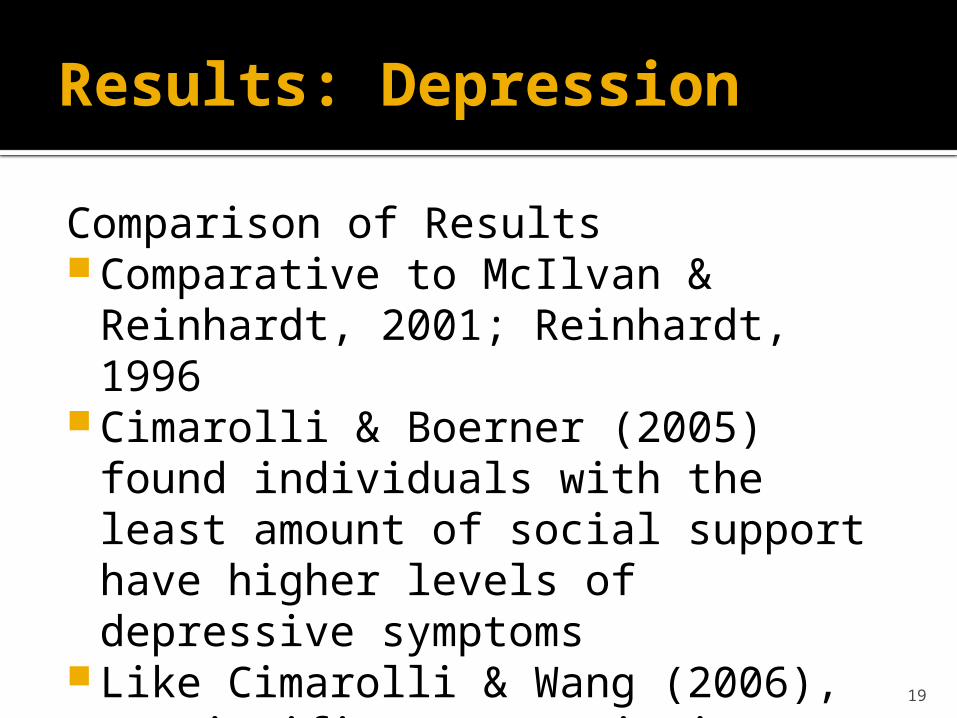
Results: Depression
Comparison of Results Comparative to McIlvan & Reinhardt,
2001; Reinhardt, 1996 Cimarolli & Boerner (2005) found
individuals with the least amount of social support have higher levels of depressive symptoms
Like Cimarolli & Wang (2006), no significant associations were found with employment
20
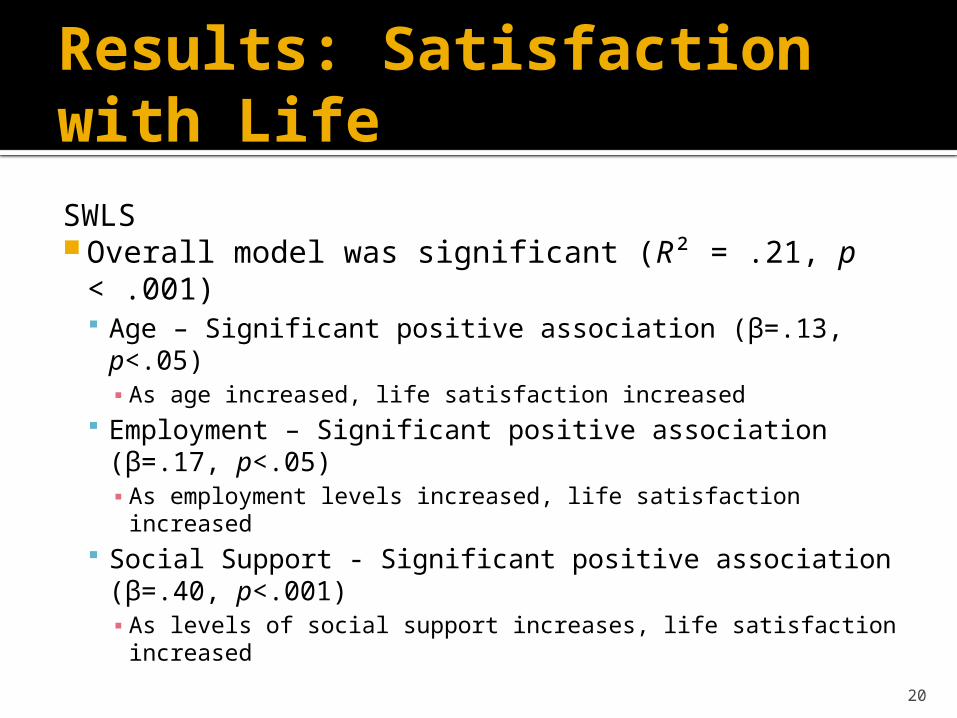
Results: Satisfaction with Life
SWLS Overall model was significant (R² = .21, p
< .001) Age – Significant positive association (β=.13, p<.05) ▪ As age increased, life satisfaction increased
Employment – Significant positive association (β=.17, p<.05)▪ As employment levels increased, life satisfaction increased
Social Support - Significant positive association (β=.40, p<.001)▪ As levels of social support increases, life satisfaction
increased
21
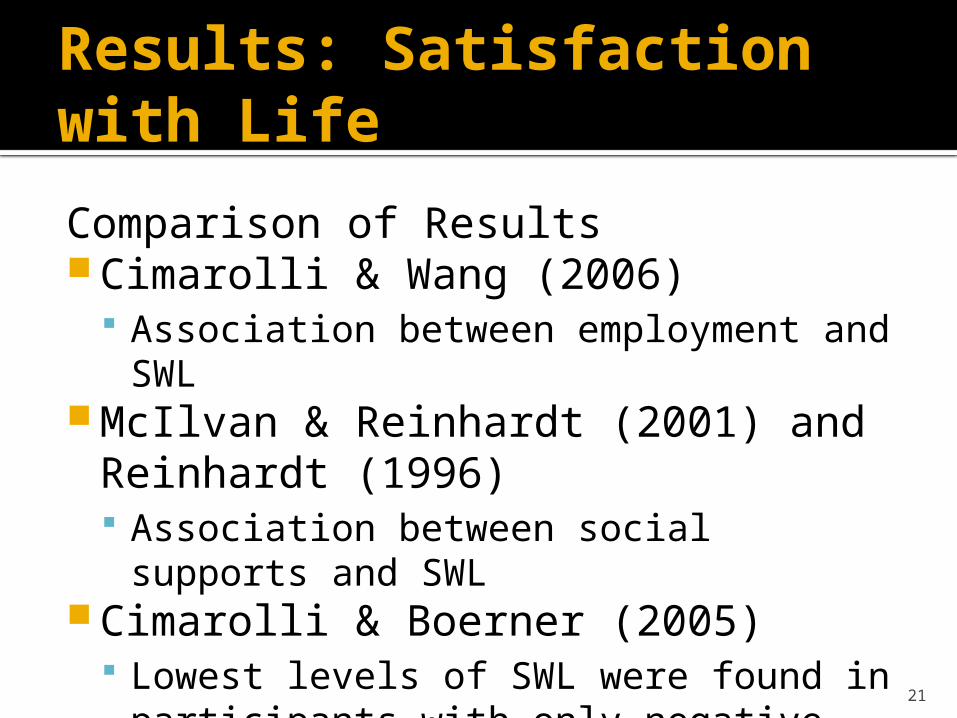
Results: Satisfaction with Life
Comparison of Results Cimarolli & Wang (2006)
Association between employment and SWL
McIlvan & Reinhardt (2001) and Reinhardt (1996) Association between social supports and
SWL Cimarolli & Boerner (2005)
Lowest levels of SWL were found in participants with only negative social support
22
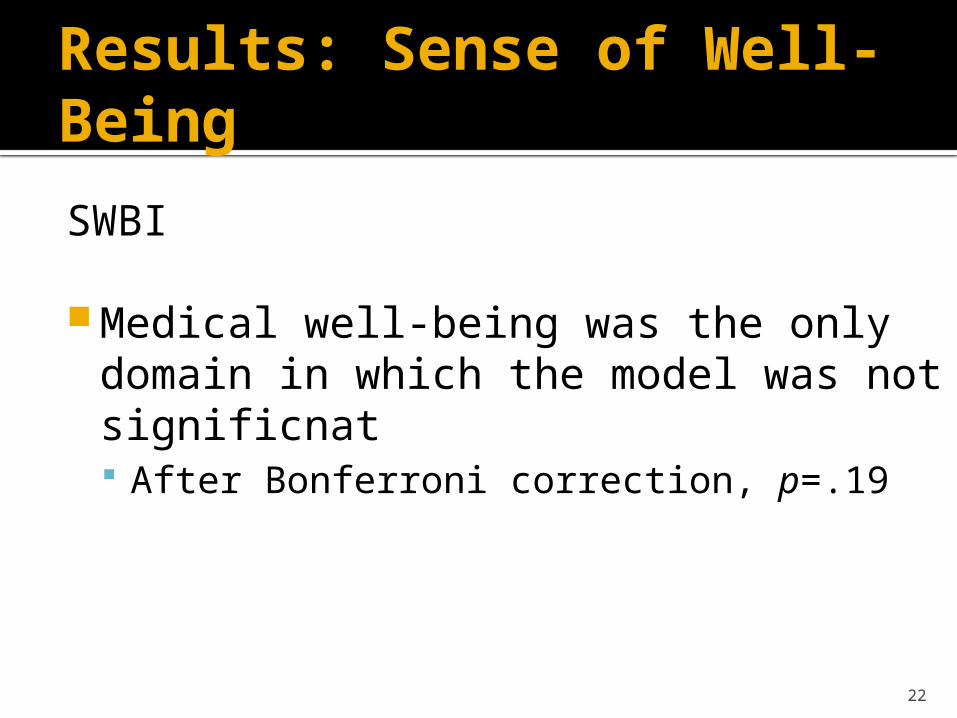
Results: Sense of Well-Being
SWBI
Medical well-being was the only domain in which the model was not significnat After Bonferroni correction, p=.19
23
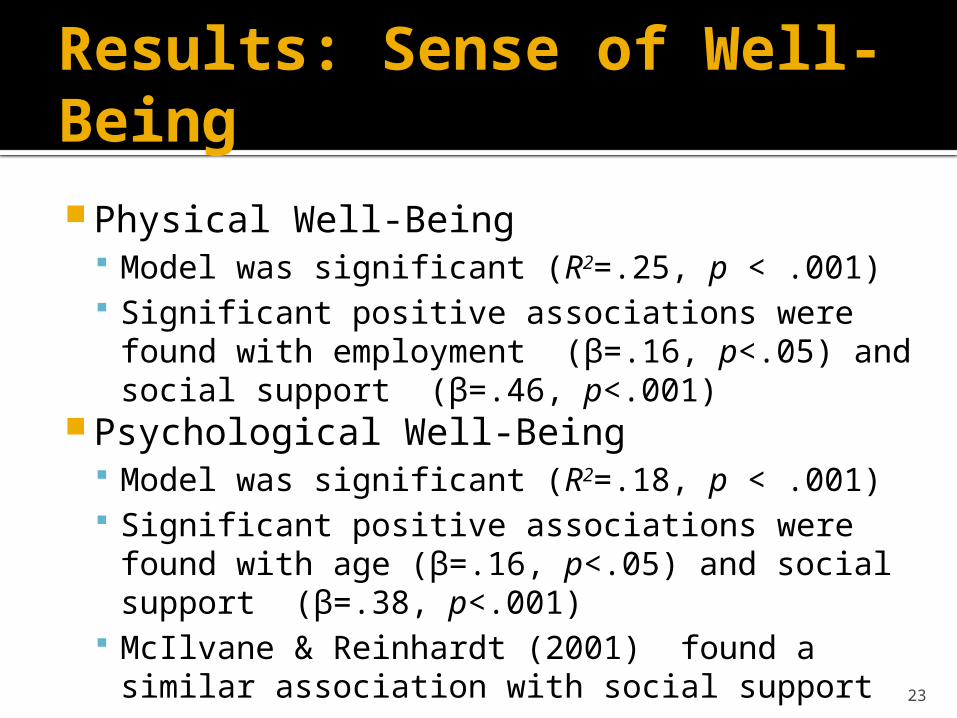
Results: Sense of Well-Being Physical Well-Being
Model was significant (R2=.25, p < .001) Significant positive associations were found
with employment (β=.16, p<.05) and social support (β=.46, p<.001)
Psychological Well-Being Model was significant (R2=.18, p < .001) Significant positive associations were found
with age (β=.16, p<.05) and social support (β=.38, p<.001)
McIlvane & Reinhardt (2001) found a similar association with social support
24
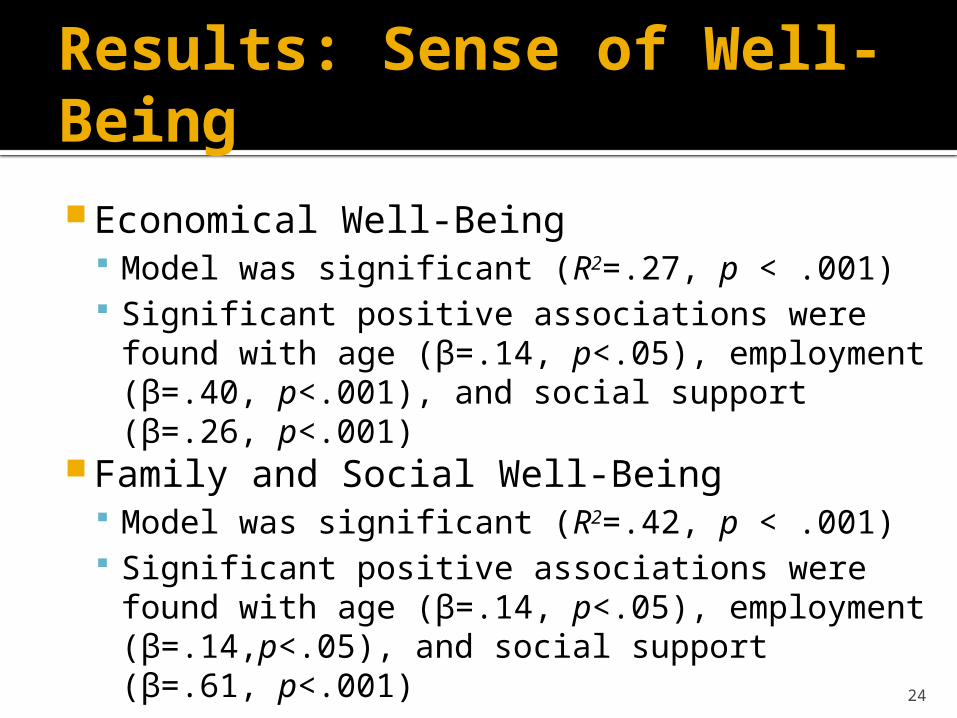
Results: Sense of Well-Being Economical Well-Being
Model was significant (R2=.27, p < .001) Significant positive associations were found
with age (β=.14, p<.05), employment (β=.40, p<.001), and social support (β=.26, p<.001)
Family and Social Well-Being Model was significant (R2=.42, p < .001) Significant positive associations were found
with age (β=.14, p<.05), employment (β=.14,p<.05), and social support (β=.61, p<.001)
25
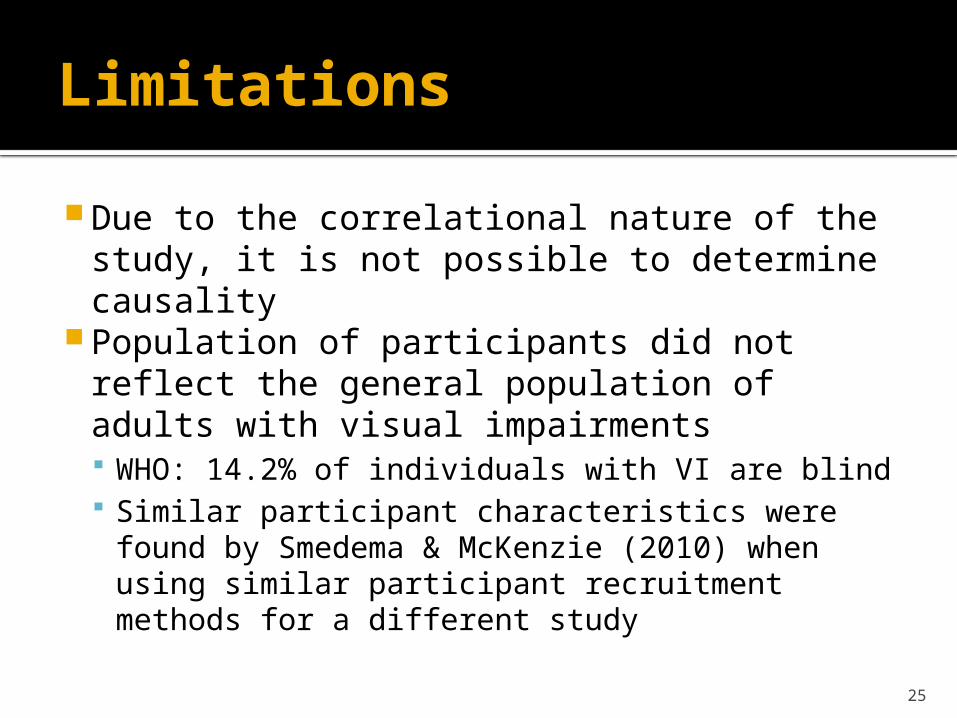
Limitations
Due to the correlational nature of the study, it is not possible to determine causality
Population of participants did not reflect the general population of adults with visual impairments WHO: 14.2% of individuals with VI are blind Similar participant characteristics were found
by Smedema & McKenzie (2010) when using similar participant recruitment methods for a different study
26
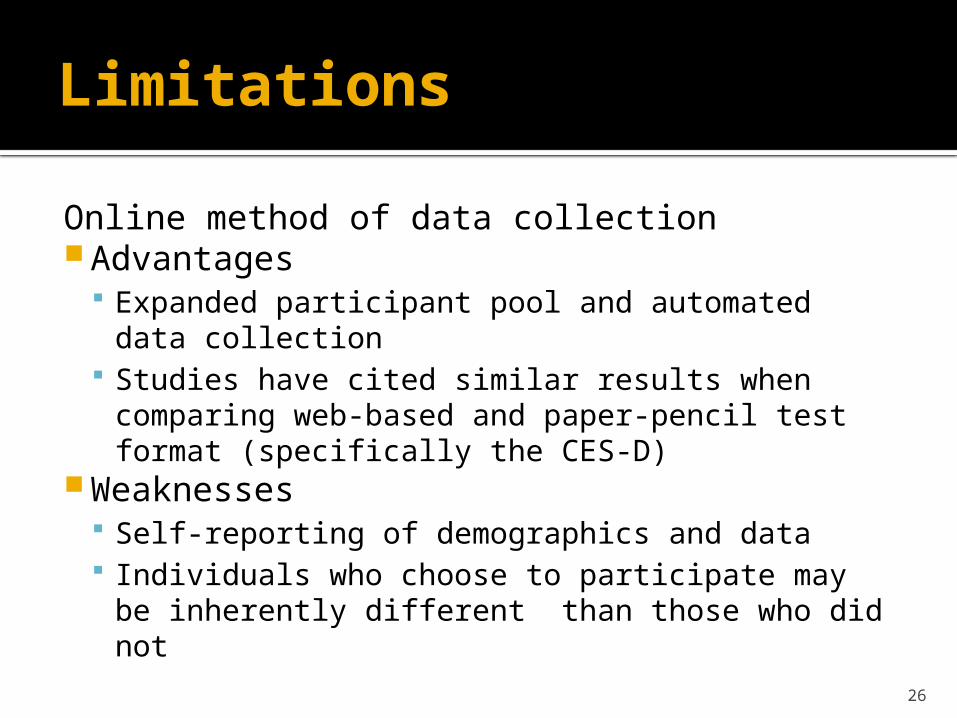
Limitations
Online method of data collection Advantages
Expanded participant pool and automated data collection
Studies have cited similar results when comparing web-based and paper-pencil test format (specifically the CES-D)
Weaknesses Self-reporting of demographics and data Individuals who choose to participate may be
inherently different than those who did not
27
Implications & Recommendations
Implications for Future Research Investigation of the relationship between
the number of individuals who are blind, e-mail/Internet use, and online studies
Inclusion of open-ended data collection to evaluation of the quality of social supports
Expand the population of participants in the study
Recruitment through non-Internet based resources
28
Implications & Recommendations
Implications for Practice
TVIs and O&M Specialists Working with Children
Focus on social skills instruction to ensure that adults have the skills to achieve adequate social support
29
Implications & Recommendations
Implications for Practice
VRTs and O&M Specialists Working with Adults
Focus on social skills training that assists in developing and improving interpersonal skills Assists in making and keeping friends
and romantic partners Ability to take advantage of resources
with in the community
30
Questions?