Embed Size (px)
Citation preview
United State Environmental Protection Agency Office of Emergency Management National Decontamination Team Erlanger, Kentucky 41018 October 2011
Aerial Radiological Surveys Poison Canyon Uranium Mines,
Cibola and McKinley Counties, NM
National Decontamination Team John Cardarelli II PhD CHP CIH PE Mark Thomas, PhD Timothy Curry MS Paul Kudarauskas, ALM
Dynamac Contract Support: Jeff Stapleton MS Robert Kroutil PhD Arrae, Inc. Contract Support: Ray Brindle
Beorn Leger Rich Rousseau
Aerial Radiological Surveys Poison Canyon Uranium Mines October 2011
ii
Table of Contents
Executive Summary ........................................................................................... iii
Acronyms and Abbreviations ........................................................................... iii
1.0 Introduction ................................................................................................... 1
2.0 Background and Survey Area Descriptions ............................................... 1
3.0 Flight Parameters .......................................................................................... 3
4.0 Data Analysis ................................................................................................ 5
5.0 Results ........................................................................................................... 9
5.1 Radiological Results ................................................................................................. 9 4.2 Photographic Results .............................................................................................. 20
Appendix I: Discussion about radiological uncertainties associated with
airborne systems. ............................................................................................. 27
Background radiation .................................................................................................... 27 Secular Equilibrium Assumption .................................................................................. 27 Atmospheric Temperature and Pressure ....................................................................... 27 Soil moisture and Precipitation ..................................................................................... 28 Topography and vegetation cover ................................................................................. 28 Spatial Considerations .................................................................................................. 28
Comparing ground samples and airborne measurements ............................................. 29 Geo-Spatial Accuracy ................................................................................................... 29
Appendix II: Uranium 238 decay series .......................................................... 31
Appendix III: Calibration Parameters .............................................................. 32
Appendix IV: Background Radiation ............................................................... 33
Appendix V: ASPECT Instrumentation ........................................................... 34
Survey Instrumentation ................................................................................................. 34
Radiation Detectors ....................................................................................................... 34 Chemical Sensors .......................................................................................................... 35
Camera .......................................................................................................................... 35
References ........................................................................................................ 37
Aerial Radiological Surveys Poison Canyon Uranium Mines October 2011
iii
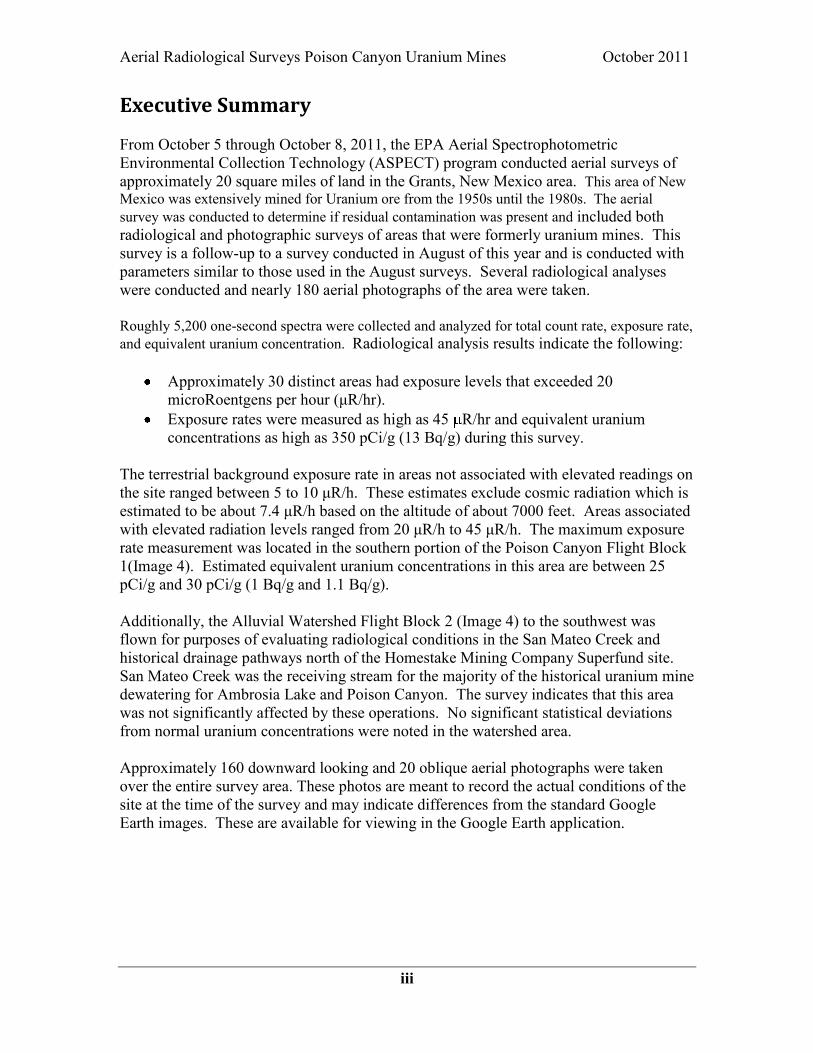
Executive Summary From October 5 through October 8, 2011, the EPA Aerial Spectrophotometric Environmental Collection Technology (ASPECT) program conducted aerial surveys of approximately 20 square miles of land in the Grants, New Mexico area. This area of New Mexico was extensively mined for Uranium ore from the 1950s until the 1980s. The aerial survey was conducted to determine if residual contamination was present and included both radiological and photographic surveys of areas that were formerly uranium mines. This survey is a follow-up to a survey conducted in August of this year and is conducted with parameters similar to those used in the August surveys. Several radiological analyses were conducted and nearly 180 aerial photographs of the area were taken. Roughly 5,200 one-second spectra were collected and analyzed for total count rate, exposure rate, and equivalent uranium concentration. Radiological analysis results indicate the following:
Approximately 30 distinct areas had exposure levels that exceeded 20 microRoentgens per hour (μR/hr).
Exposure rates were measured as high as 45 R/hr and equivalent uranium concentrations as high as 350 pCi/g (13 Bq/g) during this survey.
The terrestrial background exposure rate in areas not associated with elevated readings on the site ranged between 5 to 10 μR/h. These estimates exclude cosmic radiation which is estimated to be about 7.4 μR/h based on the altitude of about 7000 feet. Areas associated with elevated radiation levels ranged from 20 μR/h to 45 μR/h. The maximum exposure rate measurement was located in the southern portion of the Poison Canyon Flight Block 1(Image 4). Estimated equivalent uranium concentrations in this area are between 25 pCi/g and 30 pCi/g (1 Bq/g and 1.1 Bq/g). Additionally, the Alluvial Watershed Flight Block 2 (Image 4) to the southwest was flown for purposes of evaluating radiological conditions in the San Mateo Creek and historical drainage pathways north of the Homestake Mining Company Superfund site. San Mateo Creek was the receiving stream for the majority of the historical uranium mine dewatering for Ambrosia Lake and Poison Canyon. The survey indicates that this area was not significantly affected by these operations. No significant statistical deviations from normal uranium concentrations were noted in the watershed area. Approximately 160 downward looking and 20 oblique aerial photographs were taken over the entire survey area. These photos are meant to record the actual conditions of the site at the time of the survey and may indicate differences from the standard Google Earth images. These are available for viewing in the Google Earth application.
Aerial Radiological Surveys Poison Canyon Uranium Mines October 2011
iv
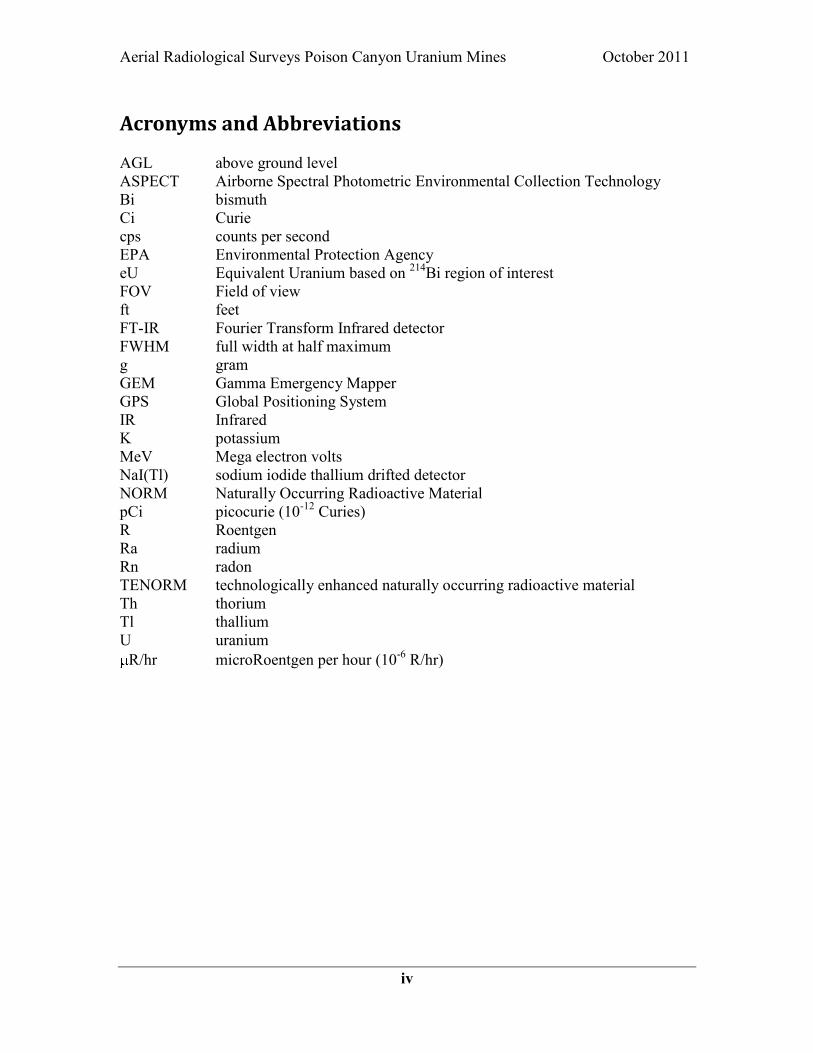
Acronyms and Abbreviations AGL above ground level ASPECT Airborne Spectral Photometric Environmental Collection Technology Bi bismuth Ci Curie cps counts per second EPA Environmental Protection Agency eU Equivalent Uranium based on 214Bi region of interest FOV Field of view ft feet FT-IR Fourier Transform Infrared detector FWHM full width at half maximum g gram GEM Gamma Emergency Mapper GPS Global Positioning System IR Infrared K potassium MeV Mega electron volts NaI(Tl) sodium iodide thallium drifted detector NORM Naturally Occurring Radioactive Material pCi picocurie (10-12 Curies) R Roentgen Ra radium Rn radon TENORM technologically enhanced naturally occurring radioactive material Th thorium Tl thallium U uranium
R/hr microRoentgen per hour (10-6 R/hr)
Aerial Radiological Surveys Poison Canyon Uranium Mines October 2011
Page 1 of 37
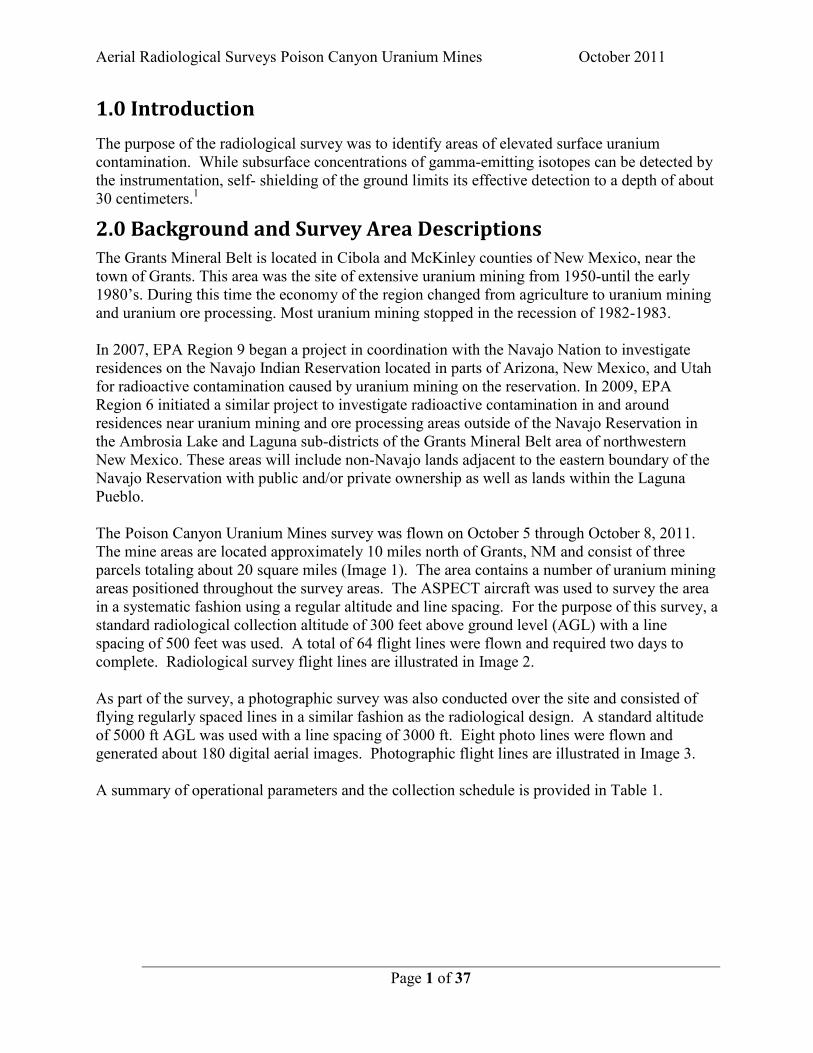
1.0 Introduction The purpose of the radiological survey was to identify areas of elevated surface uranium contamination. While subsurface concentrations of gamma-emitting isotopes can be detected by the instrumentation, self- shielding of the ground limits its effective detection to a depth of about 30 centimeters.1
2.0 Background and Survey Area Descriptions
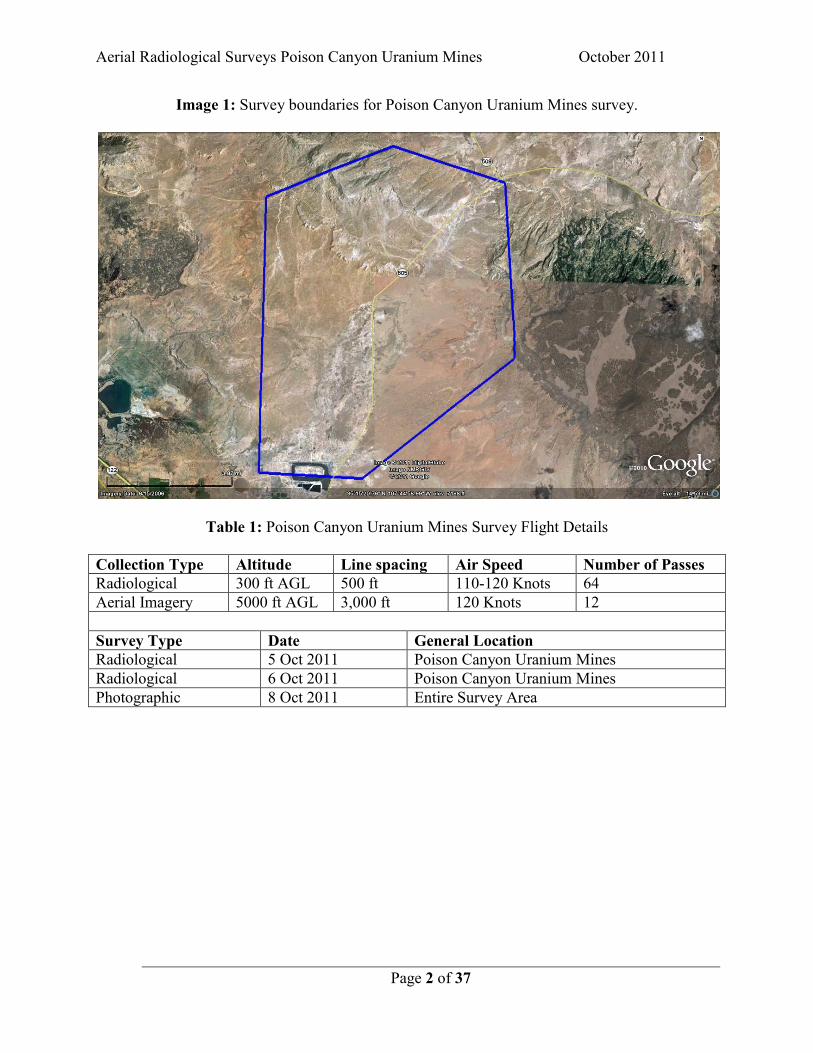
The Grants Mineral Belt is located in Cibola and McKinley counties of New Mexico, near the town of Grants. This area was the site of extensive uranium mining from 1950-until the early 1980’s. During this time the economy of the region changed from agriculture to uranium mining and uranium ore processing. Most uranium mining stopped in the recession of 1982-1983. In 2007, EPA Region 9 began a project in coordination with the Navajo Nation to investigate residences on the Navajo Indian Reservation located in parts of Arizona, New Mexico, and Utah for radioactive contamination caused by uranium mining on the reservation. In 2009, EPA Region 6 initiated a similar project to investigate radioactive contamination in and around residences near uranium mining and ore processing areas outside of the Navajo Reservation in the Ambrosia Lake and Laguna sub-districts of the Grants Mineral Belt area of northwestern New Mexico. These areas will include non-Navajo lands adjacent to the eastern boundary of the Navajo Reservation with public and/or private ownership as well as lands within the Laguna Pueblo. The Poison Canyon Uranium Mines survey was flown on October 5 through October 8, 2011. The mine areas are located approximately 10 miles north of Grants, NM and consist of three parcels totaling about 20 square miles (Image 1). The area contains a number of uranium mining areas positioned throughout the survey areas. The ASPECT aircraft was used to survey the area in a systematic fashion using a regular altitude and line spacing. For the purpose of this survey, a standard radiological collection altitude of 300 feet above ground level (AGL) with a line spacing of 500 feet was used. A total of 64 flight lines were flown and required two days to complete. Radiological survey flight lines are illustrated in Image 2. As part of the survey, a photographic survey was also conducted over the site and consisted of flying regularly spaced lines in a similar fashion as the radiological design. A standard altitude of 5000 ft AGL was used with a line spacing of 3000 ft. Eight photo lines were flown and generated about 180 digital aerial images. Photographic flight lines are illustrated in Image 3. A summary of operational parameters and the collection schedule is provided in Table 1.
Aerial Radiological Surveys Poison Canyon Uranium Mines October 2011
Page 2 of 37
Image 1: Survey boundaries for Poison Canyon Uranium Mines survey.
Table 1: Poison Canyon Uranium Mines Survey Flight Details
Collection Type Altitude Line spacing Air Speed Number of Passes Radiological 300 ft AGL 500 ft 110-120 Knots 64 Aerial Imagery 5000 ft AGL 3,000 ft 120 Knots 12
Survey Type Date General Location Radiological 5 Oct 2011 Poison Canyon Uranium Mines Radiological 6 Oct 2011 Poison Canyon Uranium Mines Photographic 8 Oct 2011 Entire Survey Area
Aerial Radiological Surveys Poison Canyon Uranium Mines October 2011
Page 3 of 37
3.0 Flight Parameters
The ASPECT aircraft used the following flight procedures for data collection on October 5 - 8, 2011:
Altitude above the ground level (AGL):
300 feet for radiological survey 5,000 feet for photography
Target Speed: 100 knots (115 mph) Line Spacing:
500 feet for radiological survey 3,000 feet for photographic survey
Data collection frequency: 1 per second for radiological survey
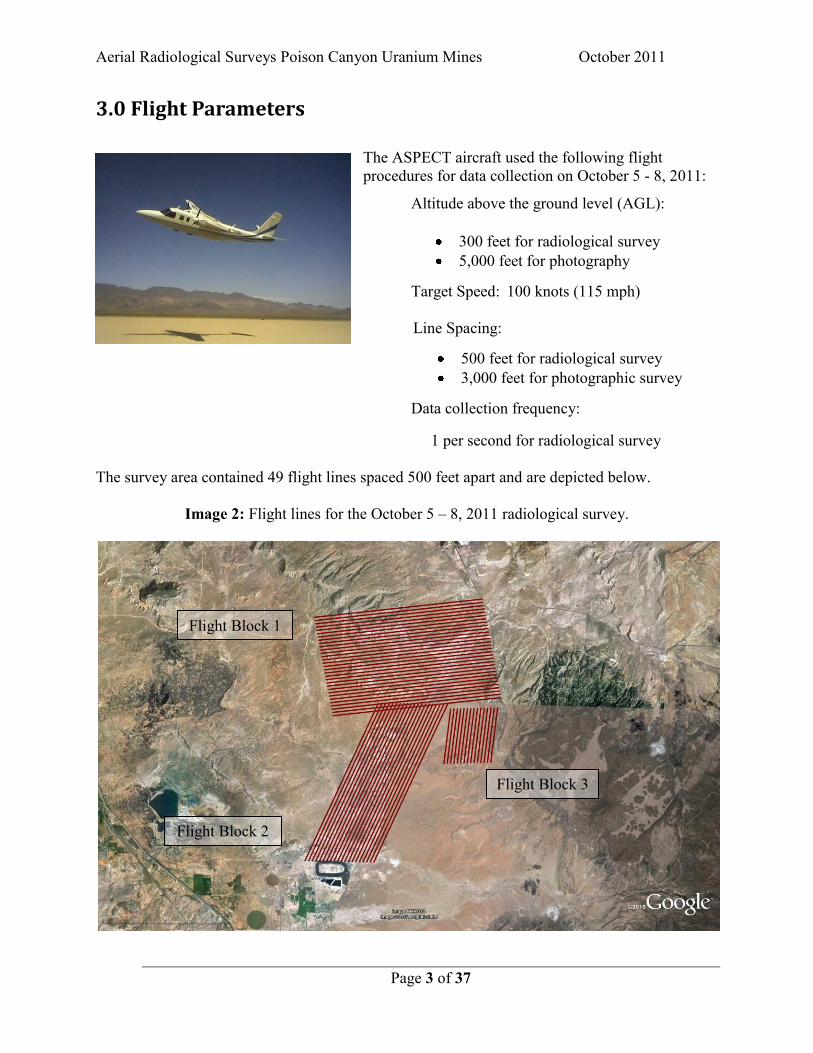
The survey area contained 49 flight lines spaced 500 feet apart and are depicted below.
Image 2: Flight lines for the October 5 – 8, 2011 radiological survey.
Flight Block 3
Flight Block 1
Flight Block 2
Aerial Radiological Surveys Poison Canyon Uranium Mines October 2011
Page 4 of 37
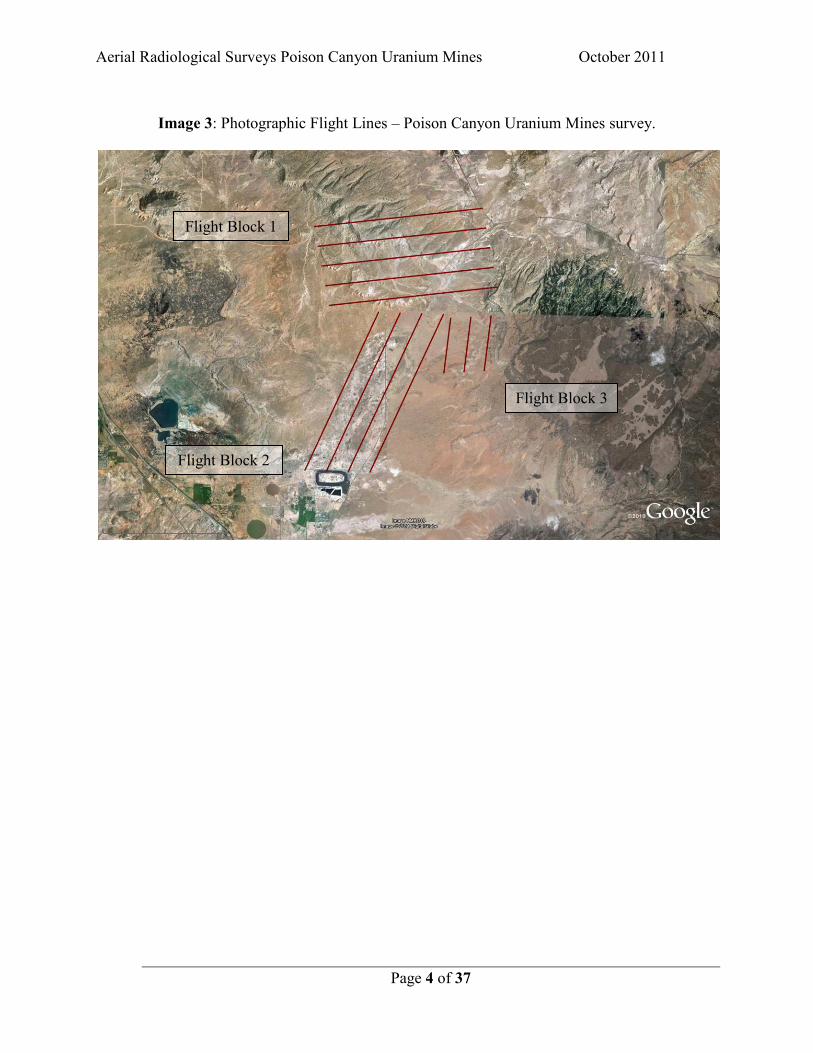
Image 3: Photographic Flight Lines – Poison Canyon Uranium Mines survey.
Flight Block 3
Flight Block 1
Flight Block 2
Aerial Radiological Surveys Poison Canyon Uranium Mines October 2011
Page 5 of 37
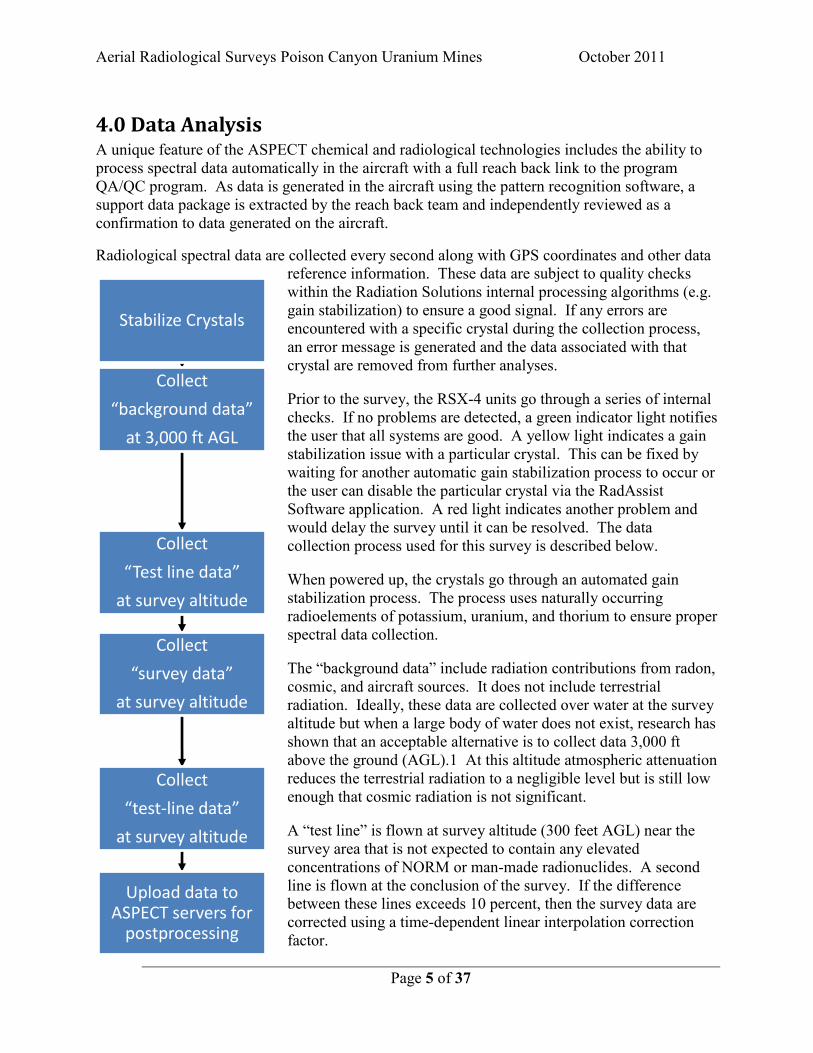
Stabilize Crystals
Collect
“background data”
at 3,000 ft AGL
Collect
“Test line data”
at survey altitude
Collect
“survey data”
at survey altitude
Collect
“test-line data”
at survey altitude
Upload data to ASPECT servers for
postprocessing
4.0 Data Analysis A unique feature of the ASPECT chemical and radiological technologies includes the ability to process spectral data automatically in the aircraft with a full reach back link to the program QA/QC program. As data is generated in the aircraft using the pattern recognition software, a support data package is extracted by the reach back team and independently reviewed as a confirmation to data generated on the aircraft. Radiological spectral data are collected every second along with GPS coordinates and other data
reference information. These data are subject to quality checks within the Radiation Solutions internal processing algorithms (e.g. gain stabilization) to ensure a good signal. If any errors are encountered with a specific crystal during the collection process, an error message is generated and the data associated with that crystal are removed from further analyses. Prior to the survey, the RSX-4 units go through a series of internal checks. If no problems are detected, a green indicator light notifies the user that all systems are good. A yellow light indicates a gain stabilization issue with a particular crystal. This can be fixed by waiting for another automatic gain stabilization process to occur or the user can disable the particular crystal via the RadAssist Software application. A red light indicates another problem and would delay the survey until it can be resolved. The data collection process used for this survey is described below. When powered up, the crystals go through an automated gain stabilization process. The process uses naturally occurring radioelements of potassium, uranium, and thorium to ensure proper spectral data collection. The “background data” include radiation contributions from radon, cosmic, and aircraft sources. It does not include terrestrial radiation. Ideally, these data are collected over water at the survey altitude but when a large body of water does not exist, research has shown that an acceptable alternative is to collect data 3,000 ft above the ground (AGL).1 At this altitude atmospheric attenuation reduces the terrestrial radiation to a negligible level but is still low enough that cosmic radiation is not significant. A “test line” is flown at survey altitude (300 feet AGL) near the survey area that is not expected to contain any elevated concentrations of NORM or man-made radionuclides. A second line is flown at the conclusion of the survey. If the difference between these lines exceeds 10 percent, then the survey data are corrected using a time-dependent linear interpolation correction factor.
Aerial Radiological Surveys Poison Canyon Uranium Mines October 2011
Page 6 of 37
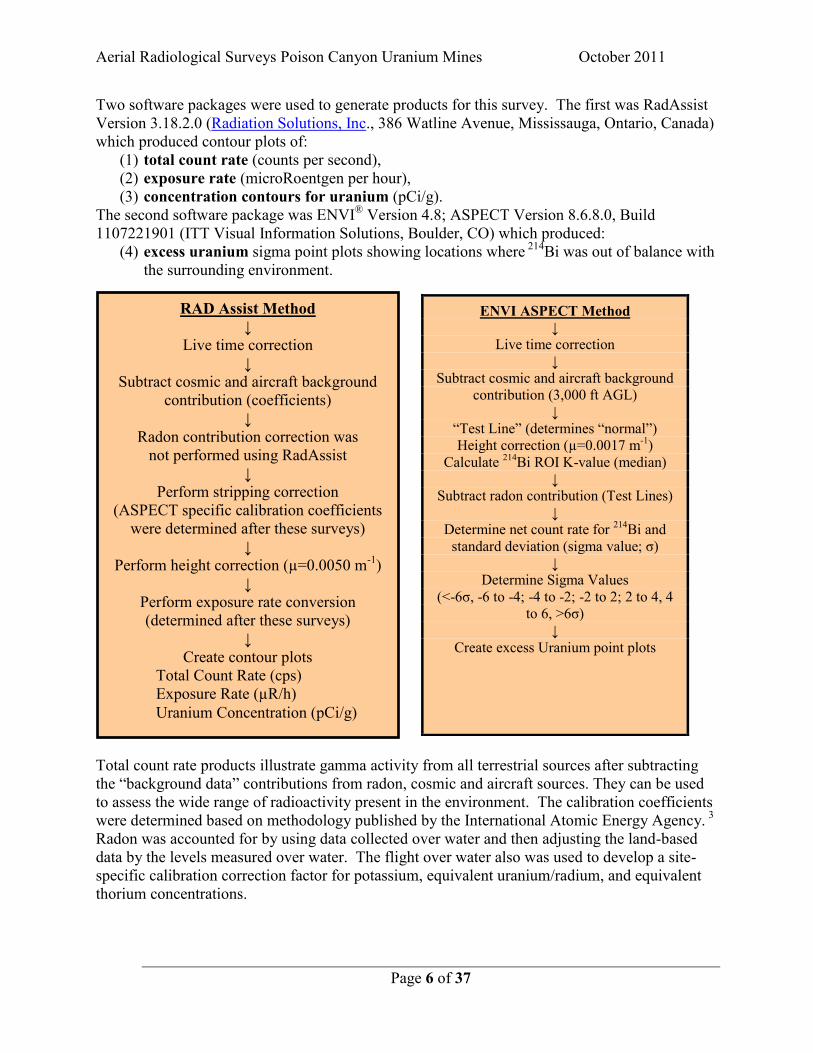
RAD Assist Method ↓
Live time correction ↓
Subtract cosmic and aircraft background contribution (coefficients)
↓ Radon contribution correction was
not performed using RadAssist ↓
Perform stripping correction (ASPECT specific calibration coefficients
were determined after these surveys) ↓
Perform height correction (µ=0.0050 m-1) ↓
Perform exposure rate conversion (determined after these surveys)
↓ Create contour plots
Total Count Rate (cps) Exposure Rate (µR/h) Uranium Concentration (pCi/g)
Two software packages were used to generate products for this survey. The first was RadAssist Version 3.18.2.0 (Radiation Solutions, Inc., 386 Watline Avenue, Mississauga, Ontario, Canada) which produced contour plots of:
(1) total count rate (counts per second), (2) exposure rate (microRoentgen per hour), (3) concentration contours for uranium (pCi/g).
The second software package was ENVI® Version 4.8; ASPECT Version 8.6.8.0, Build 1107221901 (ITT Visual Information Solutions, Boulder, CO) which produced:
(4) excess uranium sigma point plots showing locations where 214Bi was out of balance with the surrounding environment.
Total count rate products illustrate gamma activity from all terrestrial sources after subtracting the “background data” contributions from radon, cosmic and aircraft sources. They can be used to assess the wide range of radioactivity present in the environment. The calibration coefficients were determined based on methodology published by the International Atomic Energy Agency. 3 Radon was accounted for by using data collected over water and then adjusting the land-based data by the levels measured over water. The flight over water also was used to develop a site-specific calibration correction factor for potassium, equivalent uranium/radium, and equivalent thorium concentrations.
ENVI ASPECT Method ↓
Live time correction ↓
Subtract cosmic and aircraft background contribution (3,000 ft AGL)
↓ “Test Line” (determines “normal”) Height correction (µ=0.0017 m-1)
Calculate 214Bi ROI K-value (median) ↓
Subtract radon contribution (Test Lines) ↓
Determine net count rate for 214Bi and standard deviation (sigma value; σ)
↓ Determine Sigma Values
(<-6σ, -6 to -4; -4 to -2; -2 to 2; 2 to 4, 4 to 6, >6σ)
↓ Create excess Uranium point plots
Aerial Radiological Surveys Poison Canyon Uranium Mines October 2011
Page 7 of 37
K-value = Count rate in target region-of-interest _ Count rate in “Total Count” region-of-interest
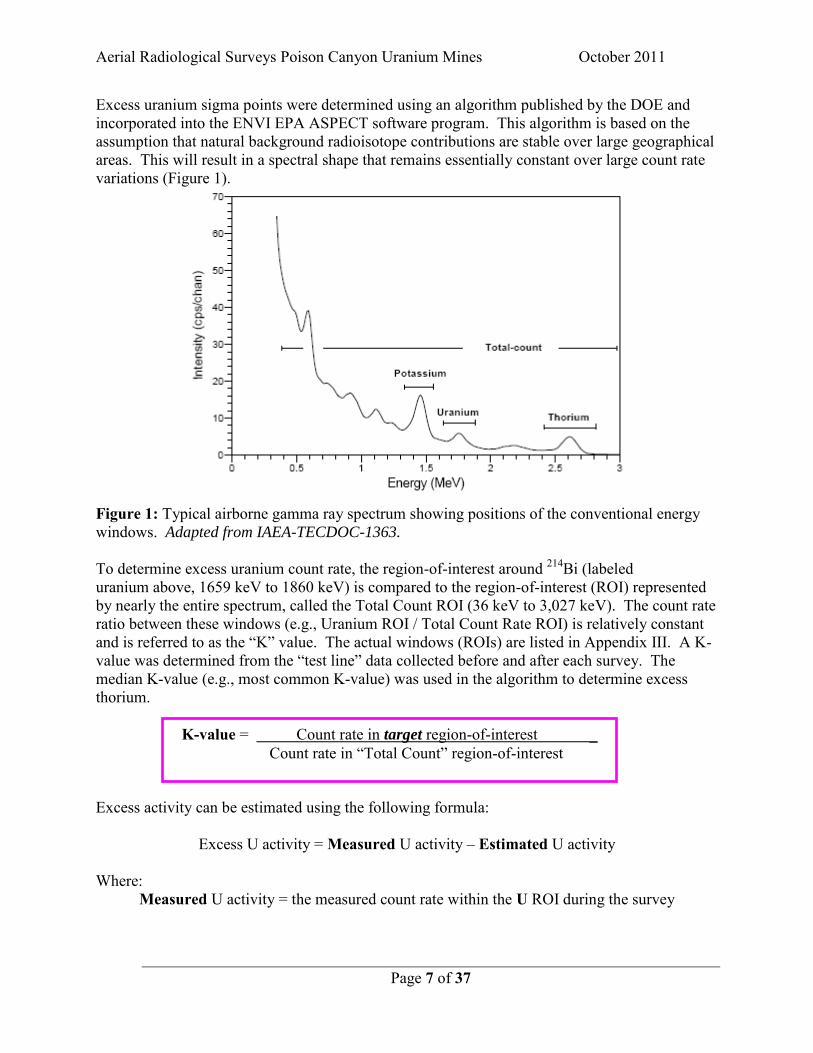
Excess uranium sigma points were determined using an algorithm published by the DOE and incorporated into the ENVI EPA ASPECT software program. This algorithm is based on the assumption that natural background radioisotope contributions are stable over large geographical areas. This will result in a spectral shape that remains essentially constant over large count rate variations (Figure 1).
Figure 1: Typical airborne gamma ray spectrum showing positions of the conventional energy windows. Adapted from IAEA-TECDOC-1363.
To determine excess uranium count rate, the region-of-interest around 214Bi (labeled uranium above, 1659 keV to 1860 keV) is compared to the region-of-interest (ROI) represented by nearly the entire spectrum, called the Total Count ROI (36 keV to 3,027 keV). The count rate ratio between these windows (e.g., Uranium ROI / Total Count Rate ROI) is relatively constant and is referred to as the “K” value. The actual windows (ROIs) are listed in Appendix III. A K-value was determined from the “test line” data collected before and after each survey. The median K-value (e.g., most common K-value) was used in the algorithm to determine excess thorium. Excess activity can be estimated using the following formula:
Excess U activity = Measured U activity – Estimated U activity Where:
Measured U activity = the measured count rate within the U ROI during the survey
Aerial Radiological Surveys Poison Canyon Uranium Mines October 2011
Page 8 of 37
EXCESS U = Measured U ROI – (K * Measured Total Counts ROI)
Estimated U activity = K-value * measured count rate in Total Count ROI during the survey The equation for excess activity becomes:
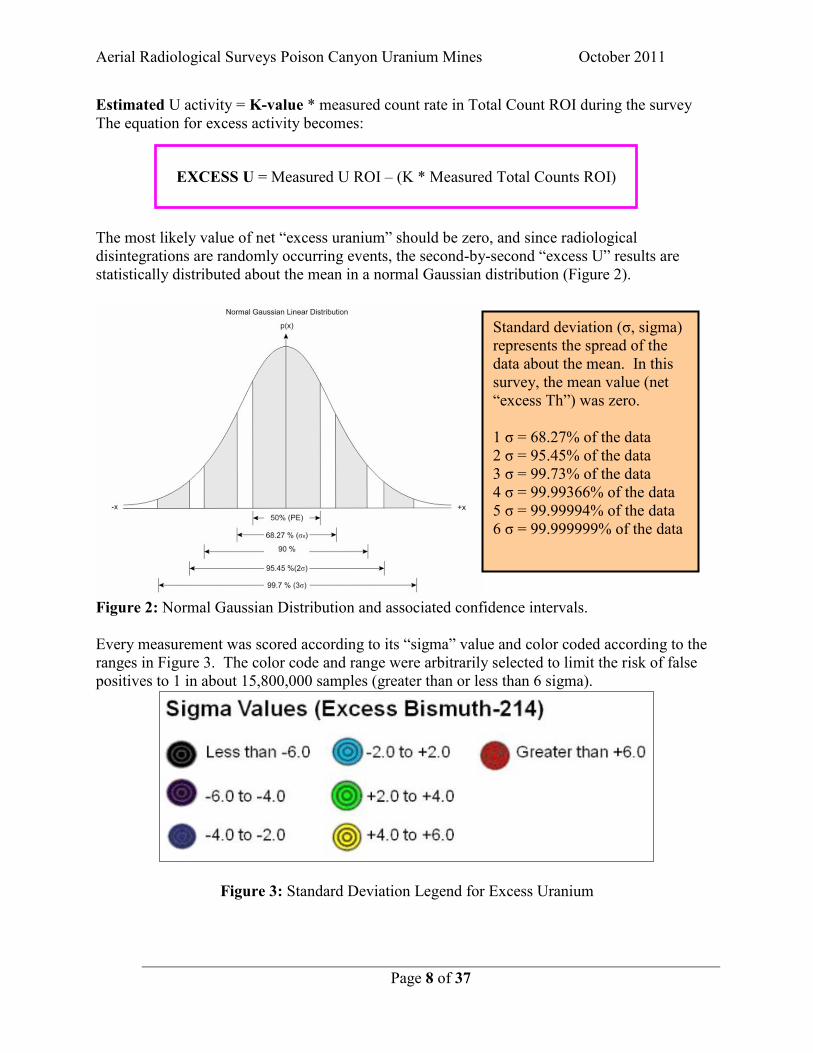
The most likely value of net “excess uranium” should be zero, and since radiological disintegrations are randomly occurring events, the second-by-second “excess U” results are statistically distributed about the mean in a normal Gaussian distribution (Figure 2).
Figure 2: Normal Gaussian Distribution and associated confidence intervals. Every measurement was scored according to its “sigma” value and color coded according to the ranges in Figure 3. The color code and range were arbitrarily selected to limit the risk of false positives to 1 in about 15,800,000 samples (greater than or less than 6 sigma).
Figure 3: Standard Deviation Legend for Excess Uranium
Standard deviation (σ, sigma) represents the spread of the data about the mean. In this survey, the mean value (net “excess Th”) was zero. 1 σ = 68.27% of the data 2 σ = 95.45% of the data 3 σ = 99.73% of the data 4 σ = 99.99366% of the data 5 σ = 99.99994% of the data 6 σ = 99.999999% of the data
Aerial Radiological Surveys Poison Canyon Uranium Mines October 2011
Page 9 of 37
5.0 Results
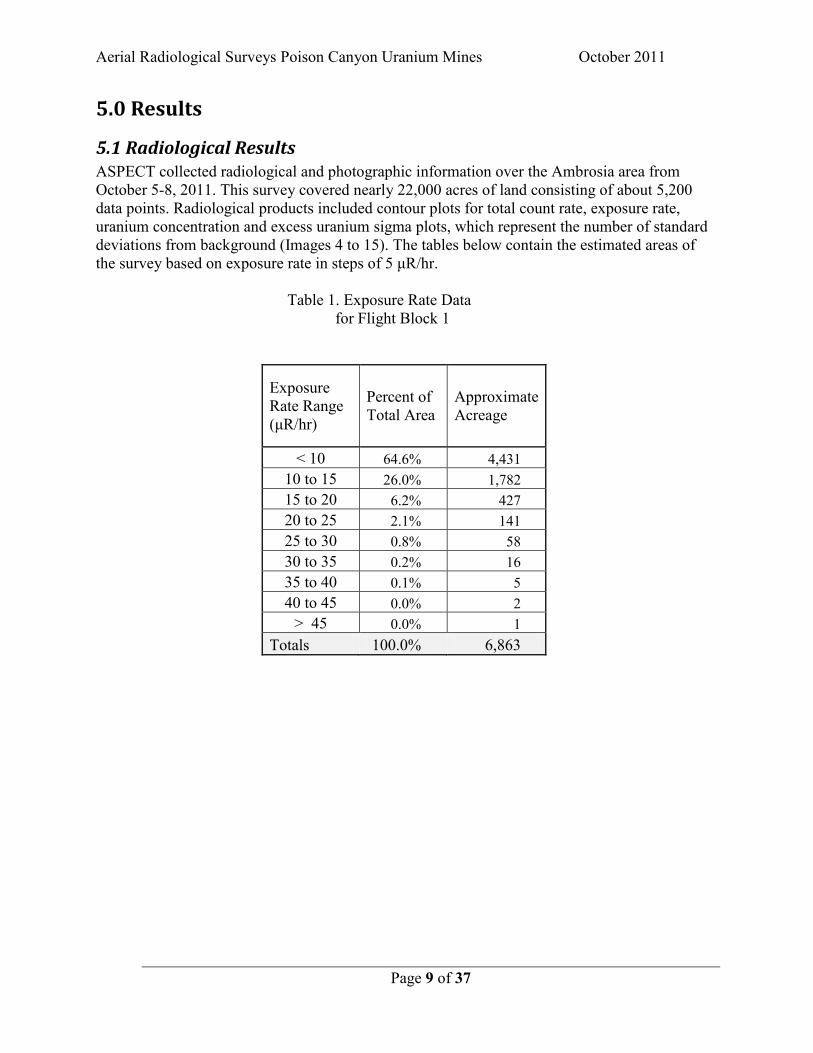
5.1 Radiological Results ASPECT collected radiological and photographic information over the Ambrosia area from October 5-8, 2011. This survey covered nearly 22,000 acres of land consisting of about 5,200 data points. Radiological products included contour plots for total count rate, exposure rate, uranium concentration and excess uranium sigma plots, which represent the number of standard deviations from background (Images 4 to 15). The tables below contain the estimated areas of the survey based on exposure rate in steps of 5 μR/hr.
Table 1. Exposure Rate Data for Flight Block 1
Exposure Rate Range (μR/hr)
Percent of Total Area
Approximate Acreage
< 10 64.6% 4,431 10 to 15 26.0% 1,782 15 to 20 6.2% 427 20 to 25 2.1% 141 25 to 30 0.8% 58 30 to 35 0.2% 16 35 to 40 0.1% 5 40 to 45 0.0% 2
> 45 0.0% 1 Totals 100.0% 6,863
Aerial Radiological Surveys Poison Canyon Uranium Mines October 2011
Page 10 of 37
Table 2. Exposure Rate Data for Flight Block 3
Exposure Rate Range (μR/hr)
Percent of Total Area
Approximate Acreage
< 10 72.1% 986 10 to 15 13.4% 183 15 to 20 6.4% 88 20 to 25 3.7% 51 25 to 30 3.1% 43 30 to 35 1.2% 17 35 to 40 0.0% 1 40 to 45 0.0% 0
> 45 0.0% 0 Totals 100.0% 1,368
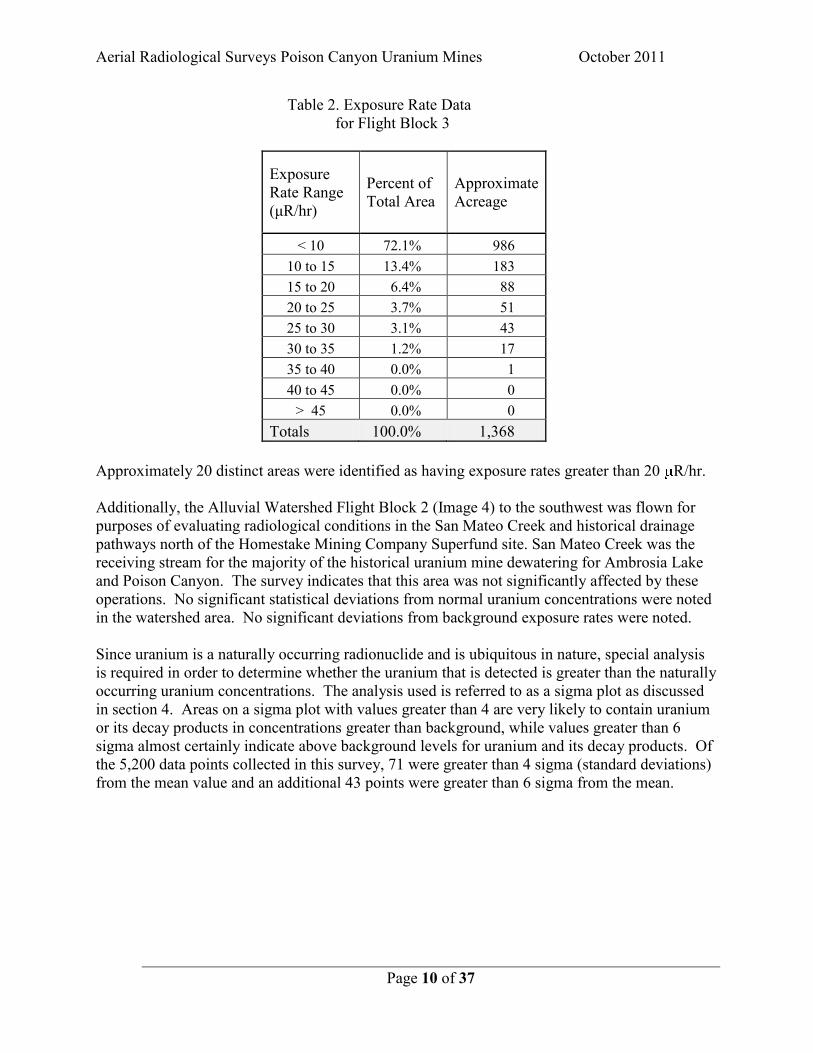
Approximately 20 distinct areas were identified as having exposure rates greater than 20 R/hr. Additionally, the Alluvial Watershed Flight Block 2 (Image 4) to the southwest was flown for purposes of evaluating radiological conditions in the San Mateo Creek and historical drainage pathways north of the Homestake Mining Company Superfund site. San Mateo Creek was the receiving stream for the majority of the historical uranium mine dewatering for Ambrosia Lake and Poison Canyon. The survey indicates that this area was not significantly affected by these operations. No significant statistical deviations from normal uranium concentrations were noted in the watershed area. No significant deviations from background exposure rates were noted. Since uranium is a naturally occurring radionuclide and is ubiquitous in nature, special analysis is required in order to determine whether the uranium that is detected is greater than the naturally occurring uranium concentrations. The analysis used is referred to as a sigma plot as discussed in section 4. Areas on a sigma plot with values greater than 4 are very likely to contain uranium or its decay products in concentrations greater than background, while values greater than 6 sigma almost certainly indicate above background levels for uranium and its decay products. Of the 5,200 data points collected in this survey, 71 were greater than 4 sigma (standard deviations) from the mean value and an additional 43 points were greater than 6 sigma from the mean.
Aerial Radiological Surveys Poison Canyon Uranium Mines October 2011
Page 11 of 37
This image should not be used independently to assess potential health risks. Additional information is necessary to make appropriate health-related decisions.
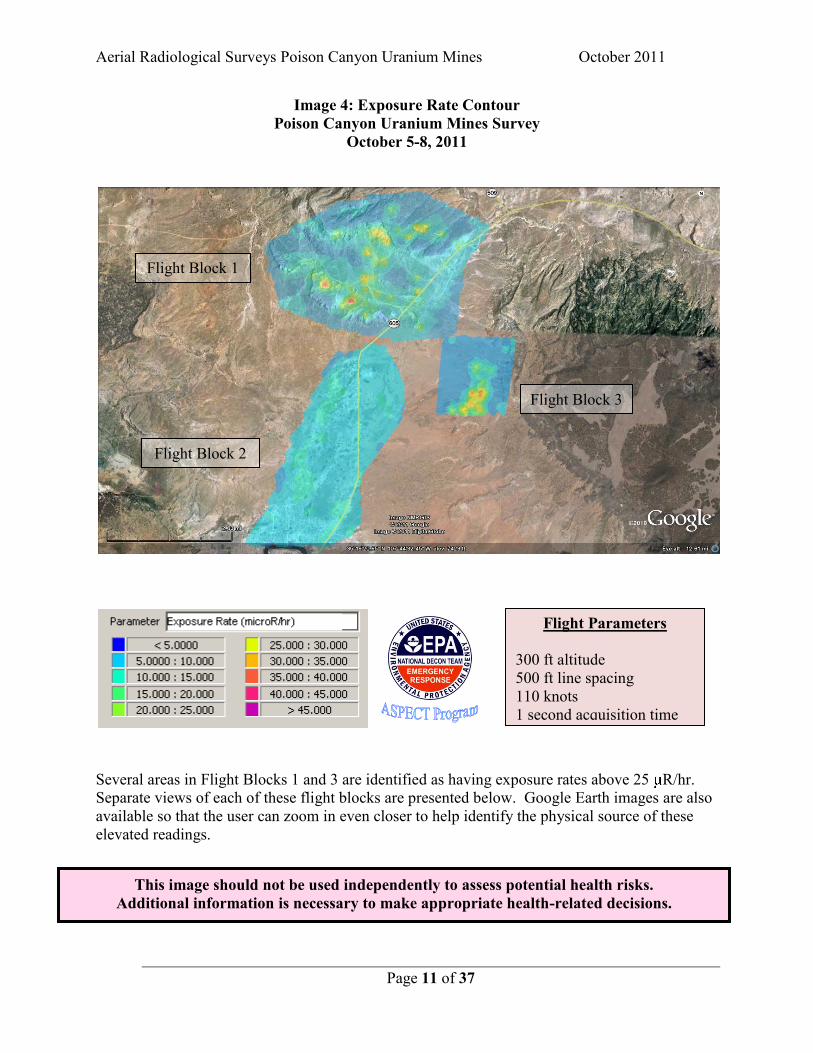
Image 4: Exposure Rate Contour Poison Canyon Uranium Mines Survey
October 5-8, 2011
Several areas in Flight Blocks 1 and 3 are identified as having exposure rates above 25 R/hr. Separate views of each of these flight blocks are presented below. Google Earth images are also available so that the user can zoom in even closer to help identify the physical source of these elevated readings.
Flight Parameters 300 ft altitude 500 ft line spacing 110 knots 1 second acquisition time
Flight Block 1
Flight Block 2
Flight Block 3
Aerial Radiological Surveys Poison Canyon Uranium Mines October 2011
Page 12 of 37
This image should not be used independently to assess potential health risks. Additional information is necessary to make appropriate health-related decisions.
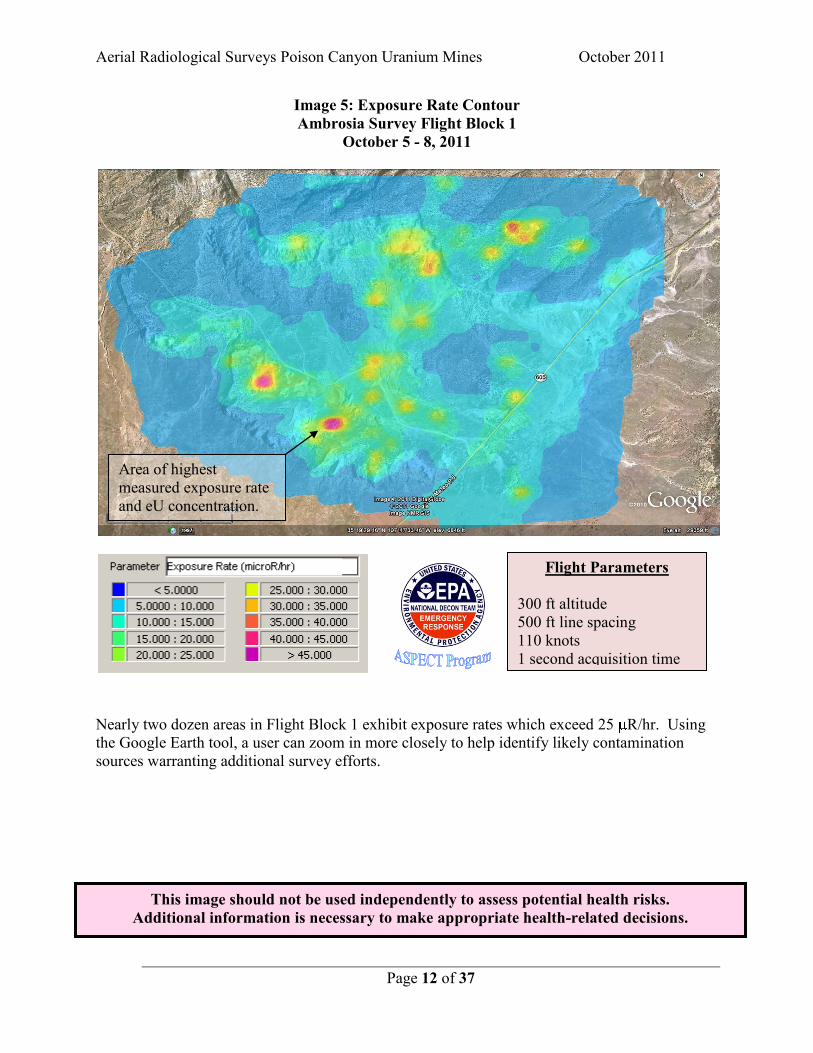
Image 5: Exposure Rate Contour Ambrosia Survey Flight Block 1
October 5 - 8, 2011
Nearly two dozen areas in Flight Block 1 exhibit exposure rates which exceed 25 R/hr. Using the Google Earth tool, a user can zoom in more closely to help identify likely contamination sources warranting additional survey efforts.
Flight Parameters 300 ft altitude 500 ft line spacing 110 knots 1 second acquisition time
Area of highest measured exposure rate and eU concentration.
Aerial Radiological Surveys Poison Canyon Uranium Mines October 2011
Page 13 of 37
This image should not be used independently to assess potential health risks. Additional information is necessary to make appropriate health-related decisions.
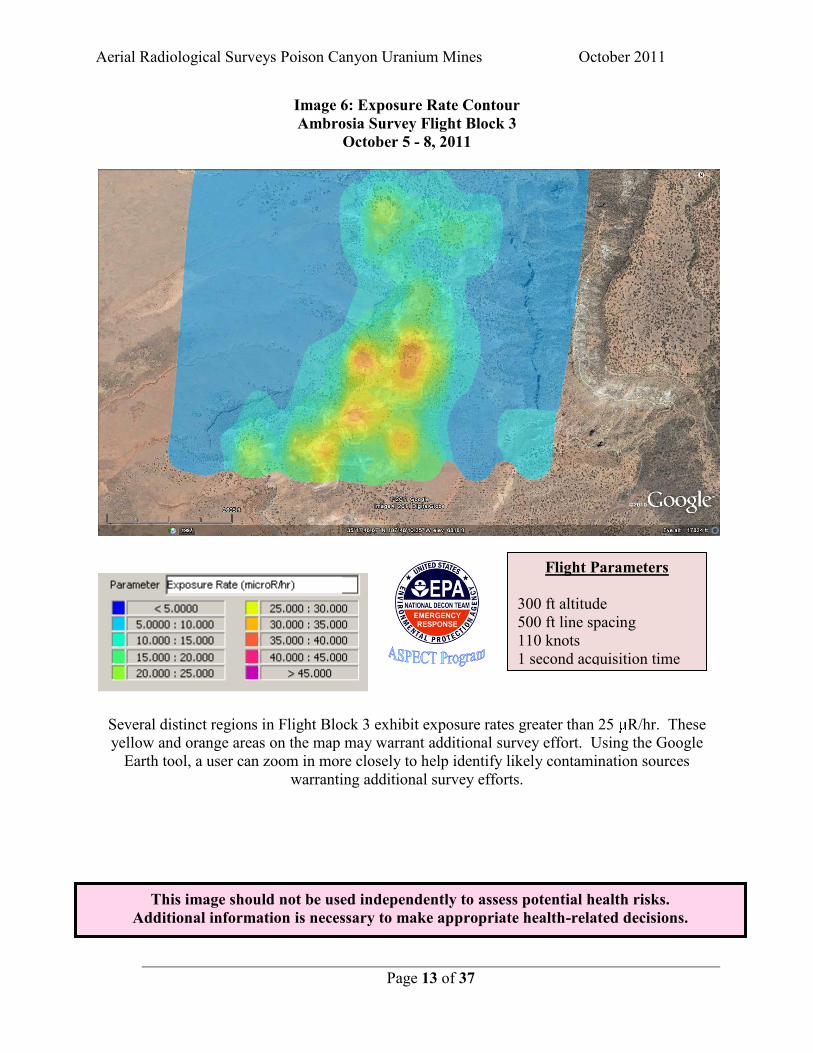
Image 6: Exposure Rate Contour Ambrosia Survey Flight Block 3
October 5 - 8, 2011
Several distinct regions in Flight Block 3 exhibit exposure rates greater than 25 R/hr. These yellow and orange areas on the map may warrant additional survey effort. Using the Google
Earth tool, a user can zoom in more closely to help identify likely contamination sources warranting additional survey efforts.
Flight Parameters 300 ft altitude 500 ft line spacing 110 knots 1 second acquisition time
Aerial Radiological Surveys Poison Canyon Uranium Mines October 2011
Page 14 of 37
This image should not be used independently to assess potential health risks. Additional information is necessary to make appropriate health-related decisions.
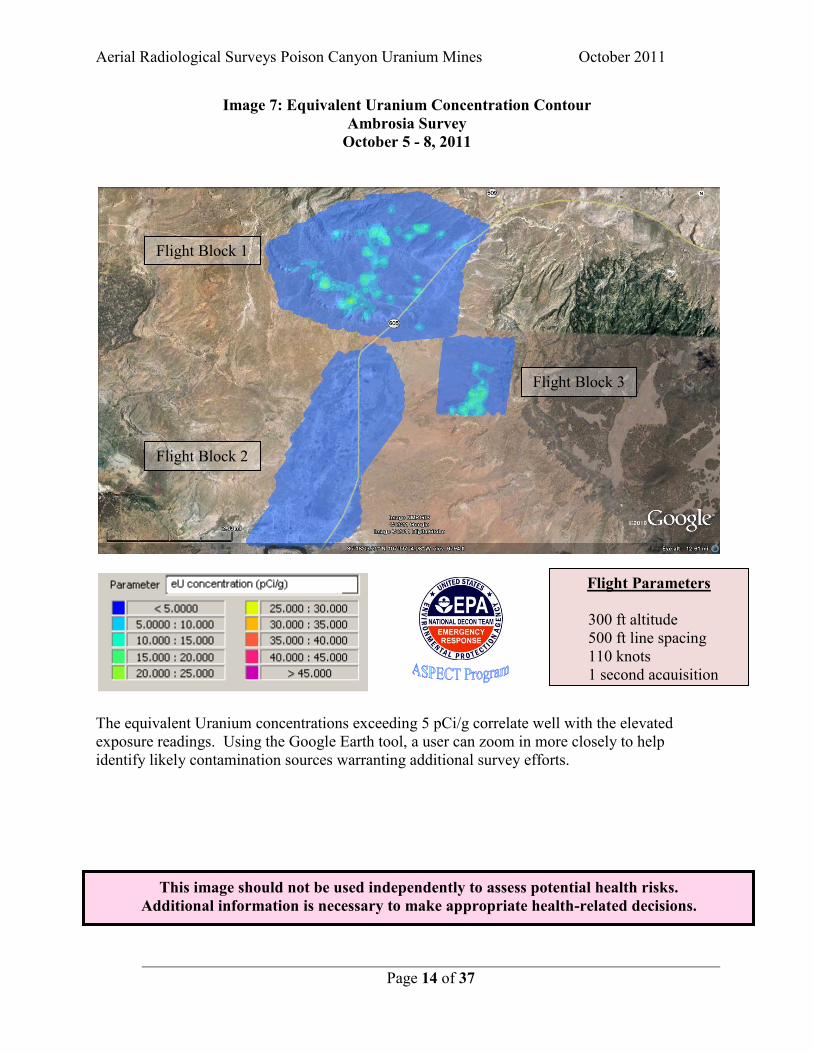
Image 7: Equivalent Uranium Concentration Contour Ambrosia Survey
October 5 - 8, 2011
The equivalent Uranium concentrations exceeding 5 pCi/g correlate well with the elevated exposure readings. Using the Google Earth tool, a user can zoom in more closely to help identify likely contamination sources warranting additional survey efforts.
Flight Parameters
300 ft altitude 500 ft line spacing 110 knots 1 second acquisition time
Flight Block 1
Flight Block 2
Flight Block 3
Aerial Radiological Surveys Poison Canyon Uranium Mines October 2011
Page 15 of 37
This image should not be used independently to assess potential health risks. Additional information is necessary to make appropriate health-related decisions.
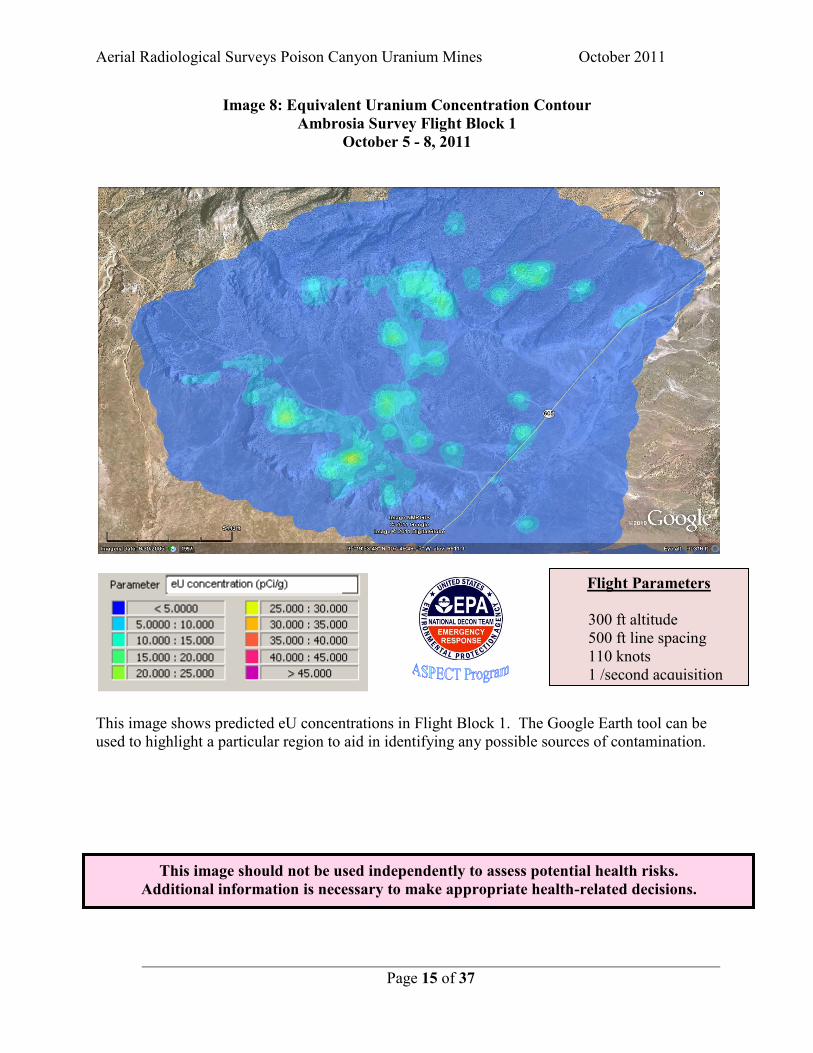
Image 8: Equivalent Uranium Concentration Contour Ambrosia Survey Flight Block 1
October 5 - 8, 2011
This image shows predicted eU concentrations in Flight Block 1. The Google Earth tool can be used to highlight a particular region to aid in identifying any possible sources of contamination.
Flight Parameters
300 ft altitude 500 ft line spacing 110 knots 1 /second acquisition time
Aerial Radiological Surveys Poison Canyon Uranium Mines October 2011
Page 16 of 37
This image should not be used independently to assess potential health risks. Additional information is necessary to make appropriate health-related decisions.
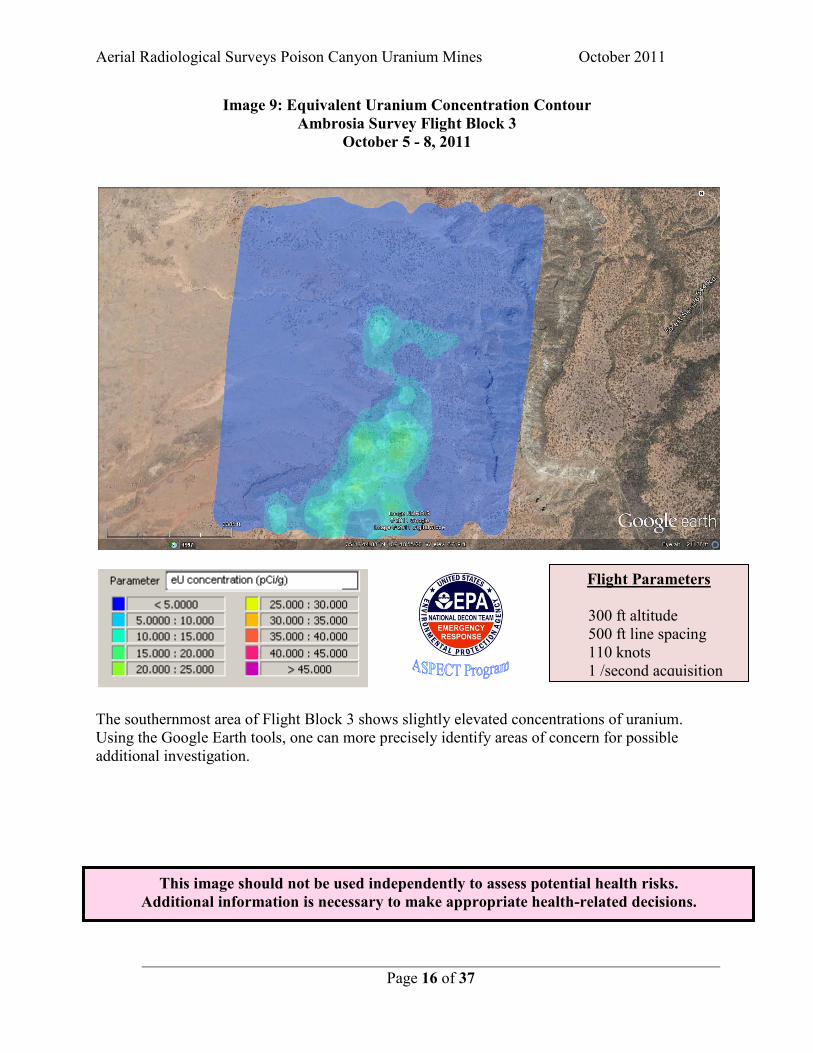
Image 9: Equivalent Uranium Concentration Contour Ambrosia Survey Flight Block 3
October 5 - 8, 2011
The southernmost area of Flight Block 3 shows slightly elevated concentrations of uranium. Using the Google Earth tools, one can more precisely identify areas of concern for possible additional investigation.
Flight Parameters
300 ft altitude 500 ft line spacing 110 knots 1 /second acquisition time
Aerial Radiological Surveys Poison Canyon Uranium Mines October 2011
Page 17 of 37
This image should not be used independently to assess potential health risks. Additional information is necessary to make appropriate health-related decisions.
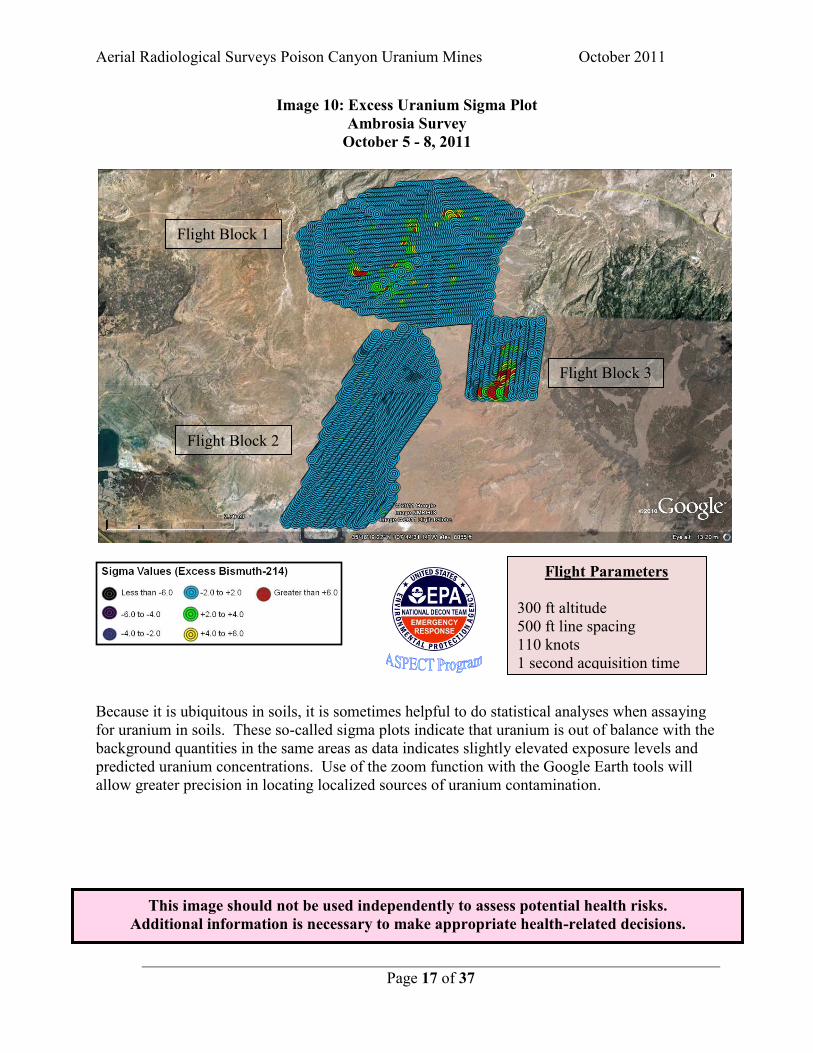
Image 10: Excess Uranium Sigma Plot Ambrosia Survey
October 5 - 8, 2011
Because it is ubiquitous in soils, it is sometimes helpful to do statistical analyses when assaying for uranium in soils. These so-called sigma plots indicate that uranium is out of balance with the background quantities in the same areas as data indicates slightly elevated exposure levels and predicted uranium concentrations. Use of the zoom function with the Google Earth tools will allow greater precision in locating localized sources of uranium contamination.
Flight Parameters 300 ft altitude 500 ft line spacing 110 knots 1 second acquisition time
Flight Block 1
Flight Block 2
Flight Block 3
Aerial Radiological Surveys Poison Canyon Uranium Mines October 2011
Page 18 of 37
This image should not be used independently to assess potential health risks. Additional information is necessary to make appropriate health-related decisions.
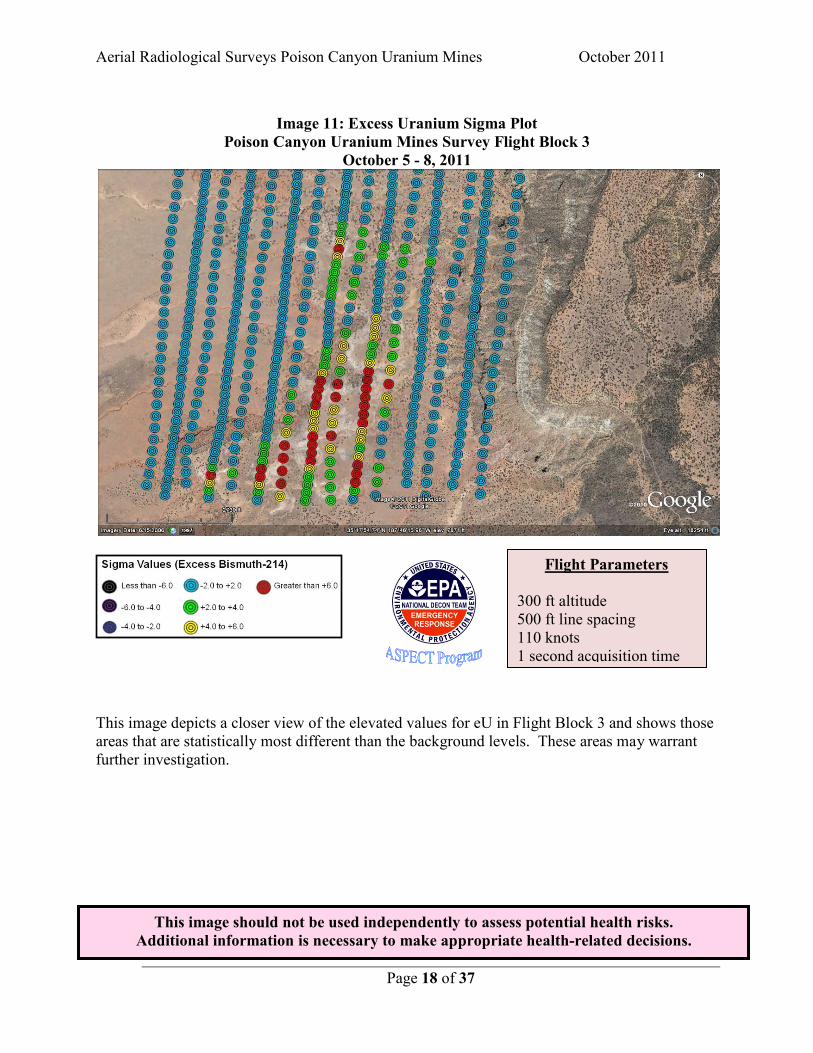
Image 11: Excess Uranium Sigma Plot
Poison Canyon Uranium Mines Survey Flight Block 3 October 5 - 8, 2011
This image depicts a closer view of the elevated values for eU in Flight Block 3 and shows those areas that are statistically most different than the background levels. These areas may warrant further investigation.
Flight Parameters 300 ft altitude 500 ft line spacing 110 knots 1 second acquisition time
Aerial Radiological Surveys Poison Canyon Uranium Mines October 2011
Page 19 of 37
This image should not be used independently to assess potential health risks. Additional information is necessary to make appropriate health-related decisions.
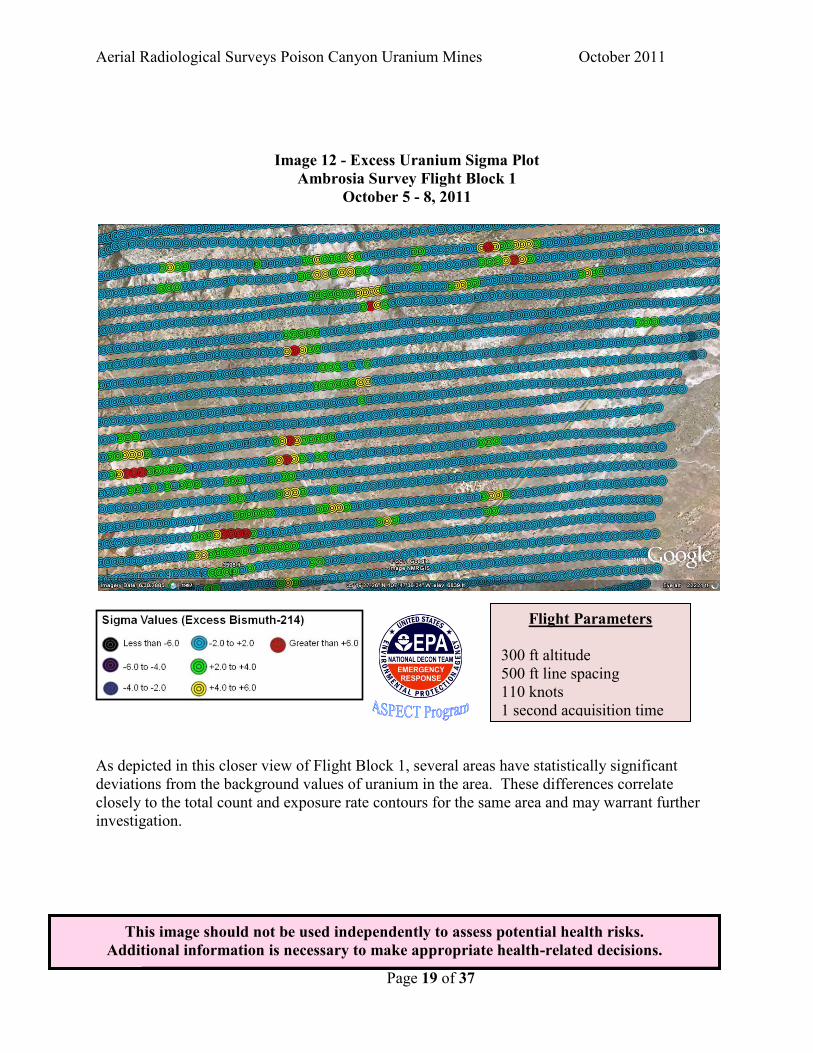
Image 12 - Excess Uranium Sigma Plot Ambrosia Survey Flight Block 1
October 5 - 8, 2011
As depicted in this closer view of Flight Block 1, several areas have statistically significant deviations from the background values of uranium in the area. These differences correlate closely to the total count and exposure rate contours for the same area and may warrant further investigation.
Flight Parameters 300 ft altitude 500 ft line spacing 110 knots 1 second acquisition time
Aerial Radiological Surveys Poison Canyon Uranium Mines October 2011
Page 20 of 37
This image should not be used independently to assess potential health risks. Additional information is necessary to make appropriate health-related decisions.
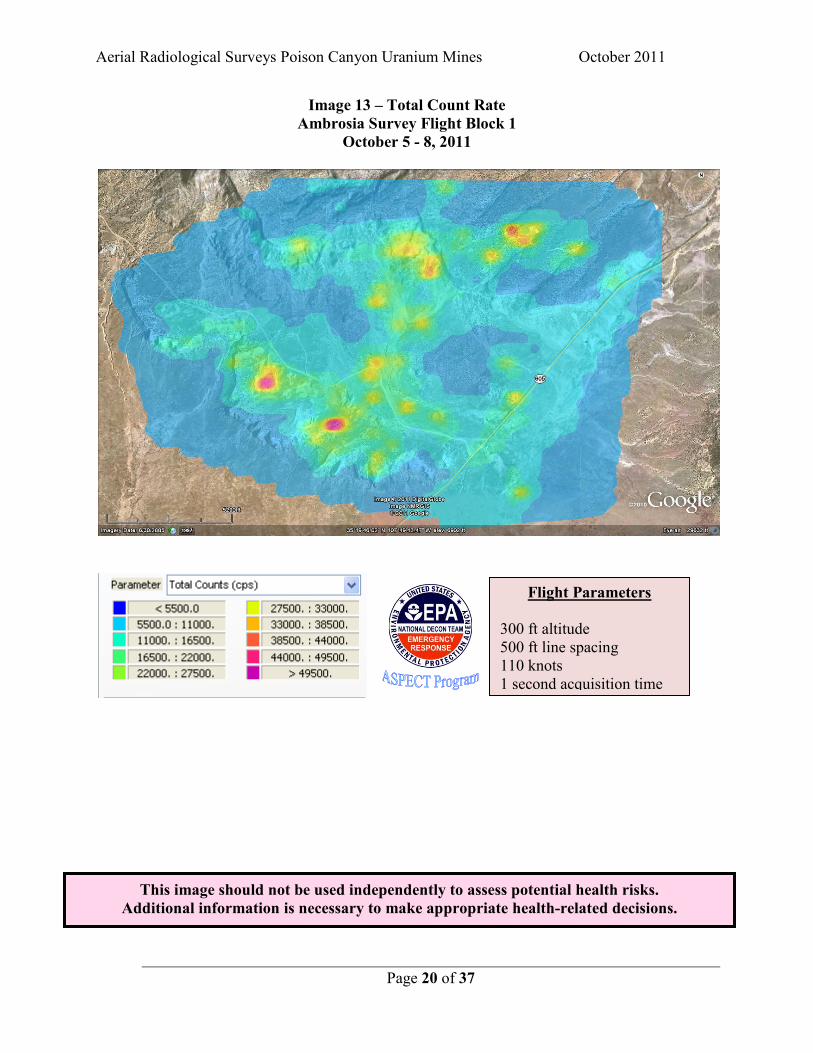
Image 13 – Total Count Rate Ambrosia Survey Flight Block 1
October 5 - 8, 2011
Flight Parameters 300 ft altitude 500 ft line spacing 110 knots 1 second acquisition time
Aerial Radiological Surveys Poison Canyon Uranium Mines October 2011
Page 21 of 37
This image should not be used independently to assess potential health risks. Additional information is necessary to make appropriate health-related decisions.
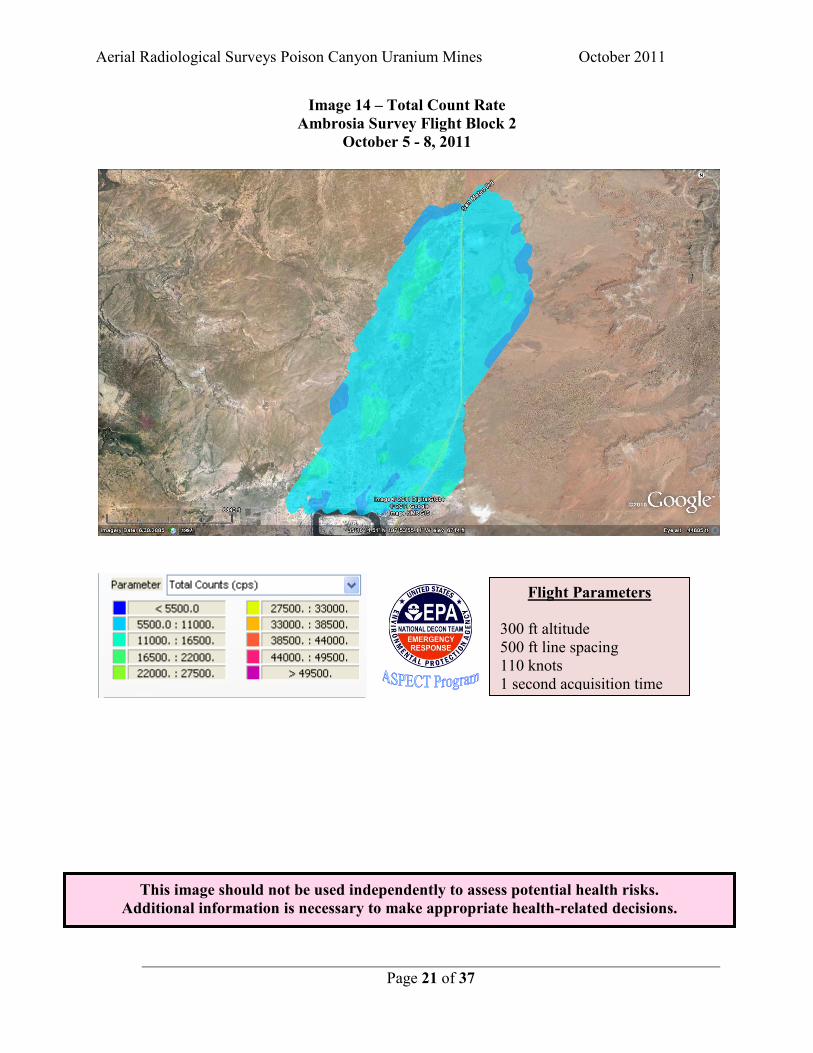
Image 14 – Total Count Rate Ambrosia Survey Flight Block 2
October 5 - 8, 2011
Flight Parameters 300 ft altitude 500 ft line spacing 110 knots 1 second acquisition time
Aerial Radiological Surveys Poison Canyon Uranium Mines October 2011
Page 22 of 37
This image should not be used independently to assess potential health risks. Additional information is necessary to make appropriate health-related decisions.
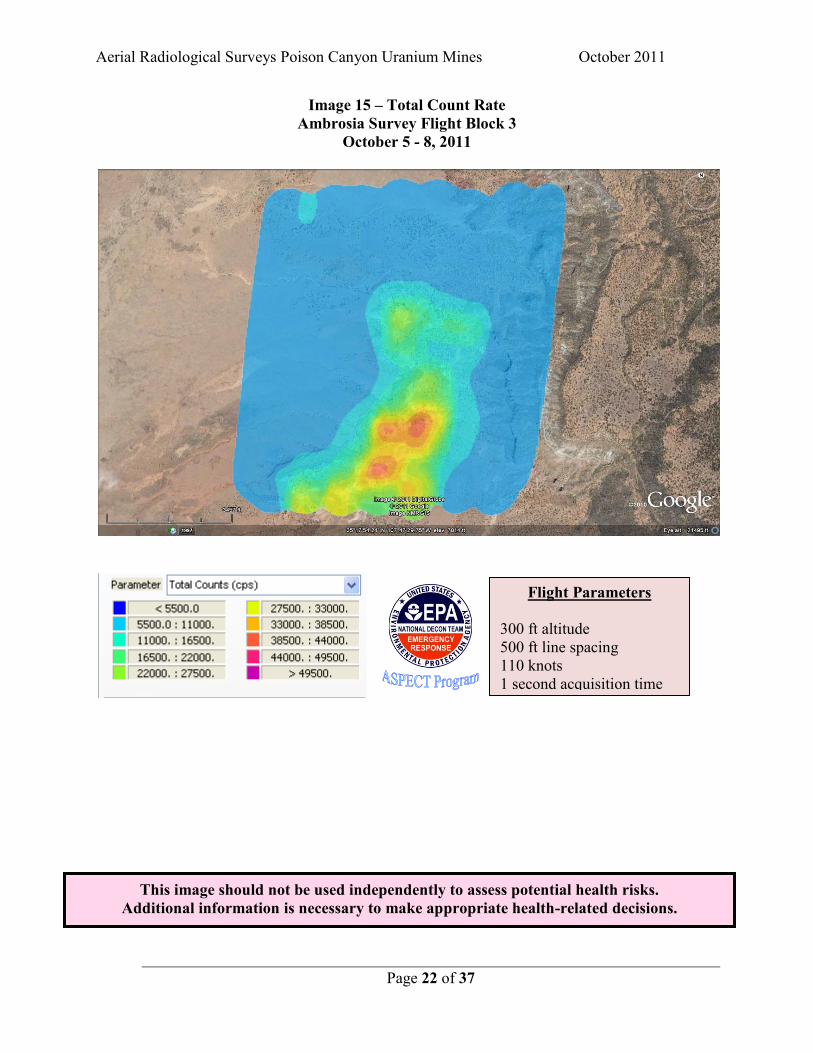
Image 15 – Total Count Rate Ambrosia Survey Flight Block 3
October 5 - 8, 2011
Flight Parameters 300 ft altitude 500 ft line spacing 110 knots 1 second acquisition time
Aerial Radiological Surveys Poison Canyon Uranium Mines October 2011
Page 23 of 37
4.2 Photographic Results Approximately 180 high resolution digital aerial photographs were taken over the entire survey area (as depicted in Image 10). These photographs have been geo- and ortho-rectified for geospatial applications and are available to view within Google Earth. Each aerial photo provides coverage of about 175 acres with a pixel resolution of 7.5 inches. Image 11 is representative of the images that were collected during the survey. Access to the photographic imagery is available by contacting Lisa Price, Region 6.
Aerial Radiological Surveys Poison Canyon Uranium Mines October 2011
Page 24 of 37
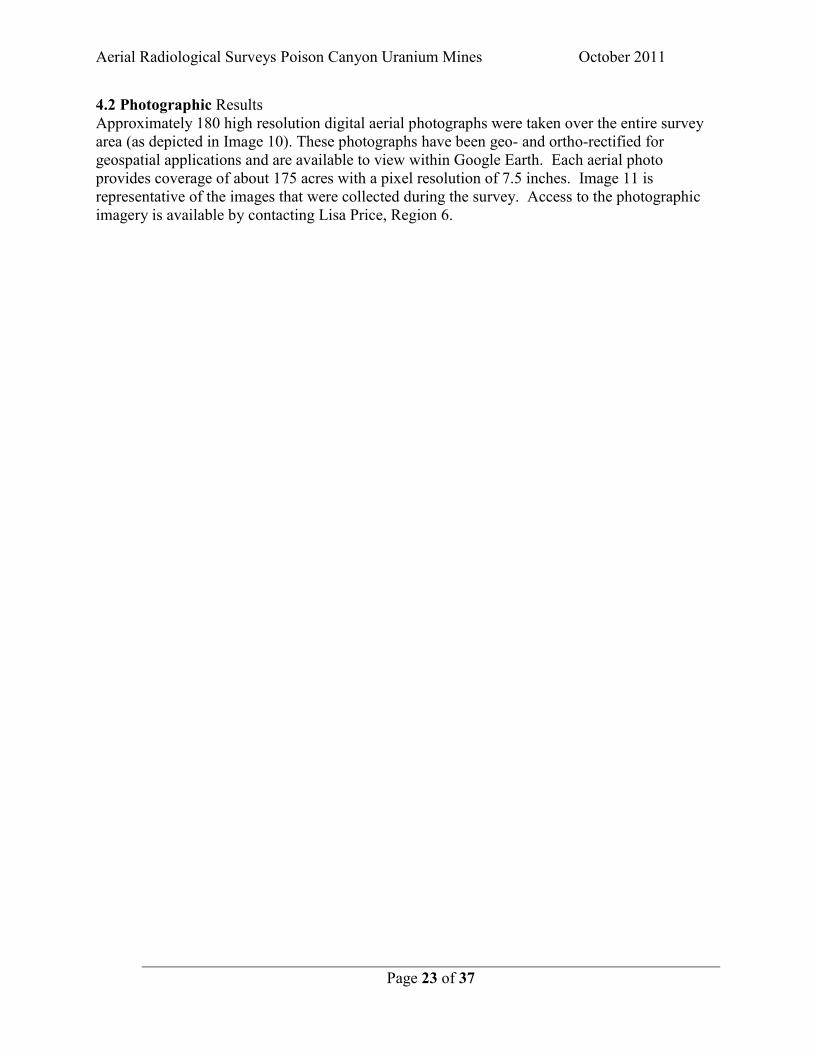
Image 16 – Digital Photo Outlines Poison Canyon Uranium Mines Survey
October 5 - 8, 2011
The above image indicates the location of the nearly 180 downward looking digital photographs taken by the ASPECT aircraft on October 8, 2011. In addition, nearly 75 oblique photographs of various features were also taken. Oblique and downward looking photographs can all be viewed in the Google Earth software.
Aerial Radiological Surveys Poison Canyon Uranium Mines October 2011
Page 25 of 37
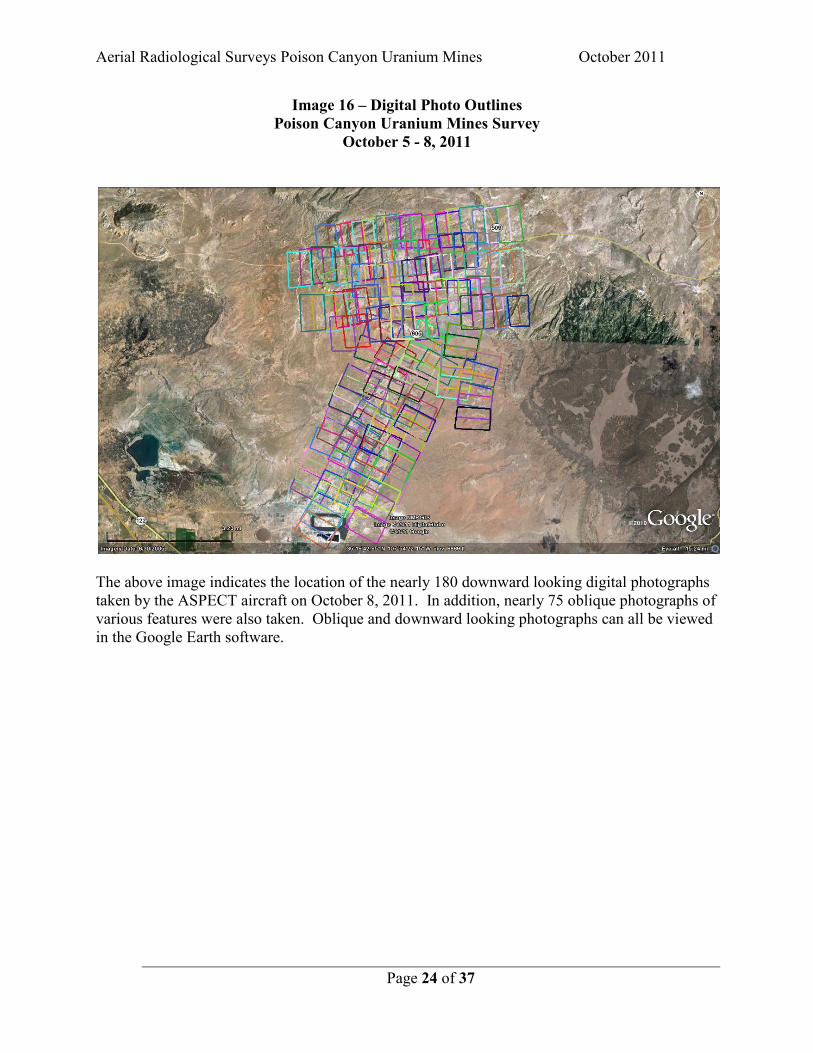
Image 17: Digital Images Ambrosia, New Mexico
These digital photos are intended to capture the areas as they existed at the time of the surveys. They are available for viewing in Google Earth. For access to these photos contact Lisa Price, Region 6.
Aerial Radiological Surveys Poison Canyon Uranium Mines October 2011
Page 26 of 37
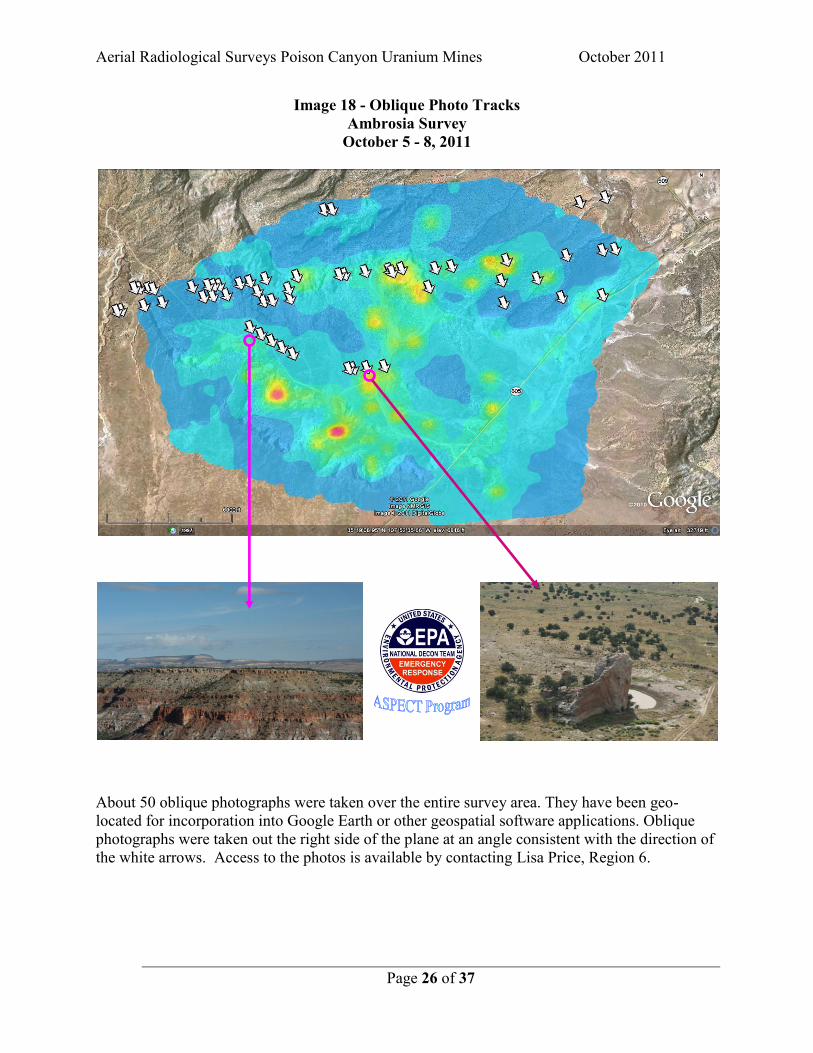
Image 18 - Oblique Photo Tracks Ambrosia Survey
October 5 - 8, 2011
About 50 oblique photographs were taken over the entire survey area. They have been geo-located for incorporation into Google Earth or other geospatial software applications. Oblique photographs were taken out the right side of the plane at an angle consistent with the direction of the white arrows. Access to the photos is available by contacting Lisa Price, Region 6.
Aerial Radiological Surveys Poison Canyon Uranium Mines October 2011
Page 27 of 37
Appendix I
Discussion about radiological uncertainties associated with airborne systems. Ideally the airborne radiation measurements would be proportional to the average surface concentrations of radioactive materials (mainly NORM). However, there are several factors that can interfere with this relationship causing the results to be over- or under-estimated, as described below. Additionally, two other sections discuss how data are interpreted and airborne measurement data are compared to surface measurements.
Background radiation Airborne gamma-spectroscopy systems measure radiation originating from terrestrial, radon, aircraft, and cosmic sources. To obtain only the terrestrial contribution, all other sources need to be accounted for (subtracted from the total counts), especially for this survey where small differences are important. Radon gas is mobile and can escape from rocks and soil and accumulate in the lower atmosphere. Radon concentrations vary from day to day, with time of day, with weather conditions (e.g., inversions and stability class), and with altitude. It is the largest contributor among background radiation and its daughter product, 214Bi, is used to estimate radium and uranium concentration in the soil. Radon is accounted for in the processing algorithm by flying specific test lines before and after each survey and comparing the results. Cosmic and aircraft radiation (e.g., instrument panels and metals containing small amounts of NORM) also provide a small contribution to the total counts. These are accounted for in the processing algorithm by flying a “high-altitude” or “water-” test line and subtracting these contributions for the survey data.
Secular Equilibrium Assumption Secular equilibrium is assumed in order to estimate thorium concentrations from one of its daughter products, 214Bi. Secular equilibrium exists when the activity of a daughter product equals that of its parent radionuclide. This can only occur if the half-life of the daughter product is much shorter than its parent and the daughter product stays with its parent in the environment. In this case, the measurement of 214Bi gamma emission is used to estimate the concentration of its parent radionuclide if one assumes all the intermediate radionuclides stay with each other. However, 222Rn is a noble gas with a half-life of 3.8 day and may degas from soils and rocks fissures due to changes in weather conditions. Due to the relatively long half-life and the combined effect of radon gas mobility and environmental “chemical” migration, it is not certain whether the secular equilibrium assumption is reasonable. In addition, human intervention in this natural chain of events may have caused an increased uncertainty in uranium concentration estimates.
Atmospheric Temperature and Pressure The density of air is a function of atmospheric temperature and pressure. Density increases with cooler temperatures and higher pressures, causing a reduction in detection of gamma-rays. This reduction in gamma-ray detection is called attenuation and it is also a function of the gamma-ray
Aerial Radiological Surveys Poison Canyon Uranium Mines October 2011
Page 28 of 37
energy. Higher energy gamma-rays are more likely to reach the detectors than lower energy gamma-rays. For example, 50% of the 214Bi 1.76 MeV gamma-rays will reach the detector at an altitude of 300 ft whereas only 44% of the 40K 1.46 MeV gamma-rays will reach the detector.* Temperature and pressure changes contribute little to the overall uncertainties associated with airborne detection systems as compared to other factors.
Soil moisture and Precipitation Soil moisture can be a significant source of error in gamma ray surveying. A 10% increase in soil moisture will decrease the total count rate by about the same amount due to absorption of the gamma rays by the water. Snow cover will cause an overall reduction in the total count rate because it also attenuates (shields) the gamma rays from reaching the detector. About 4 inches of fresh snow is equivalent to about 33 feet of air. There was no significant precipitation during this survey.
Topography and vegetation cover Topographic effect can be severe for both airborne and ground surveying. Both airborne and ground-based detection systems are calibrated for an infinite plane source which is referred to as 2π geometry (or flat a surface). If the surface has mesas, cliffs, valleys, and large height fluctuations, then the calibration assumptions are not met and care must be exercised in the interpretation of the data. Vegetation can affect the radiation detected from an airborne platform in two ways: (1) the biomass can absorb and scatter the radiation in the same way as snow leading to a reduced signal, or (2) it can increase the signal if the biomass concentrated radionuclides found in the soil nutrients.
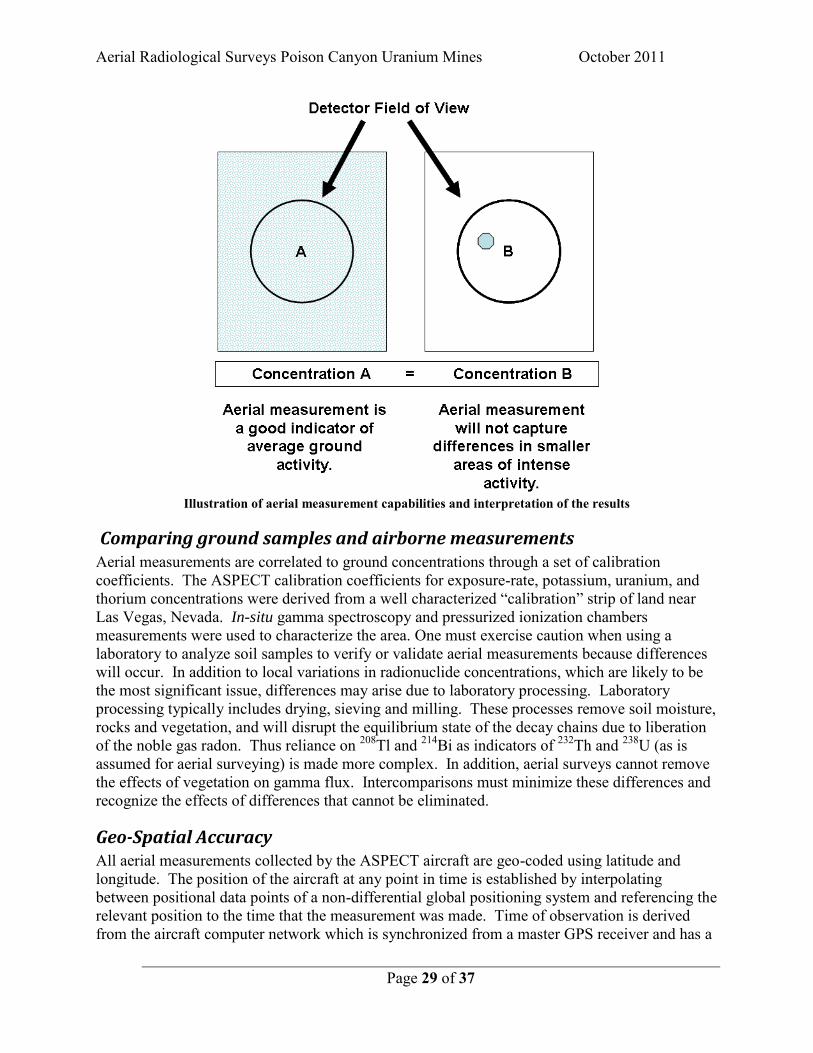
Spatial Considerations Standard ground-based environmental measurements are taken 3 ft above the ground with a field of view of about 30 ft2. The ASPECT collected data at about 300 ft above the ground with an effective field of view of about 6.5 acres. These aerial measurements provide an average surface activity over the effective field of view. If the ground activity varies significantly over the field of view, then the results from ground- and aerial-based systems may not agree. It is not unusual to have differences as much as several orders of magnitude depending on the survey altitude and the size and intensity of the source material. For example, in the figures below, if the “A” circle represents the detector field of view and the surrounding area had no significant differences in surface activity, a 300 ft aerial measured could correlate to a ground-based exposure rate of 3.5 µR/h. However, if all the activity was contained in a small area such as a single small structure containing thorium tailings (represented by the blue dot within the field of view of “B”), a 300 ft aerial measurement may still provide the same exposure rate measurement but the actual ground-based measurements could be as high as 3,150 µR/h.
* Attenuation coefficients of 0.0077m-1 for 1.76 MeV and 0.0064m-1 for 1.46 MeV.
Aerial Radiological Surveys Poison Canyon Uranium Mines October 2011
Page 29 of 37
Illustration of aerial measurement capabilities and interpretation of the results
Comparing ground samples and airborne measurements Aerial measurements are correlated to ground concentrations through a set of calibration coefficients. The ASPECT calibration coefficients for exposure-rate, potassium, uranium, and thorium concentrations were derived from a well characterized “calibration” strip of land near Las Vegas, Nevada. In-situ gamma spectroscopy and pressurized ionization chambers measurements were used to characterize the area. One must exercise caution when using a laboratory to analyze soil samples to verify or validate aerial measurements because differences will occur. In addition to local variations in radionuclide concentrations, which are likely to be the most significant issue, differences may arise due to laboratory processing. Laboratory processing typically includes drying, sieving and milling. These processes remove soil moisture, rocks and vegetation, and will disrupt the equilibrium state of the decay chains due to liberation of the noble gas radon. Thus reliance on 208Tl and 214Bi as indicators of 232Th and 238U (as is assumed for aerial surveying) is made more complex. In addition, aerial surveys cannot remove the effects of vegetation on gamma flux. Intercomparisons must minimize these differences and recognize the effects of differences that cannot be eliminated.
Geo-Spatial Accuracy All aerial measurements collected by the ASPECT aircraft are geo-coded using latitude and longitude. The position of the aircraft at any point in time is established by interpolating between positional data points of a non-differential global positioning system and referencing the relevant position to the time that the measurement was made. Time of observation is derived from the aircraft computer network which is synchronized from a master GPS receiver and has a
Aerial Radiological Surveys Poison Canyon Uranium Mines October 2011
Page 30 of 37
maximum error of 1 second*. Timing events based on the network running the Windows-based operating system and the sensor timing triggers have a time resolution of 50 milliseconds, so the controlling error in timing is the network time. If this maximum timing error is coupled to the typical ground velocity of 55 meter/sec of the aircraft, an instantaneous error of 55 meters is possible due to timing. In addition, geo-positional accuracy is dependent on the instantaneous precision of the non-differential GPS system which is typically better than 30 meters for any given observation. This results in an absolute maximum instantaneous error of about 80 meters in the direction of travel. For measurements dependent on aircraft attitude (photographs, IR images) three additional errors are relevant and include the error of the inertial navigation unit (INU), the systemic errors associated with sensor to INU mounting, and altitude errors above ground. Angular errors associated with the INU are less than 0.5 degrees of arc. Mounting error is minimized using detailed bore alignment of all sensors on the aircraft base plate and is less than 0.5 degrees of arc. If the maximum error is assumed then an error of 1.0 degree of arc will result. At an altitude of 150 meters (about 500 feet) this error translates to about 10 meters. Altitude above ground is derived from the difference in the height above the geoid (taken from the GPS) from the ground elevation derived from a 30 meter digital elevation model. If an error of the model is assumed to be 10 meters and the GPS shows a typical maximum error of 10 meters, this results in an altitude maximum error of 20 meters in altitude error. If this error is combined with attitude and the instantaneous GPS positional error (assuming no internal receiver compensation due to forward motion) then an error of about 50 meters will result. The maximum forecasted error that should result from the aircraft flying straight and level is +/- 130 meters in the direction of travel and +/- 50 meters perpendicular to the direction of travel. Statistical evaluation of collected ASPECT data has shown that typical errors of +/- 22 meters in both the direction of and perpendicular to travel are typical. Maximum errors of +/- 98 meters have been observed during high turbulence conditions.
* The ASPECT network is synchronized to the master GPS time at system start-up. If the observed network/GPS time difference exceeds 1 sec. at any time after synchronization, the network clock is reset.
Aerial Radiological Surveys Poison Canyon Uranium Mines October 2011
Page 31 of 37
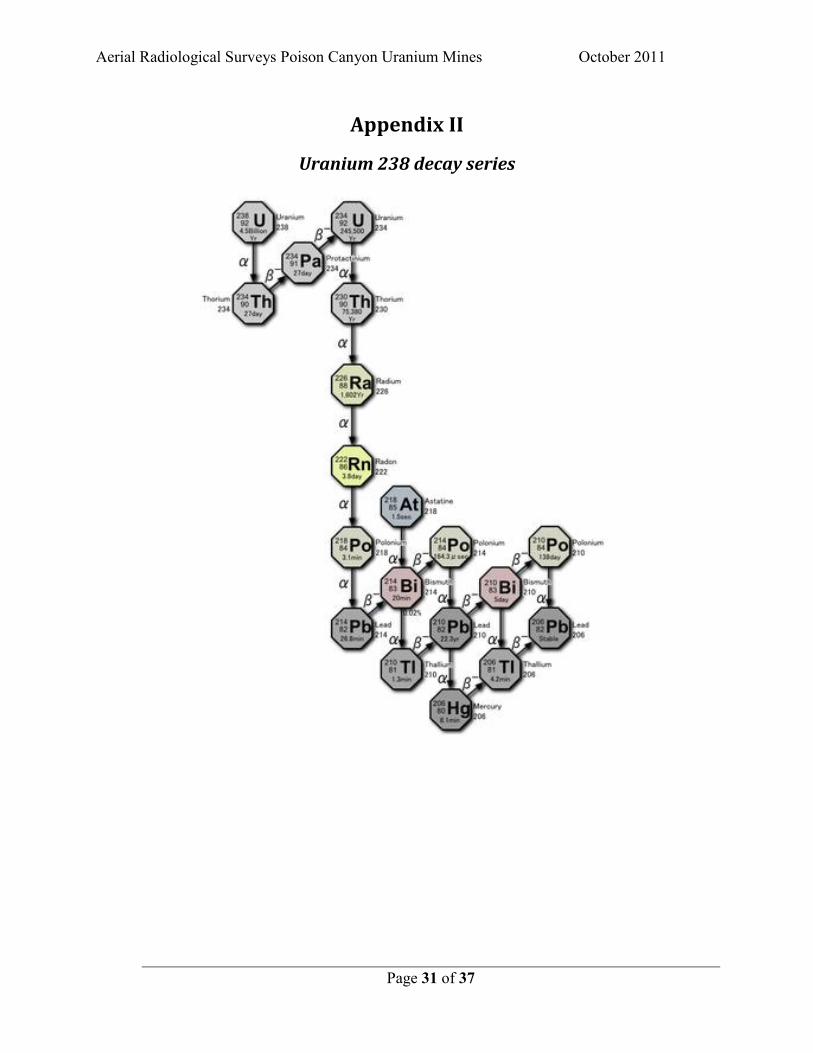
Appendix II
Uranium 238 decay series
Aerial Radiological Surveys Poison Canyon Uranium Mines October 2011
Page 32 of 37
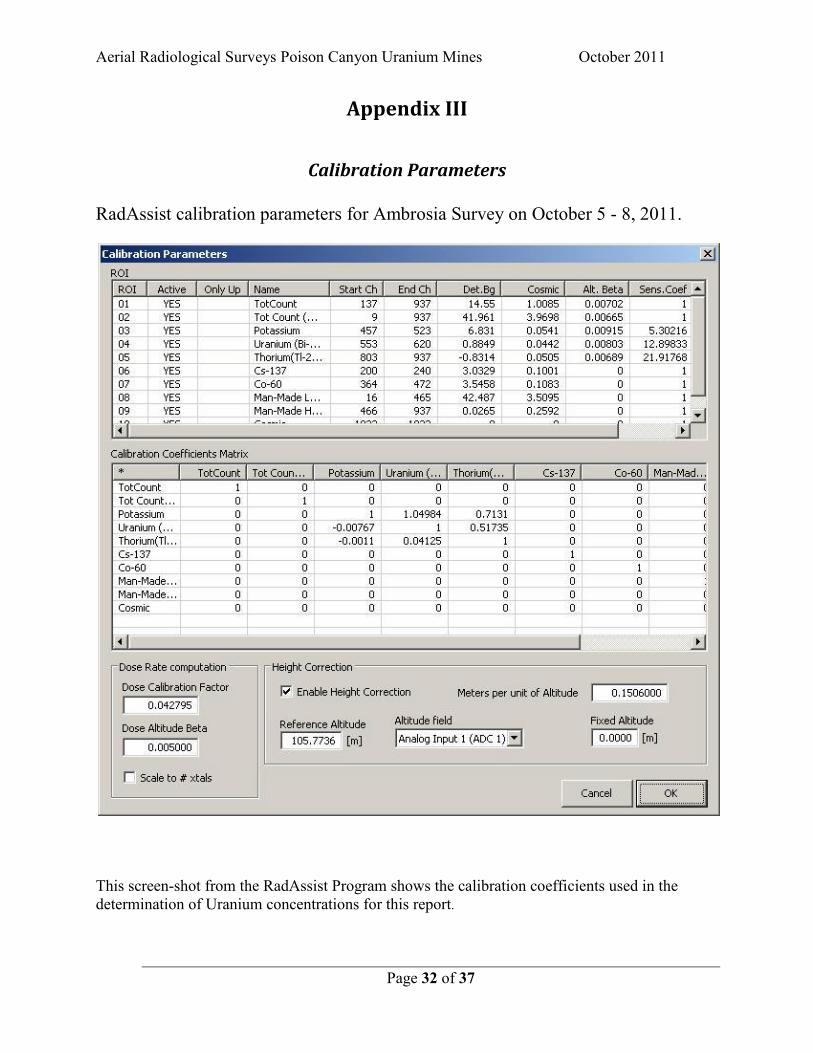
Appendix III
Calibration Parameters RadAssist calibration parameters for Ambrosia Survey on October 5 - 8, 2011.
This screen-shot from the RadAssist Program shows the calibration coefficients used in the determination of Uranium concentrations for this report.
Aerial Radiological Surveys Poison Canyon Uranium Mines October 2011
Page 33 of 37
Appendix IV
Background Radiation Naturally occurring radioactive material (NORM) originates from cosmic radiation, cosmogenic radioactivity, and primordial radioactive elements that were created at the beginning of the earth. Cosmic radiation consists of very high energy particles from extraterrestrial sources such as the sun (mainly alpha particles and protons) and galactic radiation (mainly electrons and protons). Its intensity increases with altitude, doubling about every 6,000 ft, and with increasing latitude north and south of the equator. The cosmic radiation level at sea level is about 3.2 µR/h and nearly twice this level in locations such as Denver, CO. Cosmogenic radioactivity results from cosmic radiation interacting with the earth’s upper atmosphere. Since this is an ongoing process, a steady state has been established whereby cosmogenic radionuclides (e.g., 3H and 14C) are decaying at the same rate as they are produced. These sources of radioactivity were not a focus of this survey and were not included in the processing algorithms. Primordial radioactive elements found in significant concentrations in the crustal material of the earth are potassium, uranium and thorium. Potassium is one of the most abundant elements in the Earth's crust (2.4% by mass). One out of every 10,000 potassium atoms is radioactive potassium-40 (40K) with a half-life (the time it takes to decay to one half the original amount) of 1.3 billion years. For every 100 40K atoms that decay, 11 become Argon-40 (40A) and emit a 1.46 MeV gamma-ray. Uranium is ubiquitous in the natural environment and is found in soil at various concentrations with an average of about 1.2 pCi/g. Natural uranium consists of three isotopes with about 99.3% being uranium-238 (238U), about 0.7% being uranium-235 (235U), and a trace amount being uranium-234 (234U). The tenth daughter product of 238U, bismuth-214 (214Bi), is used to estimate the presence of radium and uranium by its 1.76 MeV gamma-ray emission. Thorium-232 is the parent radionuclide of one of the 4 primordial decay chains. It is about four times more abundant in nature than uranium and also decays through a series of daughter products to a stable form of lead. The thorium content of rocks ranges between 0.9 pCi/g and 3.6 pCi/g with an average concentration of about 1.3 pCi/g.2 The ninth daughter product, thallium-208 (208Tl), is used to estimate the presence of thorium by its 2.61 MeV gamma-ray emission. Technologically enhanced naturally occurring radioactive material (TENORM) is NORM processed in such a manner that its concentration has been increased. TENORM is associated with various industries including energy production, water filtration, fertilizer production, mining and metals production. Concentrations of radionuclides in TENORM are often orders of magnitude greater than the naturally occurring concentrations. This survey was designed to identify areas where the TENORM concentrations were significantly higher than the natural background concentrations due to the mining and processing of uranium ore.
Aerial Radiological Surveys Poison Canyon Uranium Mines October 2011
Page 34 of 37
Appendix V: ASPECT Instrumentation
Survey Instrumentation The ASPECT aircraft is a twin engine, high wing AeroCommander 680FL capable of cruising speeds ranging from about 100 knots (115 mph) to 200 knots (230 mph) (Image 2). It is based in Waxahachie, Texas and operated by two pilots and one technician. A suite of chemical, radiological, and photographic detection technology is mounted within the airframe making it the only aircraft in the nation with remote chemical and radiological detection capabilities.
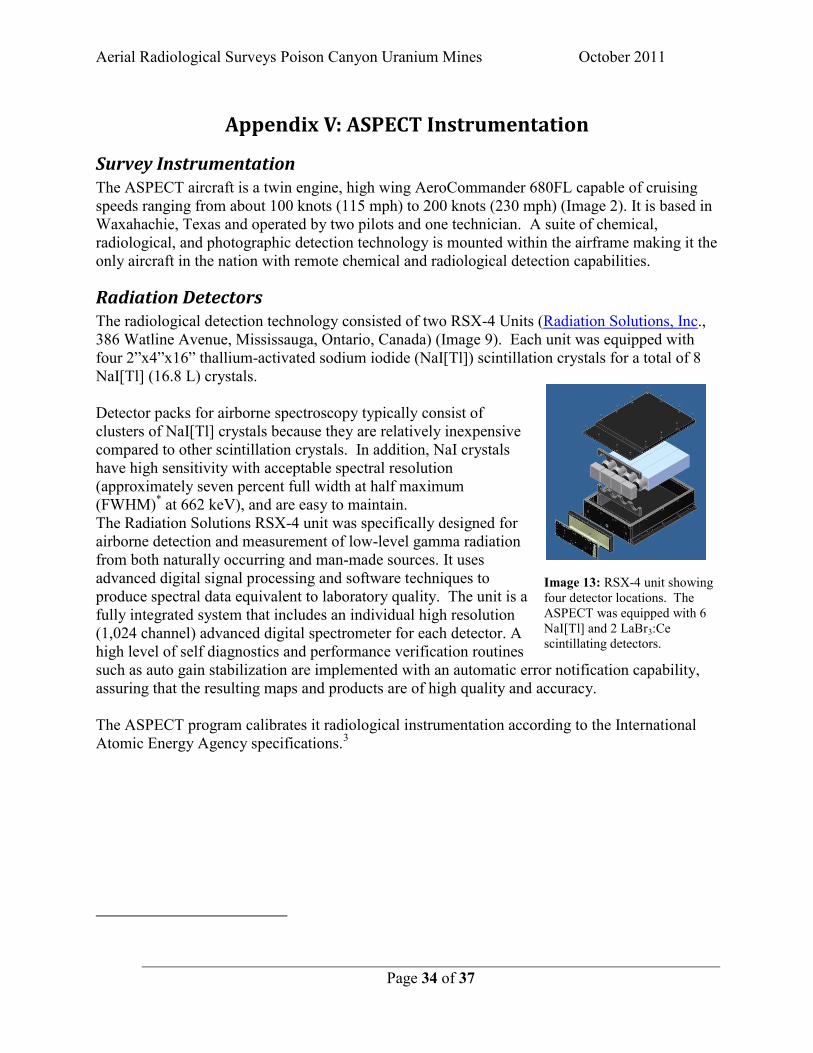
Radiation Detectors The radiological detection technology consisted of two RSX-4 Units (Radiation Solutions, Inc., 386 Watline Avenue, Mississauga, Ontario, Canada) (Image 9). Each unit was equipped with four 2”x4”x16” thallium-activated sodium iodide (NaI[Tl]) scintillation crystals for a total of 8 NaI[Tl] (16.8 L) crystals. Detector packs for airborne spectroscopy typically consist of clusters of NaI[Tl] crystals because they are relatively inexpensive compared to other scintillation crystals. In addition, NaI crystals have high sensitivity with acceptable spectral resolution (approximately seven percent full width at half maximum (FWHM)* at 662 keV), and are easy to maintain. The Radiation Solutions RSX-4 unit was specifically designed for airborne detection and measurement of low-level gamma radiation from both naturally occurring and man-made sources. It uses advanced digital signal processing and software techniques to produce spectral data equivalent to laboratory quality. The unit is a fully integrated system that includes an individual high resolution (1,024 channel) advanced digital spectrometer for each detector. A high level of self diagnostics and performance verification routines such as auto gain stabilization are implemented with an automatic error notification capability, assuring that the resulting maps and products are of high quality and accuracy. The ASPECT program calibrates it radiological instrumentation according to the International Atomic Energy Agency specifications.3
Image 13: RSX-4 unit showing four detector locations. The ASPECT was equipped with 6 NaI[Tl] and 2 LaBr3:Ce scintillating detectors.
Aerial Radiological Surveys Poison Canyon Uranium Mines October 2011
Page 35 of 37
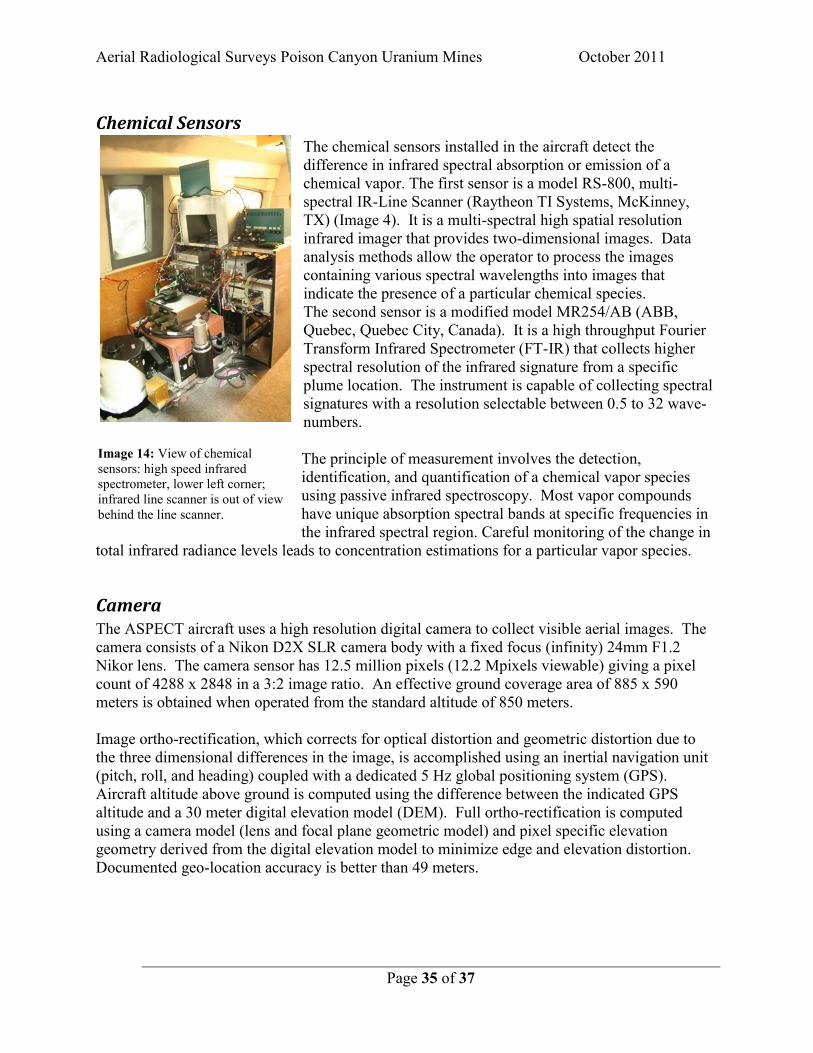
Chemical Sensors The chemical sensors installed in the aircraft detect the difference in infrared spectral absorption or emission of a chemical vapor. The first sensor is a model RS-800, multi-spectral IR-Line Scanner (Raytheon TI Systems, McKinney, TX) (Image 4). It is a multi-spectral high spatial resolution infrared imager that provides two-dimensional images. Data analysis methods allow the operator to process the images containing various spectral wavelengths into images that indicate the presence of a particular chemical species. The second sensor is a modified model MR254/AB (ABB, Quebec, Quebec City, Canada). It is a high throughput Fourier Transform Infrared Spectrometer (FT-IR) that collects higher spectral resolution of the infrared signature from a specific plume location. The instrument is capable of collecting spectral signatures with a resolution selectable between 0.5 to 32 wave-numbers. The principle of measurement involves the detection, identification, and quantification of a chemical vapor species using passive infrared spectroscopy. Most vapor compounds have unique absorption spectral bands at specific frequencies in the infrared spectral region. Careful monitoring of the change in
total infrared radiance levels leads to concentration estimations for a particular vapor species.
Camera The ASPECT aircraft uses a high resolution digital camera to collect visible aerial images. The camera consists of a Nikon D2X SLR camera body with a fixed focus (infinity) 24mm F1.2 Nikor lens. The camera sensor has 12.5 million pixels (12.2 Mpixels viewable) giving a pixel count of 4288 x 2848 in a 3:2 image ratio. An effective ground coverage area of 885 x 590 meters is obtained when operated from the standard altitude of 850 meters. Image ortho-rectification, which corrects for optical distortion and geometric distortion due to the three dimensional differences in the image, is accomplished using an inertial navigation unit (pitch, roll, and heading) coupled with a dedicated 5 Hz global positioning system (GPS). Aircraft altitude above ground is computed using the difference between the indicated GPS altitude and a 30 meter digital elevation model (DEM). Full ortho-rectification is computed using a camera model (lens and focal plane geometric model) and pixel specific elevation geometry derived from the digital elevation model to minimize edge and elevation distortion. Documented geo-location accuracy is better than 49 meters.
Image 14: View of chemical sensors: high speed infrared spectrometer, lower left corner; infrared line scanner is out of view behind the line scanner.
Aerial Radiological Surveys Poison Canyon Uranium Mines October 2011
Page 36 of 37
Radiological spectral data are collected every second along with GPS coordinates and other data reference information. These data are subject to quality checks within the Radiation Solutions internal processing algorithms (e.g. gain stabilization) to ensure a good signal. If any errors are encountered with a specific crystal during the collection process, an error message is generated and the data associated with that crystal are removed from further analyses. Prior to the survey, the RSX-4 units go through a series of internal checks. If no problems are detected, a green indicator light notifies the user that all systems are good. A yellow light indicates a gain stabilization issue with a particular crystal. This can be fixed by waiting for another automatic gain stabilization process to occur or the user can disable the particular crystal via the RadAssist Software application. A red light indicates another problem and would delay the survey until it can be resolved.
Aerial Radiological Surveys Poison Canyon Uranium Mines October 2011
Page 37 of 37
References 1 Bristow Q., Airborne γ-ray spectrometry in Uranium Exploration. Principles and Current
Practice. International Journal of Applied Radiation and Isotopes. Vol. 34. No. 1. Pp 199-229, 1983.
2 Eisenbud, M. Environmental Radioactivity; From Natural, Industrial, and Military Sources. 3rd
Edition. Academic Press, Inc., New York, NY. 1987. 3 International Atomic Energy Agency [2003]. Guidelines for radioelement mapping using
gamma ray spectrometry data. Technical Report Series No. 1363. IAEA, Vienna.