Embed Size (px)
Citation preview
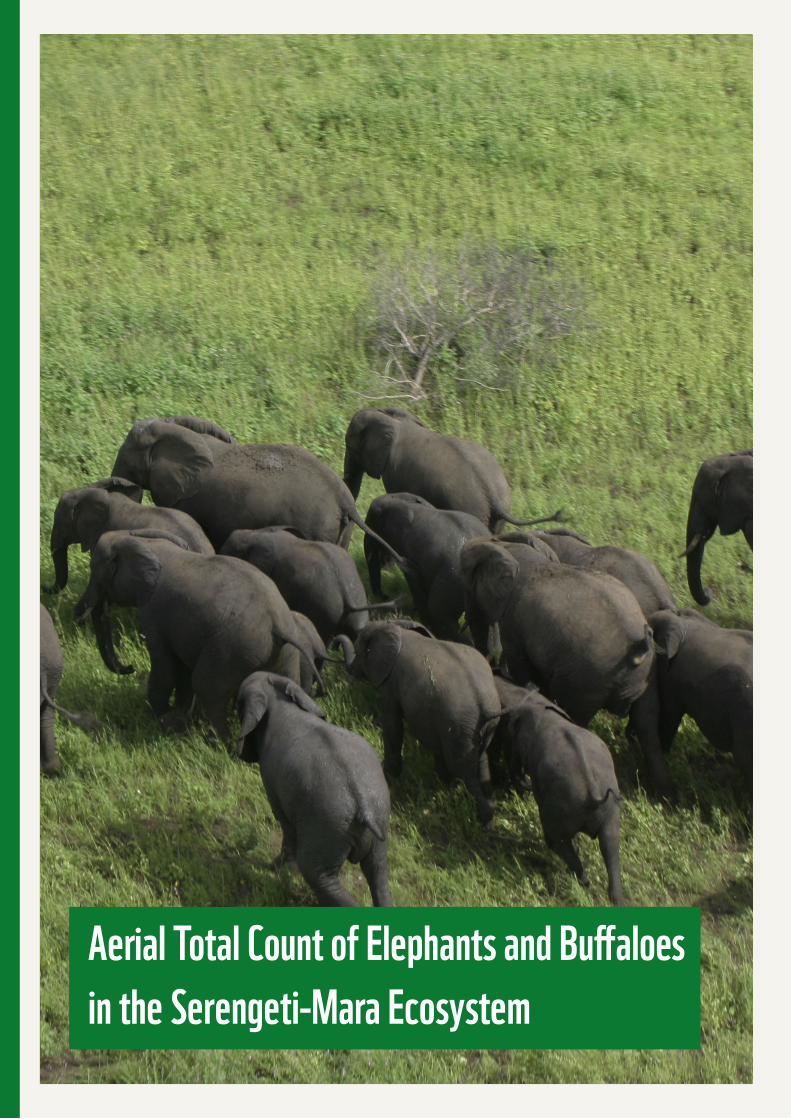
Aerial Total Count of Elephants and Buffaloes in the Serengeti-Mara Ecosystem

Written and edited by Mduma H, Musyoki C, Maliti Kyale D, Nindi S, Hamza K, Ndetei R, Machoke M, Kimutai D, Muteti D, Maloba M, Bakari S, and Kohi E.
Concept and Design by © Robert Magori
Front cover photo: © WWF - Canon / Folke Wulf
Published in August 2014 by WWF-World Wide Fund For Nature (Formerly World Wildlife Fund), Nairobi, Kenya. Any reproduction in full or in part must mention the title and credit the above-mentioned publisher as the copyright owner.
© Text 2014 TAWIRI, KWS, WWF, FZS and Paul G Allen Foundation
All rights reserved
ACKNOWLEDGEMENTS The survey was conducted within the framework of a developing cross border collaborative conservation initiative between Tanzania and Kenya. The initiative recognizes the spirit of the East African Community Transboundary Ecosystems Management Act 2010 (EAC, 2010).
The authors of this report are highly indebted to Tanzania Wildlife Research Institute (TAWIRI) and Kenya Wildlife Service (KWS) for facilitating and coordinating the planning and the execution of the census. Many thanks also go to WWF Kenya, Frankfurt Zoological Society (FZS) and Paul G Allen Foundation (“Pan African Elephant Survey”) through the financial support for planning, training, logistics, data validation, report writing and official dissemination of the results. The following collaborators were instrumental in making the census successful: Wildlife Division (WD) of Tanzania’s Ministry of Natural Resources and Tourism, Tanzania National Parks (TANAPA), Ngorongoro Conservation Area Authority (NCAA) and County Government of Narok. We also thank all participants of the census for their commitment and dedication that ensured the census was successfully carried out.
Finally we extend sincere thanks to the Director Generals of TAWIRI, KWS, TANAPA and the Director of Wildlife Division for approving travel and other clearances for their staff to participate in this important transboundary initiative.
4Aerial Count Report 2014 page
Serengeti-Mara Aerial Elephant and Buffalo Count Report
EXECUTIVE SUMMARY The wet season Serengeti-Mara aerial census of elephants and buffaloes was conducted from 19th May to 6th June 2014. The survey covered an area of 30,953 km², as part of the long-term ecological monitoring aerial censuses undertaken since 1957. The survey was conducted using five aircrafts. In this report the “northern part” of the ecosystem refers to the area surveyed north of the international boundary while the “southern part” refers to all that area surveyed south of the international boundary.
A total of 7,535 elephants and 61,896 buffaloes were counted in the survey area. The number of elephants counted shows an increasing trend from 2,058 in 1986 to 7,535 individuals in 2014. There was also an increase in buffaloes population in the area, from 54,979 (in 1986) to 61,896 individuals (in 2014) An isolated population of 20 elephants were observed in Mosiro area in the northern part (Kenya). Further analyses of data reveals an increase in elephant numbers in the south (Serengeti area) in contrast to a decline in the north (Mara area). The observed decrease in elephant numbers in the Mara suggest elephant migration into the Serengeti area where a spike in elephant population was witnessed during the 2014 census. Buffalo population analyses indicate a decline from early to mid-1990s before registering a steady growth thereafter. This decline was attributed to a severe drought recorded in 1993 and also from poaching.
A total of 192 elephant carcasses were counted in the entire ecosystem, of which 117 were in the northern part and 75 in the south. In the north, 84% of carcasses were found outside of the Masai Mara National Reserve and 18% were found inside. In the south, 27% of the carcasses were found outside protected areas and 73 % were found inside. No carcass was found inside Ngorongoro Conservation Area. All of the recent carcasses in the north were found outside of the Masai-Mara National Reserve, and each had its tusks missing. In the south, three of the five recent carcasses were found in the Serengeti National park, one with tusks intact.
General results for this census show an increasing trend of elephants and buffaloes in the Serengeti-Mara ecosystem. The need to strengthening of management strategies especially in the north where a large number of carcases were found is pertinent. Wildlife conservation authorities are urged to keep it up in their excellent job to ensure this trend of effective protection is realized at all times.
CONTENTS Acknowledgements 3Executive Summary 4List of Acronyms 61.0 Introduction 82.0 Survey Area 123.0 Materials and Methods 154.0 Results and Discussion 205.0 Conclusion 296.0 Recommendations 297.0 References 30
6Aerial Count Report 2014 page
Serengeti-Mara Aerial Elephant and Buffalo Count Report
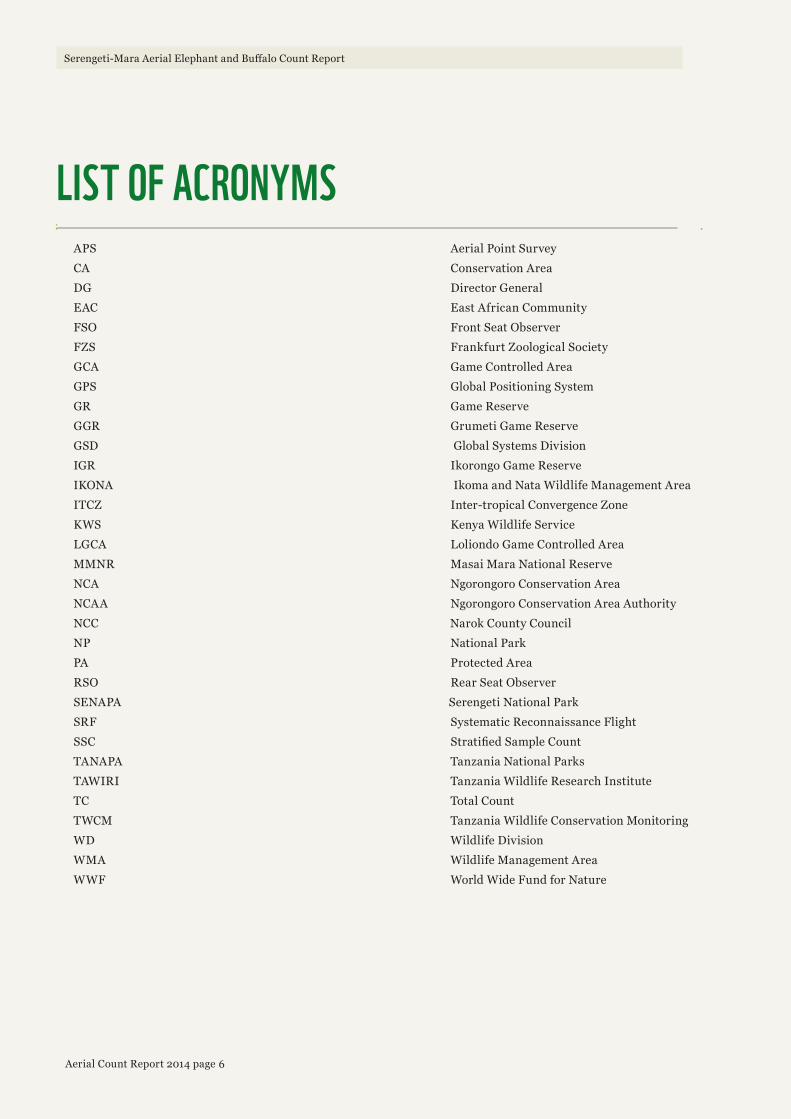
LIST OF ACRONYMS APS Aerial Point SurveyCA Conservation AreaDG Director GeneralEAC East African CommunityFSO Front Seat ObserverFZS Frankfurt Zoological SocietyGCA Game Controlled AreaGPS Global Positioning SystemGR Game ReserveGGR Grumeti Game ReserveGSD Global Systems DivisionIGR Ikorongo Game Reserve IKONA Ikoma and Nata Wildlife Management AreaITCZ Inter-tropical Convergence ZoneKWS Kenya Wildlife ServiceLGCA Loliondo Game Controlled AreaMMNR Masai Mara National Reserve NCA Ngorongoro Conservation AreaNCAA Ngorongoro Conservation Area Authority NCC Narok County CouncilNP National ParkPA Protected AreaRSO Rear Seat ObserverSENAPA Serengeti National ParkSRF Systematic Reconnaissance FlightSSC Stratified Sample CountTANAPA Tanzania National ParksTAWIRI Tanzania Wildlife Research InstituteTC Total CountTWCM Tanzania Wildlife Conservation MonitoringWD Wildlife DivisionWMA Wildlife Management AreaWWF World Wide Fund for Nature
7Aerial Count Report 2014 page
Serengeti-Mara Aerial Elephant and Buffalo Count Report
© N
ATUR
EO
L.CO
M / B
EN
OS
OB
OR
NE
/ WW
F-CA
NO
N
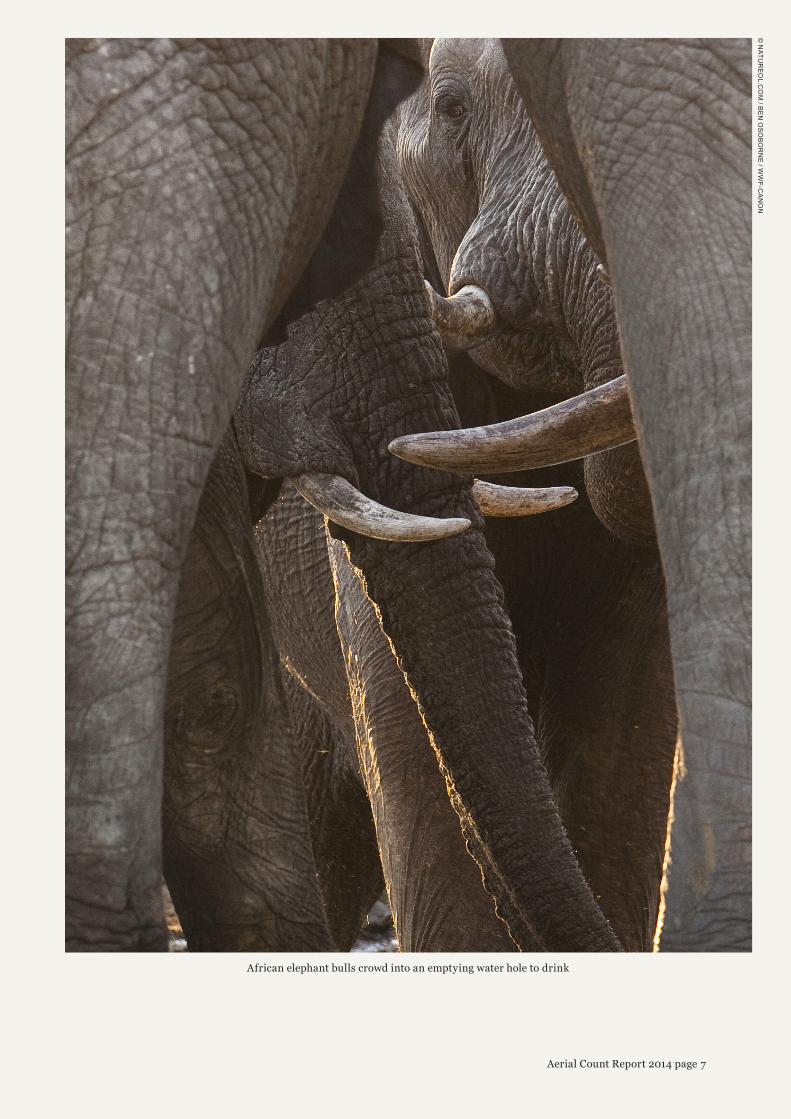
African elephant bulls crowd into an emptying water hole to drink
8Aerial Count Report 2014 page
Serengeti-Mara Aerial Elephant and Buffalo Count Report
1.0 INTRODUCTION 1.1 HISTORY OF SERENGETI MARA CENSUS
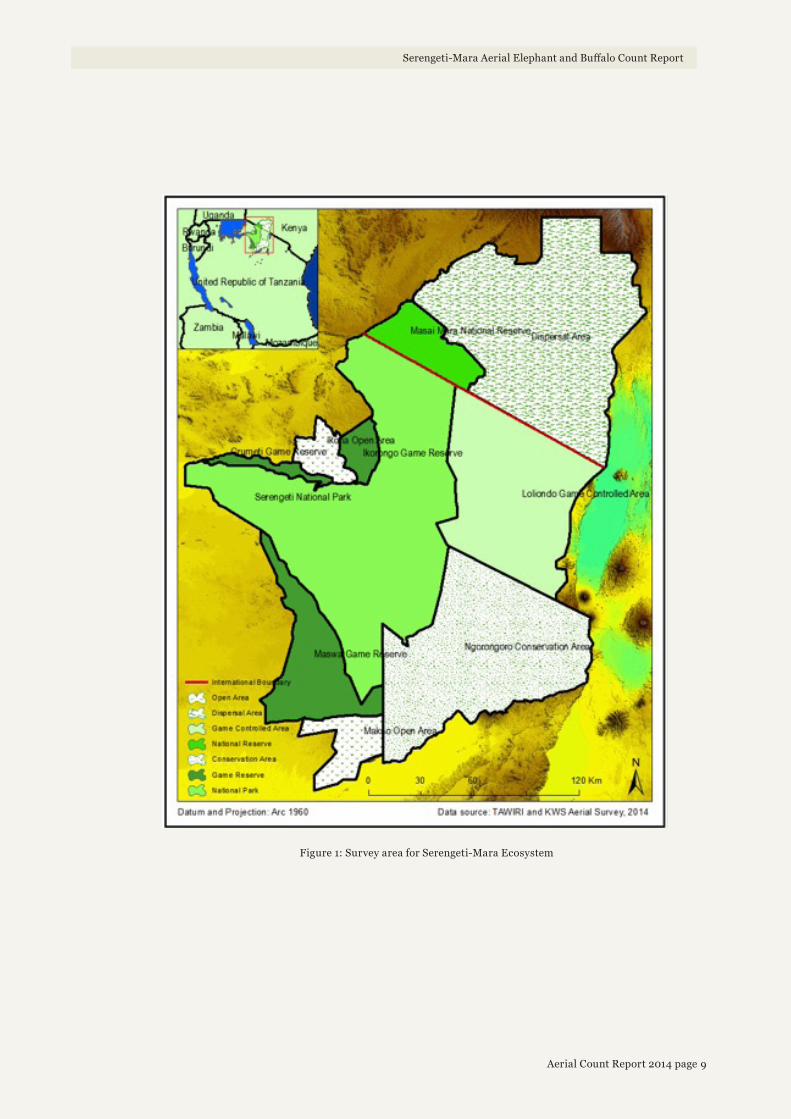
The Serengeti–Mara ecosystem comprises Serengeti National Park, Ngorongoro Conservation Area, Maswa Game Reserve, Ikorongo-Grumeti Game Reserves, Loliondo Game Controlled Area, Ikona and Makao Wildlife Management Areas (including open areas), Masai-Mara National Reserve, Masai Mara adjacent pastoral lands that include conservancies and group ranches (Figure.1).
In this report the “northern part” of the ecosystem refers to the area surveyed north of the international boundary while the “southern part” refers to all that surveyed area south of the international boundary.
Historically, both Kenya and Tanzania have carried out censuses independently in the Mara and Serengeti respectively. There was limited collaboration and coordination of the censuses between the two countries, yet the Mara and Serengeti are the same ecological system. This meant that the censuses were not synchronized and had limited comparability. However, in 1990, an attempt was made to carry out a joint ecosystem census but this was not sustained in subsequent censuses.
Systematic wildlife censuses in the ecosystem began in 1957. The results of these censuses were of limited use in guiding decisions ecosystem-wide, as transboundary movement and distribution of wildlife could not be accounted for in the independently obtained results. In addition, the censuses were carried out at different times further complicating the interpretation. Overall the censuses undertaken previously had spatial, temporal and design differences. The differences were attributed to objectives of the surveys and methodologies used by the two countries. The commonly used methods included; Stratified Sample Count (SSC), Systematic Reconnaissance Flight (SRF), Total Counts (TC) and Aerial Point Survey (APS).
In the spirit of sustainable wildlife conservation and management in the Serengeti-Mara Ecosystem, transboundary collaboration is critical. To contribute to effective cross-border conservation, the two countries carried out a joint aerial census of elephants and buffaloes. This was accomplished through holding joint planning meetings that brought together technical staff from both countries to deliberate the specifics of the census. The planning resulted in redesigning of blocks, standardization of block sizes and adoption of a uniform census methodology.
9Aerial Count Report 2014 page
Figure 1: Survey area for Serengeti-Mara Ecosystem
Serengeti-Mara Aerial Elephant and Buffalo Count Report
10Aerial Count Report 2014 page
Serengeti-Mara Aerial Elephant and Buffalo Count Report
1.2 SURVEY RATIONALE
The Serengeti-Mara ecosystem straddles an international political boundary, sharing 75 km boundary between the government designated protected areas on both sides of the border. Wildlife and habitats are not limited or restricted by this boundary. Ecological processes are also not aligned to political boundaries. It is advantageous for wildlife conservation and management to embrace this as a single ecosystem due to the ecological relationships therein.
Transboundary collaboration has for long been prescribed as necessary in dealing with ecosystems that transcend political boundaries and is provided for in the East African Community Transboundary Ecosystems Management Act of 2010.The Serengeti-Mara ecosystem is globally known for the spectacular annual migration of wildebeests, thomson’s gazelles and zebras. There also exist important transboundary habitats, wetlands and human communities.
The importance of having Tanzania and Kenya collaborate in addressing the myriad of conservation interests at this cross-border interface cannot be overemphasized. This joint census is one of many interventions planned for the Serengeti-Mara ecosystem.
1.3 SURVEY OBJECTIVES
The purpose of this survey was to obtain wet season numbers and distribution of elephants and buffaloes. The specific objectives of the survey were to:
(i) Determine the number of elephants and buffaloes
(ii) Document the spatial distribution of elephants and buffaloes
(iii) Document the population trends in elephants and buffaloes
(iv) Document number and spatial distribution of elephant carcasses
11Aerial Count Report 2014 page
Serengeti-Mara Aerial Elephant and Buffalo Count Report
1.4 POSSIBLE SOURCES OF BIAS AND MITIGATION
While total count methods attempt to ensure that all groups are counted, and that no group is double-counted, there are some sources of bias that remain (Jachmann 2001; Douglas-Hamilton 1996, Norton-Griffiths 1978). A comprehensive list of potential errors may be found in those references. In this survey the following sources of bias were identified:
a) Observer estimation errors: This was mitigated by two days observer training, calibration and use of cameras.
b) Possible bias due to use of different types of aircrafts: This was minimized by having only one different aircraft out of five that were used in the survey.
c) Incomplete coverage of the planned survey area in some parts of the census zone due to difficult topography. This has little effect on the results, and most of these areas are not preferred by the two species.
d) Double counting due to potential movement of wildlife between and adjacent blocks (overlap) as well as different survey dates within and between blocks. This was mitigated by undertaking a careful clean-up of the data.
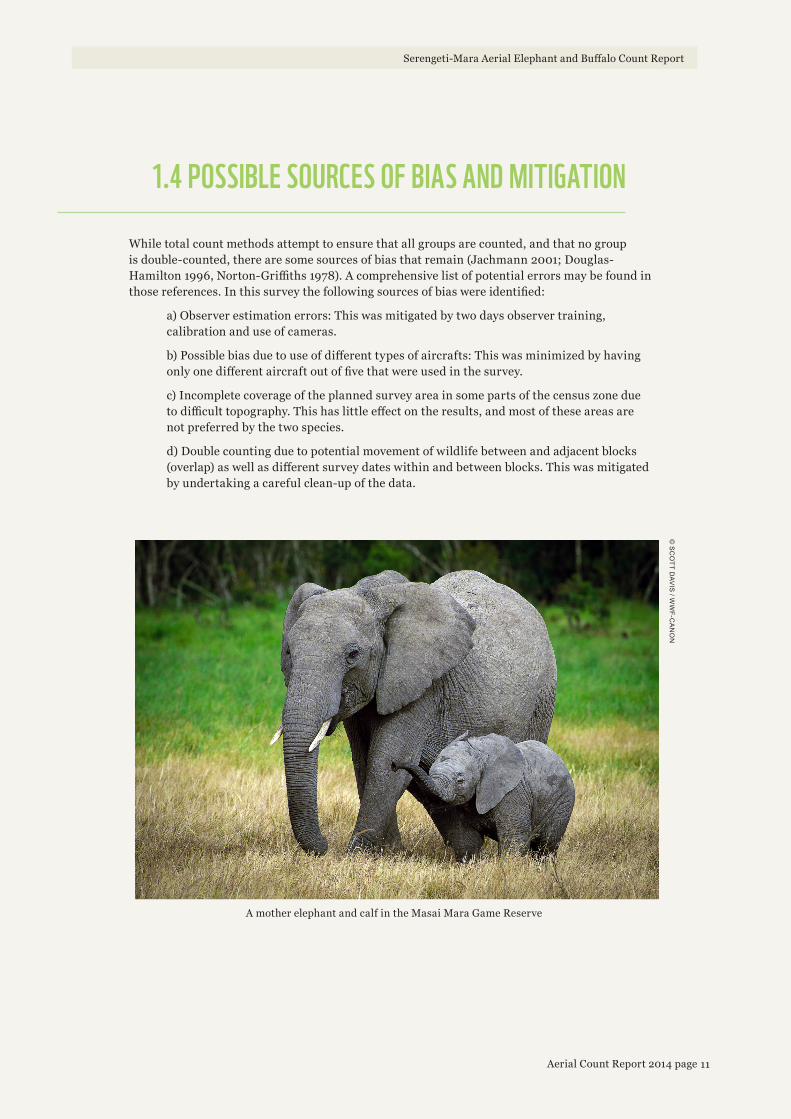
A mother elephant and calf in the Masai Mara Game Reserve
© S
CO
TT D
AVIS
/ WW
F-CA
NO
N
12Aerial Count Report 2014 page
Serengeti-Mara Aerial Elephant and Buffalo Count Report
2.0 SURVEY AREA 2.1 LOCATION: ADMINISTRATIVE AND MANAGEMENT SECTORS
The Serengeti-Mara ecosystem covers an area of 32,000 km². It is located in south-western Kenya and northern Tanzania. The survey area lies between E33°51’ and E36°14’ Longitude and S0°48’ to S3°30 Latitude.
The ecosystem comprises:
a) TANZANIA: Serengeti National Park (SENAPA) and adjoining Ngorongoro Conservation Area (NCA), Maswa Game Reserve, Ikorongo-Grumeti Game Reserves and Loliondo Game Controlled Area, Ikona Open and Wildlife Management Area (WMA) and Makao Open and WMA.
b) KENYA: Masai Mara National Reserve (MMNR) and associated wildlife dispersal areas of Koiyaki, Lemek, OlChorro Oirowua, Olkinyei, Siana, Maji Moto, Naikara, Siapei, Naboisho, Lower Mau and Mosiro.
2.2 CLIMATE AND HYDROLOGYThe Serengeti-Mara ecosystem climate is tropical with distinct wet and dry seasons. There is a rainfall gradient south to north and west to east. The northern and western parts receive more rainfall than the southern and eastern parts.
The Serengeti-Mara ecosystem climate is tropical and usually warm and dry; with mean monthly maximum temperature of 27-28°C all year round and a mean monthly minimum temperature of 13-16°C (Sinclair and Arcese 1995; Sinclair et al., 2000). Rainfall is governed by relief and the seasonal movement of global air masses that form the inter-tropical convergence zone (ITCZ). This belt of rain-laden winds moves north and south across the equator and brings two main periods of rain between March - June and November-December, although the timing varies with location. The pattern of rainfall is often erratic, with both extreme wet and dry years.
March-June and November-December characterize the two rainy seasons though variations do occur from place to place. The Mau complex receives the highest rainfall (1000-1750 mm/year) while in the middle ranges receive 900-1000 mm/year. Lowlands such as the south east plains are the most arid with 500-800 mm/year.
Mara River is the main source of available surface water both for wildlife and human use. Other important rivers in the ecosystem include Sand, Orangi-Grumeti and Mbalageti . Studies have established two peaks in Mara River water discharge that correspond to the peaks in the rainfall pattern. The June peak that corresponds with the wildebeest migration has created what has now become the 7th wonder of the new world. Although the river has always been permanent, drought and erratic rainfall coupled with unprecedented destruction of the water catchment area (especially the Mau forest complex) saw the Mara River dry up in 2009.
13Aerial Count Report 2014 page
Serengeti-Mara Aerial Elephant and Buffalo Count Report
2.3 TOPOGRAPHY AND SOILSThe topography and soils of the Serengeti-Mara ecosystem are comprehensively covered in the Serengeti-Masai Mara trans-boundary protection and monitoring plan (EAC, 2012). The basement complex of the ecosystem is made of very old igneous and metamorphic rocks of pre-cambrian age. Erosion and volcanic activities have changed the surface of this ecosystem to the present topographic forms characterized by extensive plains, hill crops as well as escarpments and valleys. The rangelands and escarpments are characterized by rich volcanic soils while poorly drained brown soils occur in the plateaus and plains where extensive grasslands are common. River basins and valleys have clay soils enriched with accumulated sediments.
2.4 FAUNAThe Serengeti- Mara plains are internationally famous for having the highest density and most diverse combination of large herbivores on earth. Some of these herbivores are renowed for their seasonal migration between the Mara and Serengeti plains. The major herbivores are elephant (Loxodonta africana), African buffalo (Syncerus caffer), wildebeest (Connochaetes taurinus), Cape eland (Taurotragus oryx), Coke’s hartebeest (Alcephalus buselaphus cokii), Burchell’s zebra (Equus quagga burchelli), impala (Aepyceros melampus), giraffe (Giraffa camelopardalis), black rhinoceros (Diceros bicornis), hippopotamus (Hippopotamus amphibius) and Grant’s gazelle (Gazella grantii).
The common carnivores are leopard (Panthera pardus), lion (Panthera leo), cheetah (Acinonyx jubatus), black-backed jackal (Canis mesomelas), wild dog (Lycaon pictus), spotted hyaena (Crocuta crocuta). Other species found in the ecosystem include the olive baboon (Papio anubis), vervet monkey (Chlorocebus pygerythrus), black and white colobus (Colobus satanas) and Patas monkeys (Erythrocebus patas).
2.5 FLORAThe Serengeti-Mara ecosystem is dominated by savannah grasslands and acacia woodlands. The tree species dominating the area include Acacia seyal var fistula, Acacia tortilis, Acacia polyacantha and Euphorbia candelabrum while the dominant grass species are Eragrostis cyndiflora, Chloris pycnothrix, Pennisetum meziannum and Themeda triandra (Rusch et al. 2005).
14Aerial Count Report 2014 page
Serengeti-Mara Aerial Elephant and Buffalo Count Report
2.6 ECONOMIC ACTIVITIESThe Serengeti-Mara ecosystem is characterized by a number of economic activities, top of which is tourism. The two main parks; Serengeti National Park in Tanzania and Masai Mara National Reserve in Kenya are the most visited in both countries. This core protected area is surrounded by private and community conservancies, community ranches and game controlled areas. Livestock rearing is a common practice in this region where local communities keep cattle, sheep and goats. Game hunting is undertaken in the game reserves, open areas, wildlife management areas, forest reserves and controlled areas in Tanzania, while this is not permitted in any national parks, , Ngorongoro Conservation Area, or anywhere in Kenya.
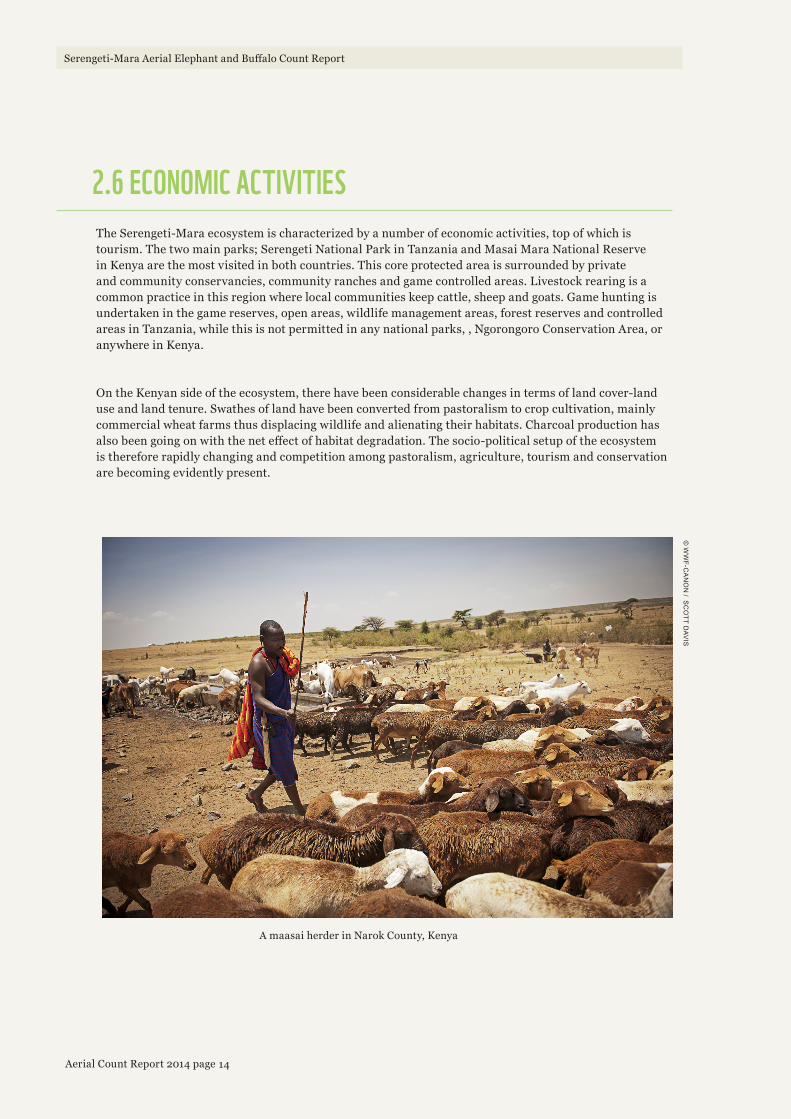
On the Kenyan side of the ecosystem, there have been considerable changes in terms of land cover-land use and land tenure. Swathes of land have been converted from pastoralism to crop cultivation, mainly commercial wheat farms thus displacing wildlife and alienating their habitats. Charcoal production has also been going on with the net effect of habitat degradation. The socio-political setup of the ecosystem is therefore rapidly changing and competition among pastoralism, agriculture, tourism and conservation are becoming evidently present.
A maasai herder in Narok County, Kenya
© W
WF-C
AN
ON
/ SC
OT
T DAV
IS

15Aerial Count Report 2014 page
3.0 MATERIALS AND METHODSThe Serengeti-Mara cross-border aerial total count was a synchronized undertaking between Kenya and Tanzania. Survey teams were based at Seronera in Tanzania and Narok in Kenya. The survey followed the principles prescribed by Douglas-Hamilton (1996) and Norton–Griffiths (1978). A total of five aircrafts were used during the survey; four 4-seater Cessna 182 aircrafts and one 2-seater Aviat Husky aircraft (Table 1). Markers were fitted on either side of the plane struts to guide the observers in distance estimation.
Plane Registration Plane Type Seat capacity Country 5H-‐ZGF Cessna 182 4 Tanzania 5H-‐GNU/5H MPK Cessna 182 4 Tanzania 5H-‐CFA Cessna 182 4 Tanzania 5Y-‐BCA Cessna 182 4 Kenya 5Y-‐KWC Aviat Husky 2 Kenya
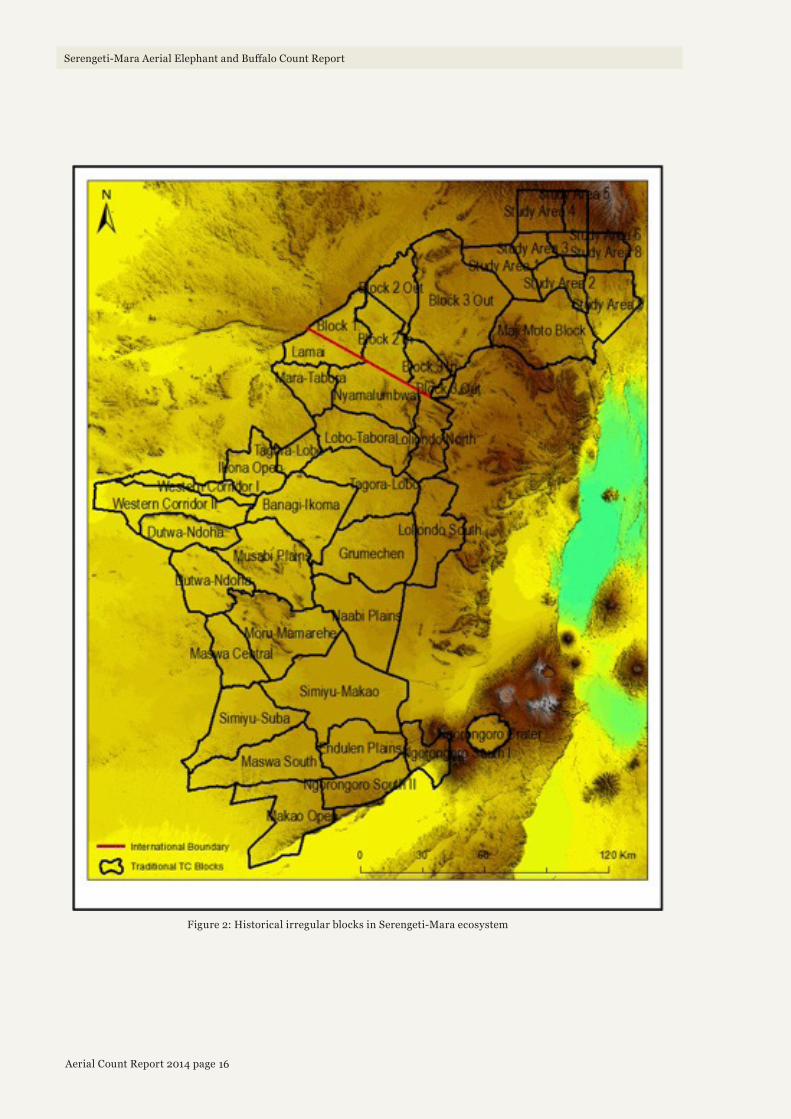
3.1 BLOCK DESIGN AND FLIGHT PLANIn the past, aerial total counts by both Kenya and Tanzania were based on irregular counting blocks defined by physical features such as rivers, ridges and roads. The blocks were designed to easily identify the beginning and the end of the block and were difficult to navigate for both the pilot and the Front Seat Observer (FSO). In addition, such physical features became the turning points of each survey transect which increased chances of making errors associated with double counts (Douglas-Hamilton 1996).
To address challenges encountered in the past, regular census blocks were designed that were easily navigable using GPS (Global Positioning System) technology. The average block size was set at 900 km² which was calculated to be the average area a plane would comfortably survey in a day for a maximum of six hours. A total of 42 census blocks, three of which astride the international border were surveyed.
The southern part of the ecosystem was surveyed from19th May to 6thJune2014 while the northern part was surveyed from 27th May to 1stJune 2014. The census blocks that run astride the international border were surveyed concurrently over two days by both teams to minimize bias .The surveyed area covered a total of 30,953 km².
Serengeti-Mara Aerial Elephant and Buffalo Count Report
Table 1: Aircraft used during census
16Aerial Count Report 2014 page
Serengeti-Mara Aerial Elephant and Buffalo Count Report
Figure 2: Historical irregular blocks in Serengeti-Mara ecosystem
17Aerial Count Report 2014 page
Serengeti-Mara Aerial Elephant and Buffalo Count Report
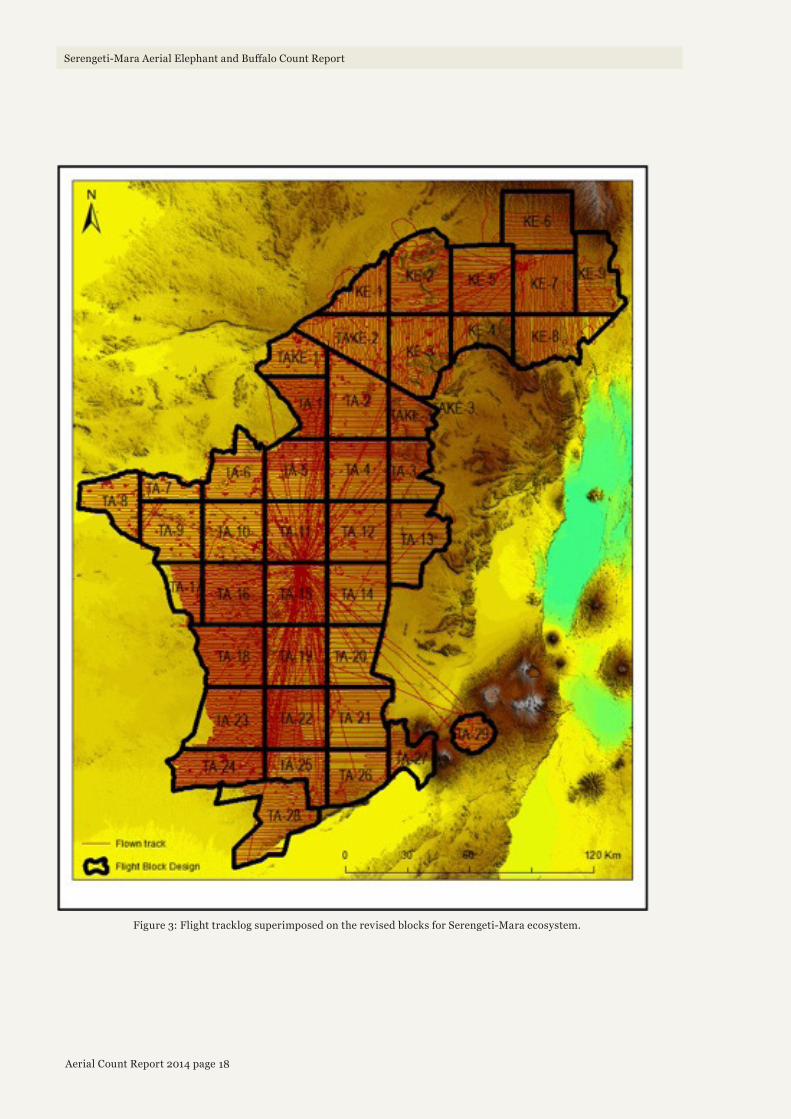
Flight lines were laid out in primarily both north-south (Mara) and east-west (Serengeti) directions, however, in areas where the topography was rugged and difficult to navigate through (like hill tops and deep valleys), transects were flown in the most suitable manner that ensured safety of the crews and the planes without compromising the survey quality and objectives (Figure 3).
Elephant herds with more than ten individuals and buffalo herds with more than 20 individuals were circled to ensure all individuals were counted. High-resolution digital photographs (minimum 12 megapixels, GSD (resolution) typically 5 cm or better) were also taken for photo correction of observed herds.
Each block was systematically surveyed with aircraft flying at a target altitude of 350-400 ft above ground and a speed of 120-180 km/hour average. The survey was guided by established transects spaced at 0.6, 1.0, 1.2 and 2 km depending on the habitat type.
Crews were instructed to modify their flying patterns to ensure complete visual coverage of the block. Effective spacing was occasionally increased in very open habitats and often reduced in denser habitats, with aircraft searching particularly dense areas as a single unit.
18Aerial Count Report 2014 page
Serengeti-Mara Aerial Elephant and Buffalo Count Report
Figure 3: Flight tracklog superimposed on the revised blocks for Serengeti-Mara ecosystem.
19Aerial Count Report 2014 page
Serengeti-Mara Aerial Elephant and Buffalo Count Report
3.2 TRAINING OF SURVEY CREWEach crew underwent a two-day intensive training for all enumerators and observers. This training focused on:
• Crew communication – clear communication of detection and need to circle large groups
• Group estimation and photography
• Use and handling of equipment (GPS receivers, voice recorders and cameras)
• Navigation within block
• Species identification and enumeration, and elephant carcass aging
The training was divided into both theoretical and practical sessions.
3.3 DATA CAPTURE AND HANDLINGIn-flight data was captured by use of GPS, voice recorders and datasheet. Digital cameras were used to capture large herds which enabled the census team to correct or confirm visual observations. GPS data collected in-flight were downloaded using DNR Garmin® software and Garmin Basecamp© Version 4.3.1. These data included waypoints for observed events and tracks for flight lines. Voice records were downloaded, transcribed and entered into survey datasheet as well as databases. The GPS waypoints and transcribed voice data from datasheet were matched to create complete observation records that were imported into ArcGIS R 10.1 for analyses.
3.4 DATA ANALYSISDouble counts due to flight overlaps were identified and cleaned:
• Crews mapped and discussed observations in-flight, removing duplicate herds after checking previous flight line observations;
• Same-day, same-session observations (between-aircraft) were mapped and likely duplicate herds removed on the basis of proximity (< 1.5 km);
• Observations from blocks that were flown with > 1 day separation were divided by the block boundary and only duplicates of large herds (> 10) were checked for duplicate observation, guarding against double-observation of large herds but assuming that random movement of small herds could not be caught or detected over longer periods of time.
Descriptive statistics were used for summation of numbers. Data from past censuses that were carried out at the same time by both countries were used to undertake trend analysis. Spatial analysis and Kernel density analysis were undertaken using Arc GIS 10.1 to generate distribution and density maps.
20Aerial Count Report 2014 page
Serengeti-Mara Aerial Elephant and Buffalo Count Report
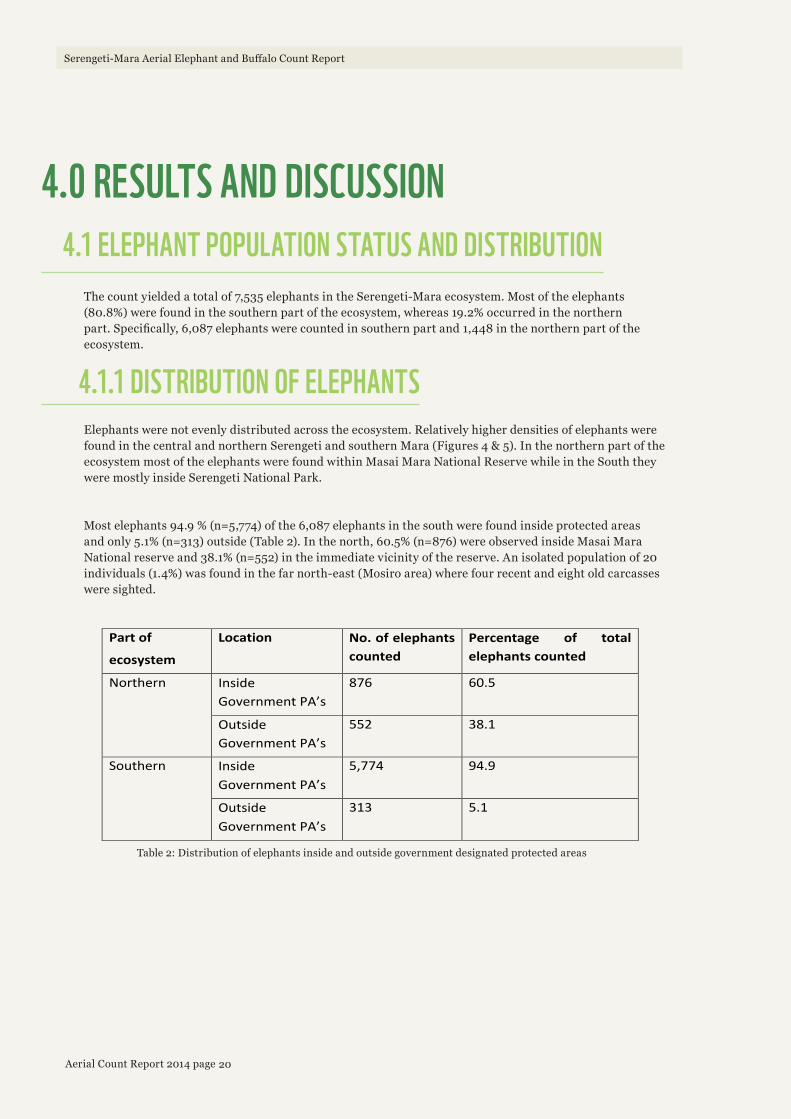
4.0 RESULTS AND DISCUSSION 4.1 ELEPHANT POPULATION STATUS AND DISTRIBUTION
The count yielded a total of 7,535 elephants in the Serengeti-Mara ecosystem. Most of the elephants (80.8%) were found in the southern part of the ecosystem, whereas 19.2% occurred in the northern part. Specifically, 6,087 elephants were counted in southern part and 1,448 in the northern part of the ecosystem.
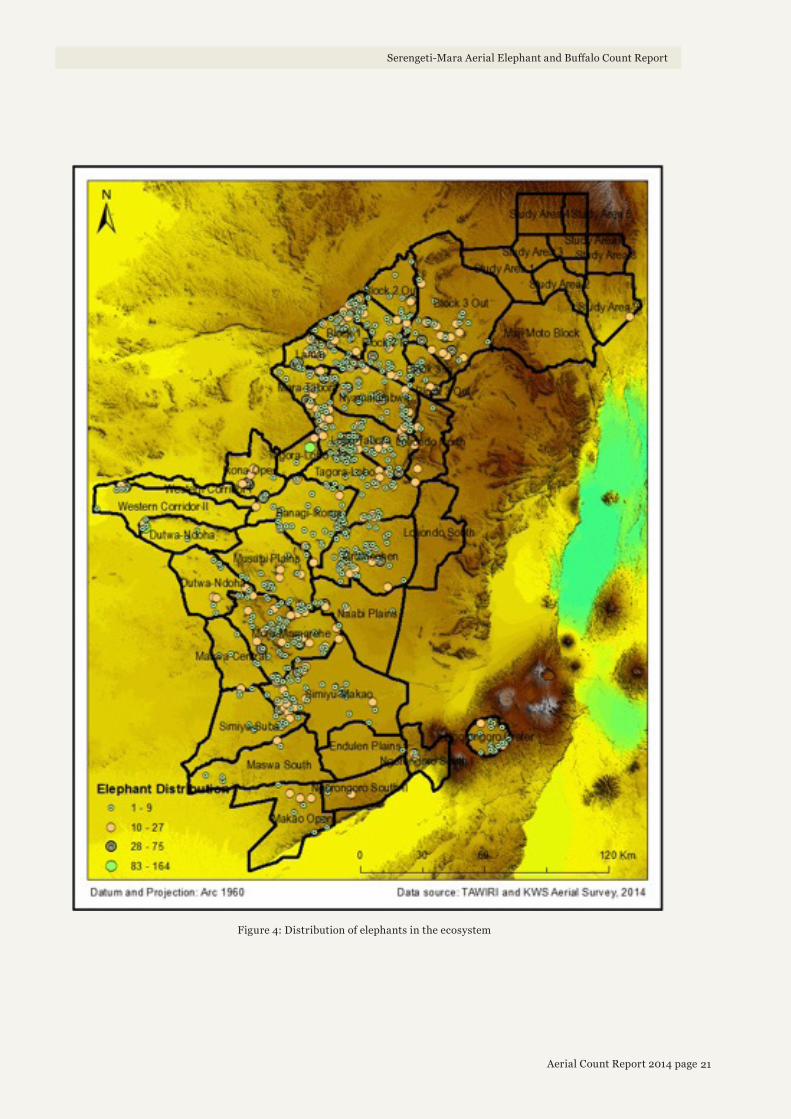
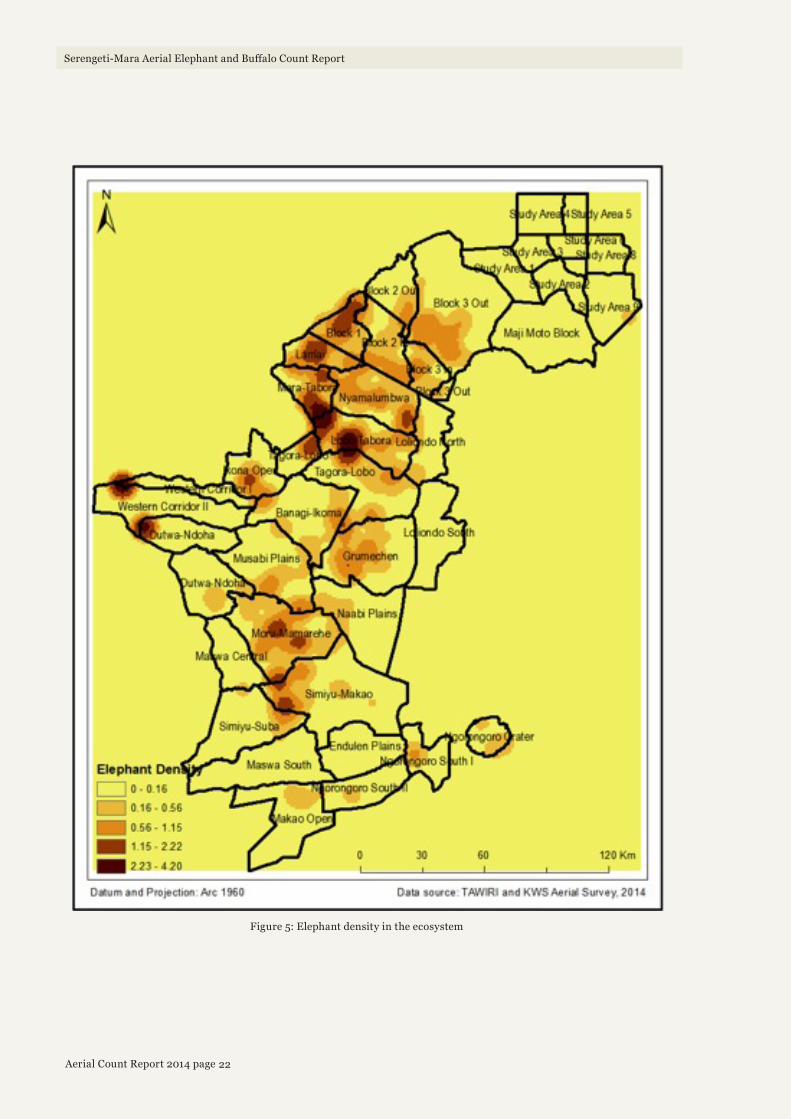
4.1.1 DISTRIBUTION OF ELEPHANTSElephants were not evenly distributed across the ecosystem. Relatively higher densities of elephants were found in the central and northern Serengeti and southern Mara (Figures 4 & 5). In the northern part of the ecosystem most of the elephants were found within Masai Mara National Reserve while in the South they were mostly inside Serengeti National Park.
Most elephants 94.9 % (n=5,774) of the 6,087 elephants in the south were found inside protected areas and only 5.1% (n=313) outside (Table 2). In the north, 60.5% (n=876) were observed inside Masai Mara National reserve and 38.1% (n=552) in the immediate vicinity of the reserve. An isolated population of 20 individuals (1.4%) was found in the far north-east (Mosiro area) where four recent and eight old carcasses were sighted.
Part of
ecosystem
Location No. of elephants counted
Percentage of total elephants counted
Northern Inside Government PA’s
876 60.5
Outside Government PA’s
552 38.1
Southern Inside Government PA’s
5,774 94.9
Outside Government PA’s
313 5.1
Table 2: Distribution of elephants inside and outside government designated protected areas
21Aerial Count Report 2014 page
Figure 4: Distribution of elephants in the ecosystem
Serengeti-Mara Aerial Elephant and Buffalo Count Report
22Aerial Count Report 2014 page
Serengeti-Mara Aerial Elephant and Buffalo Count Report
Figure 5: Elephant density in the ecosystem
23Aerial Count Report 2014 page
Serengeti-Mara Aerial Elephant and Buffalo Count Report
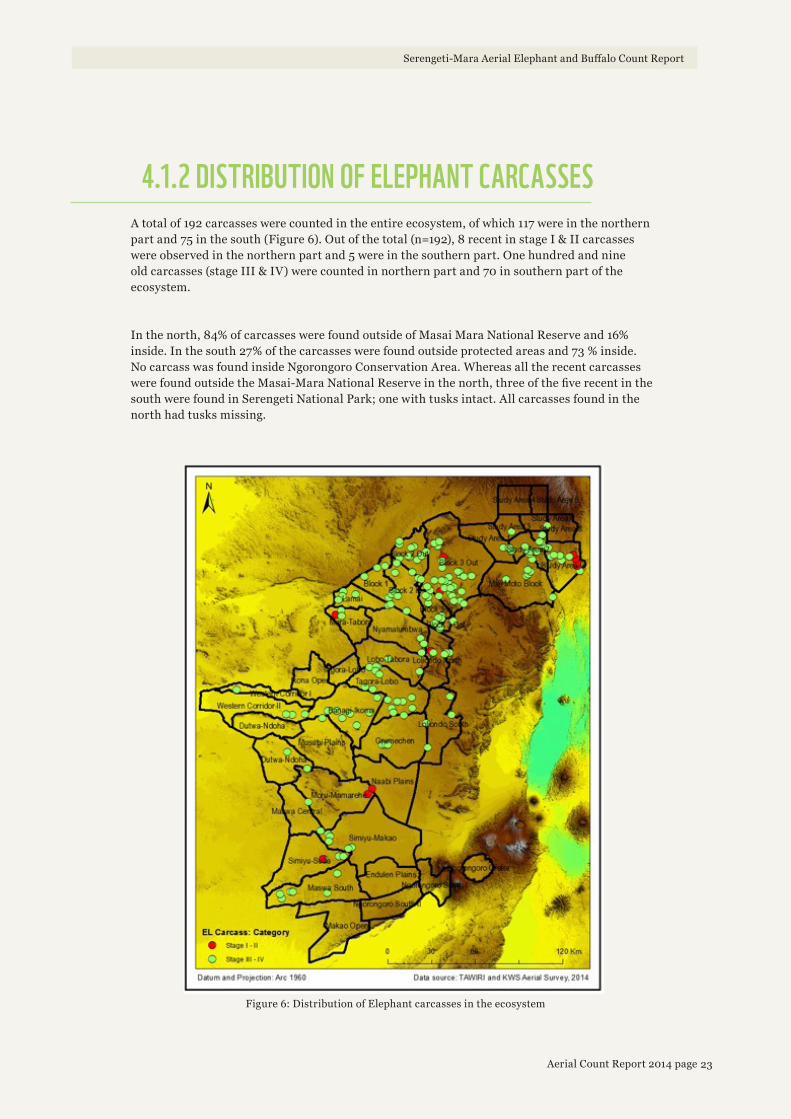
4.1.2 DISTRIBUTION OF ELEPHANT CARCASSES A total of 192 carcasses were counted in the entire ecosystem, of which 117 were in the northern part and 75 in the south (Figure 6). Out of the total (n=192), 8 recent in stage I & II carcasses were observed in the northern part and 5 were in the southern part. One hundred and nine old carcasses (stage III & IV) were counted in northern part and 70 in southern part of the ecosystem.
In the north, 84% of carcasses were found outside of Masai Mara National Reserve and 16% inside. In the south 27% of the carcasses were found outside protected areas and 73 % inside. No carcass was found inside Ngorongoro Conservation Area. Whereas all the recent carcasses were found outside the Masai-Mara National Reserve in the north, three of the five recent in the south were found in Serengeti National Park; one with tusks intact. All carcasses found in the north had tusks missing.
Figure 6: Distribution of Elephant carcasses in the ecosystem
24Aerial Count Report 2014 page
Serengeti-Mara Aerial Elephant and Buffalo Count Report
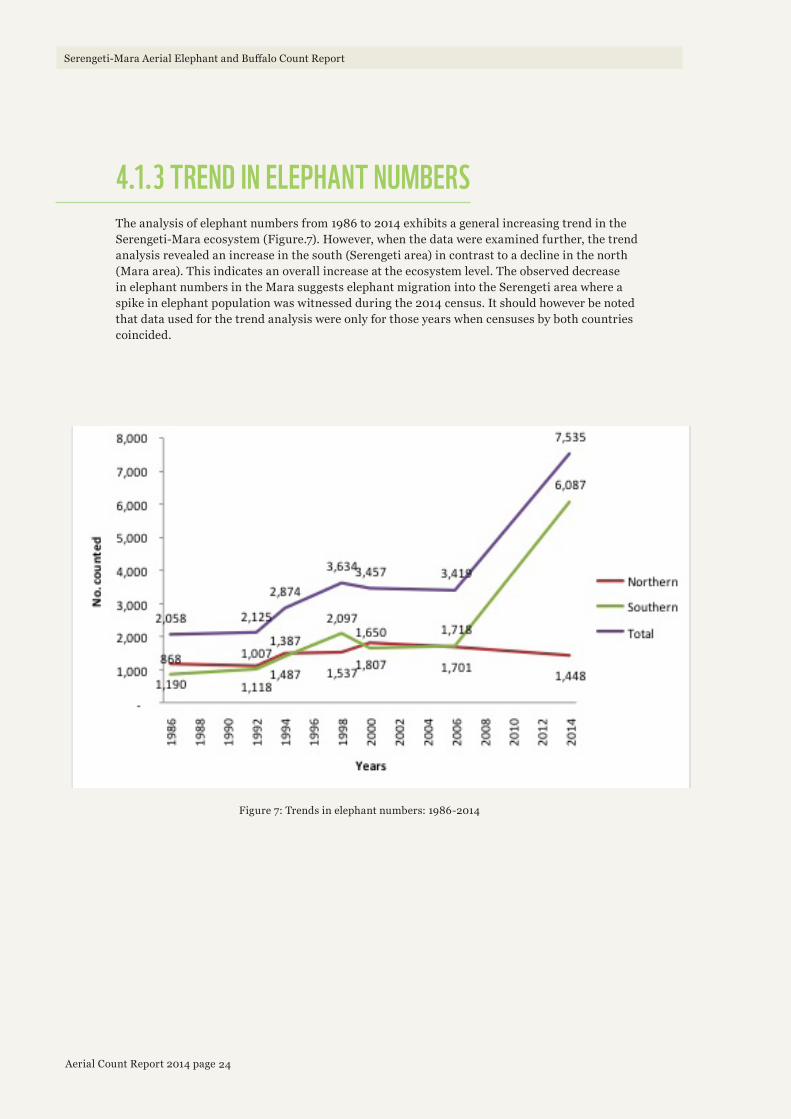
4.1.3 TREND IN ELEPHANT NUMBERSThe analysis of elephant numbers from 1986 to 2014 exhibits a general increasing trend in the Serengeti-Mara ecosystem (Figure.7). However, when the data were examined further, the trend analysis revealed an increase in the south (Serengeti area) in contrast to a decline in the north (Mara area). This indicates an overall increase at the ecosystem level. The observed decrease in elephant numbers in the Mara suggests elephant migration into the Serengeti area where a spike in elephant population was witnessed during the 2014 census. It should however be noted that data used for the trend analysis were only for those years when censuses by both countries coincided.
Figure 7: Trends in elephant numbers: 1986-2014
25Aerial Count Report 2014 page
Serengeti-Mara Aerial Elephant and Buffalo Count Report
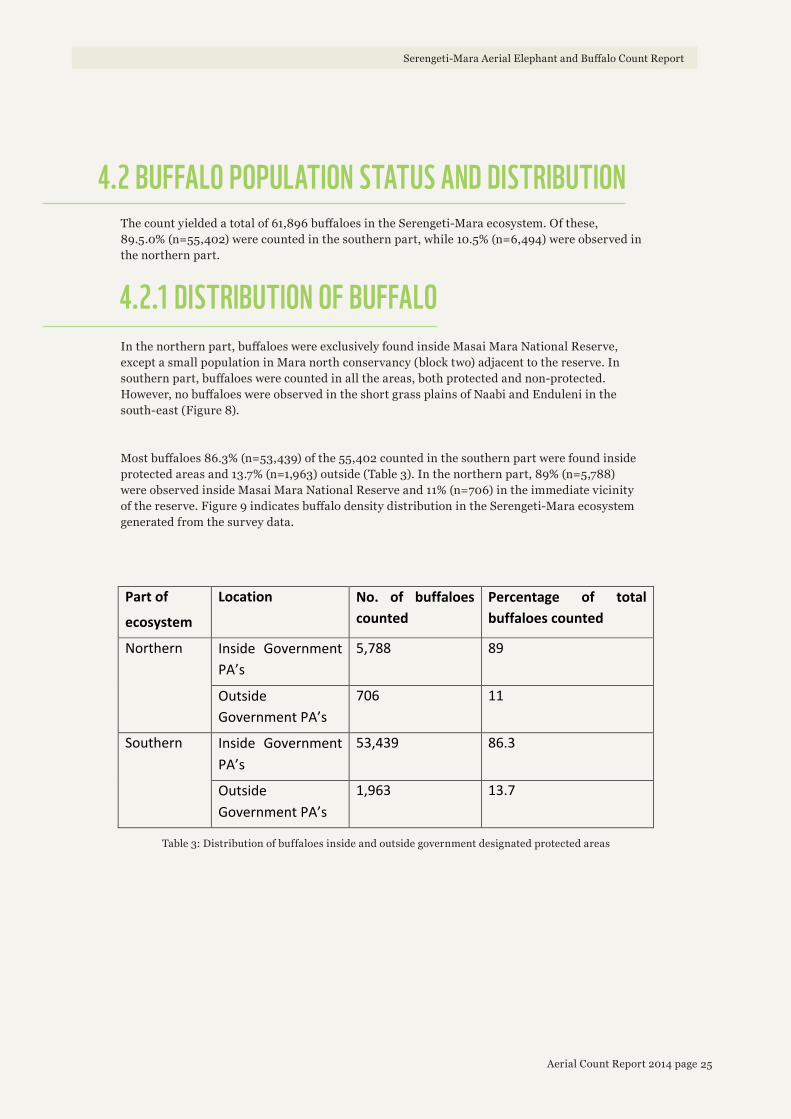
4.2 BUFFALO POPULATION STATUS AND DISTRIBUTIONThe count yielded a total of 61,896 buffaloes in the Serengeti-Mara ecosystem. Of these, 89.5.0% (n=55,402) were counted in the southern part, while 10.5% (n=6,494) were observed in the northern part.
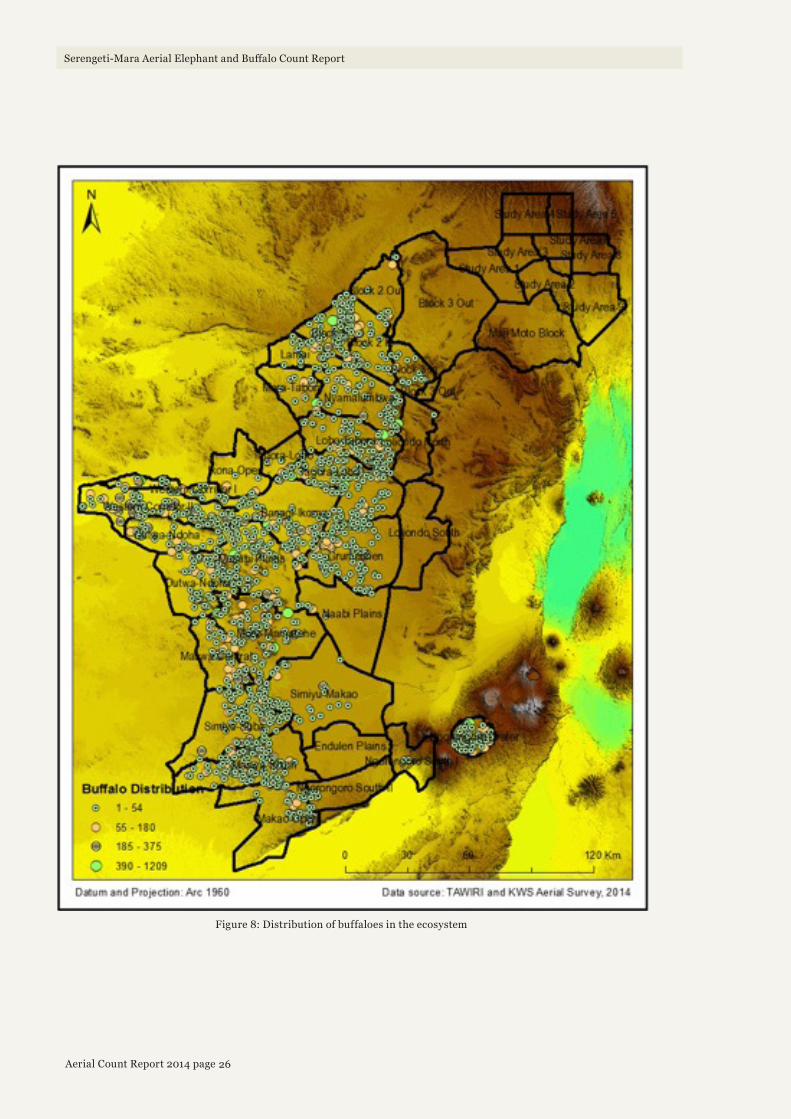
4.2.1 DISTRIBUTION OF BUFFALOIn the northern part, buffaloes were exclusively found inside Masai Mara National Reserve, except a small population in Mara north conservancy (block two) adjacent to the reserve. In southern part, buffaloes were counted in all the areas, both protected and non-protected. However, no buffaloes were observed in the short grass plains of Naabi and Enduleni in the south-east (Figure 8).
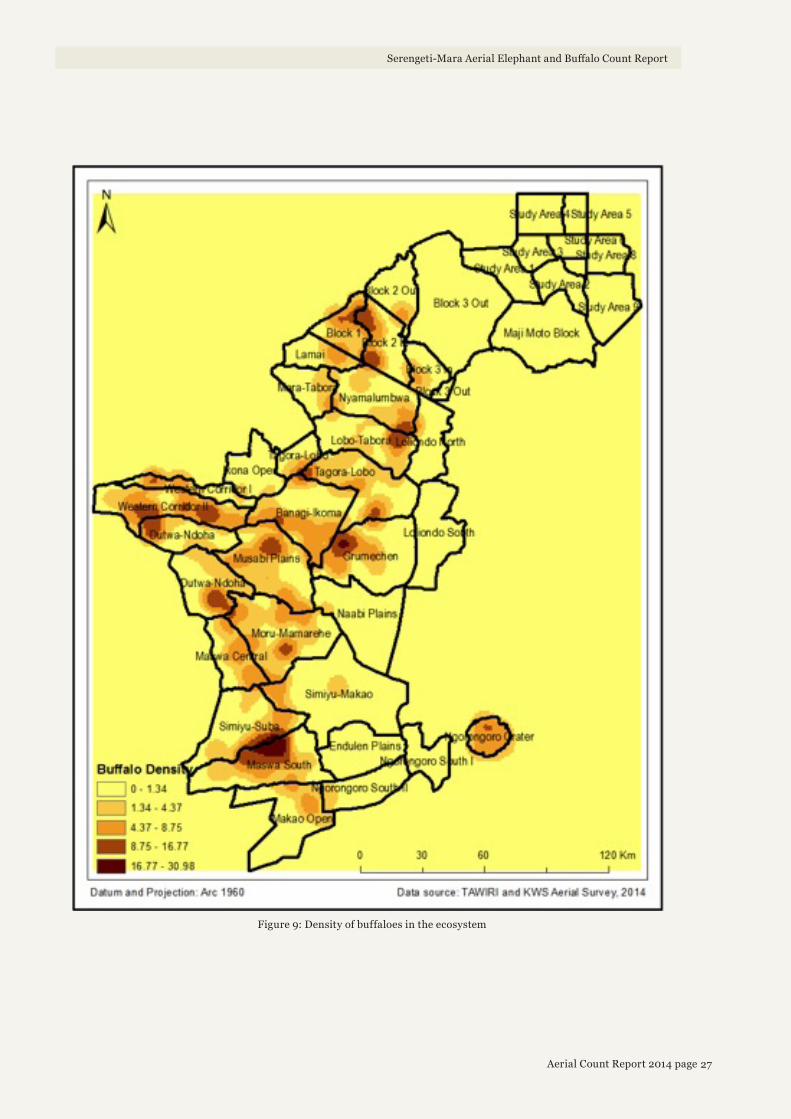
Most buffaloes 86.3% (n=53,439) of the 55,402 counted in the southern part were found inside protected areas and 13.7% (n=1,963) outside (Table 3). In the northern part, 89% (n=5,788) were observed inside Masai Mara National Reserve and 11% (n=706) in the immediate vicinity of the reserve. Figure 9 indicates buffalo density distribution in the Serengeti-Mara ecosystem generated from the survey data.
Part of
ecosystem
Location No. of buffaloes counted
Percentage of total buffaloes counted
Northern Inside Government PA’s
5,788 89
Outside Government PA’s
706 11
Southern Inside Government PA’s
53,439 86.3
Outside Government PA’s
1,963 13.7
Table 3: Distribution of buffaloes inside and outside government designated protected areas
26Aerial Count Report 2014 page
Serengeti-Mara Aerial Elephant and Buffalo Count Report
Figure 8: Distribution of buffaloes in the ecosystem
27Aerial Count Report 2014 page
Figure 9: Density of buffaloes in the ecosystem
Serengeti-Mara Aerial Elephant and Buffalo Count Report
28Aerial Count Report 2014 page
Serengeti-Mara Aerial Elephant and Buffalo Count Report
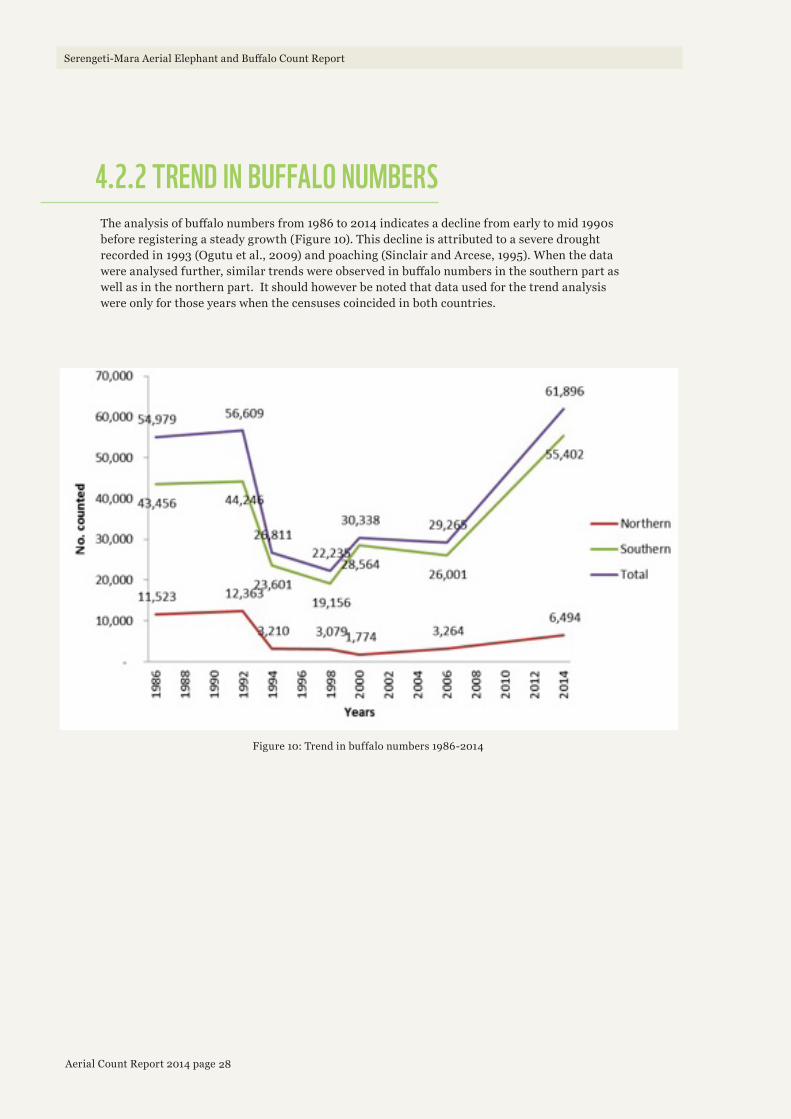
4.2.2 TREND IN BUFFALO NUMBERSThe analysis of buffalo numbers from 1986 to 2014 indicates a decline from early to mid 1990s before registering a steady growth (Figure 10). This decline is attributed to a severe drought recorded in 1993 (Ogutu et al., 2009) and poaching (Sinclair and Arcese, 1995). When the data were analysed further, similar trends were observed in buffalo numbers in the southern part as well as in the northern part. It should however be noted that data used for the trend analysis were only for those years when the censuses coincided in both countries.
Figure 10: Trend in buffalo numbers 1986-2014
29Aerial Count Report 2014 page
5.0 CONCLUSIONThe number of elephants and buffaloes in the ecosystem recorded an increase that can be attributed to births and immigration but this needs to be verified by more detailed analysis of the parameters. Elephant numbers in the northern part indicated a decrease from the previous survey whereas the numbers in the southern part recorded an increase. This can be interpreted to mean that there was movement of elephants from the north to the south although we cannot rule out factors such as poaching and land use changes as having an influence. More elephants and buffaloes were found inside government designated protected areas compared to other locations that were surveyed.
More elephant carcasses were counted in the Northern part of the ecosystem compared to the southern part. Most of the carcasses in the northern part were concentrated outside the government designated protected area whereas in the south they were inside the protected areas.
Collaboration between the two countries in carrying out this census has shown that there are several benefits in joint planning, execution, analysis of data, interpretation of results and reporting. Carrying out independent censuses by the two countries does not allow for investigation of factors responsible for observed dynamics.
• Future collaboration in carrying out censuses should be enhanced to include joint planning, joint resource mobilisation, joint training, one operation base and one census team.
• Intensify security surveillance in Mosiro where a herd of 20 elephants was sighted isolated and vulnerable. This calls for immediate mobilization of resources to identify an ecologically suitable site to relocate this herd.
• Carry out an intensive study to determine the probable factors that might have influenced the variation in the numbers observed and distribution of elephants during the 2014 census compared to previous censuses.
• Collect and collate existing data and information to document change in land use and possible impact on elephant and buffalo distribution.
• Carry out a study to advise on the most appropriate management approaches to address observed shifts in elephant distribution, numbers and land use changes.
• KWS and TAWIRI to deploy collars on elephants to determine spatial and temporal movement patterns.
• Develop a framework for a long term joint transboundary wildlife monitoring programme.
• Complement aerial censuses with ground surveys to collect demographic parameters on elephants.
• Develop a correction factor for visual counts and photographs for each census.
• Carry out a study on ecosystem services in the surveyed area.
• Carry out an audit to determine causes of elephant mortality identified during each census
6.0 RECOMMENDATIONS
Serengeti-Mara Aerial Elephant and Buffalo Count Report
30Aerial Count Report 2014 page
Serengeti-Mara Aerial Elephant and Buffalo Count Report
7.0 REFERENCESDouglas-Hamilton, I. 1996. ‘Counting Elephants from the Air: Total Counts’. Studying Elephants, 28–37.
East African Legislative Assembly. 2010. The East African Community Transboundary Ecosystems Management Bill.
Frederick, H. 2014. ‘Elephant Carcass Aging and Identification’. Powerpoint, May 15. www.underdiverwaterman.com.
Garmin. 2014. Garmin Basecamp (version 4.3.3). OS X 10.9 (version 4.3.3). Garmin Ltd.
Jachmann, H. 2001. Estimating Abundance of African Wildlife: An Aid to Adaptive Management. Springer Netherlands.
MDNR. 2013. DNR Garmin (version 5.4.1). WIndows 7 (version 5.4.1). State of Minnesota.
Norton-Griffiths, Mike. 1978. Counting Animals. Nairobi: African Wildlife Foundation.
Ogutu J.O, Piepho, H.P, Dublin, H.T, Bhola, N and Reid, R.S. 2009. Dynamics of Mara-Serengeti Ungulates in relation to land use changes. Journal of Zoology Pg 1-14.
Rusch, Graciela M., Sigbjørn Stokke, Eivin Røskaft, G. Mwakelebe, Harald Wiik, Jon M. Arnemo, R. D. Lyamuya, and others. 2005. ‘Human-Wildlife Interactions in Western Serengeti, Tanzania’. NINA Rapport 85: 47 Pp. 85. http://www.nina.no/Publikasjoner/Publication.aspx?pubid=2626.
Sinclair, A. R. E., and P. Arcese. 1995. ‘Population Consequences of Predation-Sensitive Foraging: The Serengeti Wildebeest’. Ecology, 882–91.i
Sinclair, A. R. E., Simon AR Mduma, and Peter Arcese. 2000. ‘What Determines Phenology and Synchrony of Ungulate Breeding in Serengeti?’ Ecology 81 (8): 2100–2111.
Sinclair, A.R.E., and Arcese, P.M. (Eds.). (1995). Serengeti II: Dynamics, Management, and Conservation of an Ecosystem. University of Chicago Press Chicago
31Aerial Count Report 2014 page
Serengeti-Mara Aerial Elephant and Buffalo Count Report
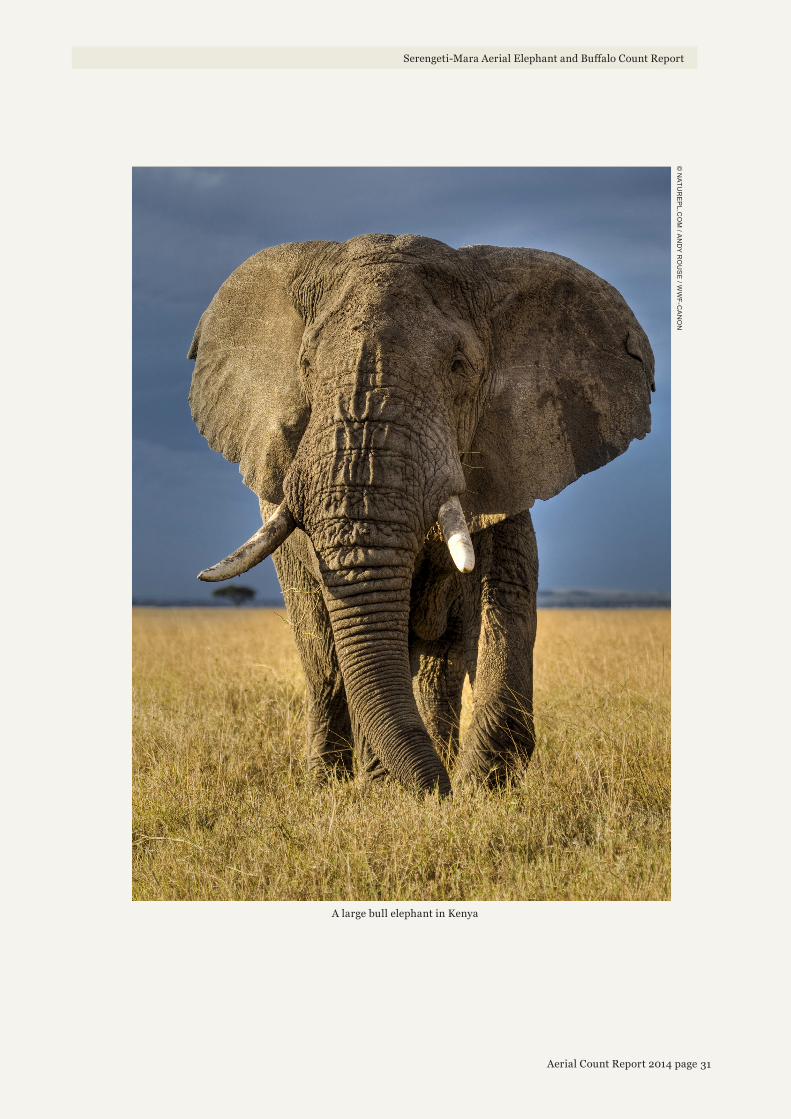
A large bull elephant in Kenya
© N
ATUR
EP
L.CO
M / A
ND
Y R
OU
SE
/ WW
F-CA
NO
N
• SERENGETI MARA AERIAL COUNT REPORT • JUNE 2014
Wildlife Division