Embed Size (px)
Citation preview
Aerobic Biodegradation of MTBE in Uncontaminated and Gasoline-ContaminatedAquifer Sediments
Jeff R. Zoeckler
Thesis submitted to the faculty of Virginia Polytechnic Institute and State University inpartial fulfillment of the requirements for the degree of
MASTER OF SCIENCE
in
ENVIRONMENTAL ENGINEERING
John T. Novak, ChairMark A. Widdowson, Co-Chair
Nancy G. Love
7/12/99
Blacksburg, Virginia
Keywords: MTBE, petroleum hydrocarbon compounds, acclimation, biodegradation,
microcosm, concentration, indigenous microorganisms
ii
Aerobic Biodegradation of MTBE in Uncontaminated and Gasoline-Contaminated
Aquifer Sediments
by
Jeff R. Zoeckler
Committee Chairman: John T. Novak and Mark. A Widdowson
(ABSTRACT)
In this study, the biodegradation potential of MTBE in uncontaminated and previously
contaminated aquifer sediments under aerobic conditions was investigated. Laboratory
microcosms were constructed using aquifer samples collected from three different areas
of a shallow gasoline-contaminated aquifer in eastern Fairfax Co., Va in the Atlantic
Coastal Plain province. Uncontaminated aquifer samples were collected upgradient of
the plume, and contaminated aquifer samples were collected in the source area and in an
area downgradient of the source. Biodegradation of MTBE was observed in microcosms
that contained previously contaminated aquifer sediments. More complete degradation
was observed in aquifer sediments containing a low level of petroleum contamination
than in heavily contaminated aquifer sediments. Biodegradation of MTBE appeared to
be limited by a lack of oxygen in heavily contaminated soils. When degradation was
discernible it appeared to follow a first order pattern with a rate constant (λ) of between
0.037 and 0.066 d-1, following a lag period of 20 to 40 days. In microcosms containing
lightly contaminated aquifer material, MTBE was respiked during active metabolism, and
degradation occurred with no lag or acclimation period. Results indicated that little or no
degradation occurred in the microcosms containing uncontaminated soil. The results of

iii
this research suggest that the availability and level of petroleum hydrocarbon compounds
influence indigenous microorganisms capable of degrading MTBE.
Keywords: MTBE, petroleum hydrocarbon compounds, acclimation, biodegradation,
microcosm, concentration, indigenous microorganisms
iv
ACKNOWLEDGEMENTS
I would first like to thank my co-chairs Dr. Mark Widdowson and Dr. John Novak
for their guidance in this project and assistance with this paper. I should also thank Dr.
Widdowson for providing me with financial assistance in this project. I would also like
to thank Dr. Novak for making it possible for me to attend the Battelle Bioremediation
conference, which was a great learning experience. I would also like to thank Dr. Nancy
Love for her assistance as a committee member.
I must thank Jody Smiley for the hours she spent helping me with GC and
headspace analyzer. Thank you to Julie Petruska for her help with laboratory equipment
and procedures. Thank you to Steve Brauner for his thoughts and comments in the
beginning stages of this project. Thank you to Betty Wingate for her secreterial
assistance. I would also like to thank Scott Crosswell and Jason Bivins for many
conversations in the lab that helped me through long days and nights. Several other
students (too many to mention) deserve thanks for helping make this experience an
enjoyable one.
The past two years would have been very difficult without the support and
companionship of Anita Cheng, for which I am extremely grateful. It would not have
been possible for me to complete this degree without the support of my parents, whose
encouragement has allowed me to pursue all of my goals in school and life.
v
TABLE OF CONTENTS
ABSTRACT...........................................................................................................ii
ACKNOWLEDGEMENTS................................................................................... iv
TABLE OF CONTENTS ...................................................................................... v
LIST OF FIGURES............................................................................................... vii
LIST OF TABLES ................................................................................................ viii
LITERATURE REVIEW...................................................................................... 1
BACKGROUND............................................................................................. 2
PROPERTIES OF MTBE................................................................................ 2
METHODS FOR DETERMINATION OF MTBE........................................... 3
ENVIRONMENTAL SIGNIFICANCE OF MTBE.......................................... 8
Occurrence in soil and groundwater .............................................................. 8
Environmental behavior of MTBE ................................................................ 8
Health effects associated with the use of MTBE............................................ 9
Health benefits........................................................................................... 9
Detrimental Health effects ......................................................................... 10
Regulatory issues.......................................................................................... 11
REMEDIAL STRATEGIES FOR MTBE........................................................ 11
Removal from soil and groundwater ............................................................. 11
Removal from drinking water ....................................................................... 12
BIODEGRADATION OF MTBE.................................................................... 12
Pathways for MTBE biodegradation ............................................................. 13
Biodegradation by pure and mixed enrichment cultures ................................ 15
Cometabolic biodegradation.......................................................................... 16
Intrinsic biodegradation ................................................................................ 17
Factors limiting biodegradation..................................................................... 19
LITERATURE CITED.................................................................................... 20
MANUSCRIPT: AEROBIC BIODEGRADATION OF MTBE IN
UNCONTAMINATED AND GASOLINE-CONTAMINATED AQUIFER
SEDIMENTS .................................................................................................. 27
vi
ABSTRACT.................................................................................................... 28
INTRODUCTION........................................................................................... 29
MATERIALS AND METHODS..................................................................... 32
Site Description ............................................................................................ 32
Sample Collection......................................................................................... 33
Groundwater Characterization....................................................................... 33
Characterization of Aquifer Sediments.......................................................... 34
Microcosm Construction and Analysis.......................................................... 35
Oxygen Utilization........................................................................................ 36
Evaluation of MTBE Degradation................................................................. 37
RESULTS AND DISCUSSION ...................................................................... 37
Characterization of Aquifer Sediments.......................................................... 37
Source area microcosms (MLS-1) ................................................................. 38
Downgradient microcosms (MLS-2) ............................................................. 41
Upgradient microcosms (SB-1)..................................................................... 43
CONCLUSIONS ............................................................................................. 44
PRACTICAL APPLICATIONS ...................................................................... 45
REFERENCES................................................................................................ 47
FIGURES AND TABLES FOR MANUSCRIPT............................................. 52
APPENDIX........................................................................................................... 64
VITA..................................................................................................................... 92
vii
LIST OF FIGURES FOR LITERATURE REVIEW
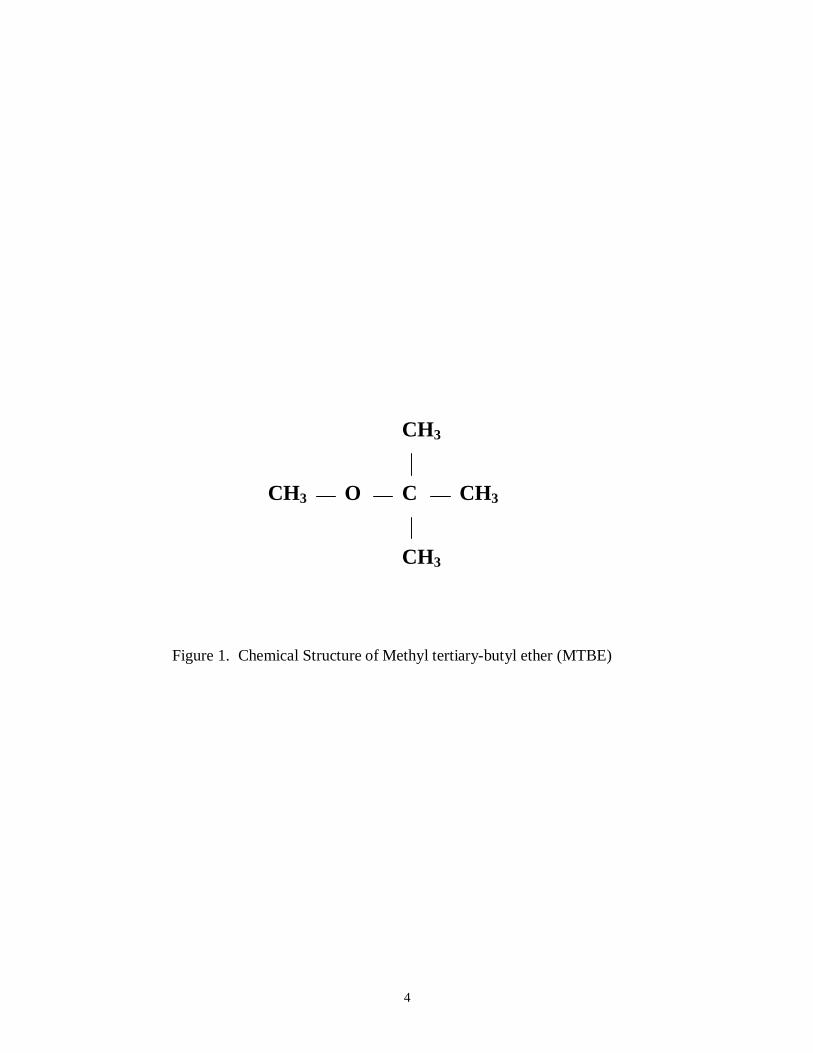
Figure 1: Chemical Structure of Methyl tert-butyl ether (MTBE)........................... 4
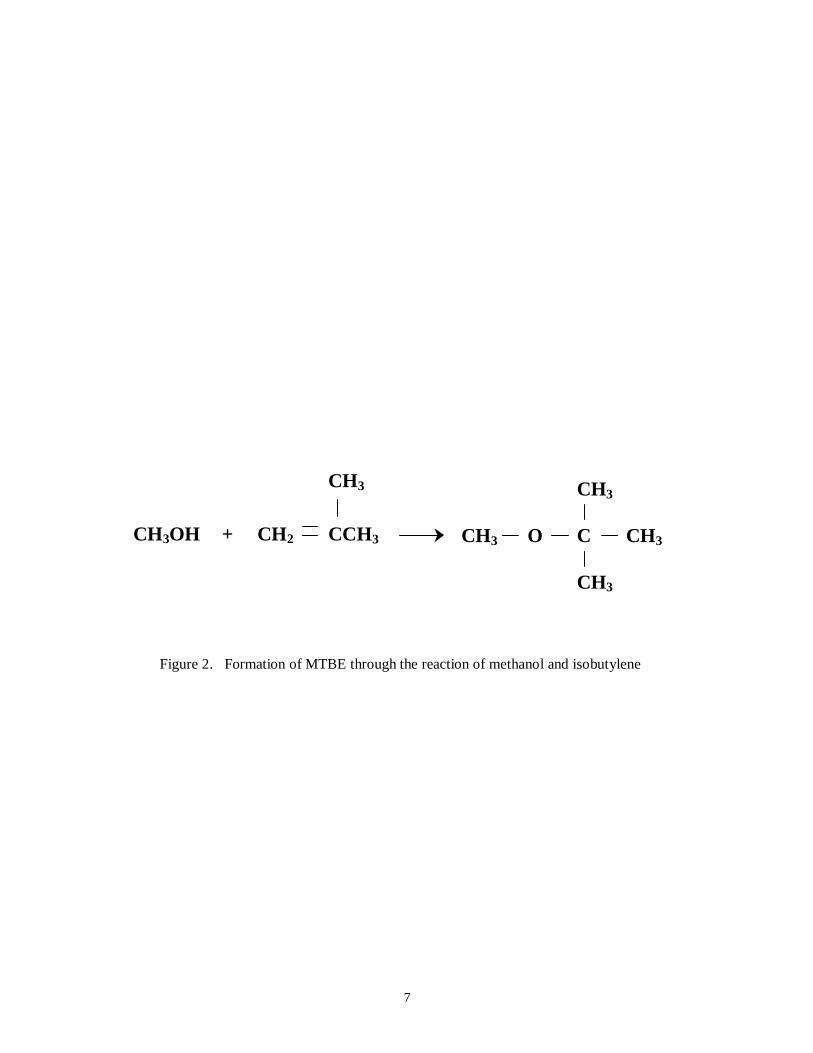
Figure 2: Formation of MTBE through the reaction of methanol andisobutylene ...................................................................................................... 7
Figure 3: Pathways for the initial transformation of MTBE.................................... 14
LIST OF FIGURES FOR MANUSCRIPT
Figure 1: Location of soil sampling. Upgradient, source area, anddowngradient soil borings are labeled SB-1, MLS-1, and MLS-2respectively...................................................................................................... 53
Figure 2: MTBE concentration in source area (MLS-1) microcosms; onlyMTBE was added ............................................................................................ 54
Figure 3: MTBE concentration in source area (MLS-1) microcosms.Spiked with MTBE toluene, and ethyl-benzene................................................ 55
Figure 4: MTBE concentration in downgradient (MLS-2) microcosms.Initially only MTBE was added ....................................................................... 56
Figure 5: MLS-2 microcosms amended with nutrients. (A) MTBEconcentration in live microcosms and controls, (B) Relative petroleumhydrocarbon concentration, (C) DO levels in live microcosms andcontrols............................................................................................................ 57
Figure 6: MTBE concentration in upgradient (SB-1) microcosms; onlyMTBE was added ............................................................................................ 58
Figure 7: MTBE concentration in upgradient (SB-1) microcosms; MTBE,toluene, and ethyl-benzene added..................................................................... 59
Figure 8: MTBE concentration in upgradient (SB-1) microcosms; MTBE,toluene, and nutrients added............................................................................. 60
viii
LIST OF TABLES FOR LITERATURE REVIEW
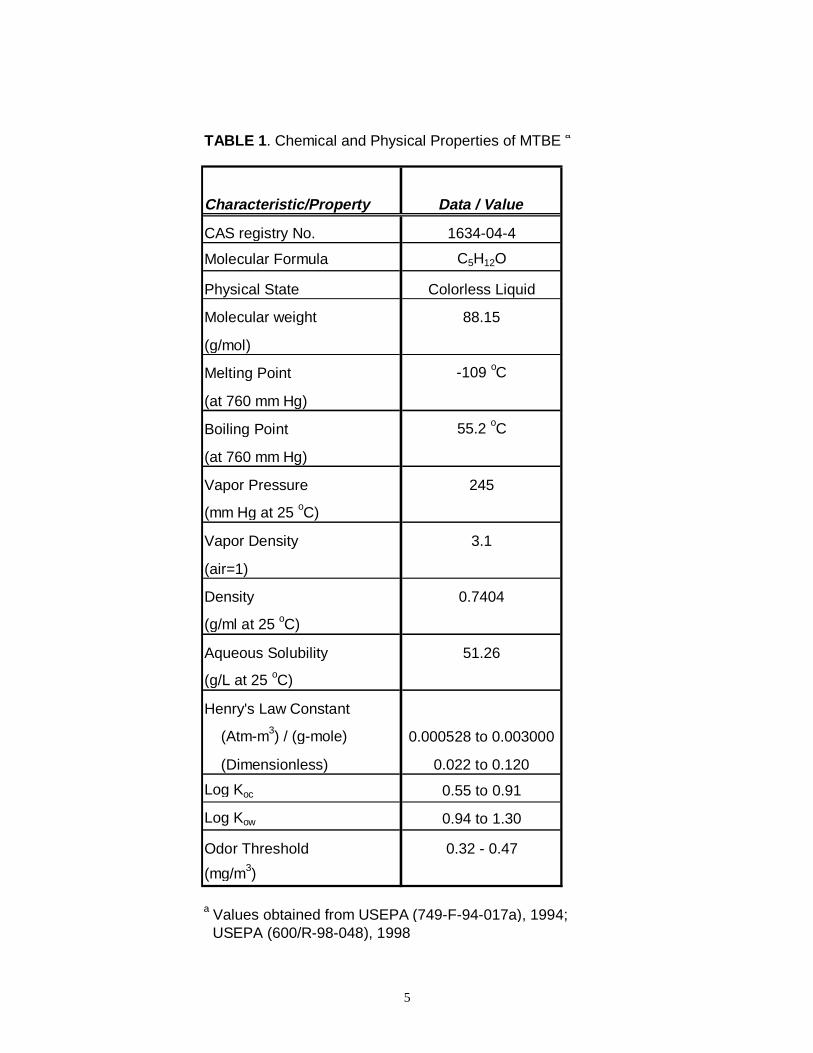
Table 1: Chemical and Physical Properties of MTBE............................................. 5
Table 2: Maximum solubility of MTBE and benzene in groundwater .................... 6
LIST OF TABLES FOR MANUSCRIPT
Table 1: Chemical Characteristics of Groundwater ................................................ 61
Table 2: Characteristics of Aquifer Sediments ....................................................... 62
Table 3: First-order Rate Constants for Source Area (MLS-1) Microcosms ........... 63
1
LITERATURE REVIEW
2
BACKGROUND
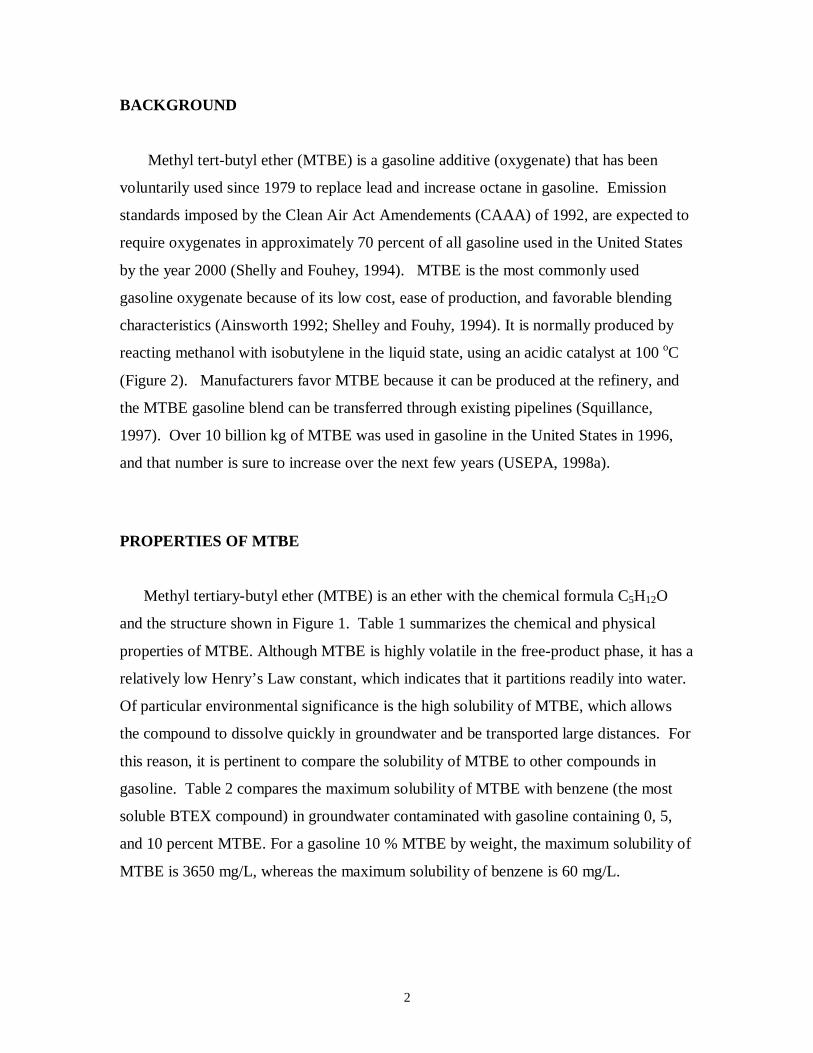
Methyl tert-butyl ether (MTBE) is a gasoline additive (oxygenate) that has been
voluntarily used since 1979 to replace lead and increase octane in gasoline. Emission
standards imposed by the Clean Air Act Amendements (CAAA) of 1992, are expected to
require oxygenates in approximately 70 percent of all gasoline used in the United States
by the year 2000 (Shelly and Fouhey, 1994). MTBE is the most commonly used
gasoline oxygenate because of its low cost, ease of production, and favorable blending
characteristics (Ainsworth 1992; Shelley and Fouhy, 1994). It is normally produced by
reacting methanol with isobutylene in the liquid state, using an acidic catalyst at 100 oC
(Figure 2). Manufacturers favor MTBE because it can be produced at the refinery, and
the MTBE gasoline blend can be transferred through existing pipelines (Squillance,
1997). Over 10 billion kg of MTBE was used in gasoline in the United States in 1996,
and that number is sure to increase over the next few years (USEPA, 1998a).
PROPERTIES OF MTBE
Methyl tertiary-butyl ether (MTBE) is an ether with the chemical formula C5H12O
and the structure shown in Figure 1. Table 1 summarizes the chemical and physical
properties of MTBE. Although MTBE is highly volatile in the free-product phase, it has a
relatively low Henry’s Law constant, which indicates that it partitions readily into water.
Of particular environmental significance is the high solubility of MTBE, which allows
the compound to dissolve quickly in groundwater and be transported large distances. For
this reason, it is pertinent to compare the solubility of MTBE to other compounds in
gasoline. Table 2 compares the maximum solubility of MTBE with benzene (the most
soluble BTEX compound) in groundwater contaminated with gasoline containing 0, 5,
and 10 percent MTBE. For a gasoline 10 % MTBE by weight, the maximum solubility of
MTBE is 3650 mg/L, whereas the maximum solubility of benzene is 60 mg/L.
3
METHODS FOR DETERMINATION OF MTBE
There are several methods that can be used for the detection of MTBE in water.
The most reliable methods use purge-and-trap capillary column gas
chromatography/mass spectrometry (GC/MS). The GC/MS methods typically provide
positive identification of specific constituents in gasoline, eliminating the problem of
false identification of coeluting constituents (USEPA, 1998; USGS, 1998). Another
method that involves gas chromatography with direct aqueous injection (DAI) onto a
polar column, coupled with detection by MS has been described by Church et al. (1997),.
The results of the DAI-GC/MS method were in excellent agreement with conventional
purge-and-trap methods for MTBE. Sequential purging with static headspace analysis
has been proven to be effective in quantifying MTBE and other gasoline compounds
(Lacy et al., 1995). Other methods which are useful for the detection of MTBE are GC/
photoionization detector (PID), and GC/flame ionization detector (FID) (USEPA, 1998a).
4
CH3
CH3
O C CH3
CH3
Figure 1. Chemical Structure of Methyl tertiary-butyl ether (MTBE)
5
TABLE 1. Chemical and Physical Properties of MTBE a
Characteristic/Property Data / Value
CAS registry No. 1634-04-4
Molecular Formula C5H12O
Physical State Colorless Liquid
Molecular weight 88.15
(g/mol)
Melting Point -109 oC
(at 760 mm Hg)
Boiling Point 55.2 oC
(at 760 mm Hg)
Vapor Pressure 245
(mm Hg at 25 oC)
Vapor Density 3.1
(air=1)
Density 0.7404
(g/ml at 25 oC)
Aqueous Solubility 51.26
(g/L at 25 oC)
Henry's Law Constant
(Atm-m3) / (g-mole) 0.000528 to 0.003000
(Dimensionless) 0.022 to 0.120
Log Koc 0.55 to 0.91
Log Kow 0.94 to 1.30
Odor Threshold 0.32 - 0.47
(mg/m3)
a Values obtained from USEPA (749-F-94-017a), 1994; USEPA (600/R-98-048), 1998

6
TABLE 2. Maximum solubility of MTBE and Benzene in
Groundwater. Water to gasoline ratio is 10 to 1 a
Percent MTBE in Solubility of Solubility ofGasoline MTBE (mg/l) Benzene (mg/l)
0 NA 65
5 1755 60
10 3650 60
a After Bauman, 1997
7
Figure 2. Formation of MTBE through the reaction of methanol and isobutylene
CH3
CH3
O C CH3
CH3
CH3OH + CH2 CCH3
CH3
8
ENVIRONMENTAL SIGNIFICANCE OF MTBE
Occurrence in soil and groundwater
Several instances of localized water contamination by MTBE have been reported
since the early 1980’s, but the first report to suggest that MTBE contamination may be
occurring on a widespread basis was a result of the United States Geological Survey
(USGS) National Water Quality Assessment (NAWQA) program (USEPA, 1998a). The
NAWQA program was designed to assess the status and trends in the quality of ground
and surface waters in the United States, and began sampling in 1993 (USEPA, 1998a).
MTBE was the second most frequently detected volatile organic chemical (VOC) in
shallow groundwater samples collected in 1993-1994 (Squillance et al. 1996). Of 210
wells and springs sampled, 56 (27%) contained MTBE at a minimum reporting level of
0.2 µg/L (Squillance et al., 1997).
Releases of MTBE into soil and groundwater can occur during manufacture,
distribution, storage, and use from point sources such as undergound storage tanks
(USTs), above ground storage tanks (ASTs), pipelines, and refueling facilities (USEPA,
1998; Squillance et al., 1997). The highest concentration of MTBE in groundwater
occurs from such point sources, and the most common point source is leaking
underground storage tanks (LUSTs). Since 1988, 330,000 confirmed releases from
regulated USTs have been reported to the EPA, and it is believed that the actual number
of LUSTs is much larger (USEPA, 1998a).
Environmental behavior of MTBE
The behavior of MTBE in the subsurface is determined by how it partitions
between water, gasoline, and subsurface solids. The high solubility of MTBE (see table
1), combined with its high concentration in gasoline, can result in high concentrations of
9
MTBE in groundwater contaminated by point sources (Squillance et al., 1997). The
water solubility of MTBE from oxygenated gasoline is approximately 50 times greater
than that of Benzene, the most soluble BTEX compound (see table 2). When partitioning
from the free-phase into the vapor phase, MTBE is 3 times more volatile than benzene.
However, the Henry’s law constant for MTBE is about ten times less than that for
benzene, which means that MTBE is ten time less volatile than benzene when moving
from the dissolved phase to the vapor phase (USEPA, 1998b). Dissolved phase
concentrations of MTBE near point sources can reach 10,000 to 50,000 µg/l at the
extreme end (Odencrantz, 1998).
MTBE has a lower Koc value than BTEX compounds, which means that it is
much less likely to sorb to subsurface material (USEPA, 1998b; Squillance et al., 1997;
Odencrantz, 1998). For example, for an aquifer containing soil with an organic carbon
content of 0.1 percent and a concentration of 3.0 µg/L, it is estimated that approximately
8 percent of the total MTBE present would sorb to aquifer material, whereas about 40
percent of the total benzene would sorb to aquifer material (Squillance et al., 1997). The
high solubility, low Henry’s law constant, and low Koc value cause MTBE to partition
into the aqueous phase, and migrate at the same rate as groundwater. MTBE plumes
often migrate well past BTEX plumes, and can reach thousands of feet in length
(Landmeyer et al., 1998; Odencrantz, 1998).
Health effects associated with the use of MTBE
Health benefits
The oxygenated fuels program was designed to reduce carbon monoxide
emissions, and fight against polluted air. There are numerous health benefits to humans
associated with the reduction of carbon monoxide in the urban atmosphere (Andersen,
1993). In a study by Erdal et al. (1996) researchers estimated potential public health
benefits from ozone (O3) pollution reduction attributable to the use of MTBE in gasoline,
by comparing O3 dose-response estimates from the biomedical literature with model
10
estimates of O3 reduction. The study concluded that even small MTBE-associated
reductions in peak O3 levels should yield considerable public health benefits.
Detrimental health effects
Most of the research done on the toxicity of MTBE has focused on the effects of
inhaled MTBE in laboratory animals and human volunteers. Little research on the effects
of ingested MTBE on humans has been performed (USEPA, 1998a). Costantini (1993)
reported that MTBE has a relatively low toxicity in rodents, and that no specific target
organs were identified except the male rat kidney, and possibly the female rat lung and
liver. Costantini did not rule out the possibility that MTBE may be toxic to humans at
high doses, due to the lack of data on primates. Mennaer (1997) reported that MTBE
induced neopplasms in laboratory rat and mice. However, because of the intense taste
and odor of MTBE, humans will not tolerate either air or water concentrations sufficient
to induce neoplasms (Mennear, 1997). In a summary of several studies, Stern and Kneiss
(1997) reported that MTBE at levels added to gasoline does not pose an added risk to
human health.
Despite the numerous studies on laboratory animals that conclude MTBE does not
pose a significant health threat to humans, there is some epidemiological evidence that
states otherwise. In many areas where MTBE is in use, there have been widespread
complaints of non-specific health threats attributed to its presence in gasoline (Balter,
1996). Complaints of headaches, eye irritation, nose and throat irritation, cough, nausea,
dizziness and spaciness were recorded in Alaska following the introduction of the
oxygenate in the fall of 1992 (Begley, 1993). A study by Moolenaar et al. (1994) tested
the blood of workers in Fairbanks, Alaska during the oxygenated fuel program and after
the program was suspended. The study concluded that blood MTBE levels were
measurably higher during the oxygenated fuel program than after the program was
suspended.
A related concern, is the foul tastes and odors MTBE causes in drinking water.
MTBE levels that are not considered to be a human health hazard can still produce taste
and odor problems in water supplies. Many people can detect its terpentine-like odor as
11
concentrations as low as 15 µg/L. At 135 µg/L the presence of MTBE is obvious and
generally distasteful to most water drinkers (Malinowski, 1998).
Regulatory issues
Currently there are no primary or secondary drinking water regulations for MTBE
(USEPA, 1998a). The EPA has issued an advisory to drinking water suppliers regarding
the presence of MTBE. In general, EPA advises water suppliers to ensure that MTBE
levels do not exceed 20 to 40 µg/L, a level most likely to avert unpleasant taste and odors
(Malinowski, 1998). In addition, the EPA has classified the compound as a possible
human carcinogen, and has issued a draft lifetime health advisory of 20 to 200 µg/l
(USEPA, 1994). The EPA has placed MTBE on the drinking water Contaminant
Candidate List (CCL). The CCL is a list of currently unregulated contaminants targeted
for consideration for the Agency's drinking water program (USEPA, 1998a). MTBE is
also regulated by the Resource Conservation and Recovery Act (RCRA) and the
Comprehensive Environmental Response, Compensation, and Liability Act (CERCLA).
REMEDIAL STRATEGIES FOR MTBE
Removal from soil and groundwater
Two strategies that have been listed as successful for remediating MTBE in a
survey of 48 state leaking underground fuel tank (LUFT) programs ar soil vapor
extraction and air sparging (Stocking, 1999; Hitzig, et al. 1998). Soil vapor extraction
(SVE) is commonly used to remove gasoline contaminants from the vadose zone, by
extracting vapor from above the unsaturated zone. Air sparging involves the injection of
air below the water table, and the subsequent removal of contaminants by air stripping
and oxygen-enhanced bioremediation. The low Henry’s law constant of MTBE may
limit the use of air sparging and SVE, because of the tendency for MTBE to remain
dissolved in water. In situ oxidation is a strategy that may be effective in the removal of
MTBE from the subsurface. Yeh and Novak (1995) found that hydrogen peroxide in the
12
presence of iron was able to chemically oxidize MTBE through Fenton's reaction. Chen
et al. (1998) and other researchers later confirmed these results. Because MTBE does not
readily adsorb to soil, various "pump and treat" methods should also be effective in
removing MTBE from groundwater. The potential for in situ bioremediation of MTBE is
still being studied, and the results of such studies are discussed in a later section.
Removal from drinking water
Several strategies are being considered for the removal of MTBE from drinking
water supplies. Two smaller-scale strategies that are being considered for the point-of-
use (POU) residential water treatment industry are granular activated carbon (GAC)
filtration and reverse osmosis (RO) (Malinowski, 1998). GAC is generally not considered
cost-effective for large-scale removal because of the low adsorption capacity of MTBE
(USEPA, 1998a). RO units have been proven reasonably effective, but the size and
surface area of the membranes limits it to small-scale removal. Four other strategies are
considered more applicable to the removable of MTBE from drinking waters on a larger
scale: air-stripping, biological treatment, oxidation, and heated air stripping (Malinowski,
1998). More research needs to be performed before a cost-effective removal process can
be determined.
BIODEGRADATION OF MTBE
There is an urgent need to remediate polluted soil and groundwater supplies
throughout the United States. Remedial strategies often involve pumping contaminants
from the subsurface for aboveground treatment. For many contaminants, in situ
bioremediation offers a potentially more effective and economical cleanup through partial
or complete destruction of the compounds. For many chemicals such as MTBE, our
limited understanding of the factors controlling biotransformation pathways and reaction
13
rates makes establishing the utility of in situ bioremediation an important scientific and
engineering problem (Bouwer, 1992)
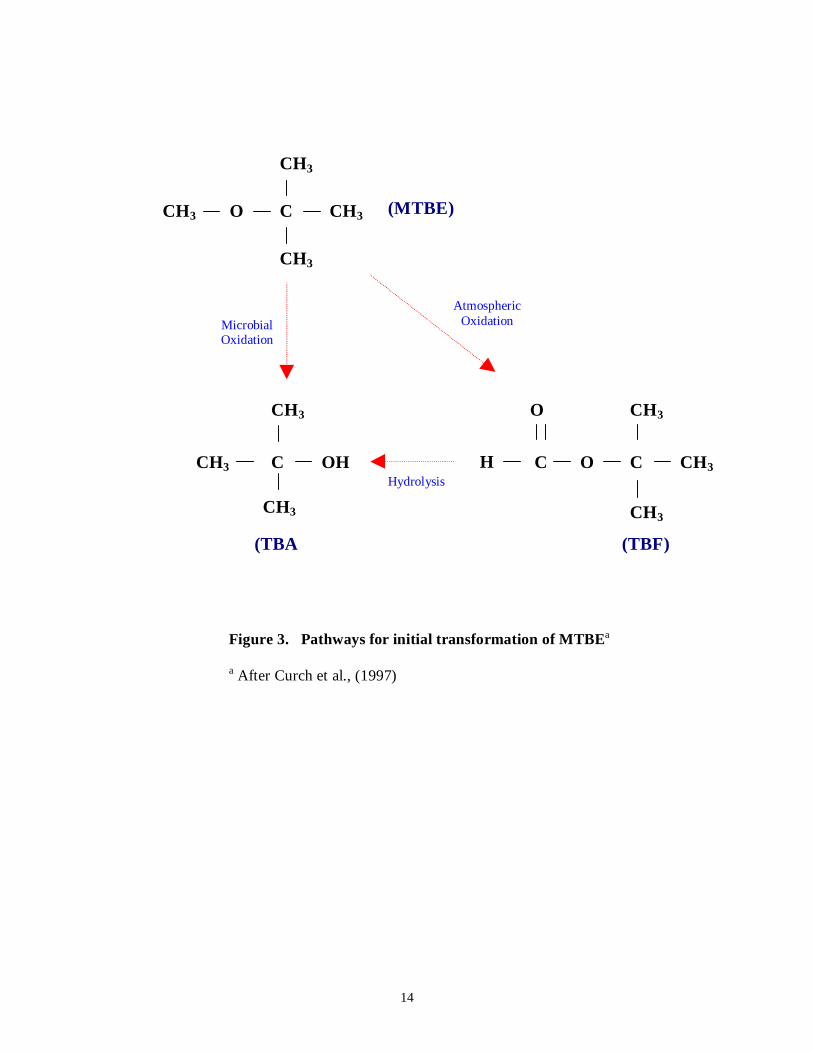
Pathways for MTBE biodegradation
It is believed that the biodegradation of MTBE in the aqueous phase is controlled
through the cleavage of the ether bond (Yeh, 1992). The most thoroughly studied
degradation pathway is atmospheric oxidation, where attack of the hydroxyl radical
yields tert-butyl formate (TBF) (Church et al., 1997). In the aqueous phase, accumulation
of TBF is not observed because it is readily hydrolized to tert-butyl alcohol (TBA). The
most promising indicator of degradation is TBA, because it is (1) common to most
pathways, (2) a demonstrated product of biodegradation, and (3) sufficiently resistant to
further degradation so that it may accumulate as an intermediate (Church et al., 1997,
Yeh and Novak, 1994; Salanitro et al., 1994). The use of TBA as an indicator of in situ
biodegradation is limited, because TBA is difficult to measure at low concentrations in
water (Church et al., 1997). TBA is subject to further biodegradaton to acetone, 2-
propanol, formate, and ultimately CO2 (Church et al., 1997; Steffan, 1997). Figure 3
presents the initial transformation pathways of MTBE.
14
CH3
CH3
O C CH3
CH3
CH3
CH3
C OH
CH3
MicrobialOxidation
C
CH3
O C CH3
CH3
H
O
Hydrolysis
AtmosphericOxidation
(MTBE)
(TBA (TBF)
Figure 3. Pathways for initial transformation of MTBEa
a After Curch et al., (1997)
15
Biodegradation by pure and mixed enrichment cultures
To date, the most rapid and complete degradation of MTBE has been reported in
experiments involving the use of pure or mixed enrichment cultures. Steffan et al. (1997)
investigated the ability of propane-oxidizing bacteria to degrade MTBE and other
gasoline oxygenates. Both a laboratory strain and natural isolates were able to degrade
MTBE after growth on propane. The initial oxidation of MTBE resulted in the nearly
stoichiometric production of tert-butyl alcohol (TBA). The methyl group of MTBE was
oxidized to formaldehyde and ultimately CO2. TBA was further oxidized to 2-methyl-2-
hydroxy-1-propanol and then 2-hydroxy isobutyric acid. Rates of MTBE degradation by
propane-oxidizing strains ranged from 3.9 to 9.2 nmol/min/mg of cell protein.
Horan and Brown (1994) evaluated aerobic biodegradation under aerobic
conditions by adding MTBE to carbon-limited microbial consortia. Results indicated
increased oxygen consumption when small amounts of MTBE were added as the sole
carbon source. However, when MTBE concentration reached approximately 10 ppm, the
enrichment culture stopped using oxygen. Researchers were unable to stabilize any
microbial consortia with MTBE as the sole carbon source (Horan and Brown, 1994).
Cowan and Park (1997) investigated the aerobic biodegradation of MTBE and
other gasoline oxygenates by a set of undefined mixed microbial cultures enriched from a
petroleum refinery wastewater activated sludge. Results from monitoring of MTBE
concentration and oxygen uptake indicated that MTBE was mineralized as the sole source
of carbon and energy by the enriched cultures. Results also indicated the formation of
TBA as an intermediate during the biodegradation of MTBE.
Salanitro et al. (1994) was able to isolate a mixed bacterial culture capable of
degrading MTBE. The mixed culture named BC-1 was developed from seed
microorganisms present in a chemical plant biotreater sludge. The enrichment culture
was maintained in continuous culture treating concentrations of MTBE from 120 to 200
mg/L. BC-1 metabolized radiolabeled 14CH3O-MTBE to 14CO2. Cell suspensions of BC-
1 were capable of degrading MTBE to TBA.
Later work by Salanitro et al. (1999) demonstrated enhanced in situ MTBE
(EMB) bioremediation at the field scale. This process involved an in situ biobarrier of
MTBE-degraders (BC-4), a network of O2 injection wells near the seeded transect, and an
16
array of monitoring wells upstream and downstream of the treatment zone. In plots
containing O2 injection, but not seeded with BC-4, some MTBE degradation to the
intermediate TBA was observed. Very rapid degradation rates were observed in plots
containing BC-4 and O2 injection. In addition, degradation beyond TBA was seen in
plots containing BC-4 and O2 injection. Researchers also concluded that MTBE
degrading organisms must be grown on a specific media, because growth on MTBE
would be too slow to maintain a culture in the subsurface (Salanitro et al. 1999).
Cometabolic biodegradation
Several recent studies have addressed the potentiality of cometabolic
biodegradation of MTBE. Hyman and O’Reilly (1999) reported that only certain alkane-
utilizing microorganisms are capable of oxidizing MTBE. The ability of certain alkane-
utilizing bacteria to oxidize MTBE is directly related to the oxygenase enzymes
responsible for initiating alkane oxidation in these microorganisms. Researchers
concluded that aerobic cometabolic MTBE-degrading activity is most consistently
predicted by the ability of microorganisms to grow on simple branched hydrocarbons
(Hyman and O’Reilly, 1999).
Hardison et al. (1997) studied the cometabolism of MTBE by a Filamentous
Fungus. Results indicated that gaseous n-alkane grown Graphium mycelia can
cometabolically degrade MTBE. Degradation of MTBE was completely inhibited by
acetylene, ethylene, and other unsaturated hydrocarbons and was strongly influenced by
n-butane. Two intermediates of MTBE degradation, TBA and tert-butyl formate (TBF)
were detected.
Garnier et al. (1999) reported cometabolic biodegradation of MTBE by a
microbial consortium enriched from polluted soils. Researchers investigated the effect of
the presence of several compounds present in gasoline on the biodegradation of MTBE.
Complete substrate utilization for benzene, toluene, and xylenes but no MTBE utilization
was observed. Complete mineralization was also found for pentane, hexane, and heptane.
Pentane favored the highest MTBE utilization rate (0.20 mg/day). A pentane-degrading
organism (Psuedomonas aeruginosa) was isolated, and a MTBE degradation rate of
0.530 mg/day was found, suggesting that this was the key organism in the consortium.
17
Intrinsic biodegradation
The ability of indigenous microorganisms to degrade MTBE in the subsurface is a
topic of significant environmental and economic interest. Successful intrinsic
bioremediation involves a reduction of risk through stabilization of the plume and partial
or complete destruction of the contaminants. An understanding of the processes that
effect the natural attenuation of BTEX and MTBE plumes is essential for the design of
successful bioremediation strategies. Several studies have addressed the biodegradation
of MTBE by naturally occurring microorganisms, under a variety of environmental
conditions.
In research performed by Yeh and Novak (1994), anaerobic biodegadation of
several gasoline oxygenates was studied in static soil/water microcosms. Results
indicated that TBA biodegraded most readily, while MTBE was the most recalcitrant.
No degradation of MTBE occurred in unamended soils under anaerobic conditions after
an incubation time of 250 days (Yeh and Novak, 1994).
Sufflita and Mormile (1993) studied the anaerobic biodegradation of known and
potential gasoline oxygenates in aquifer/groundwater slurries. Results indicated that
unlike the alcohol and ester oxygenates, the ether oxygenates were relatively persistent to
anaerobic destruction. After an incubation time of at least 182 days, no evidence for the
anaerobic destruction of MTBE was obtained. Later studies also attested to the
recalcitrance of MTBE under anaerobic conditions, except for the partial destruction of
MTBE to tert-butyl alcohol (TBA) (Mormile et al., 1994).
Hurt et al. (1999) presented evidence for anaerobic biodegradation of MTBE in a
contaminated aquifer. MTBE was monitored as part of a field-scale, natural attenuation
study. Some probe locations showed significantly lower levels of MTBE than in
surrounding areas. In addition, the wells containing lower MTBE levels contained higher
levels on TBA, a common intermediate. Further, these wells also exhibited high levels of
methane, suggesting that MTBE was biodegrading under methanogenic conditions.
However, no laboratory results were presented to support the results of the field studies.
18
Barker et al. (1990) performed a natural gradient tracer test to investigate the
influence of methanol and MTBE on the behavior of monoaromatic hydrocarbons in
groundwater. Results indicated that MTBE and methanol moved at approximately the
same rate as groundwater, while BTEX was somewhat slowed. BTEX compounds were
biodegraded when alone, and in the presence of MTBE. Researchers tentatively
concluded that MTBE was recalcitrant based on field and laboratory microcosm results
(Barker et al., 1990).
Jensen et al. (1990) studied the water solubility and biodegradability of MTBE
and gasoline in laboratory batch experiments. Experiments were performed under aerobic
conditions in batch reactors containing a sandy aquifer material, topsoil, and activated
sludge. Results indicated 100 percent degradation of aromatic hydrocarbons such as
BTEX, and 0 percent degradation of MTBE in all three types of inoculation material.
Borden et al. (1997) used a mass flux approach to estimate field scale first-order
decay coefficients of MTBE and BTEX compounds in a gasoline-contaminated aquifer.
Results indicated rapid loss of toluene and ethyl-benzene, with slower loss of m-, p-, o-
xylene, and benzene. In addition, first-order decay coefficients were higher near the
contaminant source, than further downgradient. Field monitoring results also indicated
MTBE decay near the source, but no degradation was observed downgradient. Effective
first-order decay coefficients varied from 0 to 0.001 d-1 for MTBE. Field results were
supported by aerobic laboratory microcosms that showed limited biodegradation near the
source, but no MTBE biodegradation further downgradient.
Landemeyer et al. (1998) studied the fate of MTBE relative to benzene in a
gasoline-contaminated aquifer. Field results showed little MTBE degradation, other than
the possible transformation to TBA in some wells. Laboratory microcosms containing
aquifer material incubated with uniformly labeled 14C-MTBE under aerobic and
anaerobic (Fe(III)-reducing) conditions, indicated a low but measurable biodegradation
potential (<3% 14C-MTBE as 14CO2) after an incubation time of seven months.
Researchers concluded that mg/L to µg/L decreases in MTBE concentrations were caused
by the natural attenuation processes of dilution and dispersion, rather than biodegradation
at that point source gasoline release site (Landmeyer et al., 1998).
19
Factors limiting biodegradation
There are numerous factors that can effect the biodegradation of organic
chemicals in the subsurface including but not limited to: solubility, bioavaiablity, nutrient
supply, electron acceptor supply, interactions between multiple substrates, temperature,
toxins, and other inhibitors. Hickman et al. (1989) investigated the effects of site
variations on subsurface biodegradation potential. Researchers concluded that
biodegradation rates differed significantly from site to site. Characteristics of soils with a
faster biodegradation rate were higher flux of water and nutrients. Biodegradation rates
were also increased by the addition of MoO42-.
Some recent research has specifically identified factors that may increase or
inhibit MTBE biodegradation. Yeh and Novak (1994) reported that MTBE degradation
was inhibited by the addition of readily degradable organic compounds in organically
poor soils. Hardison et al. (1997) reported that degradation of MTBE by a filamentous
fungus was completely inhibited by acetylene, ethylene, and other unsaturated
hydrocarbons.
The presence of oxygen available as an electron acceptor may be an important
factor in the biodegradation of MTBE. In a field study be Salanitro et al. (1999),
researchers demonstrated that MTBE degradation was higher in regions where oxygen
was injected, than in areas where it was not. Park and Cowan (1997) also investigated
the effects of oxygen the biodegradation of MTBE. Results indicated that the rate and
extent of MTBE degradation was impaired at dissolved oxygen concentrations between
0.3 and 0.9 mg/L. Park and Cowan (1997) also demonstrated that the rate of MTBE
degradation increased, with increasing temperature.
20
LITERATURE CITED
Ainsworth, S. (1992). “Oxygenates seen as hot market industry.” Chem. Eng. News., 70,
26-30.
Alexander, M. (1994). Biodegradation and Bioremediation. Academic Press, Inc., San
Diego, C.A.
Anderson, E.V. (1993). “Health studies indicate MTBE is safe gasoline additive.” Chem.
Eng. News, Sept., 9-18.
Balter, N.J. (1997). "Causality assessment of the acute health complaints reported in
association with oxygenated fuels." Risk Analysis, 17(6), 705-715
Barker, J.F., Hubbard, C.E., and Lemon, L.A. (1990). “The influence of methanol and
MTBE on the fate and persistence of monoaromatic hydrocarbons in groundwater.” In
Proceedings of Petroleum Hydrocarbons and Organic Chemicals in Water: Prevention,
Detection, and Restoration. National Water Well Association, 113-127.
Bauman, B. (1997). “MTBE and groundwater quality: bioremediation research.” EPA
OUST National Conference.
Begley, R., and Rotman, D. (1993). “Health complaints fuel federal concern over
MTBE.” Chem. Week, 152(10), 7
Borden, R.C., Daniel, R.A., Lebrun, L.E. and Davis, C.W. (1997). “Intrinsic
biodegradation of MTBE and BTEX in a gasoline-contaminated aquifer.” Water
Resources Research, 33(5), 1105-1115.
21
Bouwer, E.J. (1992). “Bioremediation of organic contaminants in the subsurface.”
Environmental Microbiology, Wiley-Liss, Inc., 288-315.
Chen,C.T., Tafuri, A.N., Rahman, M. and Foerst, M.B. (1998). "Chemical Oxidation
treatment of petroleum contaminated soil using Fenton's reagent." J. Environ. Sci.
Health., A33, 987-1008.
Church, C.D., Isabelle, L.M., Pankow, J.F., Rose, D.L., and Tratnyek, P.G. (1997).
“Methtod for determination of methyl tert-butyl ether and its degradation products in
water.” Environ. Sci. Technol, 31(12), 3723-3726.
Costantini, M.G. (1993). “Health effects of oxygenated fuels.” Environmental Health
Perspectives Supplements, 101(6), 151-160.
Cowan, R.M., and Park, K. (1997). "Biodegradation of the gasoline oxygenates MTBE,
ETBE, TAME, TBA, and TAA by aerobic mixed cultures." 523-530.
Cullen, P.G. (1998). “MTBE: A remediation headache.” Environmental Protection, 9(6),
32-35.
Erdal, S., Gong, H., Linn, W.S., and Rykowski, R. (1996). “Projection of health benefits
from ambient ozone reduction related to the use of methyl tert-butyl ether (MTBE) in
the reformulated gasoline program.” Risk Analysis, 17(6), 693-702.
Garnier, P., Auria, R., Magana, M., and Revah, S. (1999). “ Cometabolic biodegradation
of methyl t-butyl ether by a soil consortium.” In proceedings of In Situ and On-Site
Bioremediation; The Fifth International Symposium. San Diego, C.A
Goldsmith, C.D. (1985). “ Biodegradation of Methanol and Tertiary Butyl Alcohol in
previously uncontaminated subsurface systems.” .MS thesis, Virginia Polytechnic
Institute and State University, Blacksburg, Virginia.
22
Hardison, L.K., Curry, S.S., Ciuffetti, and Hyman, M.R. (1997). " Metabolism of diethyl
ether and cometabolism of methyl tert-butyl ether by a filamentous fungus, a Graphium
sp." Appl. Environ. Microbiol., 63(8), 3059-3067.
Hickman, G.T., Novak, J.T., Morris, M.S., and Rebhun, M. (1989). “Effects of site
variations on subsurface biodegradation potential.” J. Water Pollut, Control Fed.,
61(9), 1564-1575.
Hitzig, R., Kostecki, P., and Leonard, D. (1998). “Study reports LUST programs are
feeling effects of MTBE.” Soil and Groundwater Cleanup; Regulations.
Hurt, K.L., Wilson, J.T., and Cho, J.S. (1999). “Anaerobic Biodegradation of MTBE in a
contaminated aquifer.” In proceedings of In Situ and On-Site Bioremediation; The
Fifth International Symposium. San Diego, C.A.
Hyman, M., and O’Reilly, K. (1999). “Physiological and enzymatic features of MTBE-
degrading bacteria.” In proceedings of In Situ and On-Site Bioremediation; The Fifth
International Symposium. San Diego, C.A
Jensen, H.M. and Arvin, E. (1990). “Solubility and degradability of the gasoline additive
MTBE and gasoline compounds in water.” In Contaminated Soil ’90, 445-448.
Lacy, M.J., Robbins, G.A., Wang, S., and Stuart, J.D. (1995). “Use of sequential purging
with the static headspace method to quantify gasoline contamination.” Journal of
Hazardous Materials, 43, 31-44.
Landmeyer, J.E., Chapelle, F.H., Bradley, P.M. Pankow, J.F., Church, C.D., Tratnyek,
P.G. (1998). "”Fate of MTBE relative to benzene in a gasoline-contaminated aquifer.”
Ground Water Monitoring Review, 93-102.
23
Malinowski,J. (1998). “MTBE causes foul tastes and odors in water.” Water Technol.,
21(2), 120-122.
McCarthy, J.E., and Tiemann, M. (1998). “MTBE in gasoline: Clean air and drinking
water issues.” CRS Report for Congress. Environment and Natural Resources Policy
Division.
McCloskey, C.B. (1995). “Biodegradation of Benzene in soil systems.” MS thesis,
Virginia Polytechnic Institute and State University, Blacksburg, Virginia.
Mennear, J.H. (1997). “Carcinogenicity studies on MTBE: Critical review and
interpretation.” Risk Analysis, 17(6), 673-681.
Moolenar, R.L., Brockton, J.H., Ashley, D.L., Middaugh, J.P.,and Etzel, R.A. (1994).
"Methyl tertiary butyl ether in human blood after exposure to oxygenated fuel in
Fairbanks, Alaska." Arch. Environ. Health, 49(5), 402-409.
Mormille, M.R., Liu, S., and Suflita, J.M. (1994). “Anaerobic biodegradation of gasoline
oxygenates: Extrapolation of information to multiple sites and redox conditions.”
Environ. Sci. Technol., 28, 1727-1732.
Nielsen, P.H., Bjerg, P.L., Nielsen. P., Smith, P., and Christensen, T.H. (1996). “In situ
laboratory determined first-order degradation rate constants of specific organic
compounds in an aerobic aquifer.” Environ. Sci. Technol, 30, 31-37.
Odencrantz, J.E. (1998). "Implications of MTBE for intrinsic remediation of underground
fuel tank sites." Remediation., 8(3), 7-16.
Park, K. and Cowan, R.M. (1997). “Effects of oxygen and temperature on the
biodegradation of MTBE.” Division of Environmental Chemistry Preprints of Extended
Abstracts, 37(1), 421-424.
24
Pritchard, P.H. and Bourquin, A.W. (1984). “The use of microcosms for evaluation of
interactions between pollutants and microorganisms.” 133-215.
Salanitro, J.P., Diaz,L.A., Williams, M.P., and Wisniewski, H.L. (1994) "Isolation of a
bacterial culture that degrades methyl t-butyl ether." Appl. Environ. Microbiol., 60(7),
2593-2596.
Salanitro, J.P., Spinnler, G.E., Neaville, C.C., Maner, P.M., Stearns, S.M., Johnson, P.C.,
Bruce, C. (1999). “Demonstration of the enhanced MTBE bioremediation (EMB) in
situ process.” In proceedings of In Situ and On-Site Bioremediation; The Fifth
International Symposium. San Diego, C.A.
Shelley, S., and Fouhy, K. (1994). “Drive for cleaner burning fuel.” Chem. Eng. J., Jan.,
61-63.
Squillance, P.J., Pankow, J.F., Korte, N.E., and Zogorski, J.S. (1997). “Review of the
environmental behavior and fate of methyl tert-butyl ether.” Environ. Toxicol. Chem.,
16(9), 1836-1844.
Squillance, P.J., Zogorski, J.S., Wilber, W.G., and Price, C.V. (1996). “Preliminary
assessment of the occurrence and possible sources of MTBE in groundwater in the
United States, 1993-1994.” Environ. Sci. Technol., 30, 1721-1730.
Stern, B.R., and Kneiss, J.J. (1997). "Methyl teriary-butyl ether (MTBE): Use as an
oxygenate in fuels." J. Appl. Toxicol. 17(S1) S1-S2.
Stern, B.R., and Tardiff, R.G. (1997). "Risk Characterization of Methyl tertiary butyl
ether (MTBE) in tap water." Risk Analysis, 17(6), 727-742.
Stocking, A., Koenigsberg, S., and Kavanaugh, M. (1999). "Remediation and treatment
of MTBE." Environmental Protection, April '99, 36-41.
25
Suflita, J.M. and Mormile, M.R. (1993). “Anaerobic biodegradation of known and
potential gasoline oxygenates in the terrestrial subsurface.” Environ. Sci. Technol, 27,
976-978.
USEPA (1998c). “Use and distribution of MTBE and ethanol.” EPA 510-F-97-016.
USEPA. (1997). “Drinking water advisory: Consumer acceptability advice and health
effects analysis on methyl tertiary-butyl ether.” EPA-822-F-97-009.
USEPA. (1998a). “Oxygenates in water: critical information and research needs.”
EPA/600/R-98/048.
USEPA. (1998b). “Remediation of MTBE contaminated soil and groundwater.”
EPA 510-F-97-015.
USEPA: Office of Pollution Prevention and Toxics. (1994). “Chemical summary for
methyl-tert butyl ether.” EPA 749-F-94-017a.
USGS. (1998). “U.S. Geological Survey method for Methyl tert-butyl ether and other fuel
oxygenates.” http://wwwnwql.cr.usgs.gov/Public/pubs/MTBE.fact.sheet.html
Yeh, C.K. (1992). "Degradation of gasoline oxygenates in the subsurface." PhD
Dissertation, Virginia Polytechnic Institute and State University, Blacksburg, Virginia
Yeh, C.K. and Novak, J.T. (1995). "The effect of hydrogen peroxide on the degradation
of methyl and ethyl tert-butyl etheer in soils." Water Env. Res., 67(5), 828-834.
Yeh, C.K., and Novak, J.T. (1994). “Anaerobic biodegradation of gasoline oxygenates in
soils.” Water Env. Res., 66(5), 744-752.
26
Zenker, M.J., Borden, R.C., and Barlaz, M.A. (1999). “Investigation of the intrinsic
biodegradation of alkyl and cyclic ethers.” In proceedings of In Situ and On-Site
Bioremediation; The Fifth International Symposium. San Diego, C.A.
27
AEROBIC BIODEGRADATION OF MTBE IN UNCONTAMINATED AND
GASOLINE-CONTAMINATED AQUIFER SEDIMENTS
by
Jeff R. Zoeckler1, Mark A. Widdowson2, and John T. Novak3
Manuscript for Submission to:
ASCE JOURNAL OF ENVIRONMENTAL ENGINEERING
May 25, 1999
1Graduate Student, Dept. of Civil and Environmental Engineering, VirginiaPolytechnic Institute and State University, Blacksburg, VA.
2Assoc. Prof., The Charles E. Via Jr. Dept. of Civ. Engrg., Virginia PolytechnicInst. And State Univ., Blacksburg, VA 24061-0105
3 Nick Prillaman Prof., Dept. of Civil and Environmental Engrg., VirginiaPolytechnic Inst. And State Univ., Blacksburg, VA 24061-0105
28
ABSTRACT
In this study, the biodegradation potential of MTBE in uncontaminated and
previously contaminated aquifer sediments under aerobic conditions was investigated.
Laboratory microcosms were constructed using aquifer samples collected from three
different areas of a shallow gasoline-contaminated aquifer in eastern Fairfax Co., Va in
the Atlantic Coastal Plain province. Uncontaminated aquifer samples were collected
upgradient of the plume, and contaminated aquifer samples were collected in the source
area and in an area downgradient of the source. Biodegradation of MTBE was observed
in microcosms that contained previously contaminated aquifer sediments. More
complete degradation was observed in aquifer sediments containing a low level of
petroleum contamination than in heavily contaminated aquifer sediments.
Biodegradation of MTBE appeared to be limited by a lack of oxygen in heavily
contaminated soils. When degradation was discernible it appeared to follow a first order
pattern with a rate constant (λ) of between 0.037 and 0.066 d-1, following a lag period of
20 to 40 days. In microcosms containing lightly contaminated aquifer material, MTBE
was respiked during active metabolism, and degradation occurred with no lag or
acclimation period. Results indicated that little or no degradation occurred in the
microcosms containing uncontaminated soil. The results of this research suggest that the
availability and level of petroleum hydrocarbon compounds influence indigenous
microorganisms capable of degrading MTBE.
Keywords: MTBE, petroleum hydrocarbon compounds, acclimation, biodegradation,
microcosm, concentration, indigenous microorganisms
29
INTRODUCTION
Methyl tert-butyl ether (MTBE) is a gasoline additive (oxygenate) that has been
voluntarily used since 1979 to replace lead and increase the octane in gasoline. The
Clean Air Act Amendments (CAAA) of 1990 required that gasoline oxygenates be
blended into reformulated gasoline (RFG) to reduce carbon monoxide emissions.
MTBE is the most commonly used oxygenate because of its low cost, ease of
production, and favorable blending characteristics (Ainsworth, 1992; Shelley and Fouhy,
1994). RFG contains from 11 to 15% MTBE by volume, and is most commonly used in
areas that do not meet National Ambient Air Quality Standards (Squillance et al., 1996).
Today, MTBE is one of the most widely produced and used chemicals in the United
States (Malinowski, 1998). As of 1994, 32 areas in a total of 18 states participate in the
RFG program, and RFG accounts for over 30 percent of gasoline nationwide. The
Oxygenated Fuels Association estimates that 70 % of all gasoline in the United States
contains MTBE at varying concentrations (USEPA, 1998).
While MTBE reduces health risk from exposure to carbon monoxide emissions,
potential health risks to humans exist from exposure to vapors and MTBE dissolved in
water. Complaints of headaches, eye irritation, nose and throat irritation, cough, nausea,
dizziness and spaciness from exposure to MTBE vapors were recorded in Alaska
following the introduction of the oxygenate in the fall of 1992 (Begley, 1993). Animal
studies have shown that MTBE is rapidly absorbed following oral or inhalation exposures
(USEPA 1994). MTBE is generally considered safe at low doses, but little concrete
information is available regarding human health effects, and more studies are needed
(Costantini, 1993). EPA has classified the compound as a possible human carcinogen,
and has issued a draft lifetime health advisory of 20 to 200 µg/l (USEPA, 1994). The
health advisory is the maximum concentration in drinking water that is not expected to
cause any adverse non-carcinogenic effects over a lifetime of exposure (Squillance,
1997). A further issue with MTBE in water is the pungent odor and taste that can be
detected at levels as low as 15 µg/l (Malinowski, 1998). For this reason the EPA has
issued a drinking water advisory of 20 to 40 µg/l. Some states have recently issued
drinking water standards, with others soon to follow. California has issued a public
30
health limit of 14 ppb of MTBE in drinking water, and Maine and New York have each
issued a state drinking water standard of 50 ppb. Maine is one of the first states
considering a ban on the use of MTBE in reformulated gasoline.
Environmental releases of MTBE can occur through both point and non-point
sources, but the highest concentrations in water are attributed to point sources. Gasoline
spills to the land surface and releases from aboveground and underground storage tanks
(ASTs and USTs) are the most common examples of point sources. As of July 1994,
roughly 22% of the 1.2 million petroleum USTs at 500,000 sites in the United States have
been reported to leak. As part of the USGS National Water Quality Assessment
Program, MTBE was the second most frequently detected chemical in shallow
groundwater samples collected in 1993-1994 (Squillance et al., 1996).
The high solubility of MTBE allows for the rapid dissolution into water and
therefore the rapid spread through groundwater systems. The solubility of pure MTBE
in water is approximately 51,200 mg/l, whereas benzene (the most soluble BTEX
compound) has a maximum solubility of around 1,800 mg/l at 25 °C. For a gasoline
containing 15% MTBE by weight, the maximum solubility of MTBE is approximately
5000 mg/l compared to 60 mg/l for benzene. The recurrence of leaking USTs combined
with the high solubility of MTBE provides the potential for MTBE contamination at
these sites. Dissolved phase concentrations near point sources have been reported to
reach 10,000 to 50,000 µg/L (Odencrantz, 1998). In addition, MTBE sorbs very poorly
to soil, therefore transport of MTBE plumes will not be significantly retarded as
groundwater flows through the aquifer. MTBE has been shown to travel large distances
(sometimes over 1000 ft) from the source area (Odencrantz, 1998).
The recent health concerns over MTBE combined with its widespread use and
occurrence in groundwater systems has focused increased attention on feasible
remediation strategies. Several treatment options are being considered including air
stripping, oxidation, carbon filtration, reverse osmosis, soil vapor extraction (SVE) and
ex-situ biological treatment (Malinowski, 1998). In situ bioremediation, in which the soil
is not removed from the field or groundwater is not pumped for aboveground treatment,
offers a potentially more effective and economical clean up technique through partial or
complete destruction of the contaminants (Bouwer, 1992; Alexander, 1994).
31
Several recent studies have addressed the biological fate of MTBE. Most
research has suggested that MTBE is recalcitrant, or very slow to degrade under aerobic
(Barker et al., 1990; Jensen, 1990; Landmeyer et al., 1998; Zenker et al., 1999) and
anaerobic conditions (Suflita and Mormile, 1993; Yeh and Novak, 1994; Landmeyer et
al., 1998). However, other recent research has presented evidence for MTBE
biodegradation by pure and mixed isolated cultures under aerobic conditions (Mo et al.,
1997; Salanitro et al.,1994; Salanitro et al., 1999; Cowan and Park, 1997). MTBE
degradation through cometabolism with n-alkanes has also been reported (Hardison et al.,
1997; Garnier et al., 1999). Hyman et al., (1999) reported that the only certain alkane-
utilizing organisms are capable of oxidizing MTBE. Recent field studies have shown
some indication of MTBE biodegradation under anaerobic (methanogenic) conditions
(Hurt et al., 1999).
Evidence for intrinsic biodegradation of MTBE in a gasoline contaminated
aquifer near the contaminant source, has recently been presented in field and laboratory
experiments (Borden et al., 1997). Borden et al. (1997) used a mass flux approach to
estimate field scale first-order decay coefficients under mixed aerobic-denitrifying
conditions. Mass flux results indicated rapid loss of toluene and ethyl-benzene, with
slower loss of m-, p-, o-xylene, and benzene. In addition, first-order decay coefficients
were higher near the contaminant source, than further downgradient. Field monitoring
results also indicated MTBE biodegradation near the source, but no biodegradation of
MTBE was observed downgradient. Field results were supported by aerobic laboratory
microcosms that showed limited biodegradation in near-source core microcosms, but no
MTBE biodegradation in downgradient core microcosms. The results of Borden et al.
(1997) indicate that indigenous aerobic microorganisms are capable of degrading MTBE
to some extent, but the factors controlling biodegradation are not well understood.
The potential for intrinsic bioremediation of MTBE is of particular environmental
and economic significance, and is the foundation of this study. The primary purpose of
this research was to compare the biodegradation potential of indigenous aerobic
microorganisms in contaminated and uncontaminated aquifer samples. Experiments were
designed based on the hypothesis that aerobic microorganisms capable of degrading
MTBE will preferentially utilize readily-degradable petroleum compounds (such as
32
BTEX) and will later biodegrade MTBE after the readily biodegradable hydrocarbon
compounds have been removed. Further, the impact of antecedent conditions on the
microbial response of MTBE was evaluated. Three different aquifer sediment samples
were obtained from a gasoline-contaminated site: (1) uncontaminated, upgradient of the
contaminant source area, (2) contaminated, near the source area, and (3) contaminated,
downgradient of the source area. Aquifer material was then used to construct laboratory
microcosms in which MTBE biodegradation potential was evaluated for each of the three
sampling locations. In addition, first-order biodegradation rates were calculated from
microcosm data when applicable.
MATERIALS AND METHODS
Site Description
The study area is in eastern Fairfax County, Virginia , in the Atlantic Coastal
Plain province. The geology of the area consists of tertiary and quaternary age upland
terrace deposits identified as part of the Bacons Castle Formation which overlies the
Potomac Formation (Mixon et al., 1989). Gasoline from underground and aboveground
storage tanks has contaminated soil and groundwater at the U.S. Army Garrison Fort
Belvoir, VA (Fig. 1). During previous site investigations, several engineering/consulting
firms installed a series of monitoring wells. The drilling logs from these wells were used
to model the stratigraphy of the site (Law Engineering, 1998a). The stratigraphy of the
area is complicated, consisting of fill material and interbedded clay, sand and silt layers.
Water levels in these wells were measured, and utilized with drilling logs to determine
the local hydrogeology. The hydrogeology is complex consisting of a series of perched
aquifers and aquitards. Water level measurements indicate a general flow to the northeast
in the uppermost perched aquifer (Fig. 1). Groundwater samples collected from these
wells in January/February of 1998 indicated BTEX contamination (Law Engineering,
1998b). The highest levels of BTEX contamination were reported in well W1124-4
(deep) and W1124-5S (shallow) (~2000 µg/L and 600 µg/L total BTEX compounds,
respectively). The highest MTBE concentration (88.4 µg/L) was also reported in
33
W1124-5S (no MTBE data was available for W1124-4). This contamination was
expected because of the close proximity of the wells to the source and the general
direction of groundwater flow.
Sample Collection
Soil samples were collected in three different locations based on the experimental
matrix. Upgradient, source area, and downgradient soil borings are labeled SB-1, MLS-
1, and MLS-2 respectively (Fig. 1). Boreholes were drilled until reaching the top of the
water table. The depths to the water table for borings SB-1, MLS-1, and MLS-2 were 15,
16, and 28 feet, respectively. Split spoon samples of saturated aquifer material were
collected below the water table. Samples were collected in 13/8" x 4" stainless steel split
tube samplers inserted inside the split spoons. All sampling tubes and equipment were
flame sterilized in the field, prior to contact with aquifer material. Sampling tubes were
immediately sealed with plastic caps upon removal from the split spoon sampler. These
tubes were then sealed inside airtight mason jars, packed on ice, and transported back to
the laboratory. All soils were stored at 4 °C in the dark until utilized for analysis or
microcosms construction. Multi-level samplers (MLS) were installed at the source-area
and downgradient locations (MLS-1 and MLS-2, respectively).
Groundwater Characterization
Groundwater samples were collected from several wells in October, 1998 and
analyzed for dissolved oxygen, sulfate, nitrate, ferrous iron, pH, and MTBE. Dissolved
oxygen was measured in the field using the azide modification of the Winkler titration
method (Hach, 1995). Temperature and pH were measured using a portable electrode
probe (Hach, 1995). Fe (II) was measured in the field, using a calorimetric method (Hach,
1995). Sulfate and nitrate were analyzed in the laboratory using a Dionex 2010i ion
chromatograph. MTBE and petroleum hydrocarbon contamination were analyzed in the
laboratory using headspace gas chromatography (method is identical to that described in
Microcosm Construction and Analysis section). The level of petroleum hydrocarbon
contamination was quantified by comparing the total chromatographic area to a standard
curve created with unleaded gasoline.
34
All wells contained measurable levels of dissolved oxygen (1.7 – 4.2 mg/L)
except W1124-5S (below detection (BDL)), which is located in the vicinity of the source
area (Fig. 1 and Table 1). Groundwater collected from W1124-5S contained a
significantly lower level of sulfate (~13 mg/L) than other wells (> 20 mg/L), suggesting
that sulfate reduction may be occurring. Toluene and ethyl-benzene concentrations in
W1124-5S were 0.04 and 0.27 mg/L respectively, compared to less than 0.004 mg/L in
other wells. The highest level of MTBE (1.60 mg/L) and petroleum hydrocarbon
contamination (22.54 mg/L) was also found in W1124-5S. Groundwater was also
collected from the bottom two ports of MLS-1 (depths of 18 and 20 ft) in December of
1998. The level of MTBE in these samples ranged from 1.69 to 2.49 mg/L, which is
consistent with the contamination found in the nearby well, W1124-5S.
Characterization of Aquifer Sediments
Aquifer samples were characterized in terms of MTBE contamination, level of
petroleum hydrocarbons, moisture content, absorbed water content, total organic carbon,
and particle size distribution. Contamination was measured by extracting 5 g of aquifer
sample with 10 ml of water to simulate the aquifer sediment/groundwater system. The
mass of MTBE was measured using headspace gas chromatography. The mass of MTBE
measured is not the total mass in the sample, but the amount available to water in a
aquifer sediment/water system. The level of petroleum hydrocarbon contamination was
quantified by comparing the total chromatographic area to a standard curve created with
unleaded gasoline. The moisture content was determined using an ASTM procedure
(ASTM D2216 / ASTM, 1989). A sample was weighed, dried at 110 °C and weighed
again. The moisture content (in percent) is the difference in weight between the initial
and oven-dried sample divided by initial weight. Absorbed water content was measured
using the procedure described by McCloskey (1995). A sample was air dried for 24
hours, weighed, oven dried at 110°C for 24 hours and weighed again. The absorbed water
content (in percent) is the difference in weight between the air-dried and oven-dried
sample divided by the weight of the air-dried sample. Percentage of total organic carbon
(TOC) was measured using the loss of ignition test (McCloskey, 1995). A sample was
weighed, dried at 110°C for 24 hours and weighed again. The sample was then baked at
35
430°C for 24 hours and weighed again. The TOC (in percent) is the difference between
the oven-dried and baked sample, divided by the initial weight. Particle size distribution
was determined by a standard method using a mechanical sieve analysis and a
hydrometer analysis (ASTM D422/ ASTM, 1989).
Microcosm Construction and Analysis
Biodegradation of MTBE by indigenous microorganisms was evaluated in static
aquifer sediment/water microcosms. Five grams of aquifer material was aseptically
transferred to 20 ml headspace vials, and saturated with 10 ml of deionized water.
MTBE and other compounds were added by injecting a known mass of contaminant
using a sterilized syringe. All procedures related to microcosm construction were
performed at 4 °C to minimize losses due to volatilization. Microcosms were capped
with 22 mm aluminum crimp seals containing rubber septa. All microcosms were
incubated upside down (to prevent volatilization), in the dark at 20 °C prior to being
sampled. Microcosms were hand shaken approximately twice per week to distribute the
contaminants and oxygen throughout the system.
The initial concentration of MTBE added to microcosms that contained
uncontaminated aquifer material was 5 mg/l. The initial concentration in microcosms
containing contaminated aquifer material varied depending on the level of contamination.
The objective was to add enough MTBE to raise the concentration to 5 mg/l. This was a
difficult task, due to the highly variable levels of contamination throughout the sample.
Toluene and ethyl-benzene were added to selected microcosms to evaluate the impact of
these compounds on MTBE degradation. Selected microcosms were also amended with
nutrients (50 ppm NH4+-N and 10 ppm PO4
-2-P), to determine if nutrient addition might
enhance MTBE biodegradation. All microcosms were initially aerobic, with ambient DO
present in the deionized water, and oxygen transfer also occurring from the headspace
into the aqueous phase.
Abiotic controls were prepared for each soil condition, and used to observe losses
due to volatilization and sorption. Control microcosms contained soils that were
autoclaved 1-2 times per day for at least ten days at 132 °C and 15 psi for 30 minutes.
36
Autoclaved soil was aseptically transferred to 20 ml headspace vials and autoclaved one
more time. Controls were constructed in the same manner as live microcosms. The
initial MTBE concentration was 5 mg/l for all controls.
Live microcosms were sacrificed in triplicate using headspace gas
chromatography. MTBE and other petroleum compounds were extracted from the
headspace using a HP 19395A automatic headspace analyzer. The oil bath temperature in
the headspace analyzer was 65 °C. Headspace analysis was performed with a HP 5880
gas chromatograph equipped with a flame ionization detector. MTBE and other
compounds were separated on a 2 m x 2 mm glass column packed with 5% SP-1200 /
1.75 % Bentone on a 100/120 supelcoport support. The carrier gas was Nitrogen (30
ml/min), and the oven temperature was ramped from 60 °C to 123 °C. The injection port
temperature was 130°C and the detector temperature was 250 °C. MTBE concentration
was quantified by comparing MTBE peak area to a linear standard curve. Petroleum
hydrocarbon compounds were quanitified by comparing the total gas chromatographic
area to a linear standard curve created with unleaded gasoline. The presence of tert-butyl
alcohol (TBA), a common intermediate of MTBE degradation, was also monitored
throughout the experiments. Abiotic controls were sacrificed in duplicate using the same
procedure as live microcosms. Dissolved oxygen (DO) was periodically measured in
selected microcosm sets, using a YSI model 57 DO meter.
Oxygen Utilization
Assuming that the aerobic biodegradation of MTBE is complete to carbon dioxide
and water, the stoichiometric equation is:
(MTBE) C5H12O + 7.5 O2 → 5 CO2 + 6 H20
O2 Consumption: 2.72 mg O2 per mg C5H12O
Based on the approximate volume of headspace (8 mL) in each microcosm, and
the solubility of oxygen in water, the approximate mass of oxygen in each microcosm is
2.3 mg. The mass of MTBE in each microcosm is less than 0.05 mg, therefore oxygen
37
supply should not limit MTBE degradation, when only MTBE is present. When other
readily degradable petroleum hydrocarbon compounds are present at a high
concentration, oxygen may be completely consumed.
Evaluation of MTBE Degradation
After microcosms were constructed, live and control microcosms were
destructively sacrificed, and MTBE concentrations (as well as toluene and ethyl-benzene
when applicable) were measured over periods of up to 140 days. The average MTBE
concentration and standard deviation of 3 samples (2 samples for controls) was plotted
versus time on a log scale. Petroleum hydrocarbons were plotted as relative concentration
versus time when applicable. First-order rate constants were applied to the microcosm
data where a visible pattern of MTBE degradation was apparent. Results from
biodegradation studies often showed or indicated an acclimation phase in which no
substrate loss was evident (Alexander, 1994). First-order degradation rate constants were
calculated from the slope of the log concentration – time plots, where active degradation
was occurring (acclimation phase excluded).
The general first-order equation for loss of substrate is
=dt
dCRbio = -λC
where t = Time [T]; C = Substrate Concentration [ M L-3]; Rbio = Rate of biological
reaction [M L-3 T-1]; and λ = first-order rate constant [T-1].
RESULTS AND DISCUSSION
Characterization of Aquifer Sediments
Table 2 summarizes the results of the characterization tests for the three different
aquifer samples. The objective was to obtain three samples with similar chemical and
physical characteristics, but differing levels of contamination. SB-1, MLS-1, and MLS-
2 aquifer sediments contained similar percentages of total organic carbon (3.10 – 3.47
38
%). The upgradient sample (SB-1) contained greater than 70 % clay, while the source
area (MLS-1) and downgradient (MLS-2) samples consisted of over 90 % sand. SB-1
aquifer samples contained a moisture content of over 30 %, while MLS-1 and MLS-2
samples contained moisture contents of approximately 14 % and 18 % respectively. SB-
1 aquifer samples contained an absorbed water content of over 4.17 %, while MLS-1
and MLS-2 samples contained absorbed water contents of 0.46 % and 0.71 %
respectively. The physical and chemical differences between samples can cause
variations in biodegradation potential.
The objective was to obtain uncontaminated, petroleum hydrocarbon and MTBE
contaminated, and MTBE only contaminated samples for SB-1, MLS-1, and MLS-2
respectively. As expected, sample SB-1 was completely free of MTBE and other
petroleum contamination. The near-source aquifer sediments (MLS-1) contained MTBE
ranging from 1.06 mg/kg to 56.89 mg/kg and petroleum hydrocarbons from 0.53 mg/kg
to 27.37 mg/kg. The downgradient aquifer sediments (MLS-2) contained MTBE ranging
from below detection (BDL) to 1.01 mg/kg and petroleum hydrocarbons from BDL to
2.63 mg/kg.. The highly variable levels of petroleum contamination observed in the
aquifer sediment characterization tests made it to difficult to distinguish the antecedent
contamination between aquifer samples MLS-1 and MLS-2.
Source area microcosms (MLS-1)
Source area microcosms were constructed with aquifer material obtained from
MLS-1 soil boring. Upon sacrificing, it was observed that the level of petroleum
hydrocarbon contamination was significantly less than the soil used for downgradient
(MLS-2) microcosms. MLS-1 microcosms contained petroleum hydrocarbons from BDL
to approximatley 2 mg/L. These results are in contrast to the results of the aquifer
sediment characterization and groundwater analysis, and can be attributed to the highly
variable contamination of the aquifer samples.
One set of MLS-1 microcosms was constructed in which MTBE was added at an
initial concentration of 2.5 ppm, with no other petroleum hydrocarbon compounds or
nutrients. Fig. 2 is a plot of MTBE concentration versus time for both live microcosms
and controls. MTBE concentration in live microcosms began to decline after an
39
acclimation period of approximately 20 days. After an incubation time of 78 days, the
average MTBE concentration fell to below 0.276 ppm. One data point (0.009 mg/L @ t=
68 days) that fell below the scale (< 0.1 ppm) was plotted on the 0.1 ppm axis. The
pattern of degradation from t=20 to t=78 days appears to follow first-order kinetics, and
the first-order degradation rate constant was calculated to be 0.037 d-1 (see Table 3).
At t=80 days, all remaining live microcosms were respiked with MTBE to a level
of 5 ppm. The MTBE concentration declined to below 0.192 ppm after an incubation
time of 52 days, with no acclimation period. From t=80 to t=132 days, MTBE follows a
first-order degradation pattern, and the first-order degradation rate constant was
calculated to be 0.063 d-1 (see Table 3). The disappearance of the second addition of
MTBE occurred more rapidly than the first, with no distinguishable acclimation period.
Other biodegradation studies have shown that the loss of a second addition of a chemical
occurs faster than the first, with little or no acclimation phase (Alexander, 1994). It is
presumed that the pre-existing petroleum hydrocarbons are responsible for acclimatizing
MTBE degrading microorganisms. MTBE in the controls remained relatively constant,
indicating that little or no biodegradation occurred (Fig. 2).
A second set of microcosms was constructed in which 5 ppm of MTBE was added
along with 1 ppm of toluene and ethyl-benzene. The reasons for adding toluene and
ethyl-benzene were to determine if the indigenous microorganisms will preferentially
utilize toluene and ethyl-benzene, and to determine if the presence of these readily
degradable compounds might stimulate MTBE biodegradation.
Fig. 3 is a plot of MTBE concentration versus time for both live microcosms and
controls. Toluene and ethyl-benzene rapidly degraded (< 10 days) in both live
microcosms and controls. This indicates that we were unable to eradicate growth of
toluene and ethyl-benzene degrading microorganisms. Toluene and ethyl-benzene
persisted in standards prepared for each sampling event, indicating that these compounds
were not lossed to volatilization. Past research has also indicated difficulty in eliminating
microbial growth of BTEX-degrading microorganisms in autoclaved controls
(Goldsmith, 1985).
There was a large amount of scatter in MTBE concentrations between t=11 and
t=33 days, suggesting that degradation and/or abiotic losses may be occurring in some
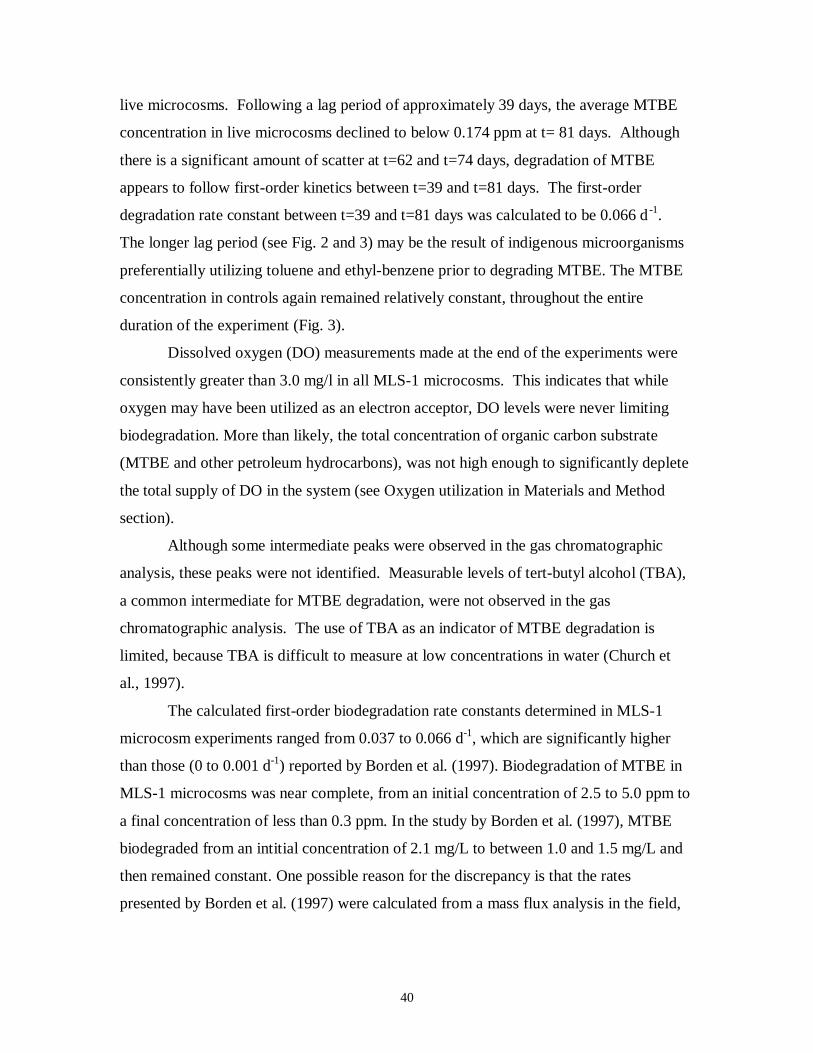
40
live microcosms. Following a lag period of approximately 39 days, the average MTBE
concentration in live microcosms declined to below 0.174 ppm at t= 81 days. Although
there is a significant amount of scatter at t=62 and t=74 days, degradation of MTBE
appears to follow first-order kinetics between t=39 and t=81 days. The first-order
degradation rate constant between t=39 and t=81 days was calculated to be 0.066 d-1.
The longer lag period (see Fig. 2 and 3) may be the result of indigenous microorganisms
preferentially utilizing toluene and ethyl-benzene prior to degrading MTBE. The MTBE
concentration in controls again remained relatively constant, throughout the entire
duration of the experiment (Fig. 3).
Dissolved oxygen (DO) measurements made at the end of the experiments were
consistently greater than 3.0 mg/l in all MLS-1 microcosms. This indicates that while
oxygen may have been utilized as an electron acceptor, DO levels were never limiting
biodegradation. More than likely, the total concentration of organic carbon substrate
(MTBE and other petroleum hydrocarbons), was not high enough to significantly deplete
the total supply of DO in the system (see Oxygen utilization in Materials and Method
section).
Although some intermediate peaks were observed in the gas chromatographic
analysis, these peaks were not identified. Measurable levels of tert-butyl alcohol (TBA),
a common intermediate for MTBE degradation, were not observed in the gas
chromatographic analysis. The use of TBA as an indicator of MTBE degradation is
limited, because TBA is difficult to measure at low concentrations in water (Church et
al., 1997).
The calculated first-order biodegradation rate constants determined in MLS-1
microcosm experiments ranged from 0.037 to 0.066 d-1, which are significantly higher
than those (0 to 0.001 d-1) reported by Borden et al. (1997). Biodegradation of MTBE in
MLS-1 microcosms was near complete, from an initial concentration of 2.5 to 5.0 ppm to
a final concentration of less than 0.3 ppm. In the study by Borden et al. (1997), MTBE
biodegraded from an intitial concentration of 2.1 mg/L to between 1.0 and 1.5 mg/L and
then remained constant. One possible reason for the discrepancy is that the rates
presented by Borden et al. (1997) were calculated from a mass flux analysis in the field,
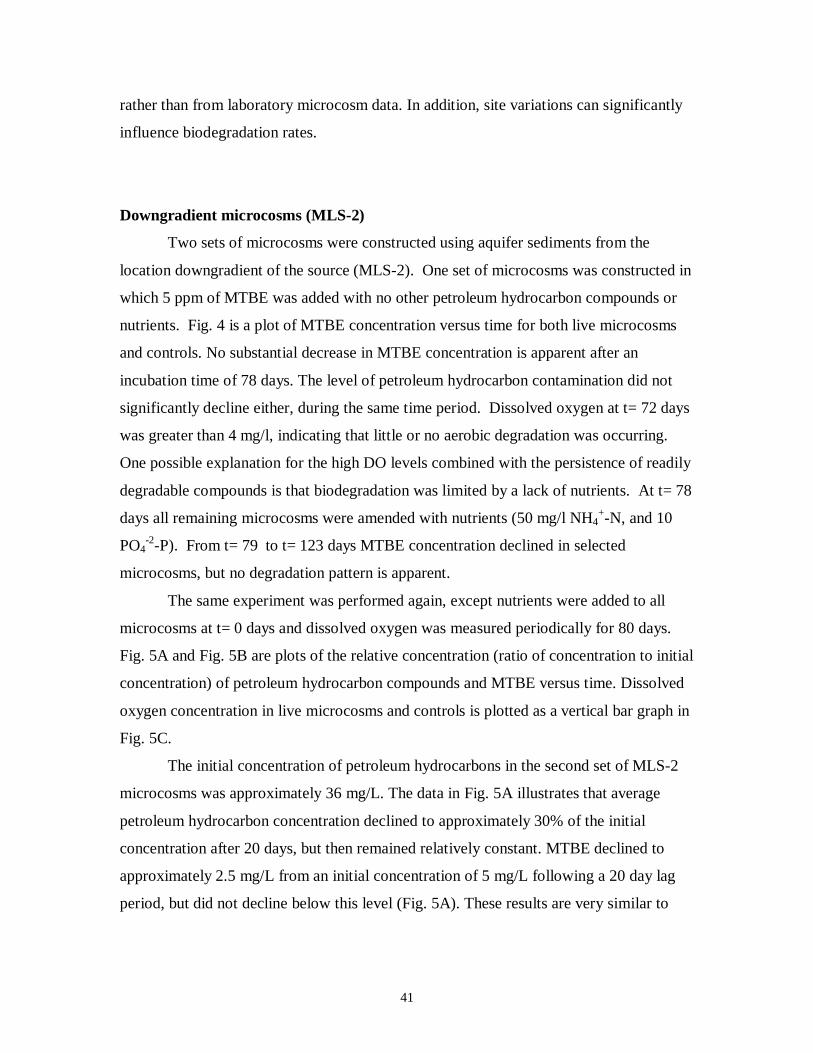
41
rather than from laboratory microcosm data. In addition, site variations can significantly
influence biodegradation rates.
Downgradient microcosms (MLS-2)
Two sets of microcosms were constructed using aquifer sediments from the
location downgradient of the source (MLS-2). One set of microcosms was constructed in
which 5 ppm of MTBE was added with no other petroleum hydrocarbon compounds or
nutrients. Fig. 4 is a plot of MTBE concentration versus time for both live microcosms
and controls. No substantial decrease in MTBE concentration is apparent after an
incubation time of 78 days. The level of petroleum hydrocarbon contamination did not
significantly decline either, during the same time period. Dissolved oxygen at t= 72 days
was greater than 4 mg/l, indicating that little or no aerobic degradation was occurring.
One possible explanation for the high DO levels combined with the persistence of readily
degradable compounds is that biodegradation was limited by a lack of nutrients. At t= 78
days all remaining microcosms were amended with nutrients (50 mg/l NH4+-N, and 10
PO4-2-P). From t= 79 to t= 123 days MTBE concentration declined in selected
microcosms, but no degradation pattern is apparent.
The same experiment was performed again, except nutrients were added to all
microcosms at t= 0 days and dissolved oxygen was measured periodically for 80 days.
Fig. 5A and Fig. 5B are plots of the relative concentration (ratio of concentration to initial
concentration) of petroleum hydrocarbon compounds and MTBE versus time. Dissolved
oxygen concentration in live microcosms and controls is plotted as a vertical bar graph in
Fig. 5C.
The initial concentration of petroleum hydrocarbons in the second set of MLS-2
microcosms was approximately 36 mg/L. The data in Fig. 5A illustrates that average
petroleum hydrocarbon concentration declined to approximately 30% of the initial
concentration after 20 days, but then remained relatively constant. MTBE declined to
approximately 2.5 mg/L from an initial concentration of 5 mg/L following a 20 day lag
period, but did not decline below this level (Fig. 5A). These results are very similar to
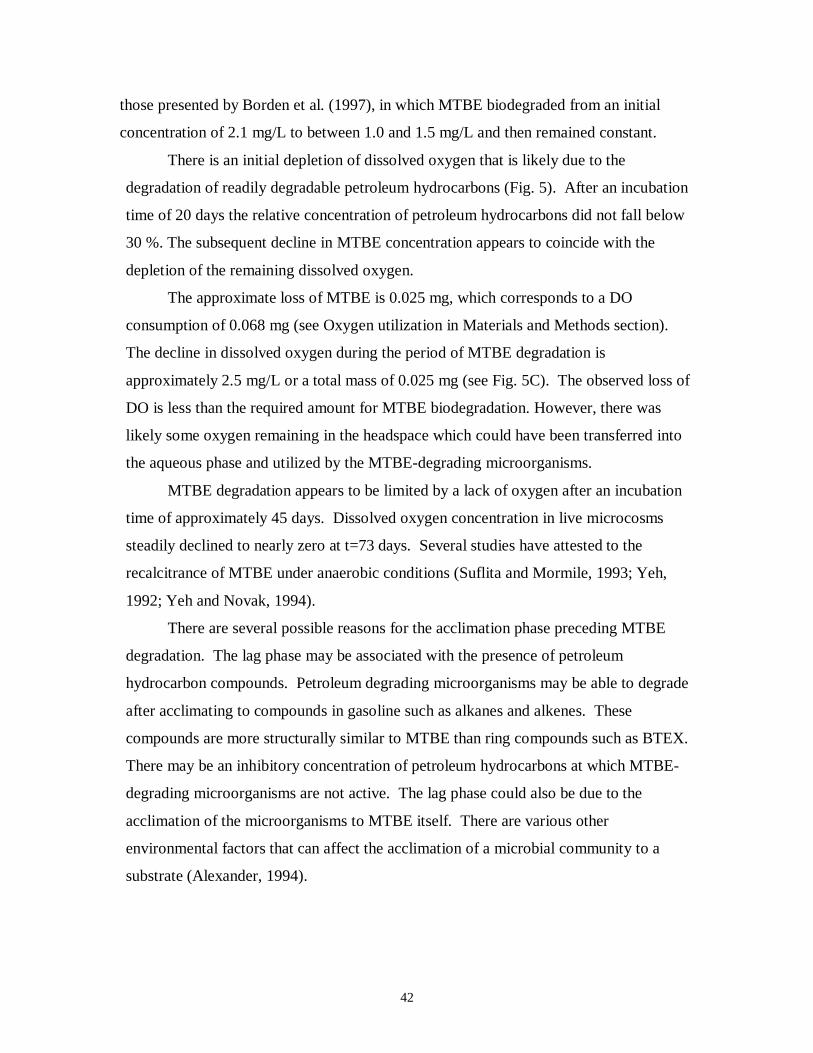
42
those presented by Borden et al. (1997), in which MTBE biodegraded from an initial
concentration of 2.1 mg/L to between 1.0 and 1.5 mg/L and then remained constant.
There is an initial depletion of dissolved oxygen that is likely due to the
degradation of readily degradable petroleum hydrocarbons (Fig. 5). After an incubation
time of 20 days the relative concentration of petroleum hydrocarbons did not fall below
30 %. The subsequent decline in MTBE concentration appears to coincide with the
depletion of the remaining dissolved oxygen.
The approximate loss of MTBE is 0.025 mg, which corresponds to a DO
consumption of 0.068 mg (see Oxygen utilization in Materials and Methods section).
The decline in dissolved oxygen during the period of MTBE degradation is
approximately 2.5 mg/L or a total mass of 0.025 mg (see Fig. 5C). The observed loss of
DO is less than the required amount for MTBE biodegradation. However, there was
likely some oxygen remaining in the headspace which could have been transferred into
the aqueous phase and utilized by the MTBE-degrading microorganisms.
MTBE degradation appears to be limited by a lack of oxygen after an incubation
time of approximately 45 days. Dissolved oxygen concentration in live microcosms
steadily declined to nearly zero at t=73 days. Several studies have attested to the
recalcitrance of MTBE under anaerobic conditions (Suflita and Mormile, 1993; Yeh,
1992; Yeh and Novak, 1994).
There are several possible reasons for the acclimation phase preceding MTBE
degradation. The lag phase may be associated with the presence of petroleum
hydrocarbon compounds. Petroleum degrading microorganisms may be able to degrade
after acclimating to compounds in gasoline such as alkanes and alkenes. These
compounds are more structurally similar to MTBE than ring compounds such as BTEX.
There may be an inhibitory concentration of petroleum hydrocarbons at which MTBE-
degrading microorganisms are not active. The lag phase could also be due to the
acclimation of the microorganisms to MTBE itself. There are various other
environmental factors that can affect the acclimation of a microbial community to a
substrate (Alexander, 1994).
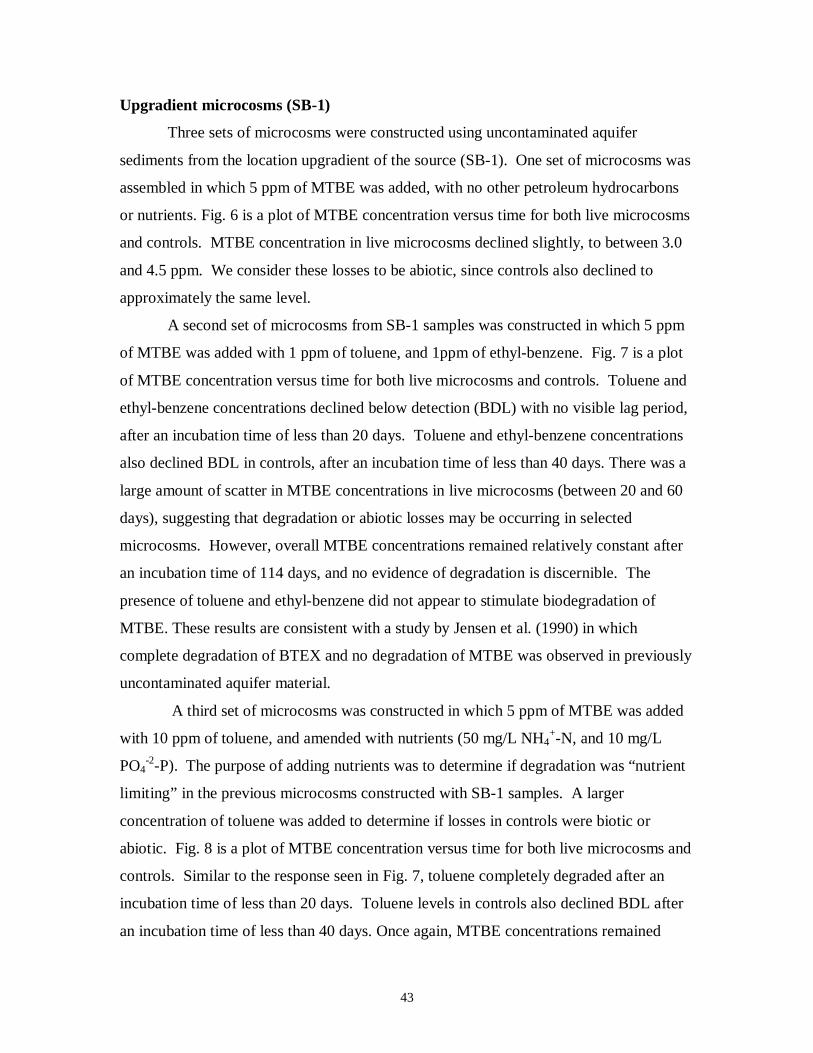
43
Upgradient microcosms (SB-1)
Three sets of microcosms were constructed using uncontaminated aquifer
sediments from the location upgradient of the source (SB-1). One set of microcosms was
assembled in which 5 ppm of MTBE was added, with no other petroleum hydrocarbons
or nutrients. Fig. 6 is a plot of MTBE concentration versus time for both live microcosms
and controls. MTBE concentration in live microcosms declined slightly, to between 3.0
and 4.5 ppm. We consider these losses to be abiotic, since controls also declined to
approximately the same level.
A second set of microcosms from SB-1 samples was constructed in which 5 ppm
of MTBE was added with 1 ppm of toluene, and 1ppm of ethyl-benzene. Fig. 7 is a plot
of MTBE concentration versus time for both live microcosms and controls. Toluene and
ethyl-benzene concentrations declined below detection (BDL) with no visible lag period,
after an incubation time of less than 20 days. Toluene and ethyl-benzene concentrations
also declined BDL in controls, after an incubation time of less than 40 days. There was a
large amount of scatter in MTBE concentrations in live microcosms (between 20 and 60
days), suggesting that degradation or abiotic losses may be occurring in selected
microcosms. However, overall MTBE concentrations remained relatively constant after
an incubation time of 114 days, and no evidence of degradation is discernible. The
presence of toluene and ethyl-benzene did not appear to stimulate biodegradation of
MTBE. These results are consistent with a study by Jensen et al. (1990) in which
complete degradation of BTEX and no degradation of MTBE was observed in previously
uncontaminated aquifer material.
A third set of microcosms was constructed in which 5 ppm of MTBE was added
with 10 ppm of toluene, and amended with nutrients (50 mg/L NH4+-N, and 10 mg/L
PO4-2-P). The purpose of adding nutrients was to determine if degradation was “nutrient
limiting” in the previous microcosms constructed with SB-1 samples. A larger
concentration of toluene was added to determine if losses in controls were biotic or
abiotic. Fig. 8 is a plot of MTBE concentration versus time for both live microcosms and
controls. Similar to the response seen in Fig. 7, toluene completely degraded after an
incubation time of less than 20 days. Toluene levels in controls also declined BDL after
an incubation time of less than 40 days. Once again, MTBE concentrations remained
44
constant after an incubation time of 104 days, indicating that little or no degradation was
occurring. The presence of toluene did not appear to stimulate biodegradation of MTBE.
The addition of nutrients also did not stimulate biodegradation of MTBE in microcosms
constructed with upgradient (SB-1) samples.
The reasons for the difference in biodegradation potential between
uncontaminated and previously contaminated aquifer sediments are not precisely
understood. The difference in physical soil characteristics (uncontaminated soil was
much higher in clay content) may play an important role. One possible explanation is that
MTBE degrading microorganisms are stimulated by the presence of other compounds
(alkanes) in gasoline, which they can use as a growth substrate. After acclimatizing to
the alkanes, the same microorganisms are then able to use MTBE as an electron donor.
Several recent studies have indicated that alkane-oxidizing microorganisms are capable
of biodegrading MTBE (Hyman and O’Reilly, 1999; Garnier et al., 1999).
CONCLUSIONS
In this study, static aquifer sediment/water microcosms were used to evaluate the
biodegradation potential of MTBE by indigenous aerobic microorganisms. Microcosms
were constructed with aquifer material collected from 3 different locations at a gasoline
contaminated site: (1) uncontaminated, upgradient of the contaminant source area (SB-1),
(2) contaminated, near the source area (MLS-1), and (3) contaminated, downgradient of
the source area (MLS-2). The effect of adding readily degradable BTEX compounds
(toluene and ethyl-benzene) was studied in microcosms constructed with SB-1 and MLS-
1 aquifer samples. First-order biodegradation rate constants were calculated from the
slope of MTBE concentration versus time plots, when applicable.
Biodegradation of MTBE was observed in microcosms containing aquifer
sediments previously contaminated with gasoline (MLS-1 and MLS-2), but not in
microcosms containing uncontaminated aquifer sediments (SB-1). In addition,
biodegradation of MTBE was more complete microcosms containing slightly
contaminated ( < 2 mg/L) aquifer samples (MLS-1), than in microcosms containing
45
heavily contaminated (~ 36 mg/L) samples (MLS-2). The calculated first-order
biodegradation rate constants determined in MLS-1 microcosm experiments ranged from
0.037 to 0.066 d-1. The data indicate that biodegradation of MTBE in microcosms
containing MLS-2 aquifer samples, may have been limited by a lack of oxygen available
as an electron acceptor. Oxygen was initially depleted through metabolism of readily
degradable petroleum hydrocarbon compounds. The depletion of the remaining dissolved
oxygen appears to coincide with the decrease in MTBE concentration, until dissolved
oxygen levels approached zero and MTBE concentration remained constant.
Biodegradation of petroleum hydrocarbon compounds and MTBE also appears to be
limited by a lack of nutrients under some conditions.
Toluene and ethyl-benzene rapidly degraded when added to SB-1 and MLS-1
microcosms. The presence of toluene and ethyl-benzene did not appear to stimulate
biodegradation of MTBE in either type of soil condition. Biodegradation of MTBE
occurred with a longer lag period when toluene and ethyl-benzene were added to MLS-1
microcosms, than when MTBE only was added.
There appear to be several unknown factors that control the biodegradation of
MTBE by indigenous microorganisms. The most notable conclusion that can be made is
that indigenous microorganisms exist that are capable of biodegrading MTBE under
aerobic conditions. Additionally, these organisms proliferate in soils that have been
previously contaminated with other petroleum hydrocarbon compounds found in
gasoline.
PRACTICAL APPLICATIONS
The use of intrinsic bioremediation may not be practicable for the attenuation of
MTBE plumes. The ability of MTBE to be transported further than other compounds in
gasoline presents a problem, because biodegradation was only seen in previously
contaminated soils. Therefore, microorganisms at the leading edge of the plume will
only be exposed to MTBE and degradation will not be accelerated. Furthermore, the lack
of oxygen within the gasoline plume will limit MTBE degradation in that area. However,
46
biodegradation of MTBE could be engineered through injection of oxygen into the
gasoline and MTBE contaminated region of the plume.
Air sparging and soil vapor extraction (SVE) are two other strategies that are
being considered for the remediation of MTBE plumes. Air sparging, in which air is
injected below the water table, removes contaminants through air stripping and also
enhances aerobic biodegradation by providing oxygen to the indigenous microorganisms.
SVE involves the extraction of vapors from above the unsaturated zone and the removal
of contaminants from the vadose zone. The higher vapor pressure, higher solubility, and
lower adsorption of MTBE compared to BTEX indicate that air sparging and SVE may
work well for remediating MTBE from groundwater. In a survey of 48 state leaking
underground fuel tank (LUFT) programs, SVE and air sparging were listed as successful
in remediating MTBE contaminated sites (Stocking, 1999; Hitzig et. al, 1998). One
limitation may be the low Henry’s law constant, indicating that MTBE tends to remain
dissolved in water. Another limitation with these strategies is that they may not be
feasible for large plumes, because a very immense number of wells would be needed to
remediate the entire plume.
The injection of a pure or enriched microbial culture is another strategy receiving
increased attention. Cultures such as BC-4 have recently been isolated by Salanitro et al.
(1999). In this approach, an in situ biobarrier of MTBE degrading organisms is injected
in the subsurface. Oxygen is also supplied through a series of injection wells. Results
have indicated successful remediation of MTBE in both field and laboratory experiments.
The limitations of bioaugmentation are that the microbes are slow to grow on MTBE in
the subsurface, and the process can be very expensive. We are currently in the process of
isolating the microorganisms that degrade MTBE. A mathematical model that can
simulate intrinsic biodegradation of MTBE in a gasoline contaminated aquifer is also
being developed.
47
REFERENCES
Ainsworth, S. (1992). “Oxygenates seen as hot market industry.” Chem. Eng. News., 70,
26-30.
Alexander, M. (1994). Biodegradation and Bioremediation. Academic Press, Inc., San
Diego, C.A.
American Petroleum Institute (API). (1998). “Ten frequently asked questions about
MTBE in water.” Soil and Groundwater Research Bulletin: Technical Bulletin No. 3.
Anderson, E.V. (1993). “Health studies indicate MTBE is safe gasoline additive.” Chem.
Eng. News, Sept., 9-18.
ASTM, (1989). Annual Book of ASTM Standards. 4(08).
Barker, J.F., Hubbard, C.E., and Lemon, L.A. (1990). “The influence of methanol and
MTBE on the fate and persistence of monoaromatic hydrocarbons in groundwater.” In
Proceedings of Petroleum Hydrocarbons and Organic Chemicals in Water: Prevention,
Detection, and Restoration. National Water Well Association, 113-127.
Begley, R., and Rotman, D. (1993). “Health complaints fuel federal concern over
MTBE.” Chem. Week, 152(10), 7.
Borden, R.C., Daniel, R.A., Lebrun, L.E. and Davis, C.W. (1997). “Intrinsic
biodegradation of MTBE and BTEX in a gasoline-contaminated aquifer.” Water
Resources Research, 33(5), 1105-1115.
Bouwer, E.J. (1992). “Bioremediation of organic contaminants in the subsurface.”
Environmental Microbiology, Wiley-Liss, Inc., 288-315.
48
Church, C.D., Isabelle, L.M., Pankow, J.F., Rose, D.L., and Tratnyek, P.G. (1997).
“Methtod for determination of methyl tert-butyl ether and its degradation products in
water.” Environ. Sci. Technol, 31(12), 3723-3726.
Costantini, M.G. (1993). “Health effects of oxygenated fuels.” Environmental Health
Perspectives Supplements, 101(6), 151-160.
Cowan, R.M., and Park, K. (1997). "Biodegradation of the gasoline oxygenates MTBE,
ETBE, TAME, TBA, and TAA by aerobic mixed cultures." 523-530.
Cullen, P.G. (1998). “MTBE: A remediation headache.” Environmental Protection, 9(6),
32-35.
Garnier, P., Auria, R., Magana, M., and Revah, S. (1999). “ Cometabolic biodegradation
of methyl t-butyl ether by a soil consortium.” In proceedings of In Situ and On-Site
Bioremediation; The Fifth International Symposium. San Diego, C.A
Goldsmith, C.D. (1985). “ Biodegradation of Methanol and Tertiary Butyl Alcohol in
previously uncontaminated subsurface systems.” .MS thesis, Virginia Polytechnic
Institute and State University, Blacksburg, Virginia.
Hach Company. (1995). “CEL700 Procedures Manual.” 4-20-93-IED,Rev. 2, 3/95
Hardison, L.K., Curry, S.S., Ciuffetti, and Hyman, M.R. (1997). " Metabolism of diethyl
ether and cometabolism of methyl tert-butyl ether by a filamentous fungus, a Graphium
sp." Appl. Environ. Microbiol., 63(8), 3059-3067.
Hurt, K.L., and Wilson, J.T. (1999). “Anaerobic degradation of MTBE in a contaminated
aquifer.” In proceedings of In Situ and On-Site Bioremediation; The Fifth
International Symposium. San Diego, C.A
49
Hyman, m., and O’ Reilly, K. (1999). “Physiological and enzymatic features of MTBE-
degrading bacteria.” In proceedings of In Situ and On-Site Bioremediation; The Fifth
International Symposium. San Diego, C.A
Hyman, M., and O’Reilly, K. (1999). “Physiological and enzymatic features of MTBE-
degrading bacteria.” In proceedings of In Situ and On-Site Bioremediation; The Fifth
International Symposium. San Diego, C.A
Jensen, H.M. and Arvin, E. (1990). “Solubility and degradability of the gasoline additive
MTBE and gasoline compounds in water.” In Contaminated Soil ’90, 445-448.
Landmeyer, J.E., Chapelle, F.H., Bradley, P.M. Pankow, J.F., Church, C.D., Tratnyek,
P.G. (1998). "”Fate of MTBE relative to benzene in a gasoline-contaminated aquifer.”
Ground Water Monitoring Review, 93-102.
Law Engineering. (1998a). “Test boring record, building 1124, Fort Belvoir, Virginia.”
Project # 20320-7-1836.04.
Law Engineering. (1998b). “Preliminary petroleum hydrocarbon assessment, building
1124, Fort Belvoir, Virginia.” Project # 20320-7-1836.04.
Malinowski,J. (1998). “MTBE causes foul tastes and odors in water.” Water Technol.,
21(2), 120-122.
McCarthy, J.E., and Tiemann, M. (1998). “MTBE in gasoline: Clean air and drinking
water issues.” CRS Report for Congress. Environment and Natural Resources Policy
Division.
McCloskey, C.B. (1995). “Biodegradation of Benzene in soil systems.” MS thesis,
Virginia Polytechnic Institute and State University, Blacksburg, Virginia.
50
Mixon, R.B., Berquist,C.R., Newell, W.L., and Johnson, G.H. (1989), “Geologic map
and generalized cross sections of the Coastal Plain and adjacent parts of the Piedmont,
Virginia.” U.S. Geological Survey Miscellaneous Investigations Series Map I-2033,
scale 1:250000.
Mormille, M.R., Liu, S., and Suflita, J.M. (1994). “Anaerobic biodegradation of gasoline
oxygenates: Extrapolation of information to multiple sites and redox conditions.”
Environ. Sci. Technol., 28, 1727-1732.
Nielsen, P.H., Bjerg, P.L., Nielsen. P., Smith, P., and Christensen, T.H. (1996). “In situ
laboratory determined first-order degradation rate constants of specific organic
compounds in an aerobic aquifer.” Environ. Sci. Technol, 30, 31-37.
Odencrantz, J.E. (1998). "Implications of MTBE for intrinsic remediation of underground
fuel tank sites." Remediation., 8(3), 7-16.
Pritchard, P.H. and Bourquin, A.W. (1984). “The use of microcosms for evaluation of
interactions between pollutants and microorganisms.” 133-215.
Salanitro, J.P., Diaz,L.A., Williams, M.P., and Wisniewski, H.L. (1994) "Isolation of a
bacterial culture that degrades methyl t-butyl ether." Appl. Environ. Microbiol., 60(7),
2593-2596.
Salanitro, J.P., Spinnler, G.E., Neaville, C.C., Maner, P.M., Stearns, S.M., Johnson, P.C.,
Bruce, C. (1999). “Demonstration of the enhanced MTBE bioremediation (EMB) in
situ process.” In proceedings of In Situ and On-Site Bioremediation; The Fifth
International Symposium. San Diego, C.A.
Shelley, S., and Fouhy, K. (1994). “Drive for cleaner burning fuel.” Chem. Eng. J., Jan.,
61-63.
51
Squillance, P.J., Zogorski, J.S., Wilber, W.G., and Price, C.V. (1996). “Preliminary
assessment of the occurrence and possible sources of MTBE in groundwater in the
United States, 1993-1994.” Environ. Sci. Technol., 30, 1721-1730.
Suflita, J.M. and Mormile, M.R. (1993). “Anaerobic biodegradation of known and
potential gasoline oxygenates in the terrestrial subsurface.” Environ. Sci. Technol, 27,
976-978.
USEPA (1998). “Use and distribution of MTBE and ethanol.” EPA 510-F-97-016.
USEPA. (1997). “Drinking water advisory: Consumer acceptability advice and health
effects analysis on methyl tertiary-butyl ether.” EPA-822-F-97-009.
USEPA: Office of Pollution Prevention and Toxics. (1994). “Chemical summary for
methyl-tert butyl ether.” EPA 749-F-94-017a.
Yeh, C.K., and Novak, J.T. (1994). “Anaerobic biodegradation of gasoline oxygenates in
soils.” Water Env. Res., 66(5), 744-752.
Zenker, M.J., Borden, R.C., and Barlaz, M.A. (1999). “Investigation of the intrinsic
biodegradation of alkyl and cyclic ethers.” In proceedings of In Situ and On-Site
Bioremediation; The Fifth International Symposium. San Diego, C.A.

52
FIGURES AND TABLES
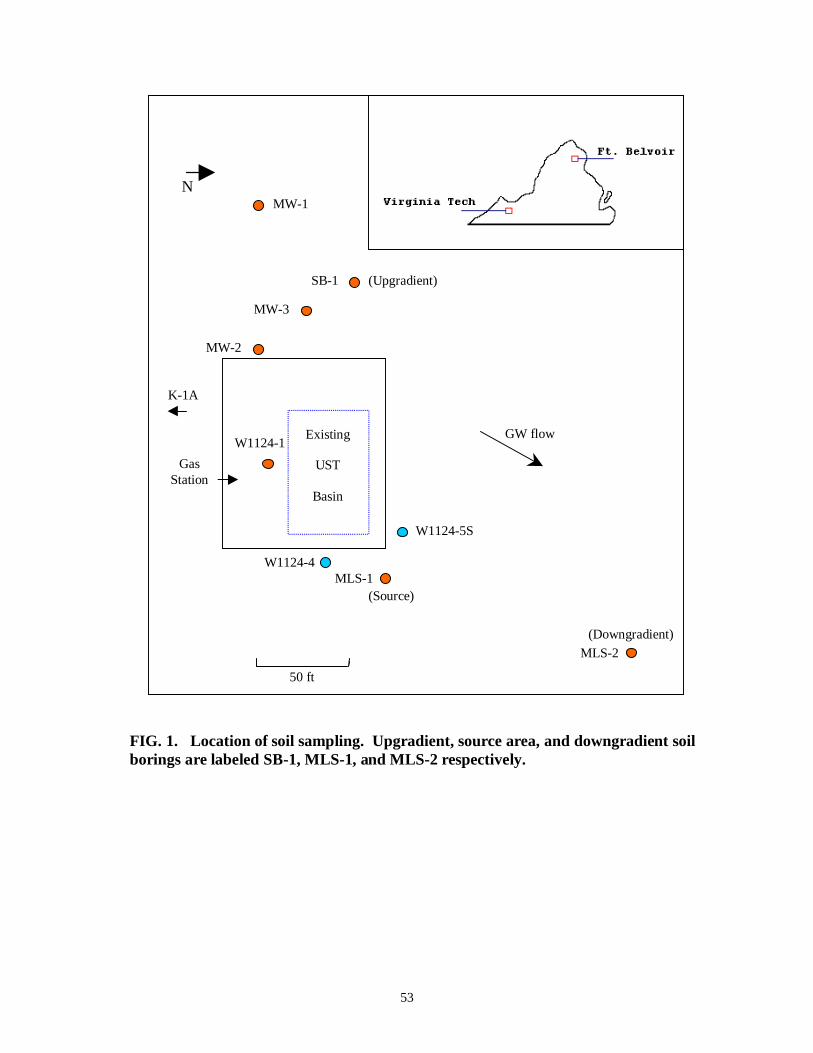
53
FIG. 1. Location of soil sampling. Upgradient, source area, and downgradient soilborings are labeled SB-1, MLS-1, and MLS-2 respectively.
GasStation
Existing
UST
Basin
GW flow
SB-1
W1124-4MLS-1
W1124-5S
MLS-2
50 ft
N
MW-2
MW-3
K-1A
W1124-1
(Downgradient)
(Source)
(Upgradient)
MW-1
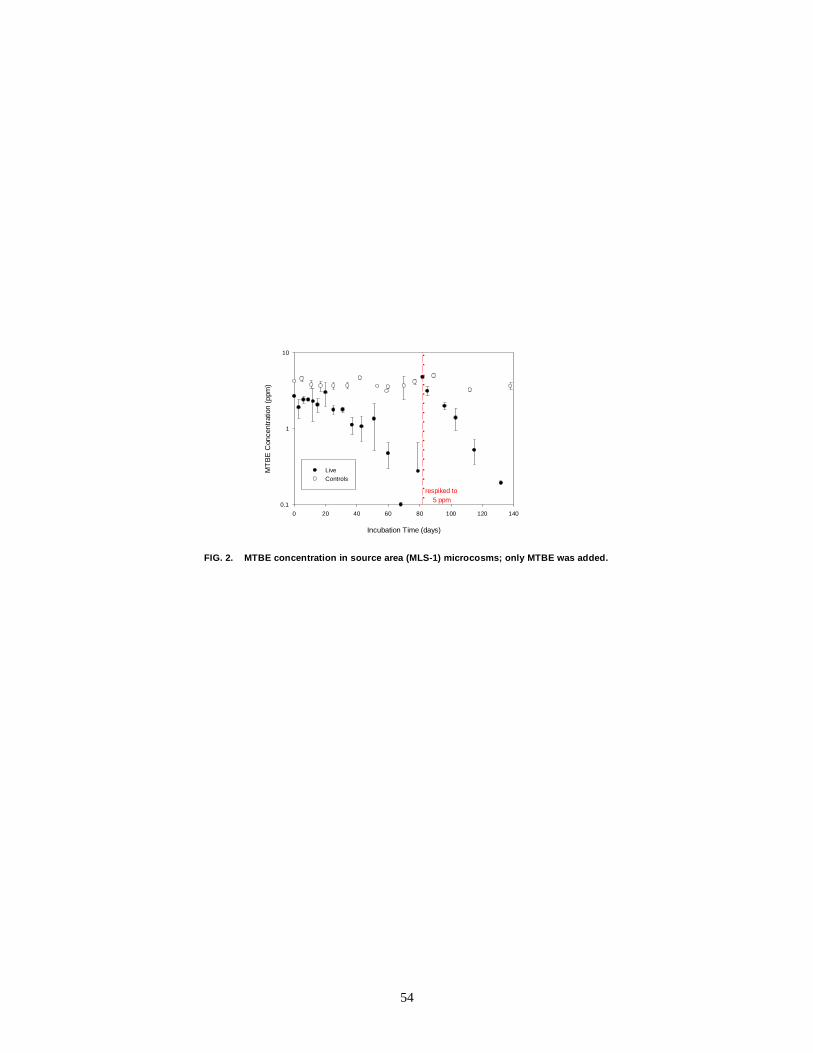
54
Incubation Time (days)
0 20 40 60 80 100 120 140
MT
BE
Con
cent
ratio
n (p
pm)
0.1
1
10
LiveControls
respiked to 5 ppm
FIG. 2. MTBE concentration in source area (MLS-1) microcosms; only MTBE was added.
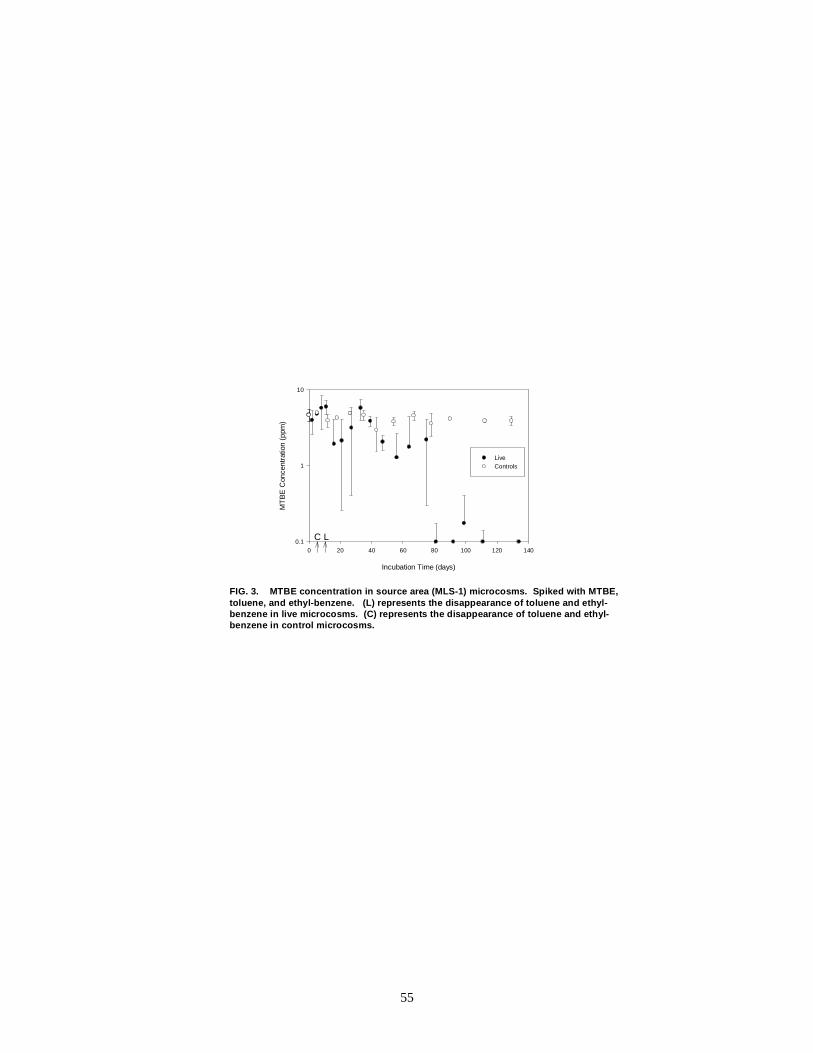
55
FIG. 3. MTBE concentration in source area (MLS-1) microcosms. Spiked with MTBE,toluene, and ethyl-benzene. (L) represents the disappearance of toluene and ethyl-benzene in live microcosms. (C) represents the disappearance of toluene and ethyl-benzene in control microcosms.
Incubation Time (days)
0 20 40 60 80 100 120 140
MT
BE
Con
cent
ratio
n (p
pm)
0.1
1
10
LiveControls
LC
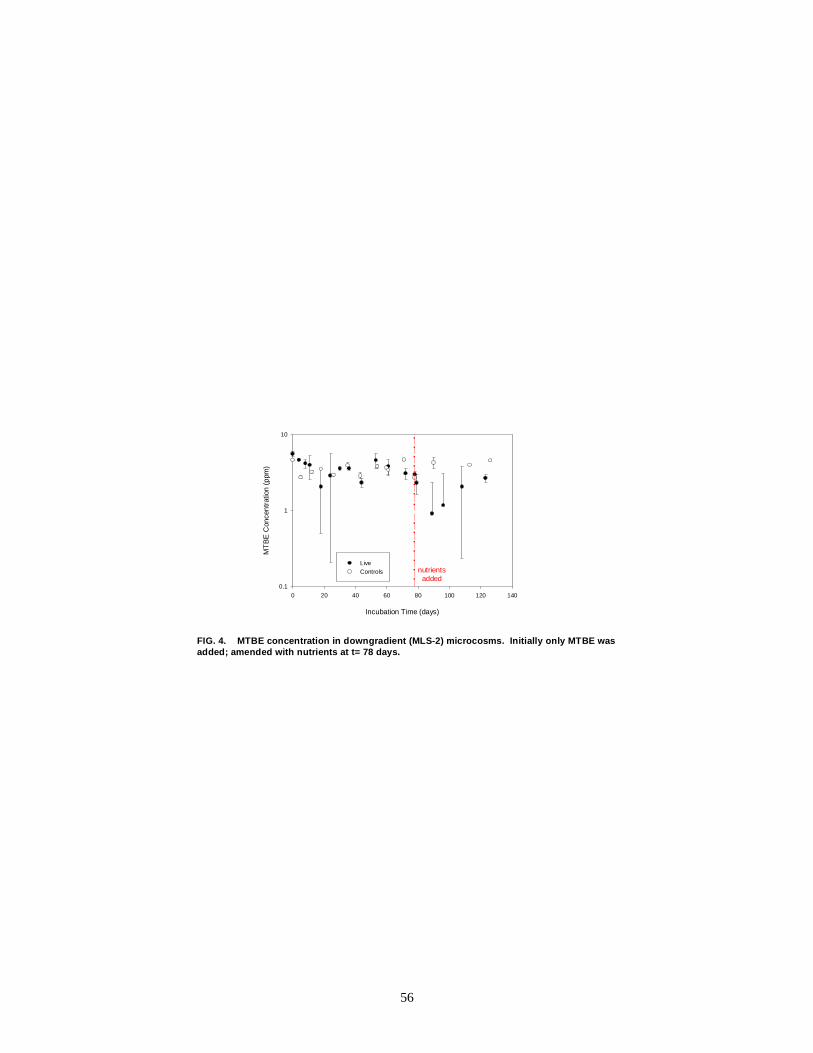
56
FIG. 4. MTBE concentration in downgradient (MLS-2) microcosms. Initially only MTBE wasadded; amended with nutrients at t= 78 days.
Incubation Time (days)
0 20 40 60 80 100 120 140
MT
BE
Con
cent
ratio
n (p
pm)
0.1
1
10
LiveControls nutrients
added
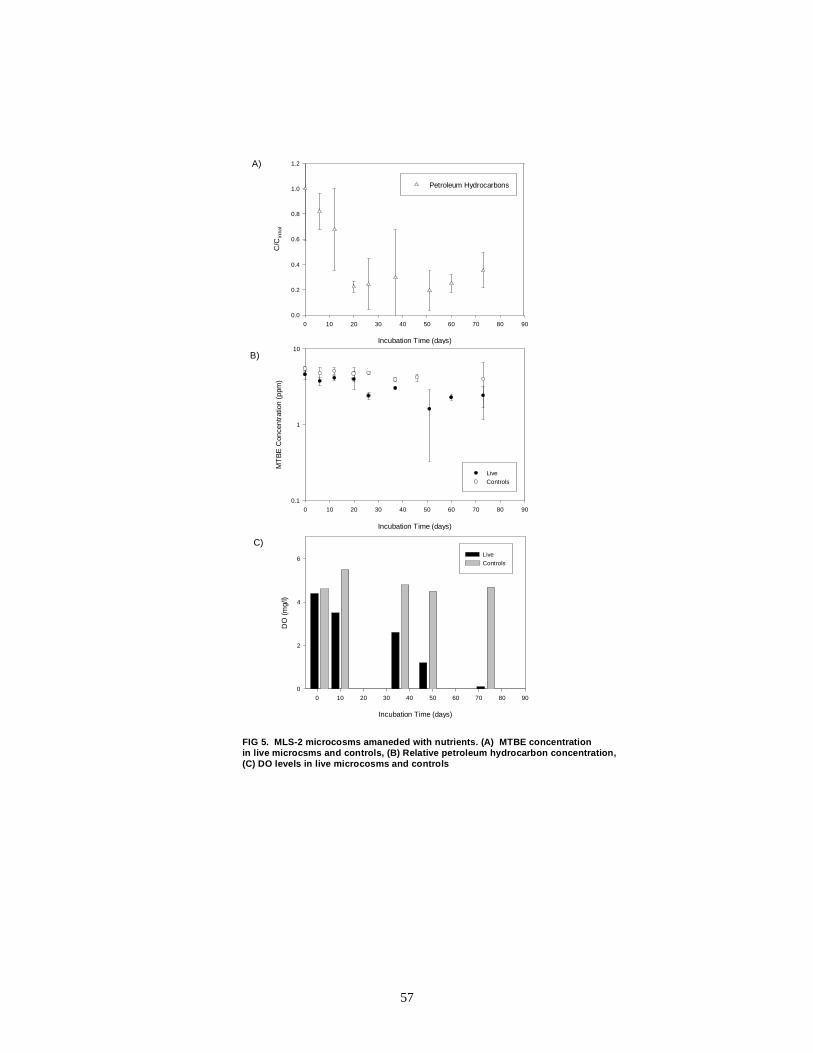
57
A)
FIG 5. MLS-2 microcosms amaneded with nutrients. (A) MTBE concentrationin live microcsms and controls, (B) Relative petroleum hydrocarbon concentration, (C) DO levels in live microcosms and controls
Incubation Time (days)
0 10 20 30 40 50 60 70 80 90
DO
(m
g/l)
0
2
4
6LiveControls
Incubation Time (days)
0 10 20 30 40 50 60 70 80 90
C/C
initi
al
0.0
0.2
0.4
0.6
0.8
1.0
1.2
Petroleum Hydrocarbons
Incubation Time (days)
0 10 20 30 40 50 60 70 80 90
MT
BE
Con
cent
ratio
n (p
pm)
0.1
1
10
LiveControls
B)
C)
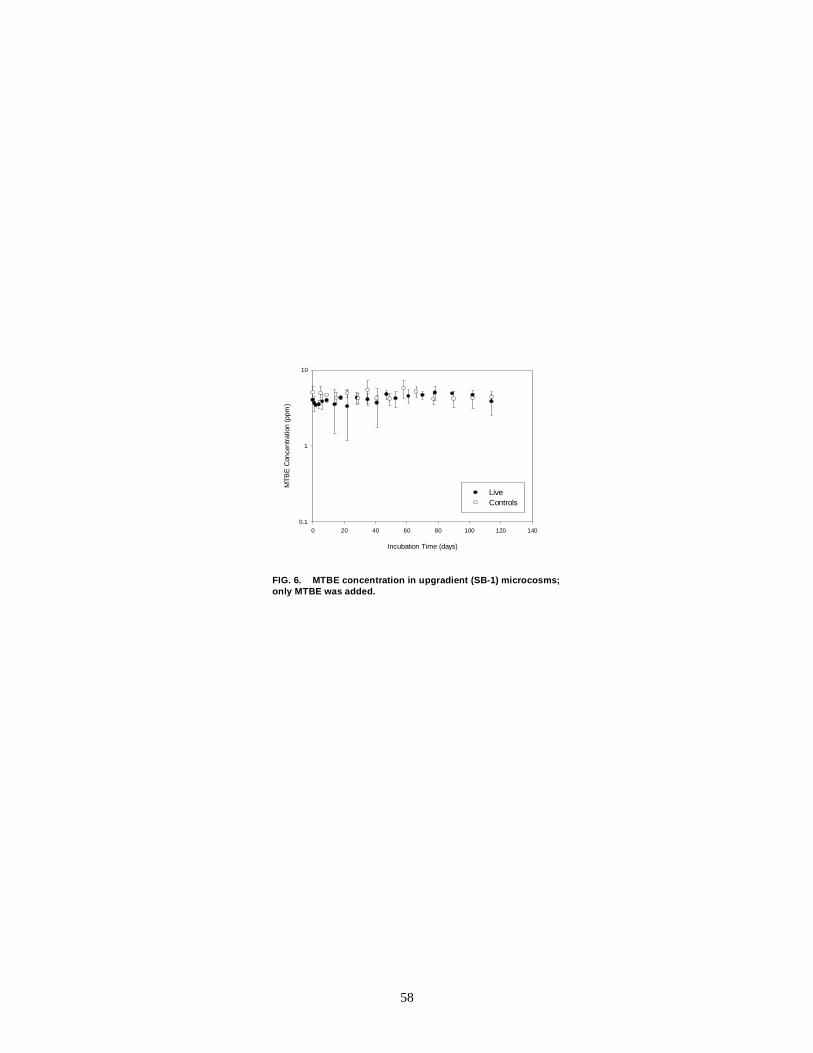
58
FIG. 6. MTBE concentration in upgradient (SB-1) microcosms;only MTBE was added.
Incubation Time (days)
0 20 40 60 80 100 120 140
MT
BE
Con
cent
ratio
n (p
pm)
0.1
1
10
LiveControls
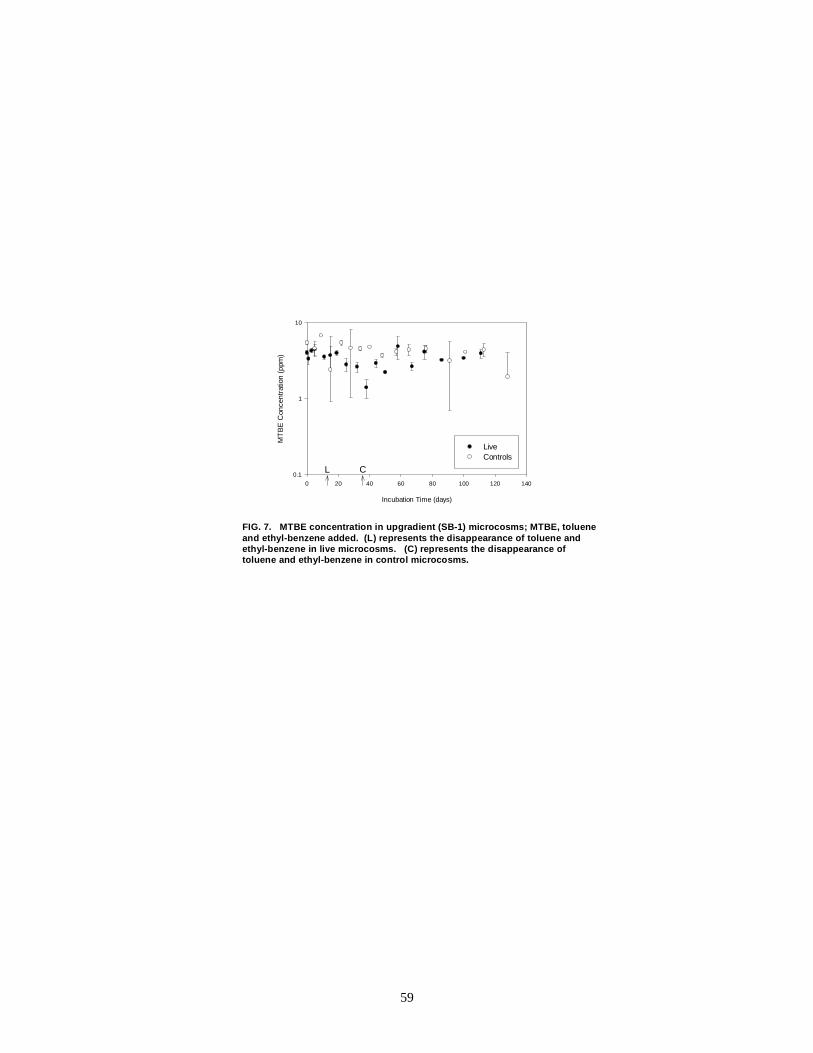
59
FIG. 7. MTBE concentration in upgradient (SB-1) microcosms; MTBE, tolueneand ethyl-benzene added. (L) represents the disappearance of toluene andethyl-benzene in live microcosms. (C) represents the disappearance oftoluene and ethyl-benzene in control microcosms.
Incubation Time (days)
0 20 40 60 80 100 120 140
MT
BE
Con
cent
ratio
n (p
pm)
0.1
1
10
LiveControls
CL
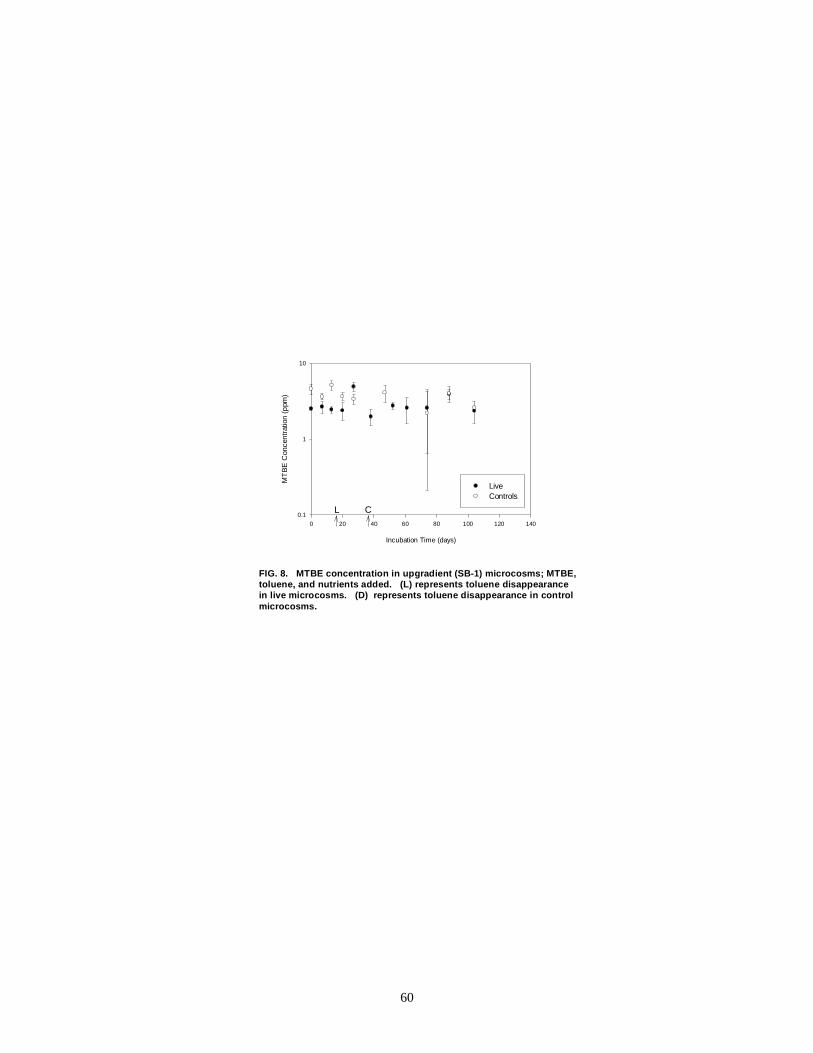
60
Incubation Time (days)
0 20 40 60 80 100 120 140
MT
BE
Con
cent
ratio
n (p
pm)
0.1
1
10
FIG. 8. MTBE concentration in upgradient (SB-1) microcosms; MTBE, toluene, and nutrients added. (L) represents toluene disappearancein live microcosms. (D) represents toluene disappearance in controlmicrocosms.
LiveControls
L C
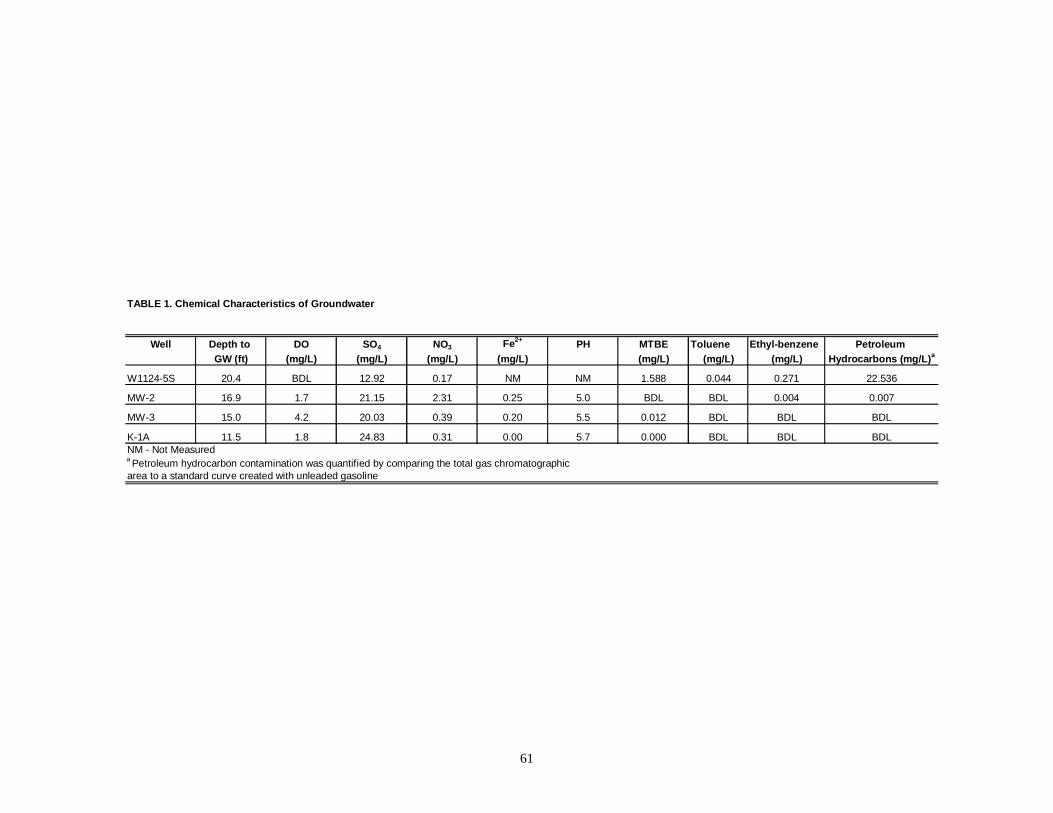
61
TABLE 1. Chemical Characteristics of Groundwater
Well Depth to DO SO 4 NO3 Fe2+ PH MTBE Toluene Ethyl-benzene Petroleum GW (ft) (mg/L) (mg/L) (mg/L) (mg/L) (mg/L) (mg/L) (mg/L) Hydrocarbons (mg/L) a
W1124-5S 20.4 BDL 12.92 0.17 NM NM 1.588 0.044 0.271 22.536
MW-2 16.9 1.7 21.15 2.31 0.25 5.0 BDL BDL 0.004 0.007
MW-3 15.0 4.2 20.03 0.39 0.20 5.5 0.012 BDL BDL BDL
K-1A 11.5 1.8 24.83 0.31 0.00 5.7 0.000 BDL BDL BDLNM - Not Measureda Petroleum hydrocarbon contamination was quantified by comparing the total gas chromatographic area to a standard curve created with unleaded gasoline
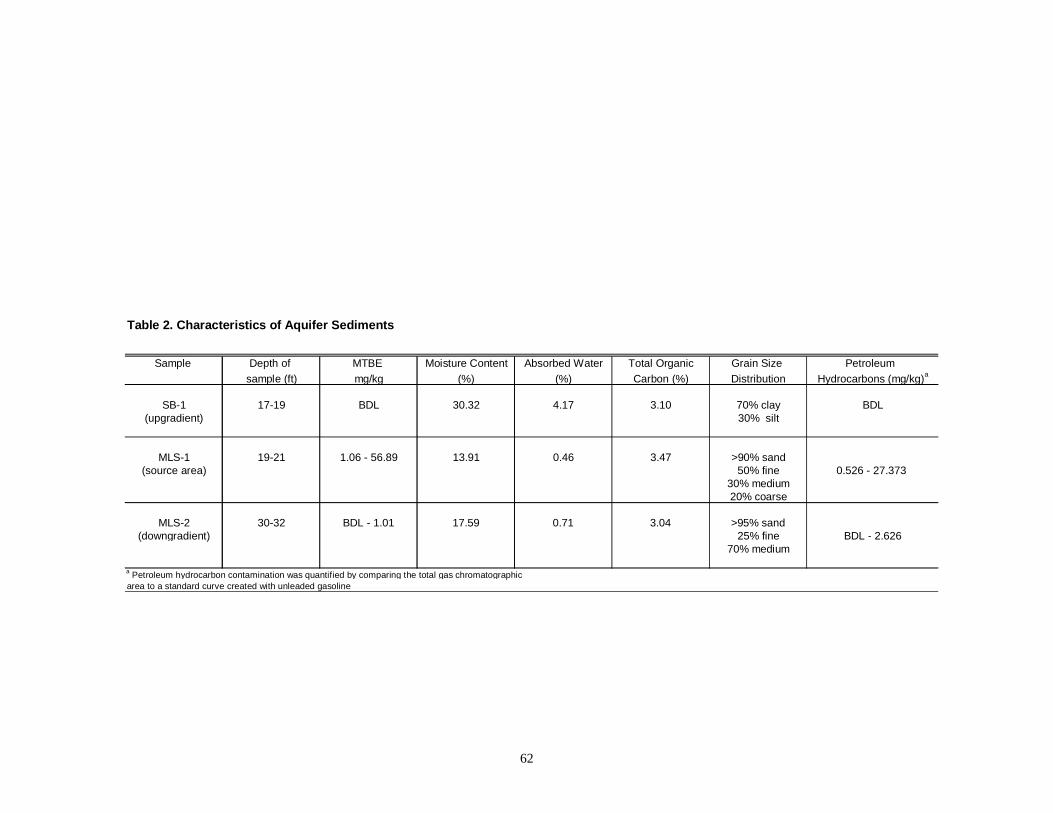
62
Table 2. Characteristics of Aquifer Sediments
Sample Depth of MTBE Moisture Content Absorbed Water Total Organic Grain Size Petroleum sample (ft) mg/kg (%) (%) Carbon (%) Distribution Hydrocarbons (mg/kg)a
SB-1 17-19 BDL 30.32 4.17 3.10 70% clay BDL(upgradient) 30% silt
MLS-1 19-21 1.06 - 56.89 13.91 0.46 3.47 >90% sand(source area) 50% fine 0.526 - 27.373
30% medium20% coarse
MLS-2 30-32 BDL - 1.01 17.59 0.71 3.04 >95% sand(downgradient) 25% fine BDL - 2.626
70% medium
a Petroleum hydrocarbon contamination was quantified by comparing the total gas chromatographic area to a standard curve created with unleaded gasoline
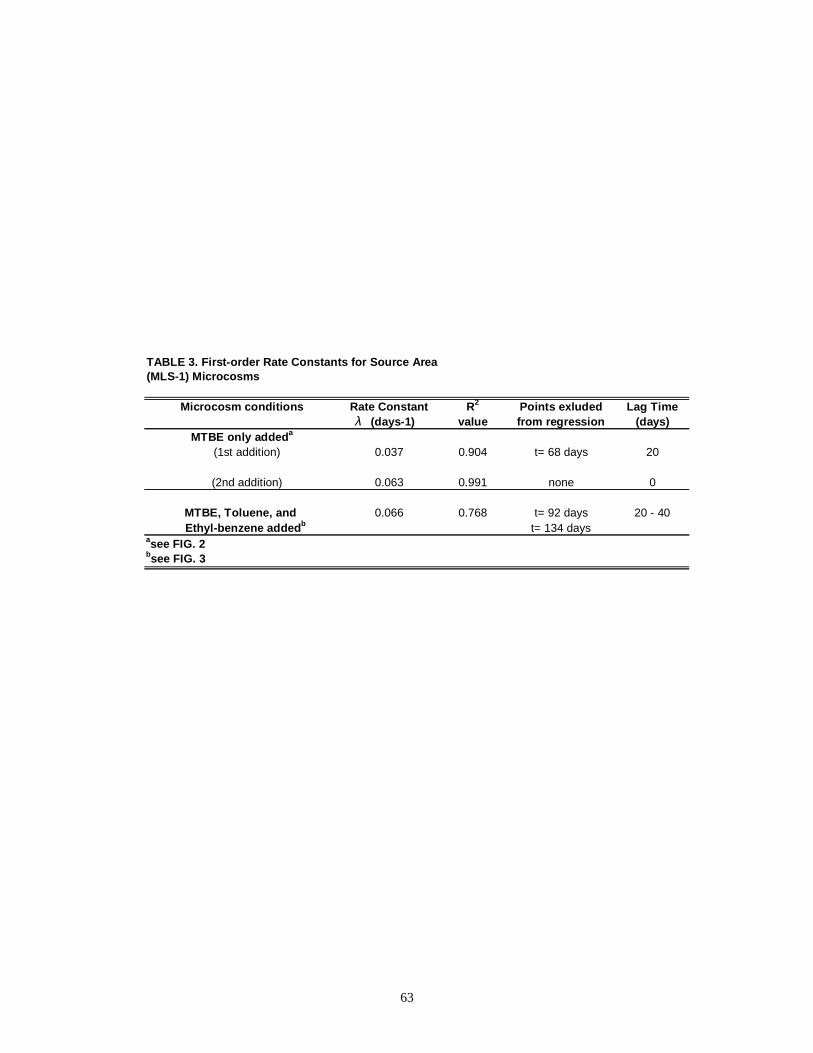
63
TABLE 3. First-order Rate Constants for Source Area (MLS-1) Microcosms
Microcosm conditions Rate Constant R 2 Points exluded Lag Time (days-1) value from regression (days)
MTBE only added a
(1st addition) 0.037 0.904 t= 68 days 20
(2nd addition) 0.063 0.991 none 0
MTBE, Toluene, and 0.066 0.768 t= 92 days 20 - 40 Ethyl-benzene added b t= 134 days
asee FIG. 2bsee FIG. 3
λ

64
APPENDIX
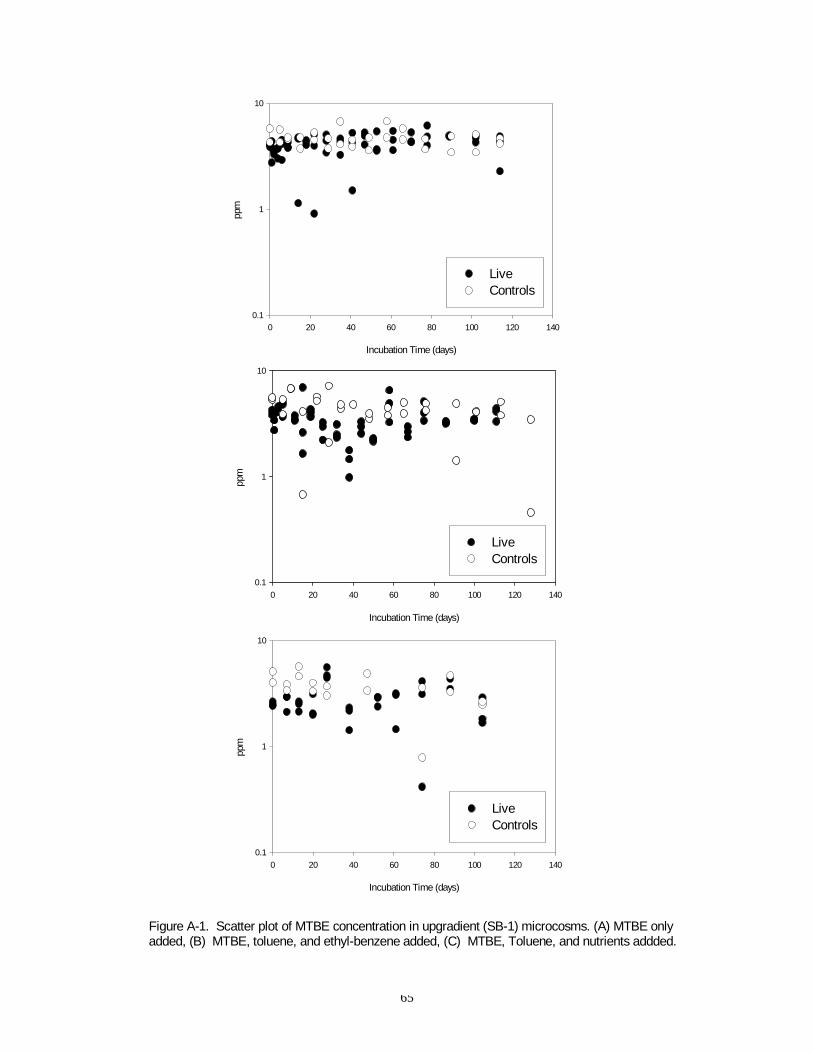
65
Incubation Time (days)
0 20 40 60 80 100 120 140
ppm
0.1
1
10
Incubation Time (days)
0 20 40 60 80 100 120 140
ppm
0.1
1
10
Incubation Time (days)
0 20 40 60 80 100 120 140
ppm
0.1
1
10
LiveControls
LiveControls
LiveControls
Figure A-1. Scatter plot of MTBE concentration in upgradient (SB-1) microcosms. (A) MTBE onlyadded, (B) MTBE, toluene, and ethyl-benzene added, (C) MTBE, Toluene, and nutrients addded.
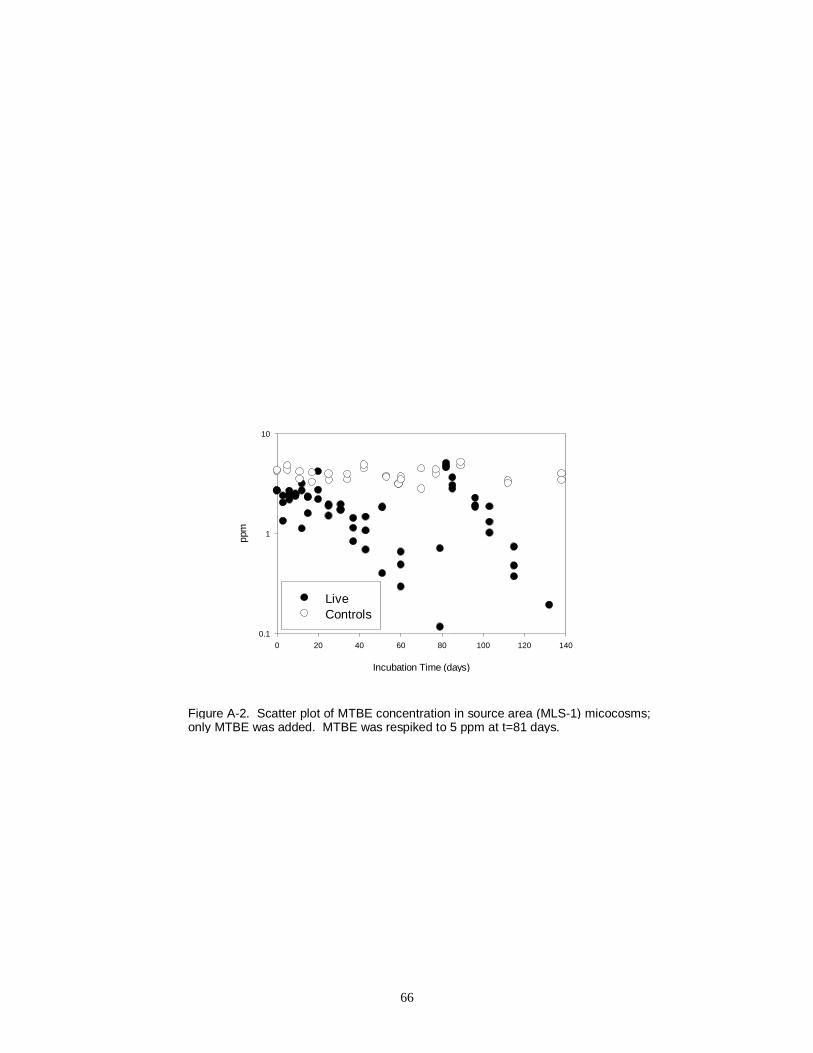
66
respiked to 5 ppm
Incubation Time (days)
0 20 40 60 80 100 120 140
ppm
0.1
1
10
LiveControls
Figure A-2. Scatter plot of MTBE concentration in source area (MLS-1) micocosms;only MTBE was added. MTBE was respiked to 5 ppm at t=81 days.
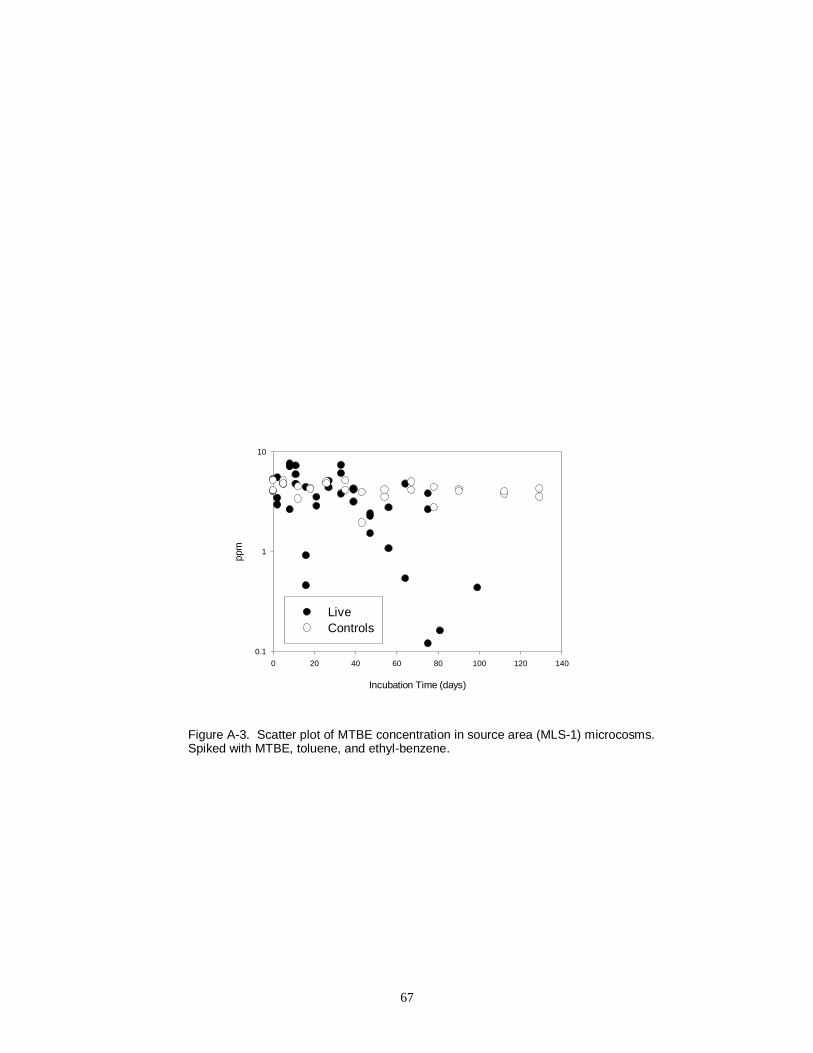
67
Incubation Time (days)
0 20 40 60 80 100 120 140
ppm
0.1
1
10
LiveControls
Figure A-3. Scatter plot of MTBE concentration in source area (MLS-1) microcosms.Spiked with MTBE, toluene, and ethyl-benzene.
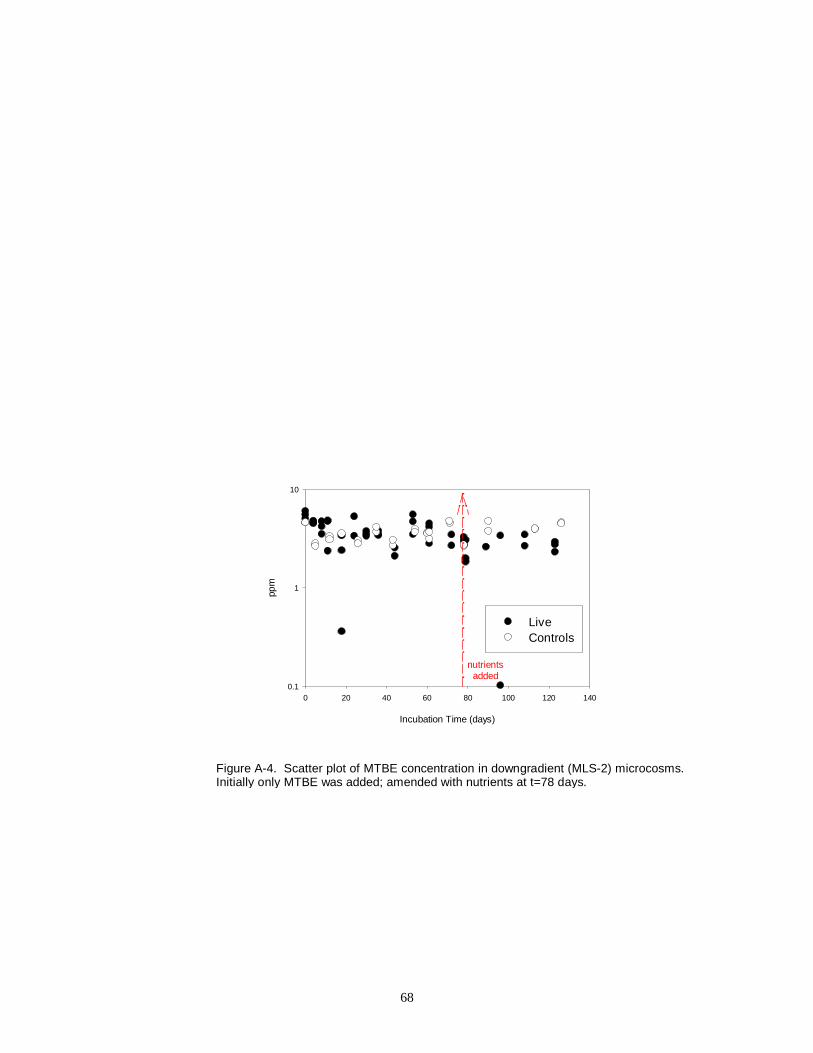
68
Incubation Time (days)
0 20 40 60 80 100 120 140
ppm
0.1
1
10
LiveControls
nutrientsadded
Figure A-4. Scatter plot of MTBE concentration in downgradient (MLS-2) microcosms.Initially only MTBE was added; amended with nutrients at t=78 days.
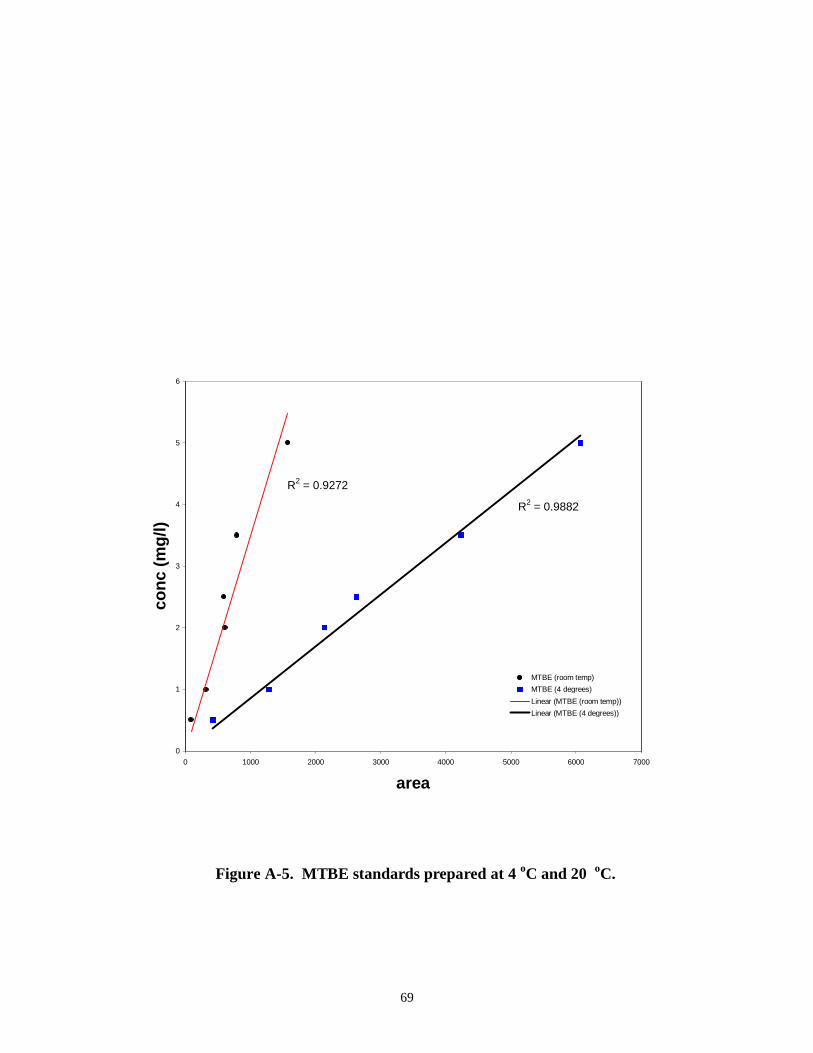
69
Figure A-5. MTBE standards prepared at 4 oC and 20 oC.
R2 = 0.9272
R2 = 0.9882
0
1
2
3
4
5
6
0 1000 2000 3000 4000 5000 6000 7000
area
conc
(m
g/l)
MTBE (room temp)
MTBE (4 degrees)
Linear (MTBE (room temp))
Linear (MTBE (4 degrees))
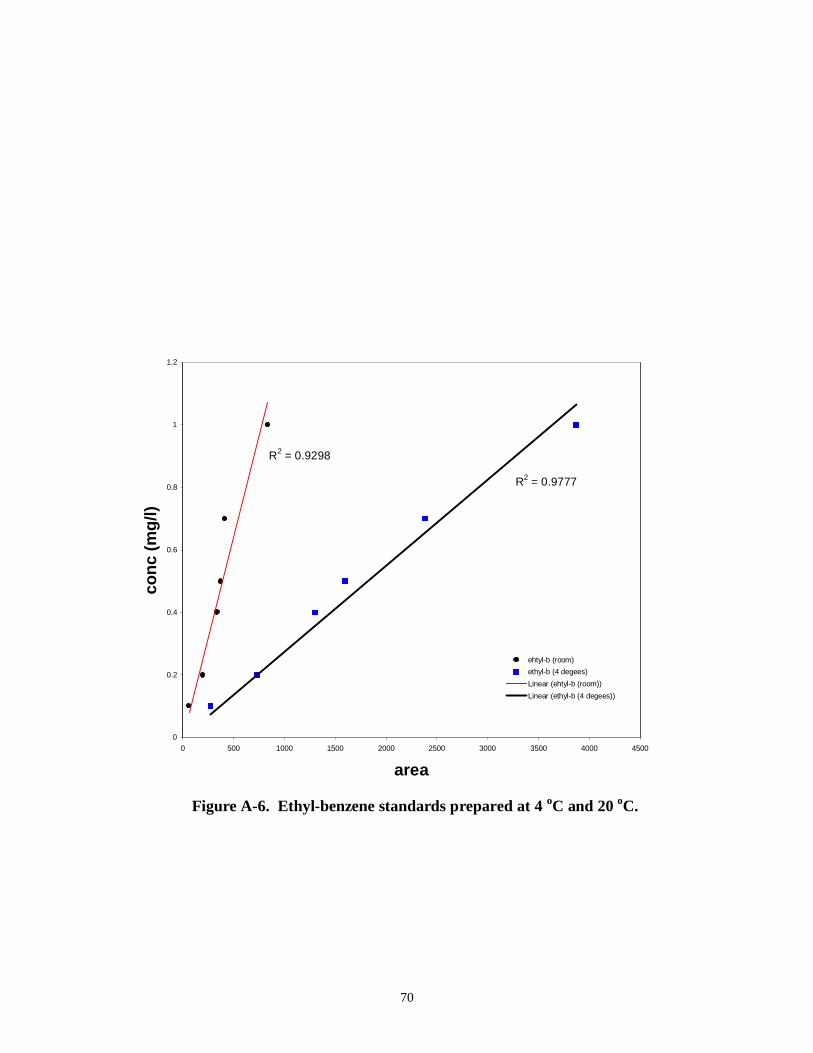
70
Figure A-6. Ethyl-benzene standards prepared at 4 oC and 20 oC.
R2 = 0.9298
R2 = 0.9777
0
0.2
0.4
0.6
0.8
1
1.2
0 500 1000 1500 2000 2500 3000 3500 4000 4500
area
conc
(m
g/l)
ehtyl-b (room)
ethyl-b (4 degees)
Linear (ehtyl-b (room))
Linear (ethyl-b (4 degees))
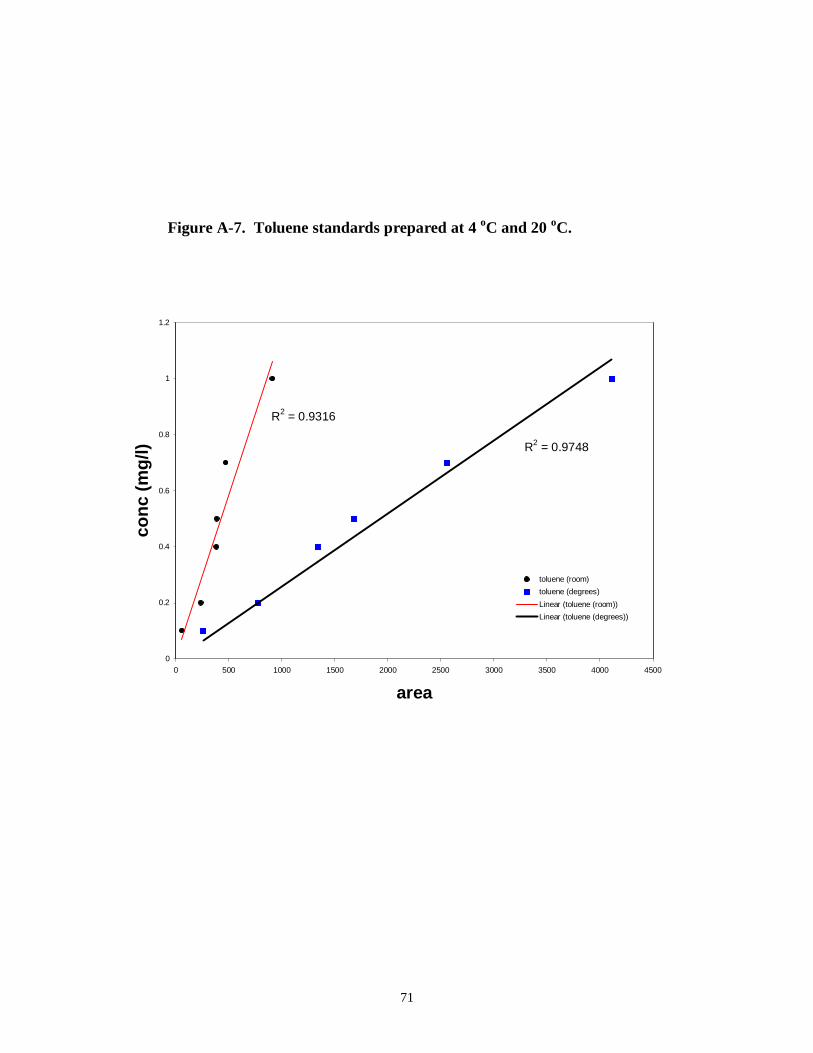
71
Figure A-7. Toluene standards prepared at 4 oC and 20 oC.
R2 = 0.9316
R2 = 0.9748
0
0.2
0.4
0.6
0.8
1
1.2
0 500 1000 1500 2000 2500 3000 3500 4000 4500
area
conc
(m
g/l)
toluene (room)
toluene (degrees)
Linear (toluene (room))
Linear (toluene (degrees))
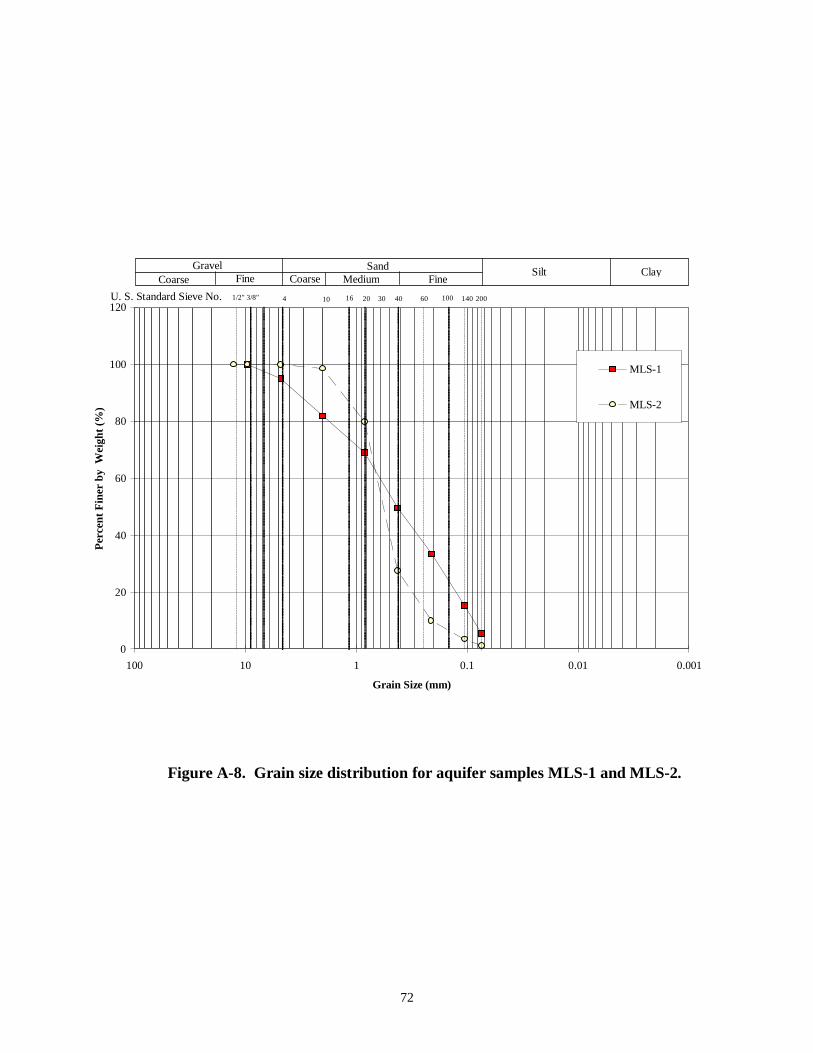
72
Figure A-8. Grain size distribution for aquifer samples MLS-1 and MLS-2.
0
20
40
60
80
100
120
0.0010.010.1110100
Grain Size (mm)
Per
cent
Fin
er b
y W
eigh
t (%
)
MLS-1
MLS-2
GravelCoarse Fine
SandCoarse Medium Fine
Silt Clay
U. S. Standard Sieve No. 3/8" 10 16 20 30 401/2" 60 100 140 2004
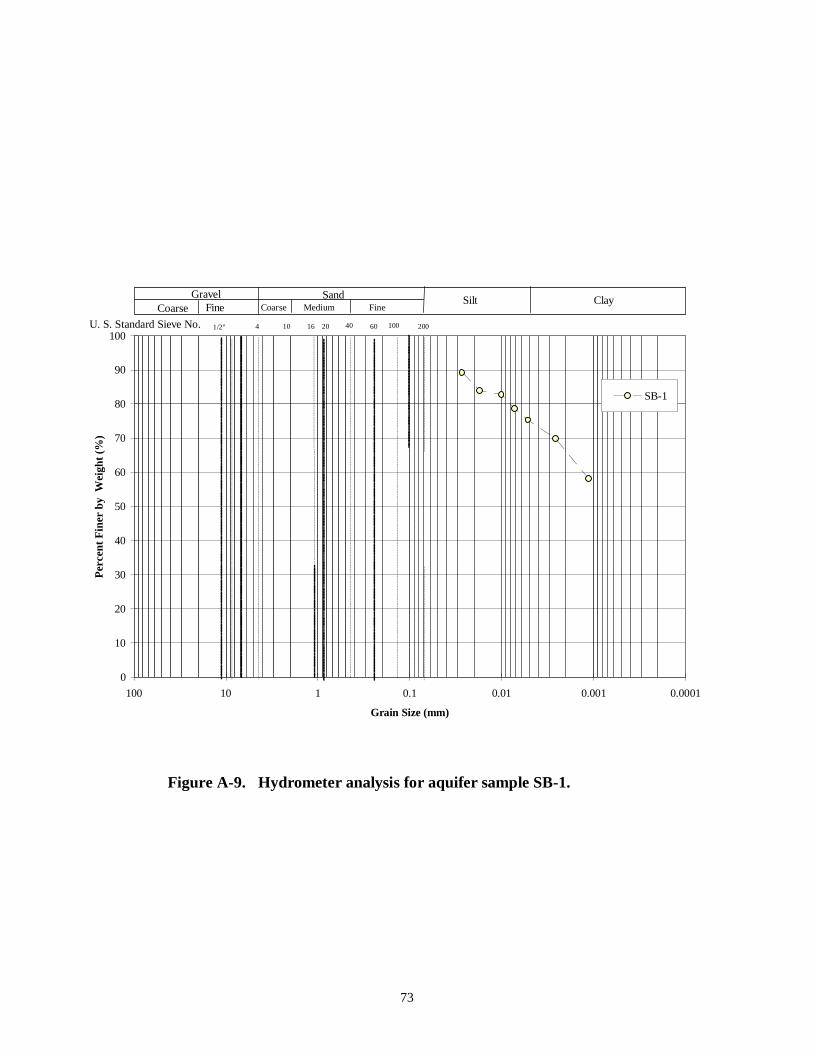
73
Figure A-9. Hydrometer analysis for aquifer sample SB-1.
0
10
20
30
40
50
60
70
80
90
100
0.00010.0010.010.1110100
Grain Size (mm)
Per
cent
Fin
er b
y W
eigh
t (%
)
SB-1
GravelCoarse Fine
SandCoarse Medium Fine
Silt Clay
U. S. Standard Sieve No. 10 16 20 401/2" 60 100 2004
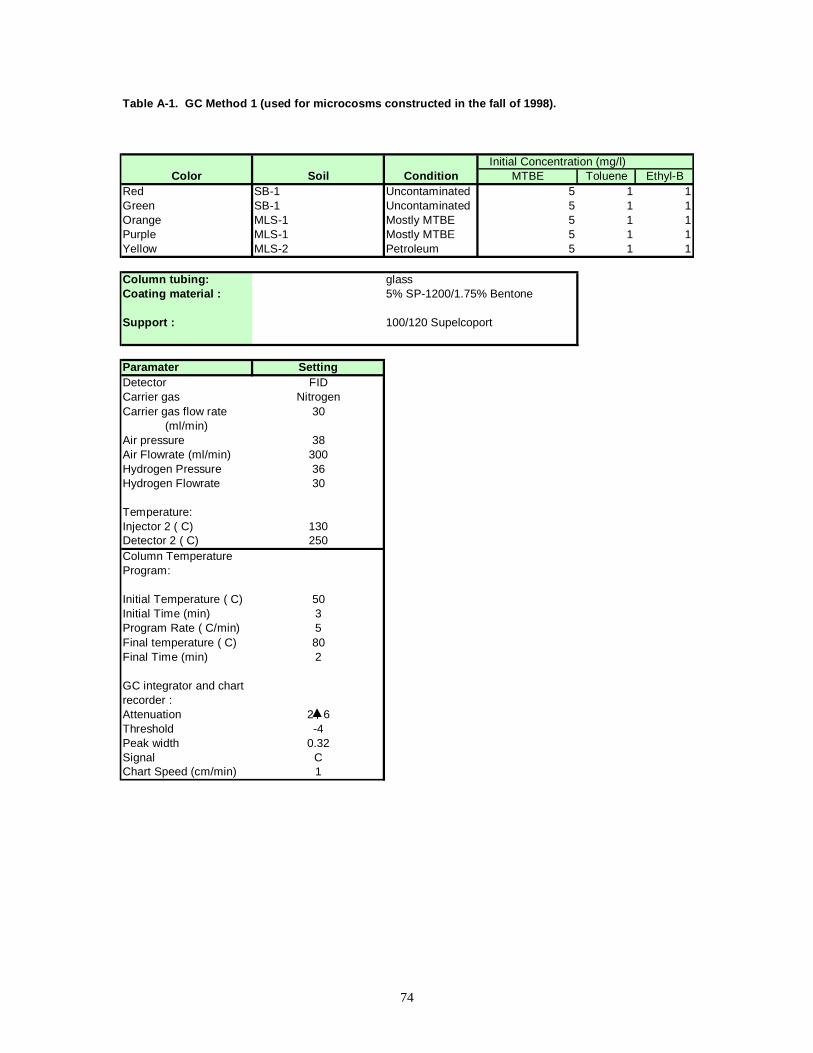
74
Table A-1. GC Method 1 (used for microcosms constructed in the fall of 1998).
Initial Concentration (mg/l)Color Soil Condition MTBE Toluene Ethyl-B
Red SB-1 Uncontaminated 5 1 1Green SB-1 Uncontaminated 5 1 1Orange MLS-1 Mostly MTBE 5 1 1Purple MLS-1 Mostly MTBE 5 1 1Yellow MLS-2 Petroleum 5 1 1
Column tubing: glassCoating material : 5% SP-1200/1.75% Bentone
Support : 100/120 Supelcoport
Paramater SettingDetector FIDCarrier gas NitrogenCarrier gas flow rate 30
(ml/min)Air pressure 38Air Flowrate (ml/min) 300Hydrogen Pressure 36Hydrogen Flowrate 30
Temperature:Injector 2 ( C) 130Detector 2 ( C) 250Column TemperatureProgram:
Initial Temperature ( C) 50Initial Time (min) 3Program Rate ( C/min) 5Final temperature ( C) 80Final Time (min) 2
GC integrator and chartrecorder :Attenuation 2 6Threshold -4Peak width 0.32Signal CChart Speed (cm/min) 1
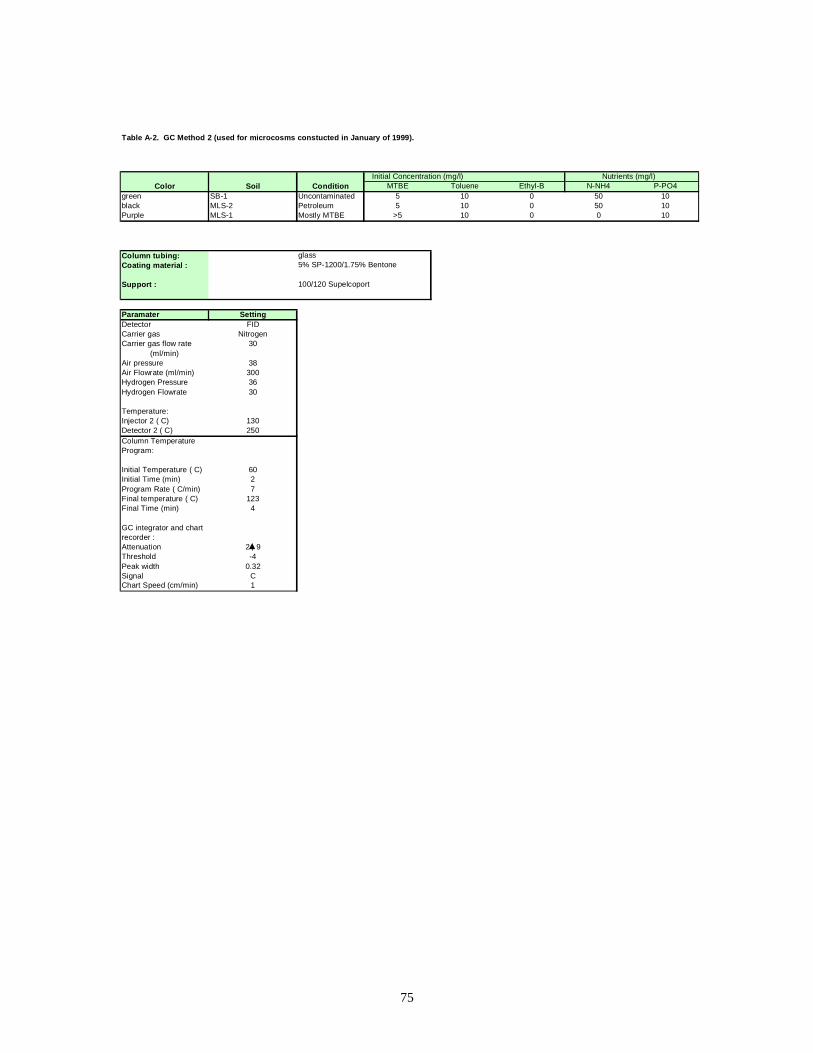
75
Table A-2. GC Method 2 (used for microcosms constucted in January of 1999).
Initial Concentration (mg/l) Nutrients (mg/l)Color Soil Condition MTBE Toluene Ethyl-B N-NH4 P-PO4
green SB-1 Uncontaminated 5 10 0 50 10black MLS-2 Petroleum 5 10 0 50 10Purple MLS-1 Mostly MTBE >5 10 0 0 10
Column tubing: glassCoating material : 5% SP-1200/1.75% Bentone
Support : 100/120 Supelcoport
Paramater SettingDetector FIDCarrier gas NitrogenCarrier gas flow rate 30
(ml/min)Air pressure 38Air Flowrate (ml/min) 300Hydrogen Pressure 36Hydrogen Flowrate 30
Temperature:Injector 2 ( C) 130Detector 2 ( C) 250Column TemperatureProgram:
Initial Temperature ( C) 60Initial Time (min) 2Program Rate ( C/min) 7Final temperature ( C) 123Final Time (min) 4
GC integrator and chartrecorder :Attenuation 2 9Threshold -4Peak width 0.32Signal CChart Speed (cm/min) 1
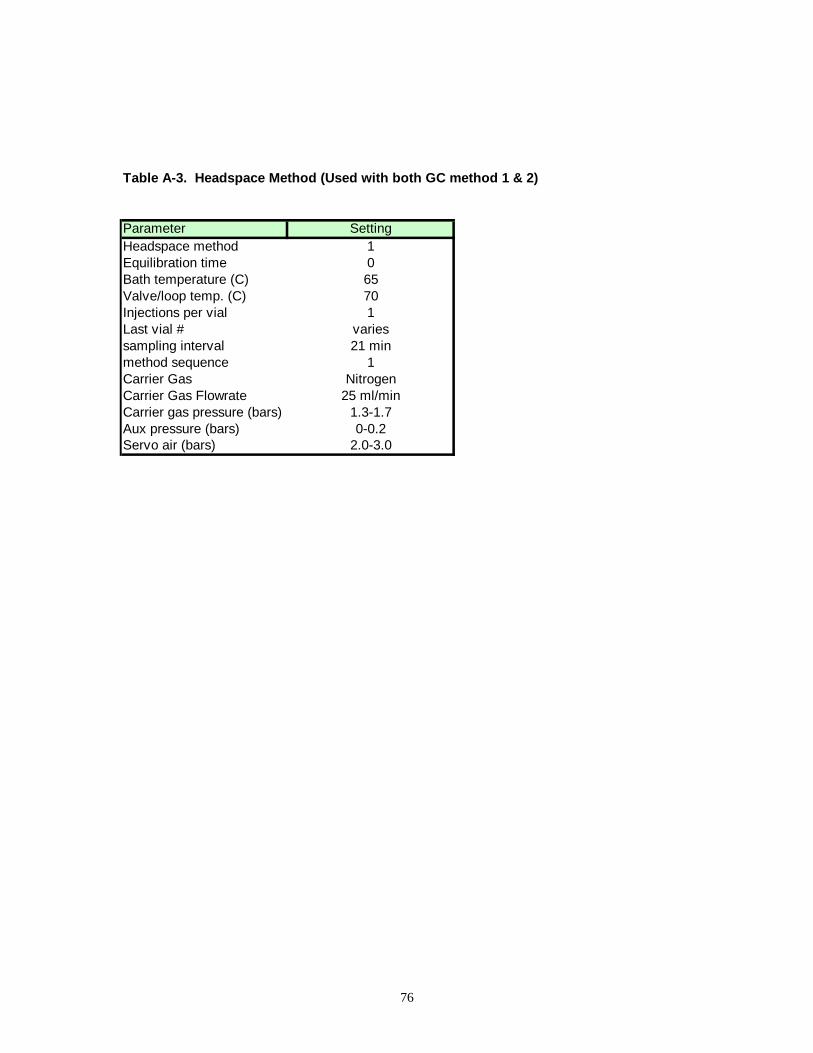
76
Table A-3. Headspace Met hod ( Used with both GC met hod 1 & 2)
Parameter SettingHeadspace method 1Equilibration time 0Bath temperature (C) 65Valve/loop temp. (C) 70Injections per vial 1Last vial # variessampling interval 21 minmethod sequence 1Carrier Gas NitrogenCarrier Gas Flowrate 25 ml/minCarrier gas pressure (bars) 1.3-1.7Aux pressure (bars) 0-0.2Servo air (bars) 2.0-3.0
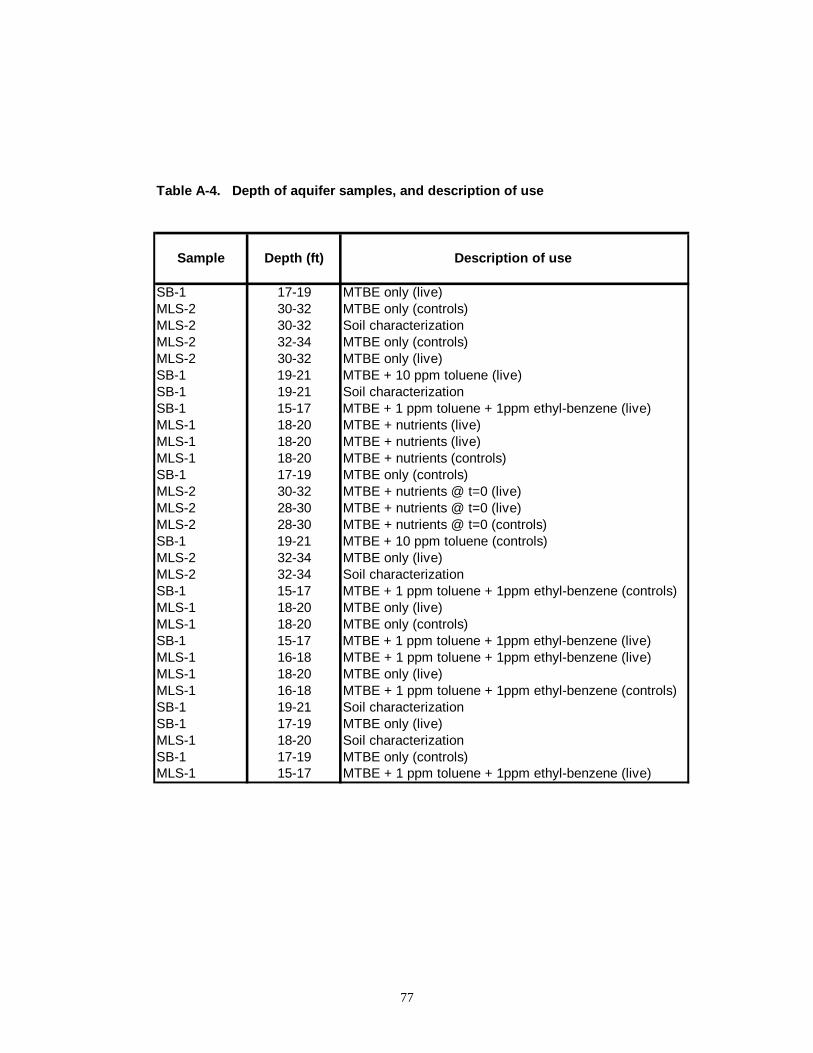
77
Table A-4. Depth of aquifer samples, and descript ion of use
Sample Depth (ft) Descript ion of use
SB-1 17-19 MTBE only (live)MLS-2 30-32 MTBE only (controls)MLS-2 30-32 Soil characterizationMLS-2 32-34 MTBE only (controls)MLS-2 30-32 MTBE only (live)SB-1 19-21 MTBE + 10 ppm toluene (live)SB-1 19-21 Soil characterizationSB-1 15-17 MTBE + 1 ppm toluene + 1ppm ethyl-benzene (live)MLS-1 18-20 MTBE + nutrients (live)MLS-1 18-20 MTBE + nutrients (live)MLS-1 18-20 MTBE + nutrients (controls)SB-1 17-19 MTBE only (controls)MLS-2 30-32 MTBE + nutrients @ t=0 (live)MLS-2 28-30 MTBE + nutrients @ t=0 (live)MLS-2 28-30 MTBE + nutrients @ t=0 (controls)SB-1 19-21 MTBE + 10 ppm toluene (controls)MLS-2 32-34 MTBE only (live)MLS-2 32-34 Soil characterizationSB-1 15-17 MTBE + 1 ppm toluene + 1ppm ethyl-benzene (controls)MLS-1 18-20 MTBE only (live)MLS-1 18-20 MTBE only (controls)SB-1 15-17 MTBE + 1 ppm toluene + 1ppm ethyl-benzene (live)MLS-1 16-18 MTBE + 1 ppm toluene + 1ppm ethyl-benzene (live)MLS-1 18-20 MTBE only (live)MLS-1 16-18 MTBE + 1 ppm toluene + 1ppm ethyl-benzene (controls)SB-1 19-21 Soil characterizationSB-1 17-19 MTBE only (live)MLS-1 18-20 Soil characterizationSB-1 17-19 MTBE only (controls)MLS-1 15-17 MTBE + 1 ppm toluene + 1ppm ethyl-benzene (live)
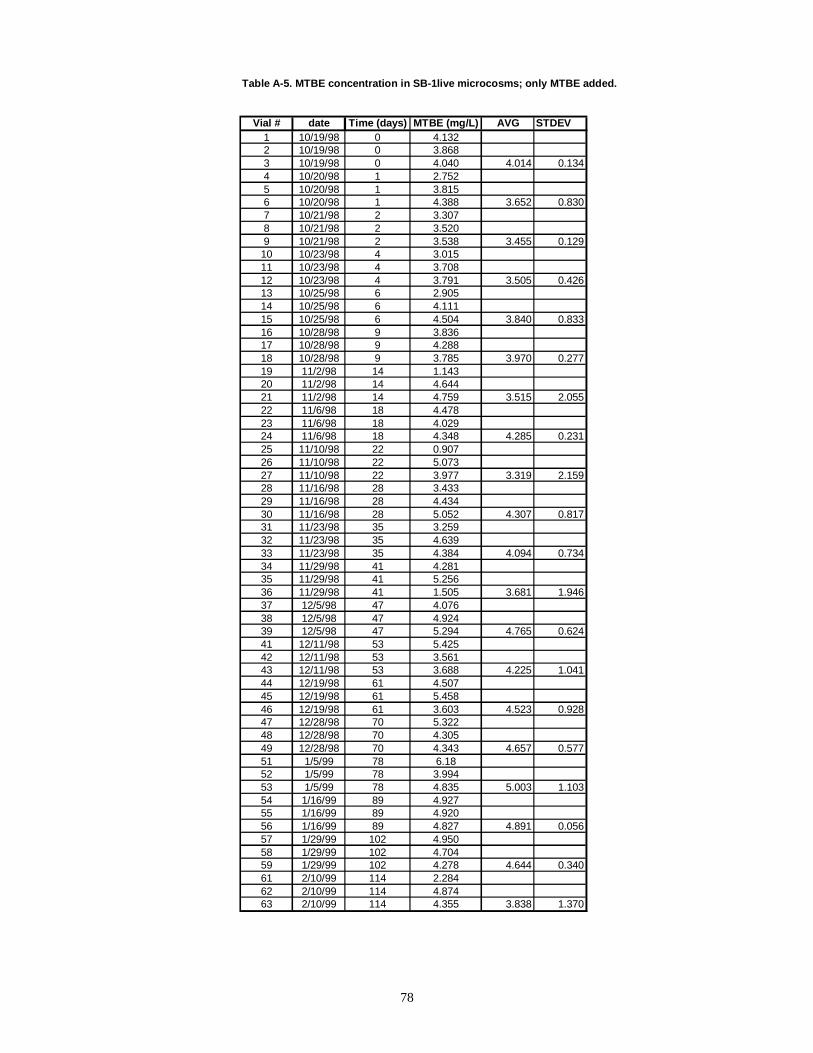
78
Table A-5. MTBE concentration in SB-1live microcosms; only MTBE added.
Vial # date Time (days) MTBE (mg/L) AVG STDEV1 10/19/98 0 4.1322 10/19/98 0 3.8683 10/19/98 0 4.040 4.014 0.1344 10/20/98 1 2.7525 10/20/98 1 3.8156 10/20/98 1 4.388 3.652 0.8307 10/21/98 2 3.3078 10/21/98 2 3.5209 10/21/98 2 3.538 3.455 0.12910 10/23/98 4 3.01511 10/23/98 4 3.70812 10/23/98 4 3.791 3.505 0.42613 10/25/98 6 2.90514 10/25/98 6 4.11115 10/25/98 6 4.504 3.840 0.83316 10/28/98 9 3.83617 10/28/98 9 4.28818 10/28/98 9 3.785 3.970 0.27719 11/2/98 14 1.14320 11/2/98 14 4.64421 11/2/98 14 4.759 3.515 2.05522 11/6/98 18 4.47823 11/6/98 18 4.02924 11/6/98 18 4.348 4.285 0.23125 11/10/98 22 0.90726 11/10/98 22 5.07327 11/10/98 22 3.977 3.319 2.15928 11/16/98 28 3.43329 11/16/98 28 4.43430 11/16/98 28 5.052 4.307 0.81731 11/23/98 35 3.25932 11/23/98 35 4.63933 11/23/98 35 4.384 4.094 0.73434 11/29/98 41 4.28135 11/29/98 41 5.25636 11/29/98 41 1.505 3.681 1.94637 12/5/98 47 4.07638 12/5/98 47 4.92439 12/5/98 47 5.294 4.765 0.62441 12/11/98 53 5.42542 12/11/98 53 3.56143 12/11/98 53 3.688 4.225 1.04144 12/19/98 61 4.50745 12/19/98 61 5.45846 12/19/98 61 3.603 4.523 0.92847 12/28/98 70 5.32248 12/28/98 70 4.30549 12/28/98 70 4.343 4.657 0.57751 1/5/99 78 6.1852 1/5/99 78 3.99453 1/5/99 78 4.835 5.003 1.10354 1/16/99 89 4.92755 1/16/99 89 4.92056 1/16/99 89 4.827 4.891 0.05657 1/29/99 102 4.95058 1/29/99 102 4.70459 1/29/99 102 4.278 4.644 0.34061 2/10/99 114 2.28462 2/10/99 114 4.87463 2/10/99 114 4.355 3.838 1.370
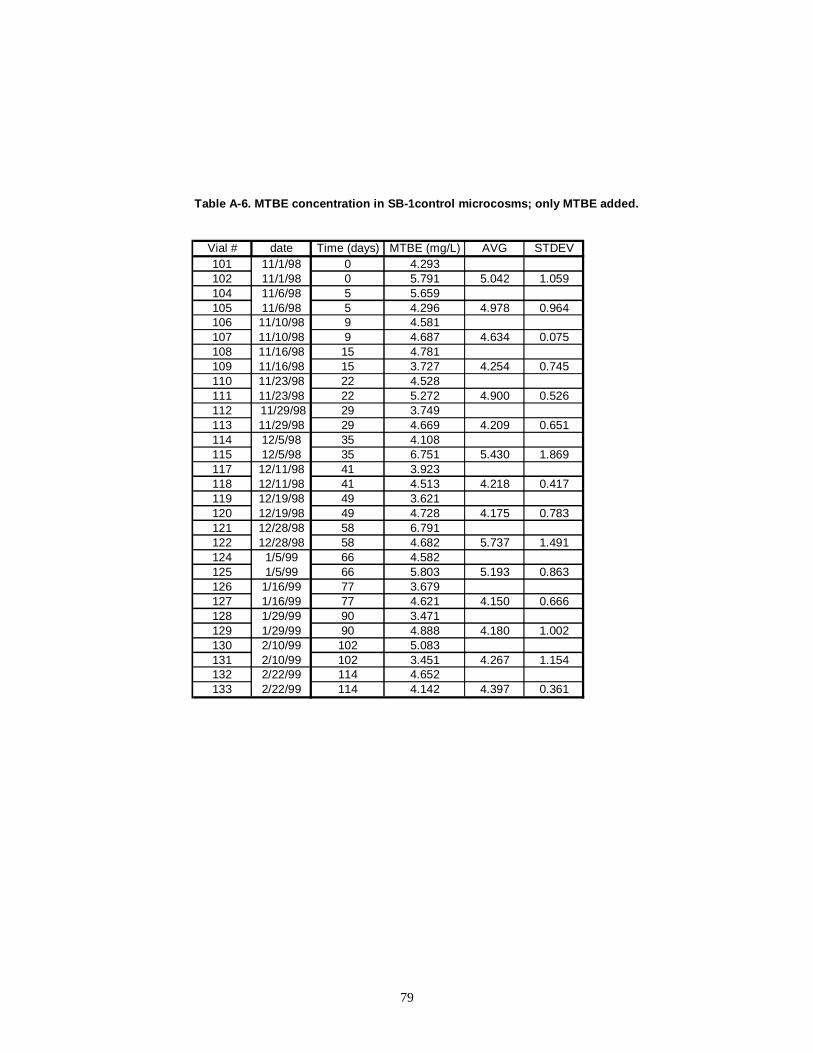
79
Table A-6. MTBE concentration in SB-1control microcosms; only MTBE added.
Vial # date Time (days) MTBE (mg/L) AVG STDEV101 11/1/98 0 4.293102 11/1/98 0 5.791 5.042 1.059104 11/6/98 5 5.659105 11/6/98 5 4.296 4.978 0.964106 11/10/98 9 4.581107 11/10/98 9 4.687 4.634 0.075108 11/16/98 15 4.781109 11/16/98 15 3.727 4.254 0.745110 11/23/98 22 4.528111 11/23/98 22 5.272 4.900 0.526112 11/29/98 29 3.749113 11/29/98 29 4.669 4.209 0.651114 12/5/98 35 4.108115 12/5/98 35 6.751 5.430 1.869117 12/11/98 41 3.923118 12/11/98 41 4.513 4.218 0.417119 12/19/98 49 3.621120 12/19/98 49 4.728 4.175 0.783121 12/28/98 58 6.791122 12/28/98 58 4.682 5.737 1.491124 1/5/99 66 4.582125 1/5/99 66 5.803 5.193 0.863126 1/16/99 77 3.679127 1/16/99 77 4.621 4.150 0.666128 1/29/99 90 3.471129 1/29/99 90 4.888 4.180 1.002130 2/10/99 102 5.083131 2/10/99 102 3.451 4.267 1.154132 2/22/99 114 4.652133 2/22/99 114 4.142 4.397 0.361
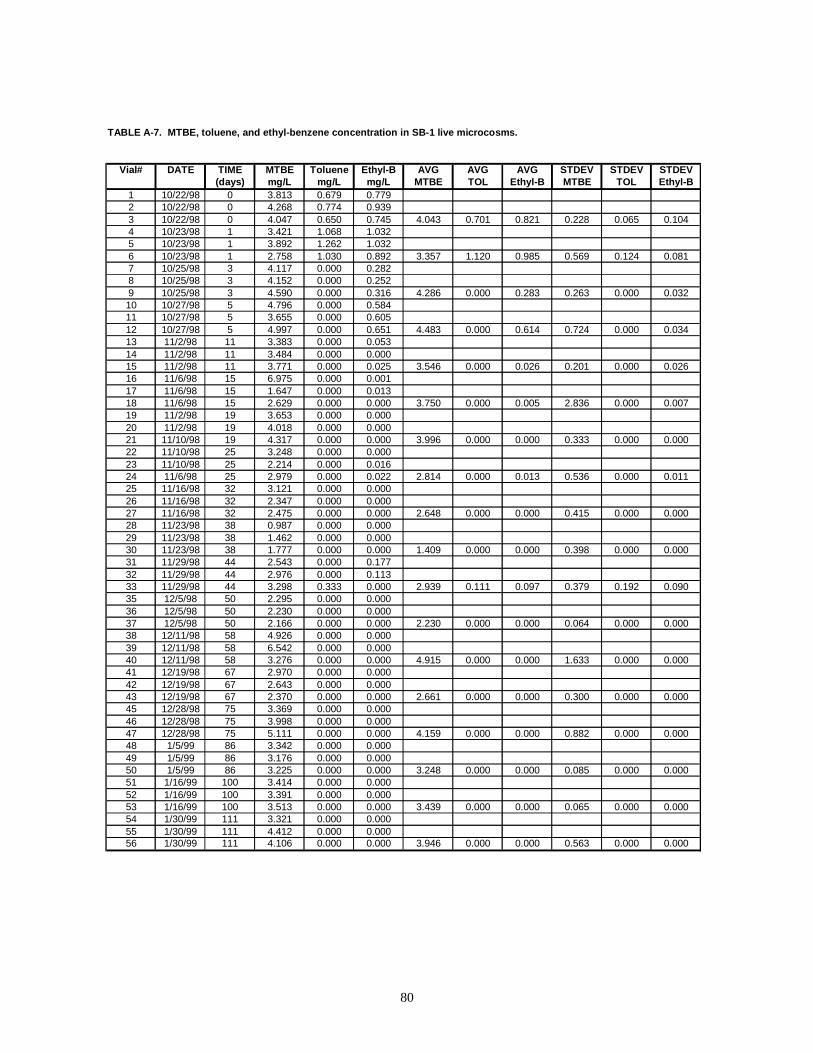
80
TABLE A-7. MTBE, toluene, and ethyl-benzene concentration in SB-1 live microcosms.
Vial# DATE TIME MTBE Toluene Ethyl-B AVG AVG AVG STDEV STDEV STDEV(days) mg/L mg/L mg/L MTBE TOL Ethyl-B MTBE TOL Ethyl-B
1 10/22/98 0 3.813 0.679 0.7792 10/22/98 0 4.268 0.774 0.9393 10/22/98 0 4.047 0.650 0.745 4.043 0.701 0.821 0.228 0.065 0.1044 10/23/98 1 3.421 1.068 1.0325 10/23/98 1 3.892 1.262 1.0326 10/23/98 1 2.758 1.030 0.892 3.357 1.120 0.985 0.569 0.124 0.0817 10/25/98 3 4.117 0.000 0.2828 10/25/98 3 4.152 0.000 0.2529 10/25/98 3 4.590 0.000 0.316 4.286 0.000 0.283 0.263 0.000 0.03210 10/27/98 5 4.796 0.000 0.58411 10/27/98 5 3.655 0.000 0.60512 10/27/98 5 4.997 0.000 0.651 4.483 0.000 0.614 0.724 0.000 0.03413 11/2/98 11 3.383 0.000 0.05314 11/2/98 11 3.484 0.000 0.00015 11/2/98 11 3.771 0.000 0.025 3.546 0.000 0.026 0.201 0.000 0.02616 11/6/98 15 6.975 0.000 0.00117 11/6/98 15 1.647 0.000 0.01318 11/6/98 15 2.629 0.000 0.000 3.750 0.000 0.005 2.836 0.000 0.00719 11/2/98 19 3.653 0.000 0.00020 11/2/98 19 4.018 0.000 0.00021 11/10/98 19 4.317 0.000 0.000 3.996 0.000 0.000 0.333 0.000 0.00022 11/10/98 25 3.248 0.000 0.00023 11/10/98 25 2.214 0.000 0.01624 11/6/98 25 2.979 0.000 0.022 2.814 0.000 0.013 0.536 0.000 0.01125 11/16/98 32 3.121 0.000 0.00026 11/16/98 32 2.347 0.000 0.00027 11/16/98 32 2.475 0.000 0.000 2.648 0.000 0.000 0.415 0.000 0.00028 11/23/98 38 0.987 0.000 0.00029 11/23/98 38 1.462 0.000 0.00030 11/23/98 38 1.777 0.000 0.000 1.409 0.000 0.000 0.398 0.000 0.00031 11/29/98 44 2.543 0.000 0.17732 11/29/98 44 2.976 0.000 0.11333 11/29/98 44 3.298 0.333 0.000 2.939 0.111 0.097 0.379 0.192 0.09035 12/5/98 50 2.295 0.000 0.00036 12/5/98 50 2.230 0.000 0.00037 12/5/98 50 2.166 0.000 0.000 2.230 0.000 0.000 0.064 0.000 0.00038 12/11/98 58 4.926 0.000 0.00039 12/11/98 58 6.542 0.000 0.00040 12/11/98 58 3.276 0.000 0.000 4.915 0.000 0.000 1.633 0.000 0.00041 12/19/98 67 2.970 0.000 0.00042 12/19/98 67 2.643 0.000 0.00043 12/19/98 67 2.370 0.000 0.000 2.661 0.000 0.000 0.300 0.000 0.00045 12/28/98 75 3.369 0.000 0.00046 12/28/98 75 3.998 0.000 0.00047 12/28/98 75 5.111 0.000 0.000 4.159 0.000 0.000 0.882 0.000 0.00048 1/5/99 86 3.342 0.000 0.00049 1/5/99 86 3.176 0.000 0.00050 1/5/99 86 3.225 0.000 0.000 3.248 0.000 0.000 0.085 0.000 0.00051 1/16/99 100 3.414 0.000 0.00052 1/16/99 100 3.391 0.000 0.00053 1/16/99 100 3.513 0.000 0.000 3.439 0.000 0.000 0.065 0.000 0.00054 1/30/99 111 3.321 0.000 0.00055 1/30/99 111 4.412 0.000 0.00056 1/30/99 111 4.106 0.000 0.000 3.946 0.000 0.000 0.563 0.000 0.000
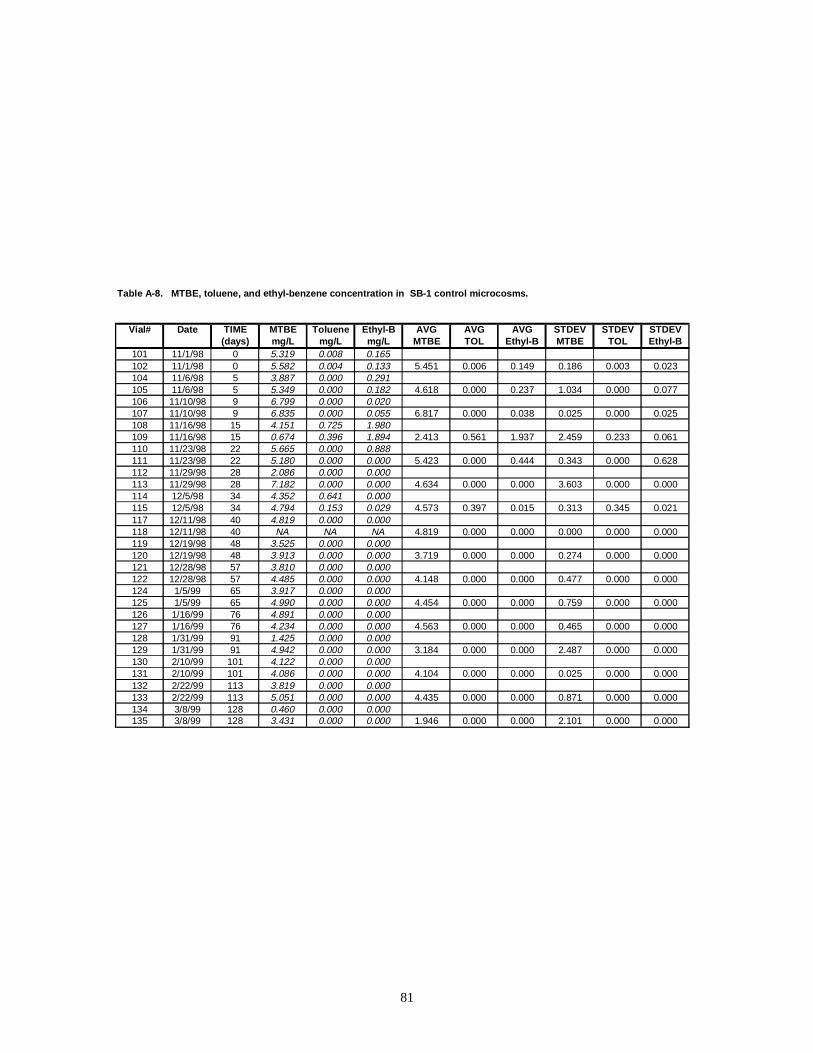
81
Table A-8. MTBE, toluene, and ethyl-benzene concentration in SB-1 control microcosms.
Vial# Date TIME MTBE Toluene Ethyl-B AVG AVG AVG STDEV STDEV STDEV(days) mg/L mg/L mg/L MTBE TOL Ethyl-B MTBE TOL Ethyl-B
101 11/1/98 0 5.319 0.008 0.165102 11/1/98 0 5.582 0.004 0.133 5.451 0.006 0.149 0.186 0.003 0.023104 11/6/98 5 3.887 0.000 0.291105 11/6/98 5 5.349 0.000 0.182 4.618 0.000 0.237 1.034 0.000 0.077106 11/10/98 9 6.799 0.000 0.020107 11/10/98 9 6.835 0.000 0.055 6.817 0.000 0.038 0.025 0.000 0.025108 11/16/98 15 4.151 0.725 1.980109 11/16/98 15 0.674 0.396 1.894 2.413 0.561 1.937 2.459 0.233 0.061110 11/23/98 22 5.665 0.000 0.888111 11/23/98 22 5.180 0.000 0.000 5.423 0.000 0.444 0.343 0.000 0.628112 11/29/98 28 2.086 0.000 0.000113 11/29/98 28 7.182 0.000 0.000 4.634 0.000 0.000 3.603 0.000 0.000114 12/5/98 34 4.352 0.641 0.000115 12/5/98 34 4.794 0.153 0.029 4.573 0.397 0.015 0.313 0.345 0.021117 12/11/98 40 4.819 0.000 0.000118 12/11/98 40 NA NA NA 4.819 0.000 0.000 0.000 0.000 0.000119 12/19/98 48 3.525 0.000 0.000120 12/19/98 48 3.913 0.000 0.000 3.719 0.000 0.000 0.274 0.000 0.000121 12/28/98 57 3.810 0.000 0.000122 12/28/98 57 4.485 0.000 0.000 4.148 0.000 0.000 0.477 0.000 0.000124 1/5/99 65 3.917 0.000 0.000125 1/5/99 65 4.990 0.000 0.000 4.454 0.000 0.000 0.759 0.000 0.000126 1/16/99 76 4.891 0.000 0.000127 1/16/99 76 4.234 0.000 0.000 4.563 0.000 0.000 0.465 0.000 0.000128 1/31/99 91 1.425 0.000 0.000129 1/31/99 91 4.942 0.000 0.000 3.184 0.000 0.000 2.487 0.000 0.000130 2/10/99 101 4.122 0.000 0.000131 2/10/99 101 4.086 0.000 0.000 4.104 0.000 0.000 0.025 0.000 0.000132 2/22/99 113 3.819 0.000 0.000133 2/22/99 113 5.051 0.000 0.000 4.435 0.000 0.000 0.871 0.000 0.000134 3/8/99 128 0.460 0.000 0.000135 3/8/99 128 3.431 0.000 0.000 1.946 0.000 0.000 2.101 0.000 0.000
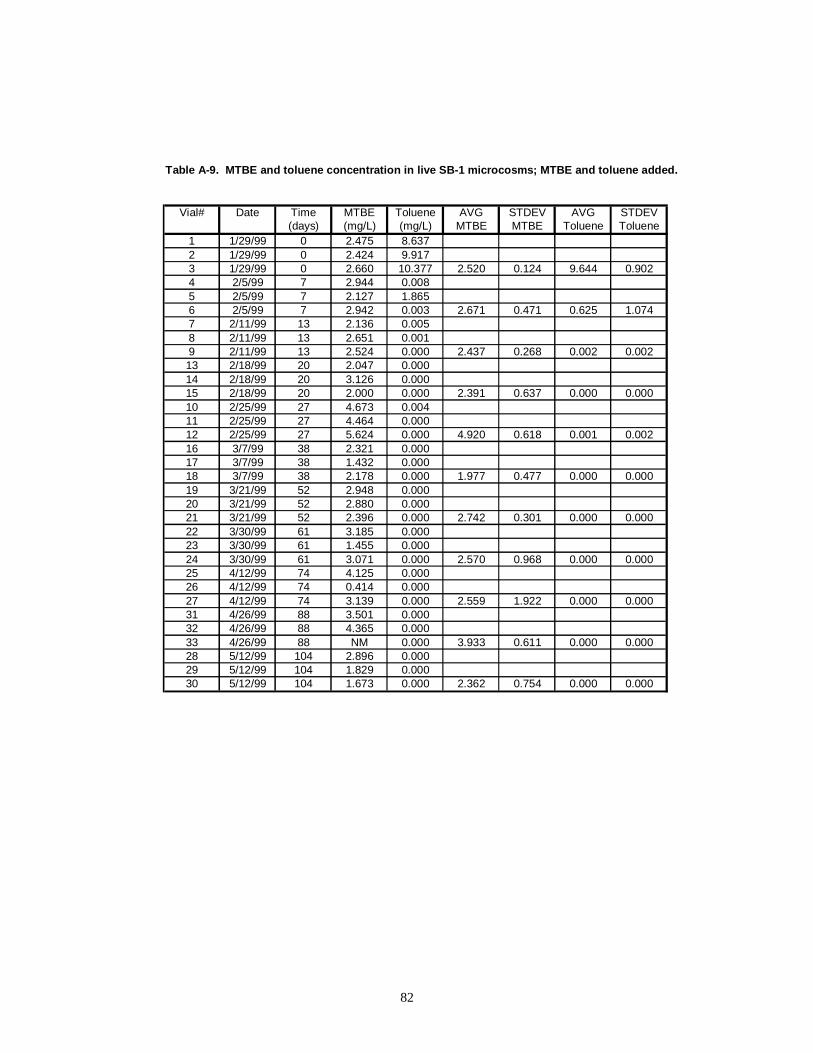
82
Table A-9. MTBE and toluene concentration in live SB-1 microcosms; MTBE and toluene added.
Vial# Date Time MTBE Toluene AVG STDEV AVG STDEV(days) (mg/L) (mg/L) MTBE MTBE Toluene Toluene
1 1/29/99 0 2.475 8.6372 1/29/99 0 2.424 9.9173 1/29/99 0 2.660 10.377 2.520 0.124 9.644 0.9024 2/5/99 7 2.944 0.0085 2/5/99 7 2.127 1.8656 2/5/99 7 2.942 0.003 2.671 0.471 0.625 1.0747 2/11/99 13 2.136 0.0058 2/11/99 13 2.651 0.0019 2/11/99 13 2.524 0.000 2.437 0.268 0.002 0.00213 2/18/99 20 2.047 0.00014 2/18/99 20 3.126 0.00015 2/18/99 20 2.000 0.000 2.391 0.637 0.000 0.00010 2/25/99 27 4.673 0.00411 2/25/99 27 4.464 0.00012 2/25/99 27 5.624 0.000 4.920 0.618 0.001 0.00216 3/7/99 38 2.321 0.00017 3/7/99 38 1.432 0.00018 3/7/99 38 2.178 0.000 1.977 0.477 0.000 0.00019 3/21/99 52 2.948 0.00020 3/21/99 52 2.880 0.00021 3/21/99 52 2.396 0.000 2.742 0.301 0.000 0.00022 3/30/99 61 3.185 0.00023 3/30/99 61 1.455 0.00024 3/30/99 61 3.071 0.000 2.570 0.968 0.000 0.00025 4/12/99 74 4.125 0.00026 4/12/99 74 0.414 0.00027 4/12/99 74 3.139 0.000 2.559 1.922 0.000 0.00031 4/26/99 88 3.501 0.00032 4/26/99 88 4.365 0.00033 4/26/99 88 NM 0.000 3.933 0.611 0.000 0.00028 5/12/99 104 2.896 0.00029 5/12/99 104 1.829 0.00030 5/12/99 104 1.673 0.000 2.362 0.754 0.000 0.000
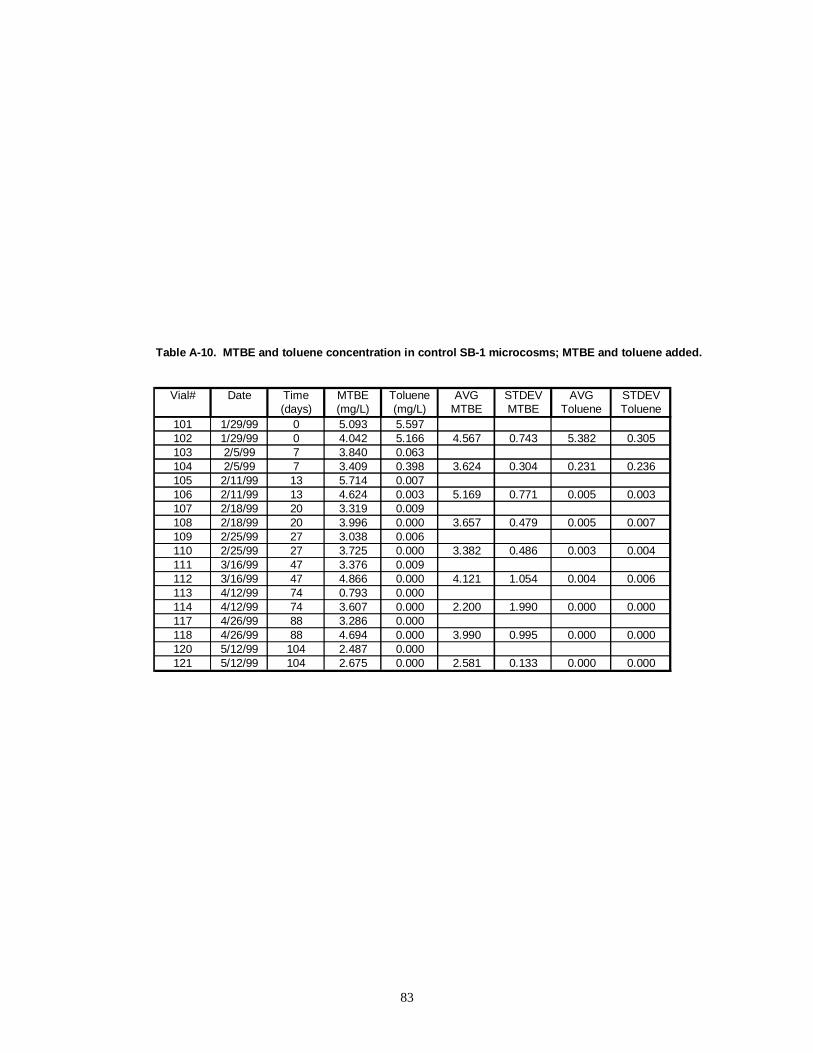
83
Table A-10. MTBE and toluene concentration in control SB-1 microcosms; MTBE and toluene added.
Vial# Date Time MTBE Toluene AVG STDEV AVG STDEV(days) (mg/L) (mg/L) MTBE MTBE Toluene Toluene
101 1/29/99 0 5.093 5.597102 1/29/99 0 4.042 5.166 4.567 0.743 5.382 0.305103 2/5/99 7 3.840 0.063104 2/5/99 7 3.409 0.398 3.624 0.304 0.231 0.236105 2/11/99 13 5.714 0.007106 2/11/99 13 4.624 0.003 5.169 0.771 0.005 0.003107 2/18/99 20 3.319 0.009108 2/18/99 20 3.996 0.000 3.657 0.479 0.005 0.007109 2/25/99 27 3.038 0.006110 2/25/99 27 3.725 0.000 3.382 0.486 0.003 0.004111 3/16/99 47 3.376 0.009112 3/16/99 47 4.866 0.000 4.121 1.054 0.004 0.006113 4/12/99 74 0.793 0.000114 4/12/99 74 3.607 0.000 2.200 1.990 0.000 0.000117 4/26/99 88 3.286 0.000118 4/26/99 88 4.694 0.000 3.990 0.995 0.000 0.000120 5/12/99 104 2.487 0.000121 5/12/99 104 2.675 0.000 2.581 0.133 0.000 0.000
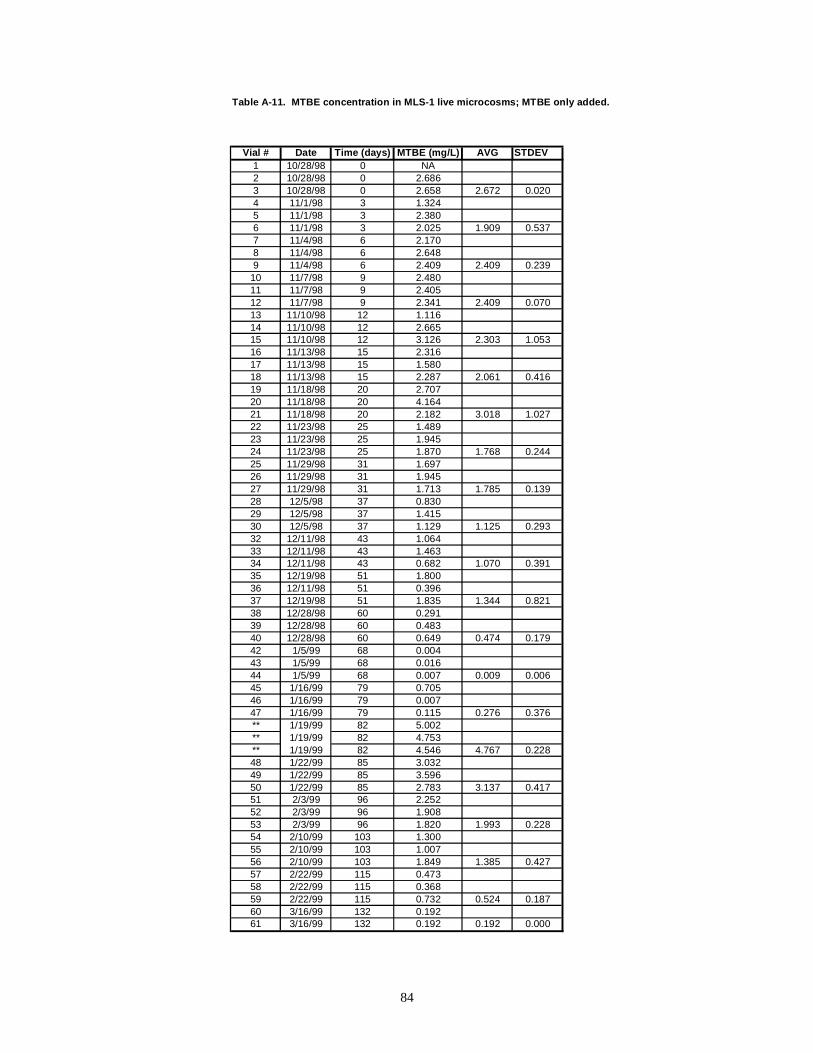
84
Table A-11. MTBE concentration in MLS-1 live microcosms; MTBE only added.
Vial # Date Time (days) MTBE (mg/L) AVG STDEV1 10/28/98 0 NA2 10/28/98 0 2.6863 10/28/98 0 2.658 2.672 0.0204 11/1/98 3 1.3245 11/1/98 3 2.3806 11/1/98 3 2.025 1.909 0.5377 11/4/98 6 2.1708 11/4/98 6 2.6489 11/4/98 6 2.409 2.409 0.239
10 11/7/98 9 2.48011 11/7/98 9 2.40512 11/7/98 9 2.341 2.409 0.07013 11/10/98 12 1.11614 11/10/98 12 2.66515 11/10/98 12 3.126 2.303 1.05316 11/13/98 15 2.31617 11/13/98 15 1.58018 11/13/98 15 2.287 2.061 0.41619 11/18/98 20 2.70720 11/18/98 20 4.16421 11/18/98 20 2.182 3.018 1.02722 11/23/98 25 1.48923 11/23/98 25 1.94524 11/23/98 25 1.870 1.768 0.24425 11/29/98 31 1.69726 11/29/98 31 1.94527 11/29/98 31 1.713 1.785 0.13928 12/5/98 37 0.83029 12/5/98 37 1.41530 12/5/98 37 1.129 1.125 0.29332 12/11/98 43 1.06433 12/11/98 43 1.46334 12/11/98 43 0.682 1.070 0.39135 12/19/98 51 1.80036 12/11/98 51 0.39637 12/19/98 51 1.835 1.344 0.82138 12/28/98 60 0.29139 12/28/98 60 0.48340 12/28/98 60 0.649 0.474 0.17942 1/5/99 68 0.00443 1/5/99 68 0.01644 1/5/99 68 0.007 0.009 0.00645 1/16/99 79 0.70546 1/16/99 79 0.00747 1/16/99 79 0.115 0.276 0.376** 1/19/99 82 5.002** 1/19/99 82 4.753** 1/19/99 82 4.546 4.767 0.22848 1/22/99 85 3.03249 1/22/99 85 3.59650 1/22/99 85 2.783 3.137 0.41751 2/3/99 96 2.25252 2/3/99 96 1.90853 2/3/99 96 1.820 1.993 0.22854 2/10/99 103 1.30055 2/10/99 103 1.00756 2/10/99 103 1.849 1.385 0.42757 2/22/99 115 0.47358 2/22/99 115 0.36859 2/22/99 115 0.732 0.524 0.18760 3/16/99 132 0.19261 3/16/99 132 0.192 0.192 0.000
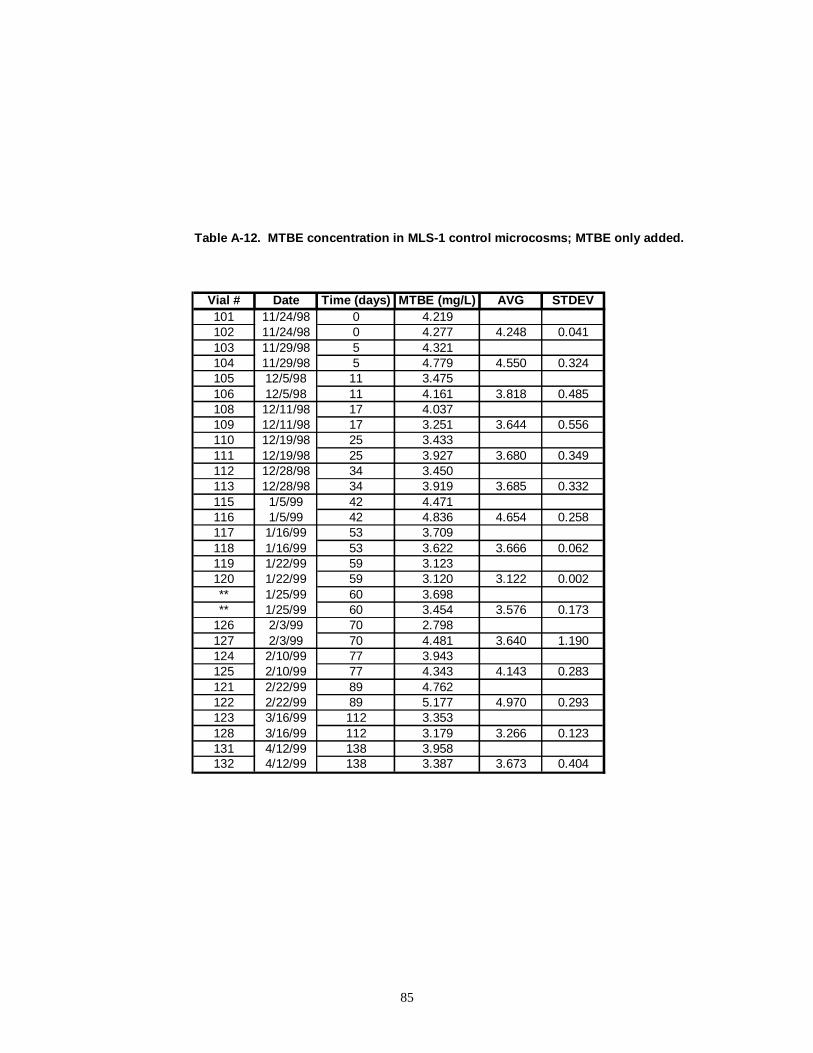
85
Table A-12. MTBE concentration in MLS-1 control microcosms; MTBE only added.
Vial # Date Time (days) MTBE (mg/L) AVG STDEV101 11/24/98 0 4.219102 11/24/98 0 4.277 4.248 0.041103 11/29/98 5 4.321104 11/29/98 5 4.779 4.550 0.324105 12/5/98 11 3.475106 12/5/98 11 4.161 3.818 0.485108 12/11/98 17 4.037109 12/11/98 17 3.251 3.644 0.556110 12/19/98 25 3.433111 12/19/98 25 3.927 3.680 0.349112 12/28/98 34 3.450113 12/28/98 34 3.919 3.685 0.332115 1/5/99 42 4.471116 1/5/99 42 4.836 4.654 0.258117 1/16/99 53 3.709118 1/16/99 53 3.622 3.666 0.062119 1/22/99 59 3.123120 1/22/99 59 3.120 3.122 0.002** 1/25/99 60 3.698** 1/25/99 60 3.454 3.576 0.173
126 2/3/99 70 2.798127 2/3/99 70 4.481 3.640 1.190124 2/10/99 77 3.943125 2/10/99 77 4.343 4.143 0.283121 2/22/99 89 4.762122 2/22/99 89 5.177 4.970 0.293123 3/16/99 112 3.353128 3/16/99 112 3.179 3.266 0.123131 4/12/99 138 3.958132 4/12/99 138 3.387 3.673 0.404
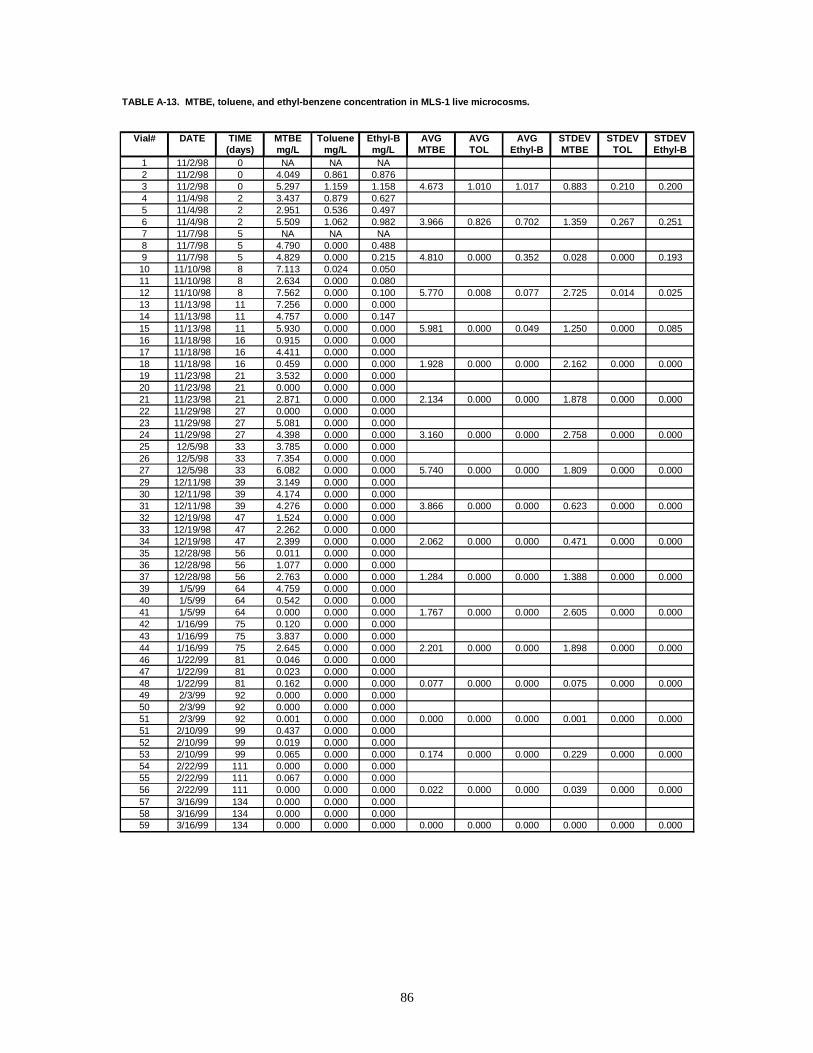
86
TABLE A-13. MTBE, toluene, and ethyl-benzene concentration in MLS-1 live microcosms.
Vial# DATE TIME MTBE Toluene Eth yl-B AVG AVG AVG STDEV STDEV STDEV(days) mg/L mg/L mg/L MTBE TOL Ethyl-B MTBE TOL Ethyl-B
1 11/2/98 0 NA NA NA2 11/2/98 0 4.049 0.861 0.8763 11/2/98 0 5.297 1.159 1.158 4.673 1.010 1.017 0.883 0.210 0.2004 11/4/98 2 3.437 0.879 0.6275 11/4/98 2 2.951 0.536 0.4976 11/4/98 2 5.509 1.062 0.982 3.966 0.826 0.702 1.359 0.267 0.2517 11/7/98 5 NA NA NA8 11/7/98 5 4.790 0.000 0.4889 11/7/98 5 4.829 0.000 0.215 4.810 0.000 0.352 0.028 0.000 0.19310 11/10/98 8 7.113 0.024 0.05011 11/10/98 8 2.634 0.000 0.08012 11/10/98 8 7.562 0.000 0.100 5.770 0.008 0.077 2.725 0.014 0.02513 11/13/98 11 7.256 0.000 0.00014 11/13/98 11 4.757 0.000 0.14715 11/13/98 11 5.930 0.000 0.000 5.981 0.000 0.049 1.250 0.000 0.08516 11/18/98 16 0.915 0.000 0.00017 11/18/98 16 4.411 0.000 0.00018 11/18/98 16 0.459 0.000 0.000 1.928 0.000 0.000 2.162 0.000 0.00019 11/23/98 21 3.532 0.000 0.00020 11/23/98 21 0.000 0.000 0.00021 11/23/98 21 2.871 0.000 0.000 2.134 0.000 0.000 1.878 0.000 0.00022 11/29/98 27 0.000 0.000 0.00023 11/29/98 27 5.081 0.000 0.00024 11/29/98 27 4.398 0.000 0.000 3.160 0.000 0.000 2.758 0.000 0.00025 12/5/98 33 3.785 0.000 0.00026 12/5/98 33 7.354 0.000 0.00027 12/5/98 33 6.082 0.000 0.000 5.740 0.000 0.000 1.809 0.000 0.00029 12/11/98 39 3.149 0.000 0.00030 12/11/98 39 4.174 0.000 0.00031 12/11/98 39 4.276 0.000 0.000 3.866 0.000 0.000 0.623 0.000 0.00032 12/19/98 47 1.524 0.000 0.00033 12/19/98 47 2.262 0.000 0.00034 12/19/98 47 2.399 0.000 0.000 2.062 0.000 0.000 0.471 0.000 0.00035 12/28/98 56 0.011 0.000 0.00036 12/28/98 56 1.077 0.000 0.00037 12/28/98 56 2.763 0.000 0.000 1.284 0.000 0.000 1.388 0.000 0.00039 1/5/99 64 4.759 0.000 0.00040 1/5/99 64 0.542 0.000 0.00041 1/5/99 64 0.000 0.000 0.000 1.767 0.000 0.000 2.605 0.000 0.00042 1/16/99 75 0.120 0.000 0.00043 1/16/99 75 3.837 0.000 0.00044 1/16/99 75 2.645 0.000 0.000 2.201 0.000 0.000 1.898 0.000 0.00046 1/22/99 81 0.046 0.000 0.00047 1/22/99 81 0.023 0.000 0.00048 1/22/99 81 0.162 0.000 0.000 0.077 0.000 0.000 0.075 0.000 0.00049 2/3/99 92 0.000 0.000 0.00050 2/3/99 92 0.000 0.000 0.00051 2/3/99 92 0.001 0.000 0.000 0.000 0.000 0.000 0.001 0.000 0.00051 2/10/99 99 0.437 0.000 0.00052 2/10/99 99 0.019 0.000 0.00053 2/10/99 99 0.065 0.000 0.000 0.174 0.000 0.000 0.229 0.000 0.00054 2/22/99 111 0.000 0.000 0.00055 2/22/99 111 0.067 0.000 0.00056 2/22/99 111 0.000 0.000 0.000 0.022 0.000 0.000 0.039 0.000 0.00057 3/16/99 134 0.000 0.000 0.00058 3/16/99 134 0.000 0.000 0.00059 3/16/99 134 0.000 0.000 0.000 0.000 0.000 0.000 0.000 0.000 0.000
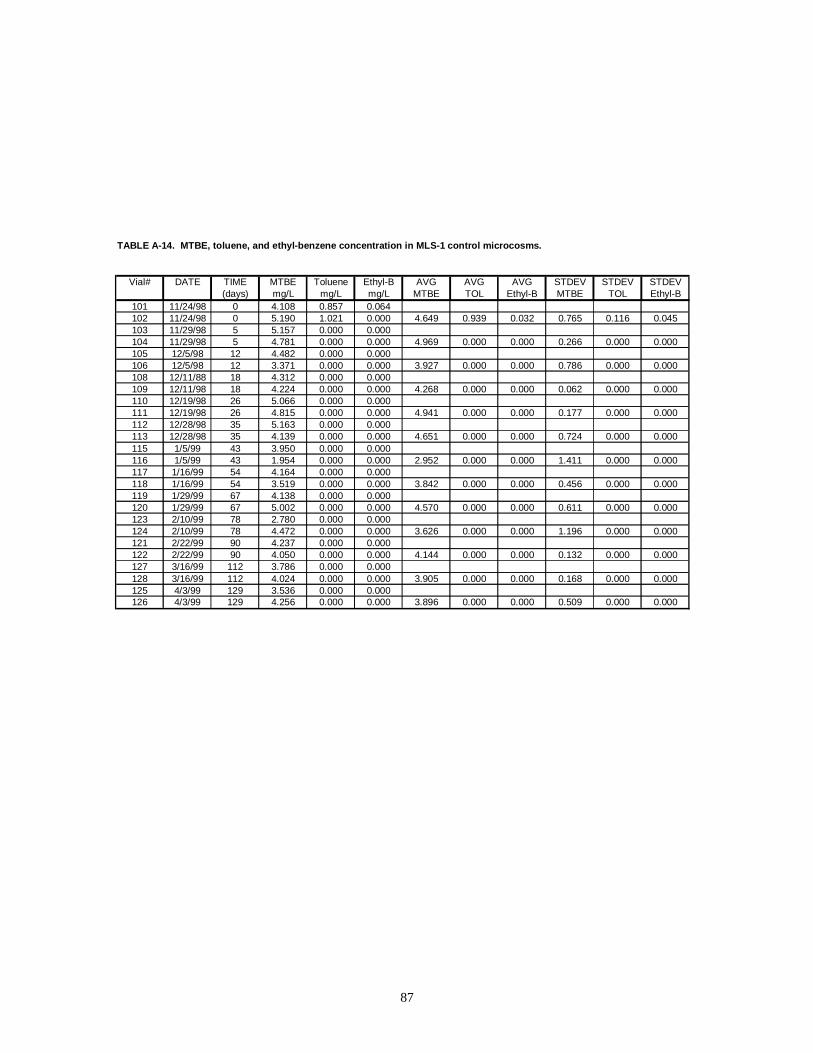
87
TABLE A-14. MTBE, toluene, and ethyl-benzene concentration in MLS-1 control microcosms.
Vial# DATE TIME MTBE Toluene Ethyl-B AVG AVG AVG STDEV STDEV STDEV(days) mg/L mg/L mg/L MTBE TOL Ethyl-B MTBE TOL Ethyl-B
101 11/24/98 0 4.108 0.857 0.064102 11/24/98 0 5.190 1.021 0.000 4.649 0.939 0.032 0.765 0.116 0.045103 11/29/98 5 5.157 0.000 0.000104 11/29/98 5 4.781 0.000 0.000 4.969 0.000 0.000 0.266 0.000 0.000105 12/5/98 12 4.482 0.000 0.000106 12/5/98 12 3.371 0.000 0.000 3.927 0.000 0.000 0.786 0.000 0.000108 12/11/88 18 4.312 0.000 0.000109 12/11/98 18 4.224 0.000 0.000 4.268 0.000 0.000 0.062 0.000 0.000110 12/19/98 26 5.066 0.000 0.000111 12/19/98 26 4.815 0.000 0.000 4.941 0.000 0.000 0.177 0.000 0.000112 12/28/98 35 5.163 0.000 0.000113 12/28/98 35 4.139 0.000 0.000 4.651 0.000 0.000 0.724 0.000 0.000115 1/5/99 43 3.950 0.000 0.000116 1/5/99 43 1.954 0.000 0.000 2.952 0.000 0.000 1.411 0.000 0.000117 1/16/99 54 4.164 0.000 0.000118 1/16/99 54 3.519 0.000 0.000 3.842 0.000 0.000 0.456 0.000 0.000119 1/29/99 67 4.138 0.000 0.000120 1/29/99 67 5.002 0.000 0.000 4.570 0.000 0.000 0.611 0.000 0.000123 2/10/99 78 2.780 0.000 0.000124 2/10/99 78 4.472 0.000 0.000 3.626 0.000 0.000 1.196 0.000 0.000121 2/22/99 90 4.237 0.000 0.000122 2/22/99 90 4.050 0.000 0.000 4.144 0.000 0.000 0.132 0.000 0.000127 3/16/99 112 3.786 0.000 0.000128 3/16/99 112 4.024 0.000 0.000 3.905 0.000 0.000 0.168 0.000 0.000125 4/3/99 129 3.536 0.000 0.000126 4/3/99 129 4.256 0.000 0.000 3.896 0.000 0.000 0.509 0.000 0.000
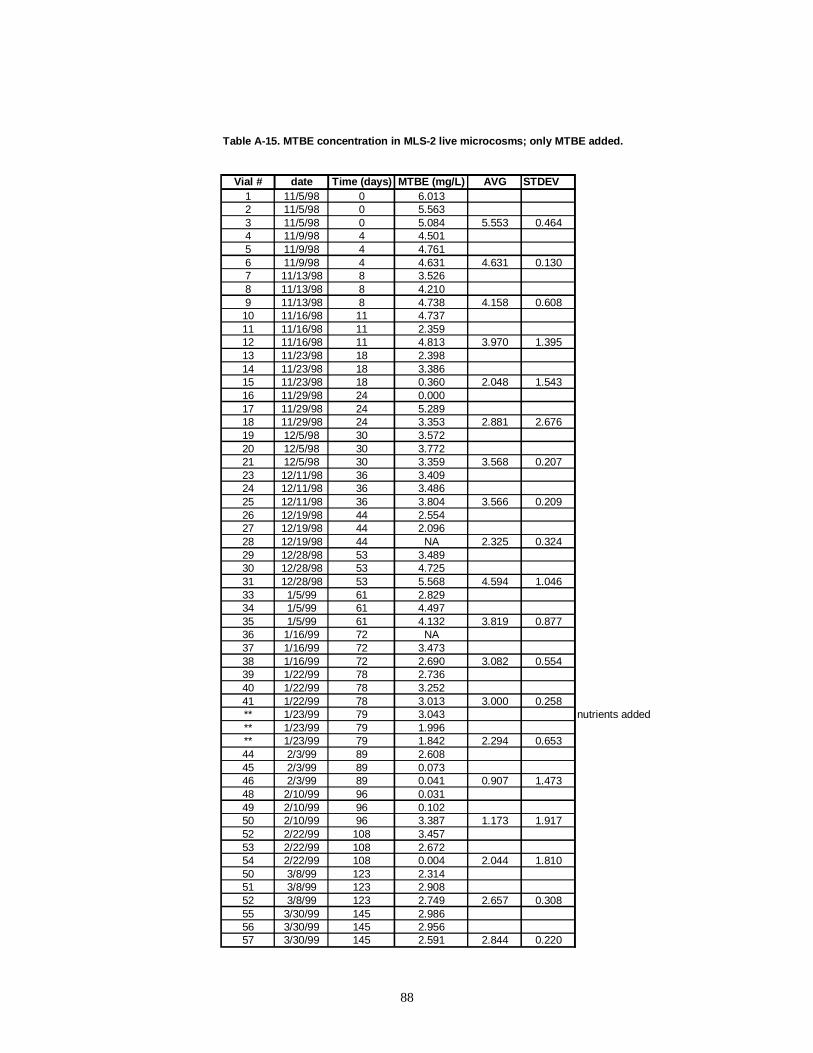
88
Table A-15. MTBE concentration in MLS-2 live microcosms; only MTBE added.
Vial # date Time (days) MTBE (mg/L) AVG STDEV1 11/5/98 0 6.0132 11/5/98 0 5.5633 11/5/98 0 5.084 5.553 0.4644 11/9/98 4 4.5015 11/9/98 4 4.7616 11/9/98 4 4.631 4.631 0.1307 11/13/98 8 3.5268 11/13/98 8 4.2109 11/13/98 8 4.738 4.158 0.60810 11/16/98 11 4.73711 11/16/98 11 2.35912 11/16/98 11 4.813 3.970 1.39513 11/23/98 18 2.39814 11/23/98 18 3.38615 11/23/98 18 0.360 2.048 1.54316 11/29/98 24 0.00017 11/29/98 24 5.28918 11/29/98 24 3.353 2.881 2.67619 12/5/98 30 3.57220 12/5/98 30 3.77221 12/5/98 30 3.359 3.568 0.20723 12/11/98 36 3.40924 12/11/98 36 3.48625 12/11/98 36 3.804 3.566 0.20926 12/19/98 44 2.55427 12/19/98 44 2.09628 12/19/98 44 NA 2.325 0.32429 12/28/98 53 3.48930 12/28/98 53 4.72531 12/28/98 53 5.568 4.594 1.04633 1/5/99 61 2.82934 1/5/99 61 4.49735 1/5/99 61 4.132 3.819 0.87736 1/16/99 72 NA37 1/16/99 72 3.47338 1/16/99 72 2.690 3.082 0.55439 1/22/99 78 2.73640 1/22/99 78 3.25241 1/22/99 78 3.013 3.000 0.258** 1/23/99 79 3.043 nutrients added** 1/23/99 79 1.996** 1/23/99 79 1.842 2.294 0.65344 2/3/99 89 2.60845 2/3/99 89 0.07346 2/3/99 89 0.041 0.907 1.47348 2/10/99 96 0.03149 2/10/99 96 0.10250 2/10/99 96 3.387 1.173 1.91752 2/22/99 108 3.45753 2/22/99 108 2.67254 2/22/99 108 0.004 2.044 1.81050 3/8/99 123 2.31451 3/8/99 123 2.90852 3/8/99 123 2.749 2.657 0.30855 3/30/99 145 2.98656 3/30/99 145 2.95657 3/30/99 145 2.591 2.844 0.220
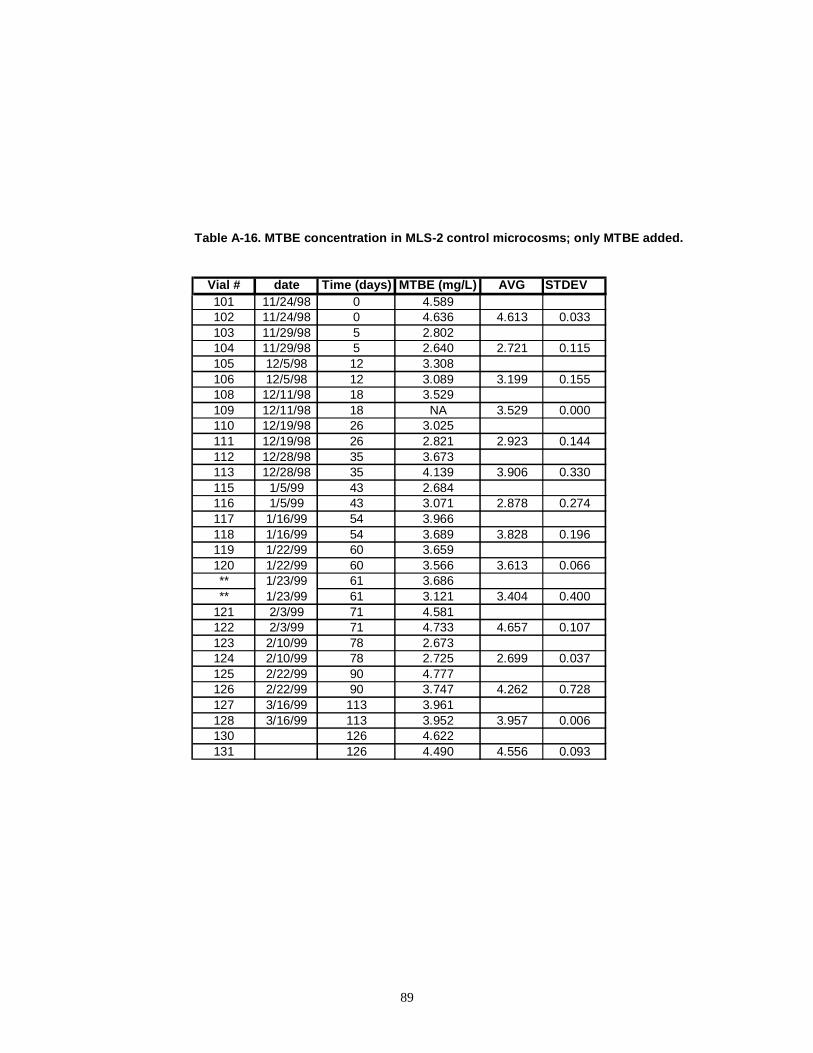
89
Table A-16. MTBE concentration in MLS-2 control microcosms; only MTBE added.
Vial # date Time (days) MTBE (mg/L) AVG STDEV101 11/24/98 0 4.589102 11/24/98 0 4.636 4.613 0.033103 11/29/98 5 2.802104 11/29/98 5 2.640 2.721 0.115105 12/5/98 12 3.308106 12/5/98 12 3.089 3.199 0.155108 12/11/98 18 3.529109 12/11/98 18 NA 3.529 0.000110 12/19/98 26 3.025111 12/19/98 26 2.821 2.923 0.144112 12/28/98 35 3.673113 12/28/98 35 4.139 3.906 0.330115 1/5/99 43 2.684116 1/5/99 43 3.071 2.878 0.274117 1/16/99 54 3.966118 1/16/99 54 3.689 3.828 0.196119 1/22/99 60 3.659120 1/22/99 60 3.566 3.613 0.066** 1/23/99 61 3.686** 1/23/99 61 3.121 3.404 0.400
121 2/3/99 71 4.581122 2/3/99 71 4.733 4.657 0.107123 2/10/99 78 2.673124 2/10/99 78 2.725 2.699 0.037125 2/22/99 90 4.777126 2/22/99 90 3.747 4.262 0.728127 3/16/99 113 3.961128 3/16/99 113 3.952 3.957 0.006130 126 4.622131 126 4.490 4.556 0.093
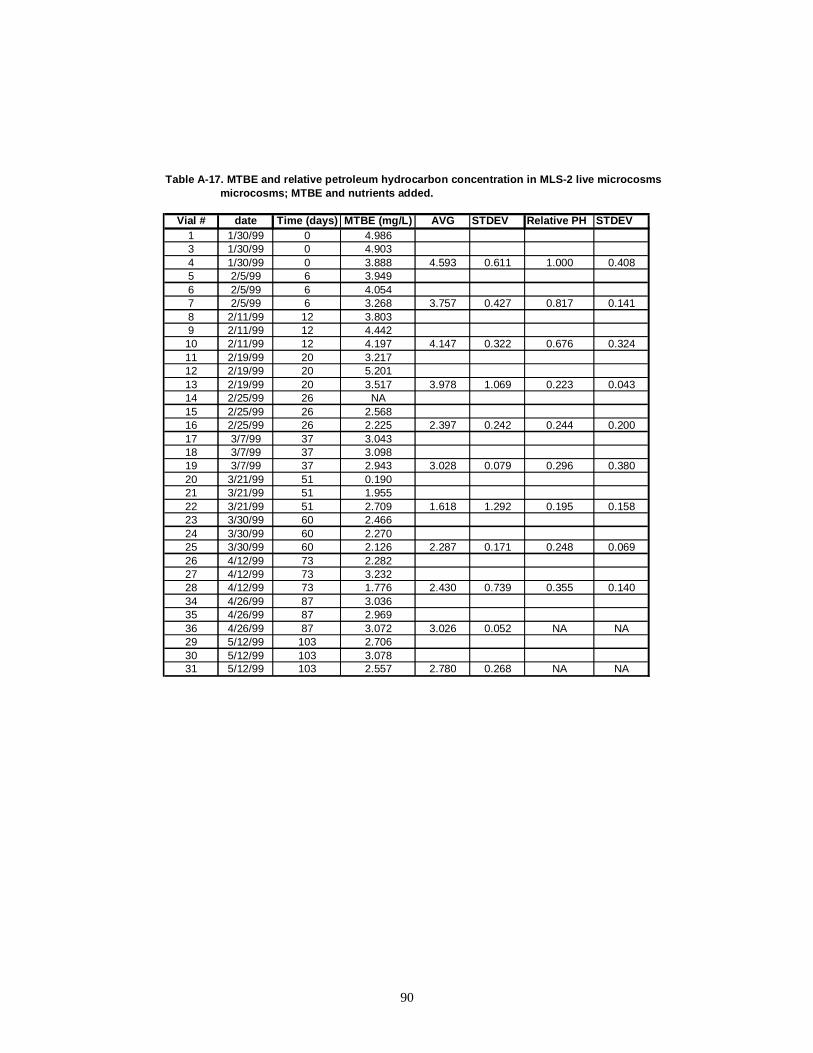
90
Table A-17. MTBE and relative petroleum hydrocarbon concentration in MLS-2 live microcosmsmicrocosms; MTBE and nutrients added.
Vial # date Time (days) MTBE (mg/L) AVG STDEV Relative PH STDEV1 1/30/99 0 4.9863 1/30/99 0 4.9034 1/30/99 0 3.888 4.593 0.611 1.000 0.4085 2/5/99 6 3.9496 2/5/99 6 4.0547 2/5/99 6 3.268 3.757 0.427 0.817 0.1418 2/11/99 12 3.8039 2/11/99 12 4.44210 2/11/99 12 4.197 4.147 0.322 0.676 0.32411 2/19/99 20 3.21712 2/19/99 20 5.20113 2/19/99 20 3.517 3.978 1.069 0.223 0.04314 2/25/99 26 NA15 2/25/99 26 2.56816 2/25/99 26 2.225 2.397 0.242 0.244 0.20017 3/7/99 37 3.04318 3/7/99 37 3.09819 3/7/99 37 2.943 3.028 0.079 0.296 0.38020 3/21/99 51 0.19021 3/21/99 51 1.95522 3/21/99 51 2.709 1.618 1.292 0.195 0.15823 3/30/99 60 2.46624 3/30/99 60 2.27025 3/30/99 60 2.126 2.287 0.171 0.248 0.06926 4/12/99 73 2.28227 4/12/99 73 3.23228 4/12/99 73 1.776 2.430 0.739 0.355 0.14034 4/26/99 87 3.03635 4/26/99 87 2.96936 4/26/99 87 3.072 3.026 0.052 NA NA29 5/12/99 103 2.70630 5/12/99 103 3.07831 5/12/99 103 2.557 2.780 0.268 NA NA
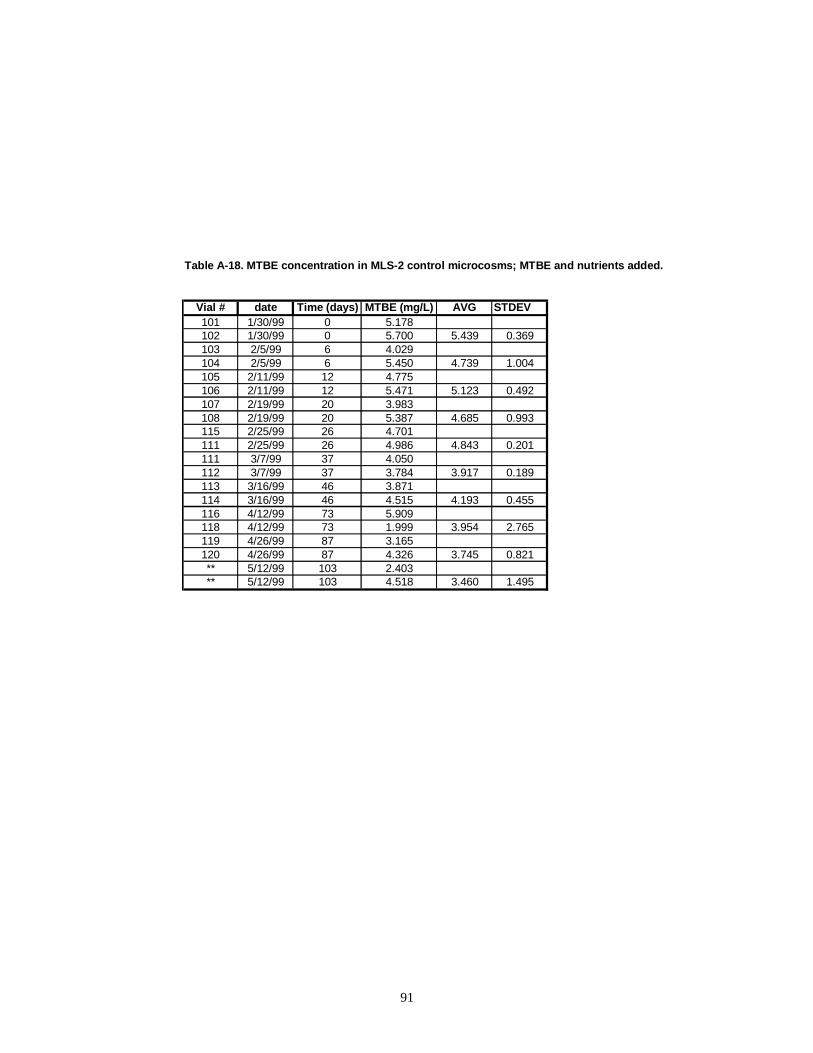
91
Table A-18. MTBE concentration in MLS-2 control microcosms; MTBE and nutrients added.
Vial # date Time (days) MTBE (mg/L) AVG STDEV101 1/30/99 0 5.178102 1/30/99 0 5.700 5.439 0.369103 2/5/99 6 4.029104 2/5/99 6 5.450 4.739 1.004105 2/11/99 12 4.775106 2/11/99 12 5.471 5.123 0.492107 2/19/99 20 3.983108 2/19/99 20 5.387 4.685 0.993115 2/25/99 26 4.701111 2/25/99 26 4.986 4.843 0.201111 3/7/99 37 4.050112 3/7/99 37 3.784 3.917 0.189113 3/16/99 46 3.871114 3/16/99 46 4.515 4.193 0.455116 4/12/99 73 5.909118 4/12/99 73 1.999 3.954 2.765119 4/26/99 87 3.165120 4/26/99 87 4.326 3.745 0.821** 5/12/99 103 2.403** 5/12/99 103 4.518 3.460 1.495
92
VITA
Jeff Radcliffe Zoeckler was born on August 25, 1974 in Richmond, Virginia. He
graduated from Monacan High School in June of 1992. In August of 1992, he enrolled at
Radford University where he studied computer science. In August of 1993, he
transferred to Virginia Polytechnic Institute and State University, where he studied
geology. In December of 1996, he received a B.S. in Geological Sciences from Virginia
Polytechnic Institute and State University. In August of 1997, he began work on his
Master’s degree in Environmental Engineering. In August of 1999, he will begin work as
an engineer with Malcom Pirnie in Tucson, Arizona.