Embed Size (px)
Citation preview

AEROBIC BIODEGRADATION OF ORGANIC CHEMICALSIN ENVIRONMENTAL MEDIA:
A SUMMARY OF FIELD AND LABORATORY STUDIES
Prepared by: Dallas AronsonMario CitraKirsten ShulerHeather PrintupPhilip H. Howard
Environmental Science CenterSyracuse Research Corporation6225 Running Ridge RoadNorth Syracuse, NY 13212-2509
Prepared for: Eric J. Weber
U.S. Environmental Protection AgencyOffice of Research and DevelopmentAthens, GA 30605
January 27, 1999
TABLE OF CONTENTS
1. PURPOSE . . . . . . . . . . . . . . . . . . . . . . . . . . . . . . . . . . . . . . . . . . . . . . . . . . . . . . . . . . . . . . 1
2. TECHNICAL APPROACH . . . . . . . . . . . . . . . . . . . . . . . . . . . . . . . . . . . . . . . . . . . . . . . . . 12.1. Literature Search . . . . . . . . . . . . . . . . . . . . . . . . . . . . . . . . . . . . . . . . . . . . . . . . . . 12.2. Definition and Use of Biodegradation Rate Constants . . . . . . . . . . . . . . . . . . . . . . . 3
2.2.1. Zero-Order Rate Constants . . . . . . . . . . . . . . . . . . . . . . . . . . . . . . . . . . . 32.2.2. First-Order Rate Constants . . . . . . . . . . . . . . . . . . . . . . . . . . . . . . . . . . . 52.2.3. Mineralization Rate Constants Versus Primary Biodegradation Rate
Constants . . . . . . . . . . . . . . . . . . . . . . . . . . . . . . . . . . . . . . . . . . . . . . . . 52.3. Calculation of First-Order Rate Constants . . . . . . . . . . . . . . . . . . . . . . . . . . . . . . . 6
2.3.1. Laboratory Studies . . . . . . . . . . . . . . . . . . . . . . . . . . . . . . . . . . . . . . . . . 62.3.2. Field and in situ Microcosm Studies . . . . . . . . . . . . . . . . . . . . . . . . . . . . 8
3. RESULTS . . . . . . . . . . . . . . . . . . . . . . . . . . . . . . . . . . . . . . . . . . . . . . . . . . . . . . . . . . . . . 103.1. BTEX Compounds . . . . . . . . . . . . . . . . . . . . . . . . . . . . . . . . . . . . . . . . . . . . . . . . 11
3.1.1. Benzene . . . . . . . . . . . . . . . . . . . . . . . . . . . . . . . . . . . . . . . . . . . . . . . . . 123.1.2. Toluene . . . . . . . . . . . . . . . . . . . . . . . . . . . . . . . . . . . . . . . . . . . . . . . . . 273.1.3. Ethylbenzene . . . . . . . . . . . . . . . . . . . . . . . . . . . . . . . . . . . . . . . . . . . . . 483.1.4. o-Xylene . . . . . . . . . . . . . . . . . . . . . . . . . . . . . . . . . . . . . . . . . . . . . . . . 523.1.5. m-Xylene . . . . . . . . . . . . . . . . . . . . . . . . . . . . . . . . . . . . . . . . . . . . . . . . 613.1.6. p-Xylene . . . . . . . . . . . . . . . . . . . . . . . . . . . . . . . . . . . . . . . . . . . . . . . . 66
3.2. PAH (Polycyclic Aromatic Hydrocarbon) Compounds . . . . . . . . . . . . . . . . . . . . . 713.2.1. Naphthalene . . . . . . . . . . . . . . . . . . . . . . . . . . . . . . . . . . . . . . . . . . . . . . 723.2.2. Fluorene . . . . . . . . . . . . . . . . . . . . . . . . . . . . . . . . . . . . . . . . . . . . . . . . 833.2.3. Benzo(a)anthracene . . . . . . . . . . . . . . . . . . . . . . . . . . . . . . . . . . . . . . . . 873.2.4. Chrysene . . . . . . . . . . . . . . . . . . . . . . . . . . . . . . . . . . . . . . . . . . . . . . . . 943.2.5. Fluoranthene . . . . . . . . . . . . . . . . . . . . . . . . . . . . . . . . . . . . . . . . . . . . 1003.2.6. Pyrene . . . . . . . . . . . . . . . . . . . . . . . . . . . . . . . . . . . . . . . . . . . . . . . . . 1033.2.7. Benzo(a)pyrene . . . . . . . . . . . . . . . . . . . . . . . . . . . . . . . . . . . . . . . . . . 109
3.3. Chlorinated Aliphatic Compounds . . . . . . . . . . . . . . . . . . . . . . . . . . . . . . . . . . . 1153.3.1. Tetrachloroethylene . . . . . . . . . . . . . . . . . . . . . . . . . . . . . . . . . . . . . . . 1153.3.2. Dichloromethane . . . . . . . . . . . . . . . . . . . . . . . . . . . . . . . . . . . . . . . . . 120
3.4. Phenol and Substituted Phenols . . . . . . . . . . . . . . . . . . . . . . . . . . . . . . . . . . . . . 1223.4.1. Phenol . . . . . . . . . . . . . . . . . . . . . . . . . . . . . . . . . . . . . . . . . . . . . . . . . 122
3.6. Miscellaneous . . . . . . . . . . . . . . . . . . . . . . . . . . . . . . . . . . . . . . . . . . . . . . . . . . . 1513.6.1. Bis(2-ethylhexyl)phthalate . . . . . . . . . . . . . . . . . . . . . . . . . . . . . . . . . . 1513.5.2. Methanol . . . . . . . . . . . . . . . . . . . . . . . . . . . . . . . . . . . . . . . . . . . . . . . 158
4. SUMMARY . . . . . . . . . . . . . . . . . . . . . . . . . . . . . . . . . . . . . . . . . . . . . . . . . . . . . . . . . . . 161
5. REFERENCES . . . . . . . . . . . . . . . . . . . . . . . . . . . . . . . . . . . . . . . . . . . . . . . . . . . . . . . . 164
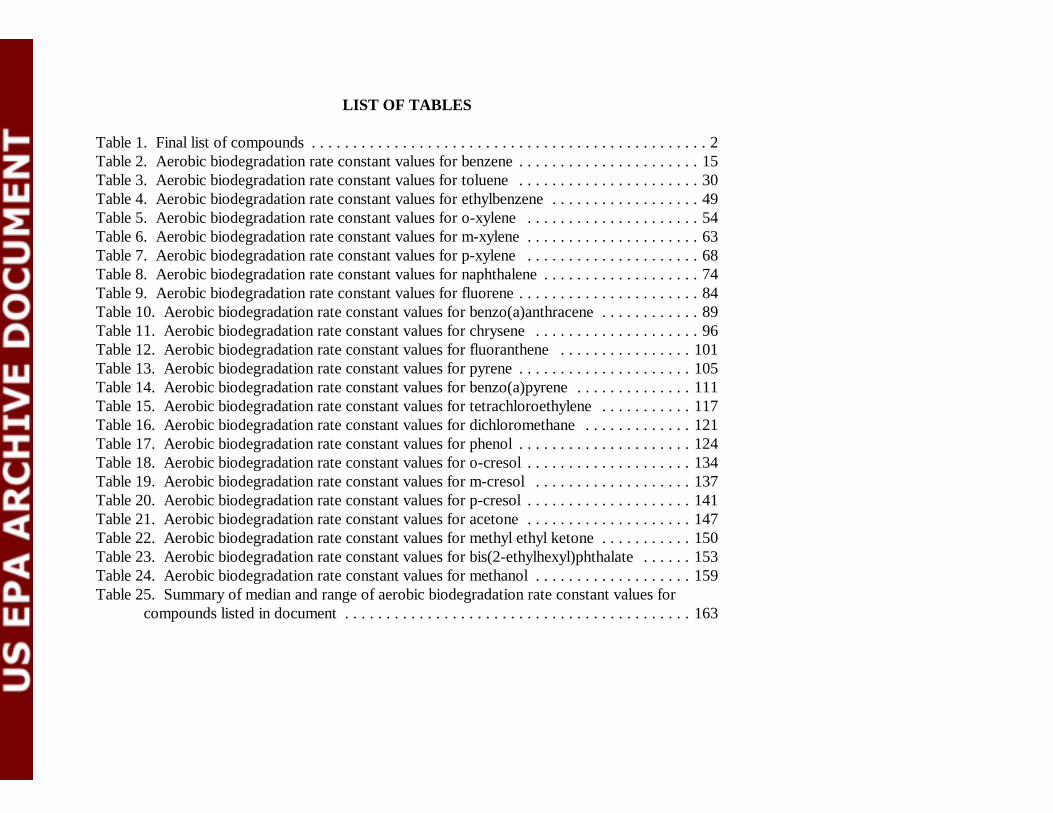
LIST OF TABLES
Table 1. Final list of compounds . . . . . . . . . . . . . . . . . . . . . . . . . . . . . . . . . . . . . . . . . . . . . . . . 2Table 2. Aerobic biodegradation rate constant values for benzene . . . . . . . . . . . . . . . . . . . . . . 15Table 3. Aerobic biodegradation rate constant values for toluene . . . . . . . . . . . . . . . . . . . . . . 30Table 4. Aerobic biodegradation rate constant values for ethylbenzene . . . . . . . . . . . . . . . . . . 49Table 5. Aerobic biodegradation rate constant values for o-xylene . . . . . . . . . . . . . . . . . . . . . 54Table 6. Aerobic biodegradation rate constant values for m-xylene . . . . . . . . . . . . . . . . . . . . . 63Table 7. Aerobic biodegradation rate constant values for p-xylene . . . . . . . . . . . . . . . . . . . . . 68Table 8. Aerobic biodegradation rate constant values for naphthalene . . . . . . . . . . . . . . . . . . . 74Table 9. Aerobic biodegradation rate constant values for fluorene . . . . . . . . . . . . . . . . . . . . . . 84Table 10. Aerobic biodegradation rate constant values for benzo(a)anthracene . . . . . . . . . . . . 89Table 11. Aerobic biodegradation rate constant values for chrysene . . . . . . . . . . . . . . . . . . . . 96Table 12. Aerobic biodegradation rate constant values for fluoranthene . . . . . . . . . . . . . . . . 101Table 13. Aerobic biodegradation rate constant values for pyrene . . . . . . . . . . . . . . . . . . . . . 105Table 14. Aerobic biodegradation rate constant values for benzo(a)pyrene . . . . . . . . . . . . . . 111Table 15. Aerobic biodegradation rate constant values for tetrachloroethylene . . . . . . . . . . . 117Table 16. Aerobic biodegradation rate constant values for dichloromethane . . . . . . . . . . . . . 121Table 17. Aerobic biodegradation rate constant values for phenol . . . . . . . . . . . . . . . . . . . . . 124Table 18. Aerobic biodegradation rate constant values for o-cresol . . . . . . . . . . . . . . . . . . . . 134Table 19. Aerobic biodegradation rate constant values for m-cresol . . . . . . . . . . . . . . . . . . . 137Table 20. Aerobic biodegradation rate constant values for p-cresol . . . . . . . . . . . . . . . . . . . . 141Table 21. Aerobic biodegradation rate constant values for acetone . . . . . . . . . . . . . . . . . . . . 147Table 22. Aerobic biodegradation rate constant values for methyl ethyl ketone . . . . . . . . . . . 150Table 23. Aerobic biodegradation rate constant values for bis(2-ethylhexyl)phthalate . . . . . . 153Table 24. Aerobic biodegradation rate constant values for methanol . . . . . . . . . . . . . . . . . . . 159Table 25. Summary of median and range of aerobic biodegradation rate constant values for
compounds listed in document . . . . . . . . . . . . . . . . . . . . . . . . . . . . . . . . . . . . . . . . . . 163
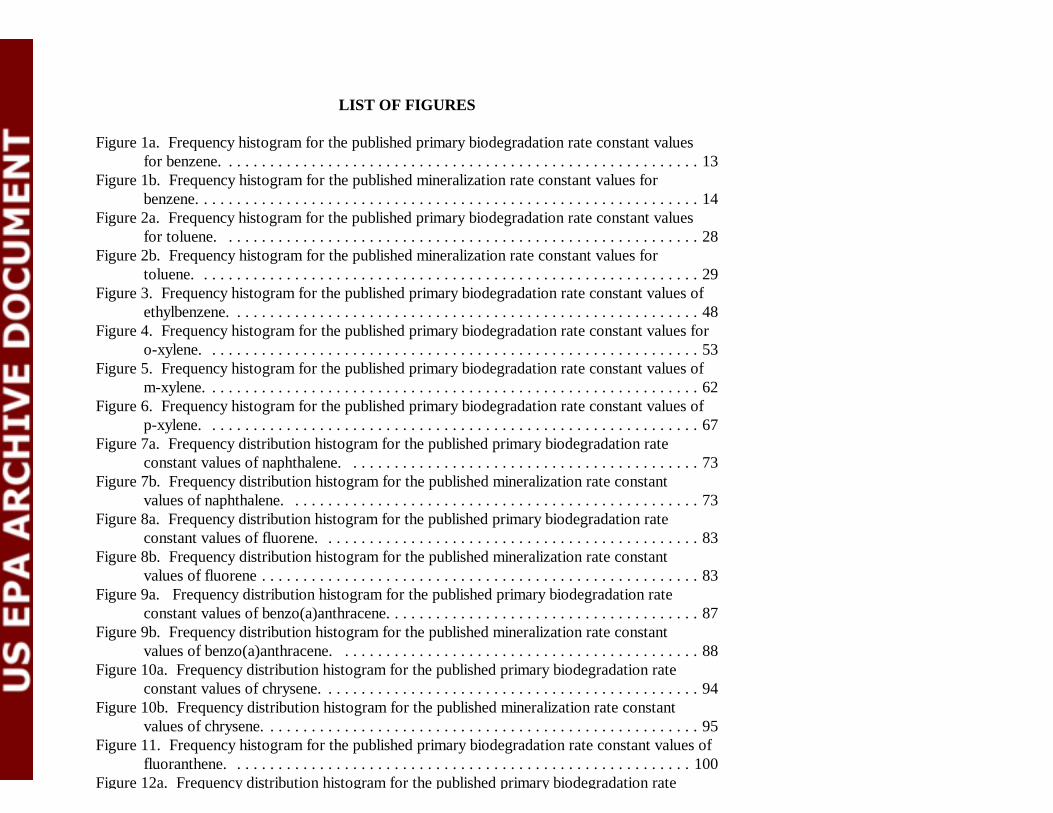
LIST OF FIGURES
Figure 1a. Frequency histogram for the published primary biodegradation rate constant valuesfor benzene. . . . . . . . . . . . . . . . . . . . . . . . . . . . . . . . . . . . . . . . . . . . . . . . . . . . . . . . . . 13
Figure 1b. Frequency histogram for the published mineralization rate constant values forbenzene. . . . . . . . . . . . . . . . . . . . . . . . . . . . . . . . . . . . . . . . . . . . . . . . . . . . . . . . . . . . . 14
Figure 2a. Frequency histogram for the published primary biodegradation rate constant valuesfor toluene. . . . . . . . . . . . . . . . . . . . . . . . . . . . . . . . . . . . . . . . . . . . . . . . . . . . . . . . . . 28
Figure 2b. Frequency histogram for the published mineralization rate constant values fortoluene. . . . . . . . . . . . . . . . . . . . . . . . . . . . . . . . . . . . . . . . . . . . . . . . . . . . . . . . . . . . . 29
Figure 3. Frequency histogram for the published primary biodegradation rate constant values ofethylbenzene. . . . . . . . . . . . . . . . . . . . . . . . . . . . . . . . . . . . . . . . . . . . . . . . . . . . . . . . . 48
Figure 4. Frequency histogram for the published primary biodegradation rate constant values foro-xylene. . . . . . . . . . . . . . . . . . . . . . . . . . . . . . . . . . . . . . . . . . . . . . . . . . . . . . . . . . . . 53
Figure 5. Frequency histogram for the published primary biodegradation rate constant values ofm-xylene. . . . . . . . . . . . . . . . . . . . . . . . . . . . . . . . . . . . . . . . . . . . . . . . . . . . . . . . . . . . 62
Figure 6. Frequency histogram for the published primary biodegradation rate constant values ofp-xylene. . . . . . . . . . . . . . . . . . . . . . . . . . . . . . . . . . . . . . . . . . . . . . . . . . . . . . . . . . . . 67
Figure 7a. Frequency distribution histogram for the published primary biodegradation rateconstant values of naphthalene. . . . . . . . . . . . . . . . . . . . . . . . . . . . . . . . . . . . . . . . . . . 73
Figure 7b. Frequency distribution histogram for the published mineralization rate constantvalues of naphthalene. . . . . . . . . . . . . . . . . . . . . . . . . . . . . . . . . . . . . . . . . . . . . . . . . . 73
Figure 8a. Frequency distribution histogram for the published primary biodegradation rateconstant values of fluorene. . . . . . . . . . . . . . . . . . . . . . . . . . . . . . . . . . . . . . . . . . . . . . 83
Figure 8b. Frequency distribution histogram for the published mineralization rate constantvalues of fluorene . . . . . . . . . . . . . . . . . . . . . . . . . . . . . . . . . . . . . . . . . . . . . . . . . . . . . 83
Figure 9a. Frequency distribution histogram for the published primary biodegradation rateconstant values of benzo(a)anthracene. . . . . . . . . . . . . . . . . . . . . . . . . . . . . . . . . . . . . . 87
Figure 9b. Frequency distribution histogram for the published mineralization rate constantvalues of benzo(a)anthracene. . . . . . . . . . . . . . . . . . . . . . . . . . . . . . . . . . . . . . . . . . . . 88
Figure 10a. Frequency distribution histogram for the published primary biodegradation rateconstant values of chrysene. . . . . . . . . . . . . . . . . . . . . . . . . . . . . . . . . . . . . . . . . . . . . . 94
Figure 10b. Frequency distribution histogram for the published mineralization rate constantvalues of chrysene. . . . . . . . . . . . . . . . . . . . . . . . . . . . . . . . . . . . . . . . . . . . . . . . . . . . . 95
Figure 11. Frequency histogram for the published primary biodegradation rate constant values offluoranthene. . . . . . . . . . . . . . . . . . . . . . . . . . . . . . . . . . . . . . . . . . . . . . . . . . . . . . . . 100
Figure 12a. Frequency distribution histogram for the published primary biodegradation rate
Figure 13b. Frequency histogram for the published mineralization rate constant values ofbenzo(a)pyrene. . . . . . . . . . . . . . . . . . . . . . . . . . . . . . . . . . . . . . . . . . . . . . . . . . . . . . 110
Figure 14. Frequency histogram for the published primary biodegradation rate constant values ofdichloromethane. . . . . . . . . . . . . . . . . . . . . . . . . . . . . . . . . . . . . . . . . . . . . . . . . . . . . 120
Figure 15a. The frequency histogram for the published primary biodegradation rate constantvalues of phenol. . . . . . . . . . . . . . . . . . . . . . . . . . . . . . . . . . . . . . . . . . . . . . . . . . . . . 123
Figure 15b. The frequency histogram for the published mineralization rate constant values ofphenol. . . . . . . . . . . . . . . . . . . . . . . . . . . . . . . . . . . . . . . . . . . . . . . . . . . . . . . . . . . . . 123
Figure 16. Frequency histogram for the published primary biodegradation rate constant values ofo-cresol. . . . . . . . . . . . . . . . . . . . . . . . . . . . . . . . . . . . . . . . . . . . . . . . . . . . . . . . . . . . 133
Figure 17. Frequency histogram for the published primary biodegradation rate constant values ofm-cresol. . . . . . . . . . . . . . . . . . . . . . . . . . . . . . . . . . . . . . . . . . . . . . . . . . . . . . . . . . . 136
Figure 18. Frequency histogram for the published primary biodegradation rate constant values ofp-cresol. . . . . . . . . . . . . . . . . . . . . . . . . . . . . . . . . . . . . . . . . . . . . . . . . . . . . . . . . . . . 140
Figure 19. Rate constant versus initial concentration of acetone in a shallow stream. . . . . . . . 145Figure 20a. The frequency histogram for the published primary biodegradation rate constant
values of acetone. . . . . . . . . . . . . . . . . . . . . . . . . . . . . . . . . . . . . . . . . . . . . . . . . . . . . 146Figure 20b. The frequency histogram for the published primary biodegradation rate constant
values of acetone. . . . . . . . . . . . . . . . . . . . . . . . . . . . . . . . . . . . . . . . . . . . . . . . . . . . . 146Figure 21a. Frequency histogram for the published primary biodegradation rate constant values
of bis(2-ethylhexyl)phthalate. . . . . . . . . . . . . . . . . . . . . . . . . . . . . . . . . . . . . . . . . . . . 152Figure 21b. Frequency histogram for the published mineralization rate constant values of bis(2-
ethylhexyl)phthalate. . . . . . . . . . . . . . . . . . . . . . . . . . . . . . . . . . . . . . . . . . . . . . . . . . 152Figure 22. Frequency histogram for the published primary biodegradation rate constant values of
methanol. . . . . . . . . . . . . . . . . . . . . . . . . . . . . . . . . . . . . . . . . . . . . . . . . . . . . . . . . . . 158
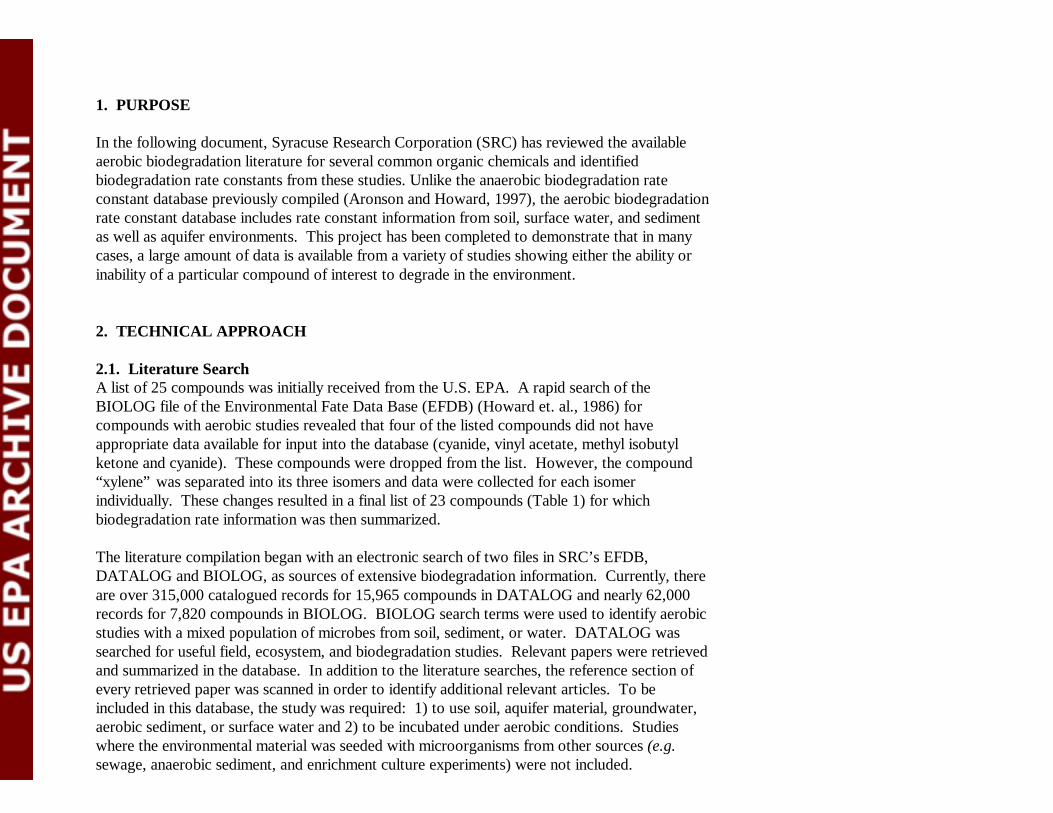
1. PURPOSE
In the following document, Syracuse Research Corporation (SRC) has reviewed the availableaerobic biodegradation literature for several common organic chemicals and identifiedbiodegradation rate constants from these studies. Unlike the anaerobic biodegradation rateconstant database previously compiled (Aronson and Howard, 1997), the aerobic biodegradationrate constant database includes rate constant information from soil, surface water, and sedimentas well as aquifer environments. This project has been completed to demonstrate that in manycases, a large amount of data is available from a variety of studies showing either the ability orinability of a particular compound of interest to degrade in the environment.
2. TECHNICAL APPROACH
2.1. Literature SearchA list of 25 compounds was initially received from the U.S. EPA. A rapid search of theBIOLOG file of the Environmental Fate Data Base (EFDB) (Howard et. al., 1986) forcompounds with aerobic studies revealed that four of the listed compounds did not haveappropriate data available for input into the database (cyanide, vinyl acetate, methyl isobutylketone and cyanide). These compounds were dropped from the list. However, the compound“xylene” was separated into its three isomers and data were collected for each isomerindividually. These changes resulted in a final list of 23 compounds (Table 1) for whichbiodegradation rate information was then summarized.
The literature compilation began with an electronic search of two files in SRC’s EFDB,DATALOG and BIOLOG, as sources of extensive biodegradation information. Currently, thereare over 315,000 catalogued records for 15,965 compounds in DATALOG and nearly 62,000records for 7,820 compounds in BIOLOG. BIOLOG search terms were used to identify aerobicstudies with a mixed population of microbes from soil, sediment, or water. DATALOG wassearched for useful field, ecosystem, and biodegradation studies. Relevant papers were retrievedand summarized in the database. In addition to the literature searches, the reference section ofevery retrieved paper was scanned in order to identify additional relevant articles. To beincluded in this database, the study was required: 1) to use soil, aquifer material, groundwater,aerobic sediment, or surface water and 2) to be incubated under aerobic conditions. Studieswhere the environmental material was seeded with microorganisms from other sources (e.g.sewage, anaerobic sediment, and enrichment culture experiments) were not included.
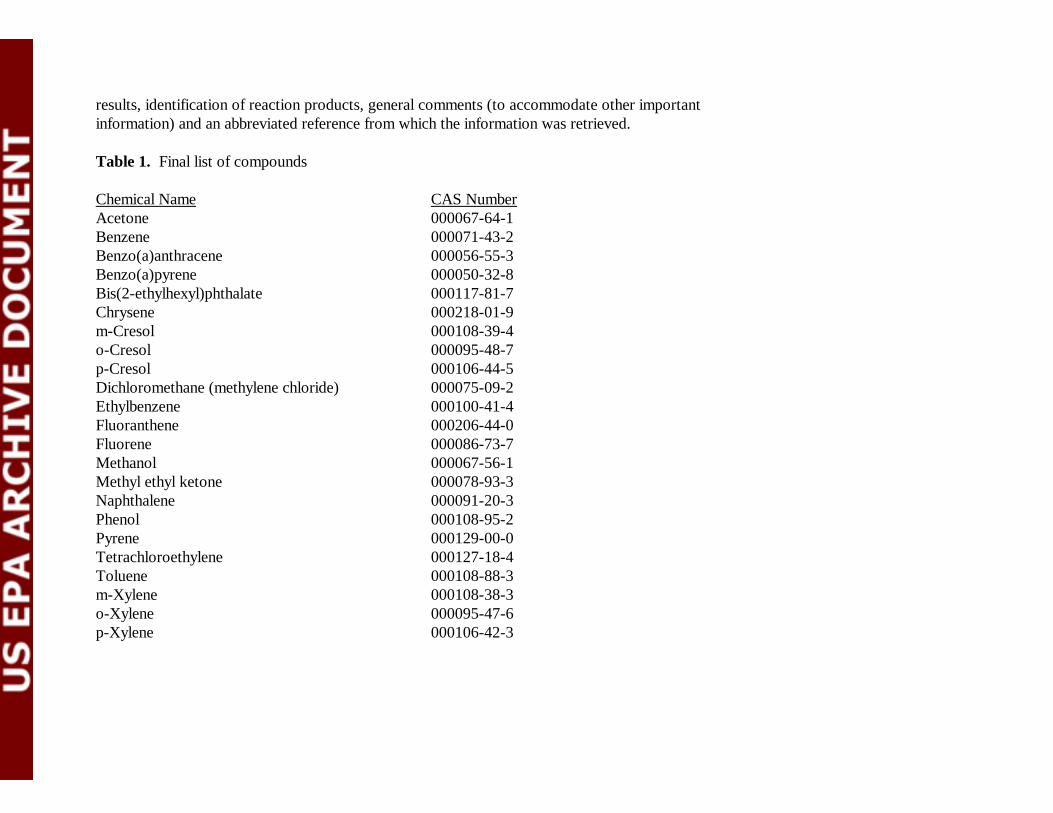
results, identification of reaction products, general comments (to accommodate other importantinformation) and an abbreviated reference from which the information was retrieved.
Table 1. Final list of compounds
Chemical Name CAS NumberAcetone 000067-64-1Benzene 000071-43-2Benzo(a)anthracene 000056-55-3Benzo(a)pyrene 000050-32-8Bis(2-ethylhexyl)phthalate 000117-81-7Chrysene 000218-01-9m-Cresol 000108-39-4o-Cresol 000095-48-7p-Cresol 000106-44-5Dichloromethane (methylene chloride) 000075-09-2Ethylbenzene 000100-41-4Fluoranthene 000206-44-0Fluorene 000086-73-7Methanol 000067-56-1Methyl ethyl ketone 000078-93-3Naphthalene 000091-20-3Phenol 000108-95-2Pyrene 000129-00-0Tetrachloroethylene 000127-18-4Toluene 000108-88-3m-Xylene 000108-38-3o-Xylene 000095-47-6p-Xylene 000106-42-3
µ'µmaxSKs%S (1)
v'VmaxSKm%S (2)
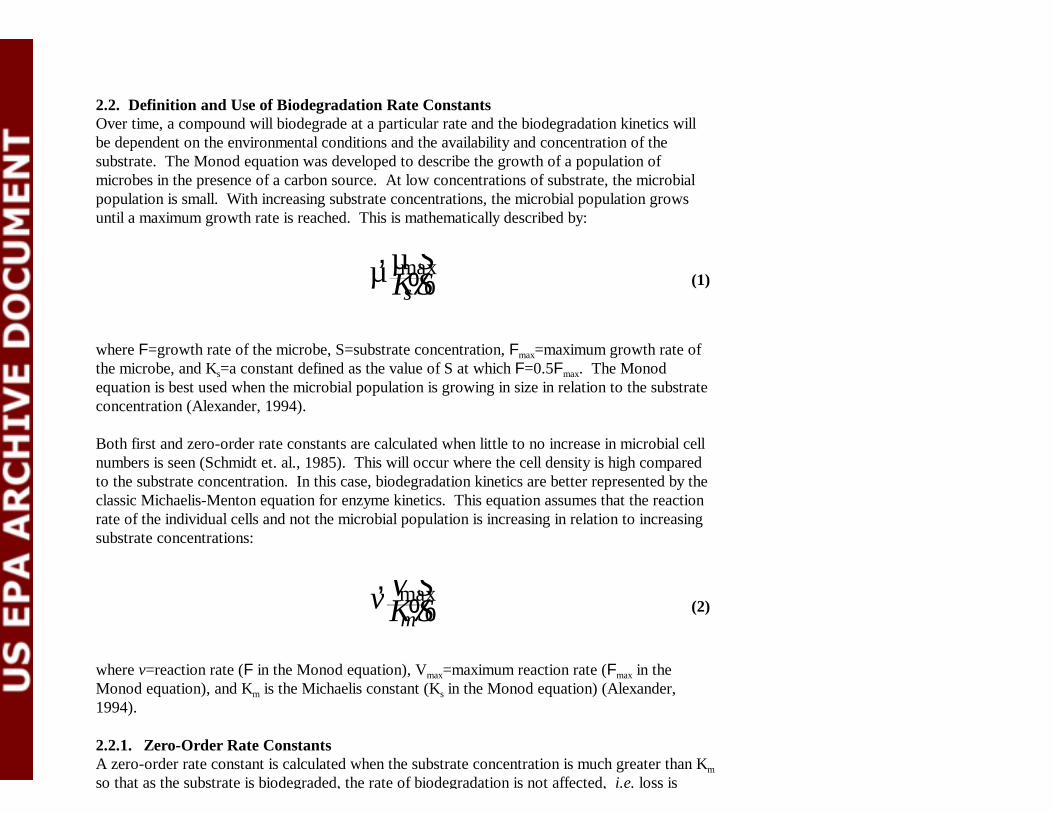
2.2. Definition and Use of Biodegradation Rate ConstantsOver time, a compound will biodegrade at a particular rate and the biodegradation kinetics willbe dependent on the environmental conditions and the availability and concentration of thesubstrate. The Monod equation was developed to describe the growth of a population ofmicrobes in the presence of a carbon source. At low concentrations of substrate, the microbialpopulation is small. With increasing substrate concentrations, the microbial population growsuntil a maximum growth rate is reached. This is mathematically described by:
where F=growth rate of the microbe, S=substrate concentration, Fmax=maximum growth rate ofthe microbe, and Ks=a constant defined as the value of S at which F=0.5Fmax. The Monod equation is best used when the microbial population is growing in size in relation to the substrateconcentration (Alexander, 1994).
Both first and zero-order rate constants are calculated when little to no increase in microbial cellnumbers is seen (Schmidt et. al., 1985). This will occur where the cell density is high comparedto the substrate concentration. In this case, biodegradation kinetics are better represented by theclassic Michaelis-Menton equation for enzyme kinetics. This equation assumes that the reactionrate of the individual cells and not the microbial population is increasing in relation to increasingsubstrate concentrations:
where v=reaction rate (F in the Monod equation), Vmax=maximum reaction rate (Fmax in theMonod equation), and Km is the Michaelis constant (Ks in the Monod equation) (Alexander,1994).
2.2.1. Zero-Order Rate ConstantsA zero-order rate constant is calculated when the substrate concentration is much greater than Km
so that as the substrate is biodegraded, the rate of biodegradation is not affected, i.e. loss is
k0'S0&St (4)
and the integral:
where S0=initial substrate concentration, S=substrate concentration at time=t, and k0=the zero-order rate constant (expressed as concentration/time, e.g. Fg/L/day).
In the aerobic biodegradation database, zero-order rate constants are reported where the authorhas determined this value. If the author did not specify that the zero-order rate constant was abetter measurement of the kinetics, this value was placed in the rate constant comments field anda SRC calculated first-order rate constant was placed in the rate constant field. If it was specifiedthat zero-order rate kinetics were superior in describing the loss of a compound in the measuredsystem, the zero-order rate constant was placed in the rate constant field and a first-order rateconstant calculated by SRC was reported in the rate constant comment field. When sufficientinformation was not present in the paper to convert the reported values to a first-order rateconstant, then the zero-order rate constant was placed in the rate constant field.
If a rate constant was not reported by the study authors and a value could be determined from thepresented experimental data, SRC assumed first-order rate kinetics. A more accurate but timeconsuming approach would have been to plot the substrate concentration versus time. A straightline would signify zero-order kinetics and an exponential curve (or a straight line on a log linearpaper) would indicate first-order kinetics. Priority was given to the determination of a first-orderrate constant as many environmental models require the input of a first-order rate constant. Thismay not be strictly correct in all situations, such as when the substrate is present at highconcentrations (above Km), when substrate concentrations are toxic to the microbial population,when another substrate(s) is limiting the biodegradation rate or when the microbial population issignificantly increasing or decreasing in size (Chapelle et. al., 1996).
Recently, the common use of first-order rate constant values to describe the kinetics ofbiodegradation loss in natural systems has been criticized. Bekins et. al. (1998) suggest that theautomatic use of first-order kinetics without first determining whether the substrate concentrationis less than the half-saturation constant, Km, is incorrect and can lead to substantialmiscalculations of the biodegradation rate of a studied compound. Using first-order kineticswhere the substrate concentration is higher than Km will lead to an overprediction of the
dSdt'k1S (5)
k1'lnS0St
(6)
Km value and that first-order kinetics may not adequately represent the biodegradation of thestudied compound. First-order rate constants are, however, commonly used to describe kineticsin natural systems often because of the lack of sufficient data points and the ease with whichthese values can be calculated. Salanitro (1993) reports that several studies where BTEXconcentrations range from <1 to 5000 ppb are adequately described by first-order kinetics.
2.2.2. First-Order Rate ConstantsFirst-order rate constants are used as a convenient approximation of the kinetics of degradationof test substrates where there is no growth of the microbial population and a low concentration ofthe test substrate is present. Under these circumstances, the substrate concentration is lower thanKm and, over time, both the concentration of substrate and rate of degradation drop in proportionwith each other. Thus, unlike zero-order kinetics, the rate of biodegradation in a first-orderreaction is dependent on the substrate concentration and is represented by the differential:
and the integral:
where S0=initial substrate concentration, S=substrate concentration at time=t, and k1=the first-order rate constant. During first-order rate reactions, the loss of substrate is exponential andfollows a logarithmic curve.
The rate constant is used to correlate the rate of the reaction with time. In a first-order reaction, aconstant percent of the substrate is lost with time and the rate is described by either percent pertime or the half-life. The half-life is easily visualized and is more commonly used. In contrast, azero-order rate constant by definition equals the rate and is given in units of concentration/time. This is because the rate is linear and loss is constant with time.
2.2.3. Mineralization Rate Constants Versus Primary Biodegradation Rate ConstantsMany experiments summarized in the aerobic biodegradation database measured mineralization,
measured. In addition, once produced, CO2 can be bound as carbonate within the study system.Thus, it is expected that unless degradation proceeds rapidly and completely to CO2 and water,that mineralization rate constant values will be less than those measured for primarybiodegradation.
2.3. Calculation of First-Order Rate ConstantsRate constants were collected from eight types of studies: laboratory column, field, groundwatergrab sample, groundwater inoculum, in situ microcosm, lysimeter, reactor systems, andlaboratory microcosm studies. The majority of studies summarized in the aerobic biodegradationdatabase were laboratory microcosm studies. Laboratory microcosm studies can be furthersubdivided by the type of grab sample used: soil, sediment, surface water (including freshwater,estuarine, and seawater), and aquifer sediment and groundwater mixtures. The informationobtained from each of these studies ranged from published first-order rate constants to simply anindication or contraindication of biodegradation. In some cases, insufficient data were availableto assess whether biodegradation had occurred; for these studies, the rate constant field was leftblank. When published first-order rate constants were not available, but sufficient informationwas presented to calculate a value, the rate constant was calculated by SRC.
To ensure that loss of a contaminant was due to biodegradation and not just to abiotic ortransport processes, an appropriate control was necessary to correct the data set. This can be aproblem in laboratory studies that are incubated for a long period of time. Mercuric chloride isknown to adsorb to the clay component of soil or aquifer sediment reducing its efficacy whereassodium azide only inhibits bacteria containing cytochromes (Wiedemeier et. al., 1996). Inaddition, autoclaving may not be totally suitable, probably due to incomplete sterilization(Dobbins et. al., 1992). Information on the control used in the study, if available in the paper, isfound in the database field “control results”. This field was used mainly to state the method ofsterilization, or, in the case of field studies, whether a conservative tracer was used. If a controlwas used by the author(s) but the method not specified then “yes” was placed in the “controlresults” field (e.g. Davis and Madsen, 1996). If the paper does not state whether a control wasused then this field was left blank.
In some instances, a value is also included in the control field. When reported, this represents theloss of compound in the control over the study period. Studies often did not specify the lossfound in the control, or the half-life or rate constant was directly reported by the author(s) and itwas assumed, unless stated otherwise, that these values had been corrected for abiotic loss.
2.3.1. Laboratory Studies
Cf,corr'CfZiZf
(7)
ln Ci
relative numbers, metabolic state and ability to acclimate once exposed to a chemical are likely tovary considerably depending upon environmental parameters such as temperature, conductivity,pH, oxygen concentration, redox potential, concentration, the presence/absence of electronacceptors and donors, and effects, both synergistic and antagonistic, of associated microflora(Howard and Banerjee, 1984).
Lag periods were established either from the discussion in the paper or from looking at the data,and an appropriate initial and final concentration was chosen. The value used for the initialconcentration was the concentration present following the lag period; therefore, all ratecalculations for this project are independent of the associated lag period. Where a value of “0µg/L” was reached as a final timepoint, an earlier time was chosen for the kinetics calculation, ifpossible; the use of zero as a denominator in the first-order rate equation would result in an“infinite” value. If the concentration reached a value other than zero but leveled off at that pointfor the remainder of the experiment, the final concentration and time were chosen at the pointwhere the concentration leveled off. In column studies, the time field in the database containsthe retention time for the column, which is the value (? t) used to calculate the rate constant;column experiments were usually run for long periods of time, which would allow for thedevelopment of an acclimated microbial population.
The initial and final concentrations of the control within the chosen time period were obtainedand the experimental data corrected for the loss shown by the control using the followingequation:
where: Cf,corr=corrected final concentration of the contaminant (corrected for non-biodegradation loss
Cf=final contaminant concentration, uncorrectedZi=initial control concentrationZf=final control concentration.
A first-order rate constant was then calculated for laboratory data using the corrected finalcontaminant concentration as follows:
where: Ci=initial contaminant concentrationCf,corr=corrected final concentration of the contaminant (corrected for non-biodegradation
loss)? t=time intervalk1=first-order rate constant.
2.3.2. Field and in situ Microcosm StudiesIn situ microcosms were designed to isolate a portion of the aquifer in order to makemeasurements directly in the field. This device is essentially a pipe divided into a test chamberand an equipment chamber, with two screens that permit water to be pumped both into and out ofthe interior of the pipe. More detailed information can be found in Gillham et. al. (1990). Groundwater is pumped to the surface, spiked with the compounds of interest plus other nutrientsand/or electron acceptors if wanted, and then reinjected. Because the test zone is isolated fromthe main aquifer, advective and dispersive processes are not important to the study results. Often, this method is used to give very specific results for a particular redox regime within anaquifer (Nielsen et. al., 1995). The data obtained from this type of study was similar to that for alaboratory microcosm where loss of substrate is monitored with time; rate constants werecalculated using the same method as for the laboratory studies.
In general, the field studies reported in this database are for aquifer environments. Only a limitednumber of aerobic aquifer studies were located, mainly because the oxygen initially present ingroundwater will be rapidly used during oxidative degradation. This results in anaerobicconditions close to the source and within the contaminant plume. However, biodegradation datawere reported for a few aerobic aquifer environments. Data from field studies were generallyreported for 1) plume studies where monitoring wells were placed along the centerline of acontaminant plume or for 2) continuous injection experiments where monitoring wells wereplaced in fences along the flow path fairly close to the injection point (often 2 and 5 metersaway). Loss of a contaminant over distance does not necessarily indicate that the compound hasundergone biodegradation. Significant loss in concentration along a flow path is often reportedfor compounds simply due to non-biological processes such as advection, dispersion, sorption,and dilution. However, degradation is the only mechanism which leads to an actual loss of thecontaminant.
The most convenient way to correct for non-biodegradation processes in both plume andinjection studies is to use compounds present in the contaminant plume or injection mixture thatare 1) biologically recalcitrant and 2) have similar properties, such as Henry’s Law constant and
from a minimum of two points along a flow path in order to correct for the loss of the compoundof interest due to transport processes.
A mass balance approach has also been used by some researchers (Barker et. al., 1987) todetermine the rate of biodegradation of specific contaminants in groundwater during a fieldstudy. Mass flux of the studied contaminant through a line/cluster of wells (a transect) isrecorded instead of monitoring loss of the contaminant at specific points down the middle of aplume, as is typical for a plume centerline study. Wiedemeier et. al. (1996), suggests that thecalculations involved are approximate and that often many of the required parameters necessaryfor the modeling are not available.
3. RESULTS
Biodegradation of organic compounds under aerobic conditions most often occurs when bacteriacatalyze the breakdown of these molecules and then recover some of this chemical energy asATP (adenosine triphosphate) which is absolutely necessary for maintenance of the bacterial cell. ATP is generated through a series of oxidation-reduction reactions (the electron transport chain)where electrons are sequentially transferred from one compound, the electron donor, to anelectron acceptor. The final or terminal electron acceptor in aerobic respiration is oxygen. Dissolved oxygen concentrations of 1 mg/L or greater are considered to define aerobicconditions. During aerobic respiration, the oxygen present in the environment is converted towater and thus the dissolved oxygen content can decrease. This is particularly significant inclosed systems, as in a confined aquifer, where conditions can quickly become anaerobic with themetabolism of high concentrations of organic chemicals.
Thermodynamically, the reduction of molecular oxygen to water is very favorable for theparticipating microorganisms. Because hydrocarbons are generally chemically reduced(chlorinated aliphatics are an exception within the group of compounds in this paper) and stable,this is a preferred pathway over other redox pathways such as anaerobic chemical reduction. Aerobic biodegradation results in the oxidation of the original compound. Metabolism ofaliphatic compounds generally proceeds initially by production of the alcohol and then oxidationto the carboxylic acid which is susceptible to beta-oxidation. In pure culture studies, aromatichydrocarbons have been shown to biodegrade generally with the addition of one molecule ofoxygen giving the dihydrodiol intermediate, usually with a cis-stereochemistry. Thisintermediate is then oxidized forming the catechol which then allows for ortho- or meta-cleavage of the aromatic ring structure (Gibson, 1977).
The data collected during this project were mainly from laboratory microcosm studies, aclassification including grab sample studies (except for groundwater grab samples) for thepurposes of this database. Groundwater grab samples were considered separately as it has beenshown that a large majority of microorganisms responsible for biodegradation in the subsurfaceenvironment are associated with the aquifer sediment surface (Thomas et. al., 1987). Therefore,rates collected during groundwater grab studies may not be as rapid as those where aquifersediment is included. Laboratory microcosm studies are believed to give very good evidence ofbiodegradation at a specific location and can provide an “absolute mass balance” on a particularcontaminant. In addition, the formation and measurement of metabolites can definitively showthe biodegradation of the contaminant of interest. However, results from a laboratory microcosmcan be greatly influenced by many factors such as the source, collection, and condition of the
a natural sample during its collection or the construction of a microcosm may also result in a“disturbance artifact” which is seen as an increase in the microbial activity of the sample (Davisand Olsen, 1990). However, the influence of transport processes such as volatilization andadsorption cannot be measured in a microcosm experiment. If consideration of these processes isimportant, then field studies can be used to provide environmentally relevant data for a specificsite, essentially showing whether the compound of interest can or cannot be biodegraded at thatlocation.
The results for each compound are presented in the following sections. Separation of the datainto mineralization and primary degradation studies was initially completed and each categorywas considered separately. A range was given to represent the dispersion of the data within thegroup as well as a median value, representing the central tendency of the data. In addition,frequency distribution histograms for the two types of studies are given for each compound withsufficient data. Within the subcategories of mineralization and primary degradation, each studywas given equal weighting despite differences in how the study was carried out. Rate constantswhich were given as zero-order and could not be converted to first-order rate constants were notincluded in the statistical analysis.
3.1. BTEX CompoundsThe BTEX group is composed of the water-soluble and monoaromatic compounds benzene,toluene, ethylbenzene, o-xylene, m-xylene, and p-xylene. In both laboratory and field studies, thebiodegradation of all the BTEX compounds has been shown under aerobic conditions (Tables 2to 7). There is a stoichometric requirement of 3 ppm O2 to 1 ppm BTEX for the aerobicdegradation of fuel hydrocarbons with rates of biodegradation appearing to slow for dissolvedoxygen concentrations below 1 to 2 ppm in microcosm and field studies and below 1 ppm forsoil column studies (Salanitro, 1993; Chiang et. al., 1989). Laboratory studies where 8 mg/Ldissolved oxygen is initially present have been shown to rapidly biodegrade 2 mg/L or less of aBTEX mixture or a particular BTEX compound (Salanitro, 1993).
The majority of studies located for the BTEX compounds were for aquifer environments. Asreported earlier, many aquifers become anaerobic during contaminant biodegradation due to theuse of oxygen in aerobic respiration. Replacement of this oxygen from upgradient of the source,plume edges, infiltration of precipitation, or from vadose or saturated zone recharge is slowerthan its use during aerobic metabolism. Thus, the concentration of oxygen often becomes therate-limiting factor in the biodegradation of the BTEX compounds in aquifer environments. During laboratory studies this can be controlled by the addition of oxygen or hydrogen peroxide.Extrapolation of laboratory rate constants to field environments which are confined or semi-
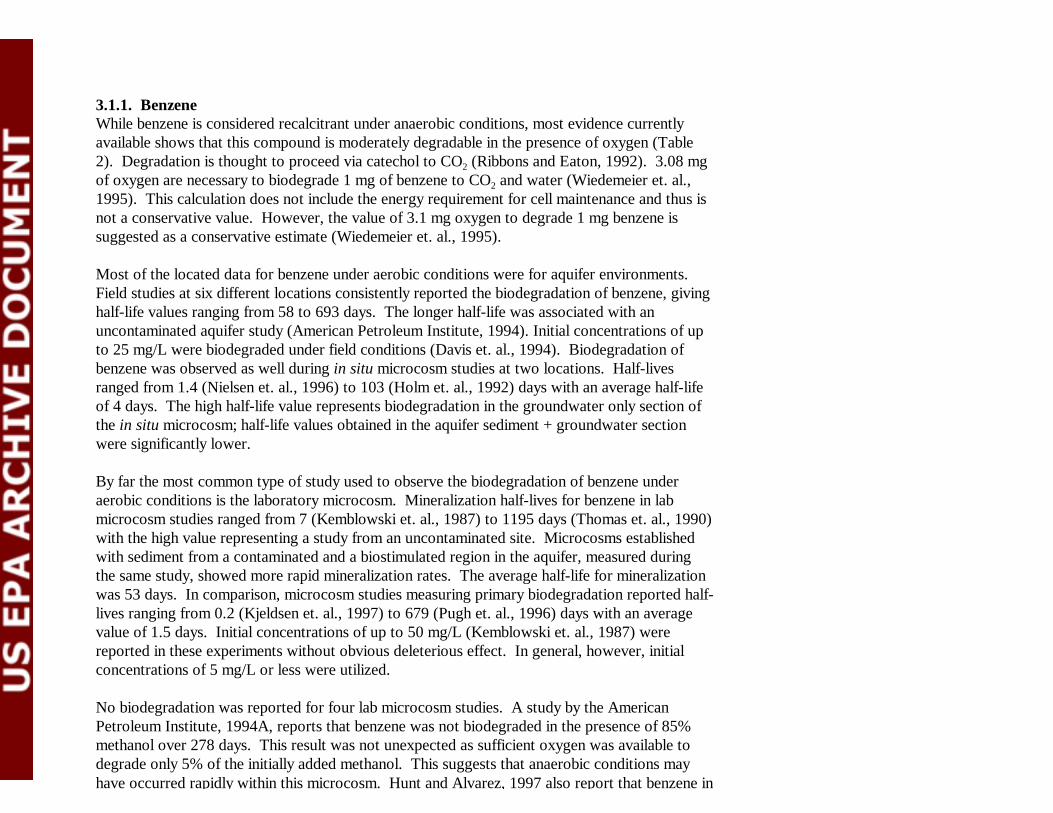
3.1.1. BenzeneWhile benzene is considered recalcitrant under anaerobic conditions, most evidence currentlyavailable shows that this compound is moderately degradable in the presence of oxygen (Table2). Degradation is thought to proceed via catechol to CO2 (Ribbons and Eaton, 1992). 3.08 mgof oxygen are necessary to biodegrade 1 mg of benzene to CO2 and water (Wiedemeier et. al.,1995). This calculation does not include the energy requirement for cell maintenance and thus isnot a conservative value. However, the value of 3.1 mg oxygen to degrade 1 mg benzene issuggested as a conservative estimate (Wiedemeier et. al., 1995).
Most of the located data for benzene under aerobic conditions were for aquifer environments. Field studies at six different locations consistently reported the biodegradation of benzene, givinghalf-life values ranging from 58 to 693 days. The longer half-life was associated with anuncontaminated aquifer study (American Petroleum Institute, 1994). Initial concentrations of upto 25 mg/L were biodegraded under field conditions (Davis et. al., 1994). Biodegradation ofbenzene was observed as well during in situ microcosm studies at two locations. Half-livesranged from 1.4 (Nielsen et. al., 1996) to 103 (Holm et. al., 1992) days with an average half-lifeof 4 days. The high half-life value represents biodegradation in the groundwater only section ofthe in situ microcosm; half-life values obtained in the aquifer sediment + groundwater sectionwere significantly lower.
By far the most common type of study used to observe the biodegradation of benzene underaerobic conditions is the laboratory microcosm. Mineralization half-lives for benzene in labmicrocosm studies ranged from 7 (Kemblowski et. al., 1987) to 1195 days (Thomas et. al., 1990)with the high value representing a study from an uncontaminated site. Microcosms establishedwith sediment from a contaminated and a biostimulated region in the aquifer, measured duringthe same study, showed more rapid mineralization rates. The average half-life for mineralizationwas 53 days. In comparison, microcosm studies measuring primary biodegradation reported half-lives ranging from 0.2 (Kjeldsen et. al., 1997) to 679 (Pugh et. al., 1996) days with an averagevalue of 1.5 days. Initial concentrations of up to 50 mg/L (Kemblowski et. al., 1987) werereported in these experiments without obvious deleterious effect. In general, however, initialconcentrations of 5 mg/L or less were utilized.
No biodegradation was reported for four lab microcosm studies. A study by the AmericanPetroleum Institute, 1994A, reports that benzene was not biodegraded in the presence of 85%methanol over 278 days. This result was not unexpected as sufficient oxygen was available todegrade only 5% of the initially added methanol. This suggests that anaerobic conditions mayhave occurred rapidly within this microcosm. Hunt and Alvarez, 1997 also report that benzene in
0
20
40
60
80
0 0.4 0.8 1.2 1.6 2 2.4 2.8 3.2 3.6
Rate constant (days-1)
Freq
uenc
y
study by Vaishnav and Babeu (1987), it was not biodegraded in the presence of harbor watercollected in Lake Superior. The addition of both nutrients and an enriched microbial cultureisolated from sewage resulted in the biodegradation of this compound indicating that bacteriacapable of biodegrading benzene were either not present or not present in sufficient numbers tosignificantly remove benzene in the natural harbor water over a 20-day period. Laboratorycolumn experiments by Anid et. al. (1991) and Alvarez et. al. (1998) report that benzene was notbiodegraded under certain circumstances. Anid et. al. (1991) reported that columnssupplemented with hydrogen peroxide but not columns supplemented with nitrate were able todegrade benzene. The nitrate-amended columns may have exhibited nitrate-reducing conditionsas over 60 mg/L BTEX mixture was initially added. However, no attempt was made by theauthors to distinguish through end product measurements whether conditions remained aerobicor became nitrate-reducing. Alvarez et. al. (1998) showed biodegradation of benzene inlaboratory columns fed with acetate and benzoate as cosubstrates. However, preacclimatedsediment exposed to acetate and sediment columns which received no preacclimation periodwere unable to biodegrade benzene while a column which had been preacclimated to benzoatereadily biodegraded this column.
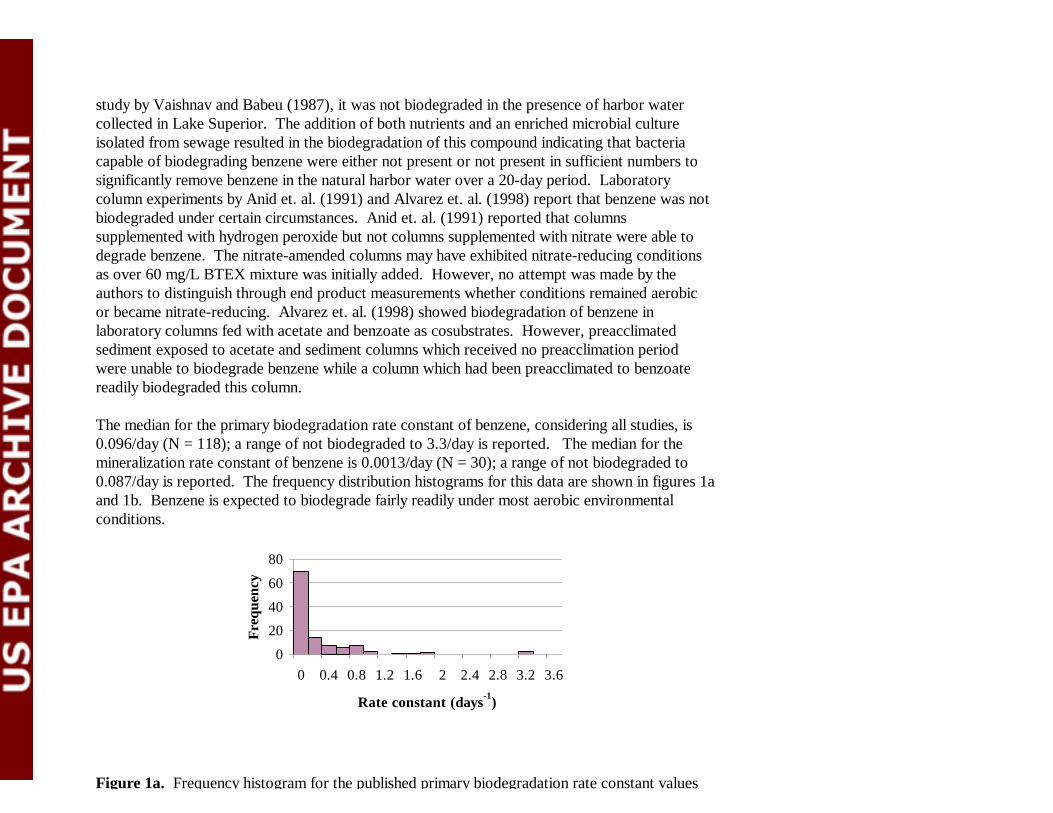
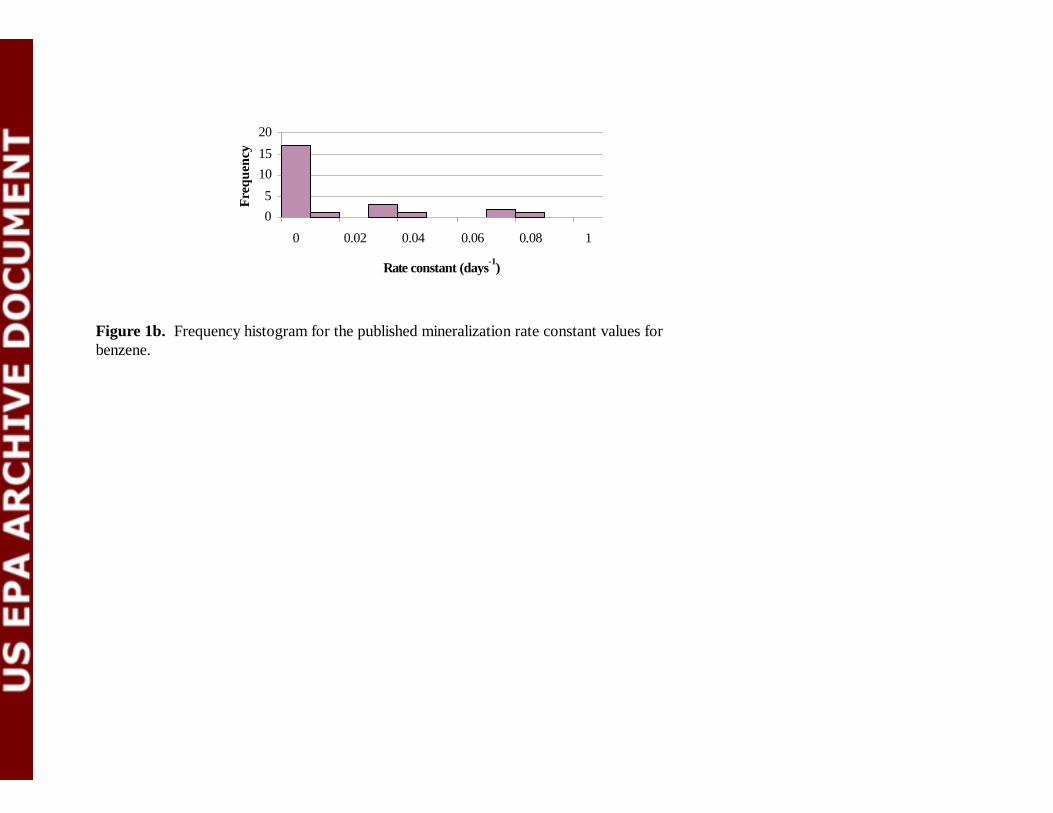
The median for the primary biodegradation rate constant of benzene, considering all studies, is0.096/day (N = 118); a range of not biodegraded to 3.3/day is reported. The median for themineralization rate constant of benzene is 0.0013/day (N = 30); a range of not biodegraded to0.087/day is reported. The frequency distribution histograms for this data are shown in figures 1aand 1b. Benzene is expected to biodegrade fairly readily under most aerobic environmentalconditions.
Figure 1a. Frequency histogram for the published primary biodegradation rate constant values
05
1015
20
0 0.02 0.04 0.06 0.08 1
Rate constant (days-1)
Freq
uenc
y
Figure 1b. Frequency histogram for the published mineralization rate constant values forbenzene.
15
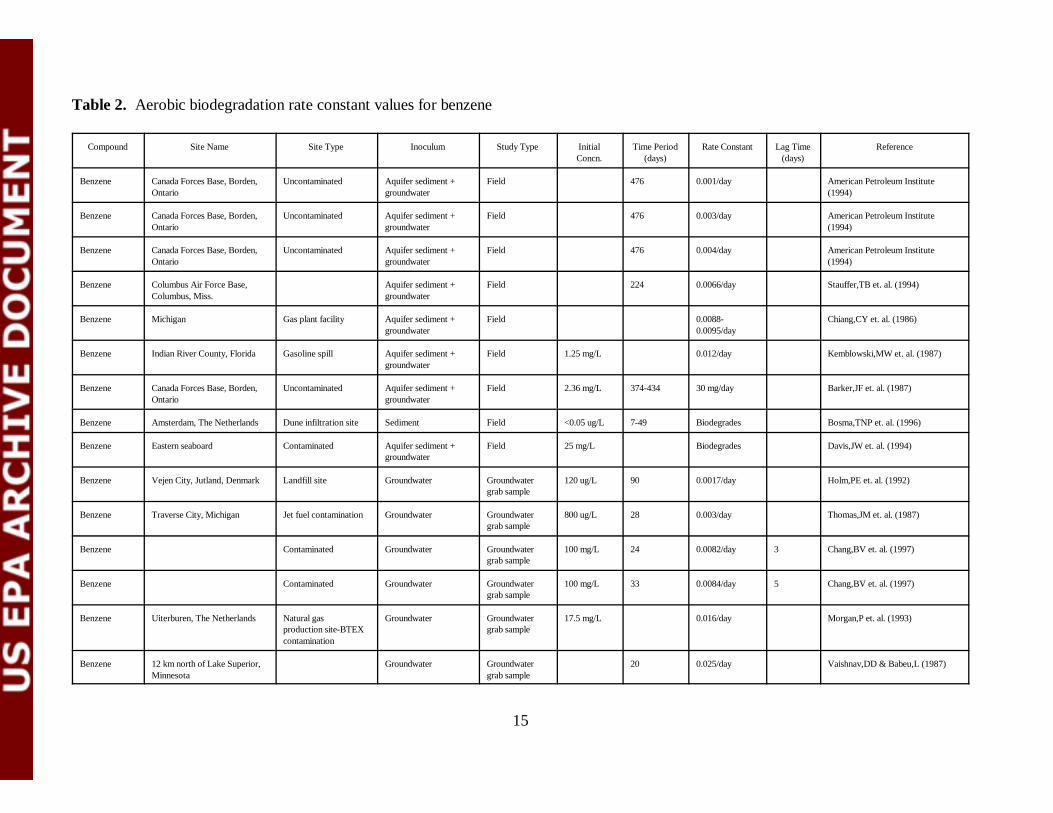
Table 2. Aerobic biodegradation rate constant values for benzene
Compound Site Name Site Type Inoculum Study Type InitialConcn.
Time Period(days)
Rate Constant Lag Time(days)
Reference
Benzene Canada Forces Base, Borden,Ontario
Uncontaminated Aquifer sediment +groundwater
Field 476 0.001/day American Petroleum Institute(1994)
Benzene Canada Forces Base, Borden,Ontario
Uncontaminated Aquifer sediment +groundwater
Field 476 0.003/day American Petroleum Institute(1994)
Benzene Canada Forces Base, Borden,Ontario
Uncontaminated Aquifer sediment +groundwater
Field 476 0.004/day American Petroleum Institute(1994)
Benzene Columbus Air Force Base,Columbus, Miss.
Aquifer sediment +groundwater
Field 224 0.0066/day Stauffer,TB et. al. (1994)
Benzene Michigan Gas plant facility Aquifer sediment +groundwater
Field 0.0088-0.0095/day
Chiang,CY et. al. (1986)
Benzene Indian River County, Florida Gasoline spill Aquifer sediment +groundwater
Field 1.25 mg/L 0.012/day Kemblowski,MW et. al. (1987)
Benzene Canada Forces Base, Borden,Ontario
Uncontaminated Aquifer sediment +groundwater
Field 2.36 mg/L 374-434 30 mg/day Barker,JF et. al. (1987)
Benzene Amsterdam, The Netherlands Dune infiltration site Sediment Field <0.05 ug/L 7-49 Biodegrades Bosma,TNP et. al. (1996)
Benzene Eastern seaboard Contaminated Aquifer sediment +groundwater
Field 25 mg/L Biodegrades Davis,JW et. al. (1994)
Benzene Vejen City, Jutland, Denmark Landfill site Groundwater Groundwatergrab sample
120 ug/L 90 0.0017/day Holm,PE et. al. (1992)
Benzene Traverse City, Michigan Jet fuel contamination Groundwater Groundwatergrab sample
800 ug/L 28 0.003/day Thomas,JM et. al. (1987)
Benzene Contaminated Groundwater Groundwatergrab sample
100 mg/L 24 0.0082/day 3 Chang,BV et. al. (1997)
Benzene Contaminated Groundwater Groundwatergrab sample
100 mg/L 33 0.0084/day 5 Chang,BV et. al. (1997)
Benzene Uiterburen, The Netherlands Natural gasproduction site-BTEXcontamination
Groundwater Groundwatergrab sample
17.5 mg/L 0.016/day Morgan,P et. al. (1993)
Benzene 12 km north of Lake Superior,Minnesota
Groundwater Groundwatergrab sample
20 0.025/day Vaishnav,DD & Babeu,L (1987)
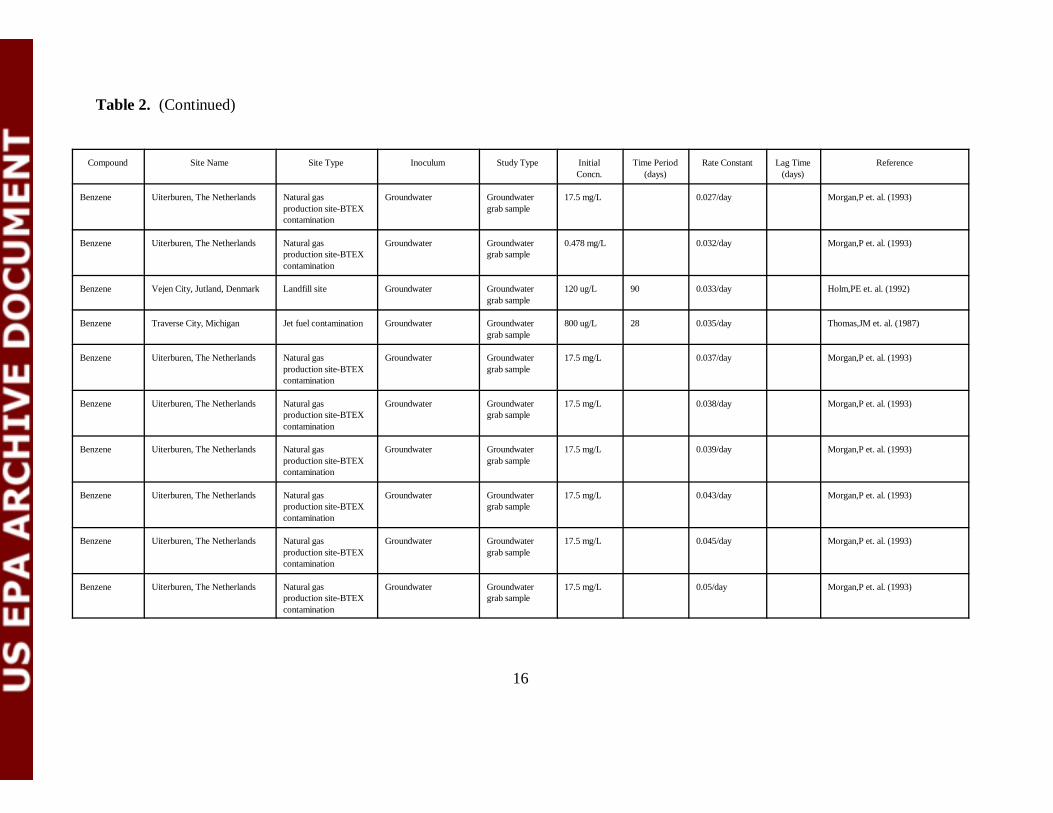
Table 2. (Continued)
Compound Site Name Site Type Inoculum Study Type InitialConcn.
Time Period(days)
Rate Constant Lag Time(days)
Reference
16
Benzene Uiterburen, The Netherlands Natural gasproduction site-BTEXcontamination
Groundwater Groundwatergrab sample
17.5 mg/L 0.027/day Morgan,P et. al. (1993)
Benzene Uiterburen, The Netherlands Natural gasproduction site-BTEXcontamination
Groundwater Groundwatergrab sample
0.478 mg/L 0.032/day Morgan,P et. al. (1993)
Benzene Vejen City, Jutland, Denmark Landfill site Groundwater Groundwatergrab sample
120 ug/L 90 0.033/day Holm,PE et. al. (1992)
Benzene Traverse City, Michigan Jet fuel contamination Groundwater Groundwatergrab sample
800 ug/L 28 0.035/day Thomas,JM et. al. (1987)
Benzene Uiterburen, The Netherlands Natural gasproduction site-BTEXcontamination
Groundwater Groundwatergrab sample
17.5 mg/L 0.037/day Morgan,P et. al. (1993)
Benzene Uiterburen, The Netherlands Natural gasproduction site-BTEXcontamination
Groundwater Groundwatergrab sample
17.5 mg/L 0.038/day Morgan,P et. al. (1993)
Benzene Uiterburen, The Netherlands Natural gasproduction site-BTEXcontamination
Groundwater Groundwatergrab sample
17.5 mg/L 0.039/day Morgan,P et. al. (1993)
Benzene Uiterburen, The Netherlands Natural gasproduction site-BTEXcontamination
Groundwater Groundwatergrab sample
17.5 mg/L 0.043/day Morgan,P et. al. (1993)
Benzene Uiterburen, The Netherlands Natural gasproduction site-BTEXcontamination
Groundwater Groundwatergrab sample
17.5 mg/L 0.045/day Morgan,P et. al. (1993)
Benzene Uiterburen, The Netherlands Natural gasproduction site-BTEXcontamination
Groundwater Groundwatergrab sample
17.5 mg/L 0.05/day Morgan,P et. al. (1993)
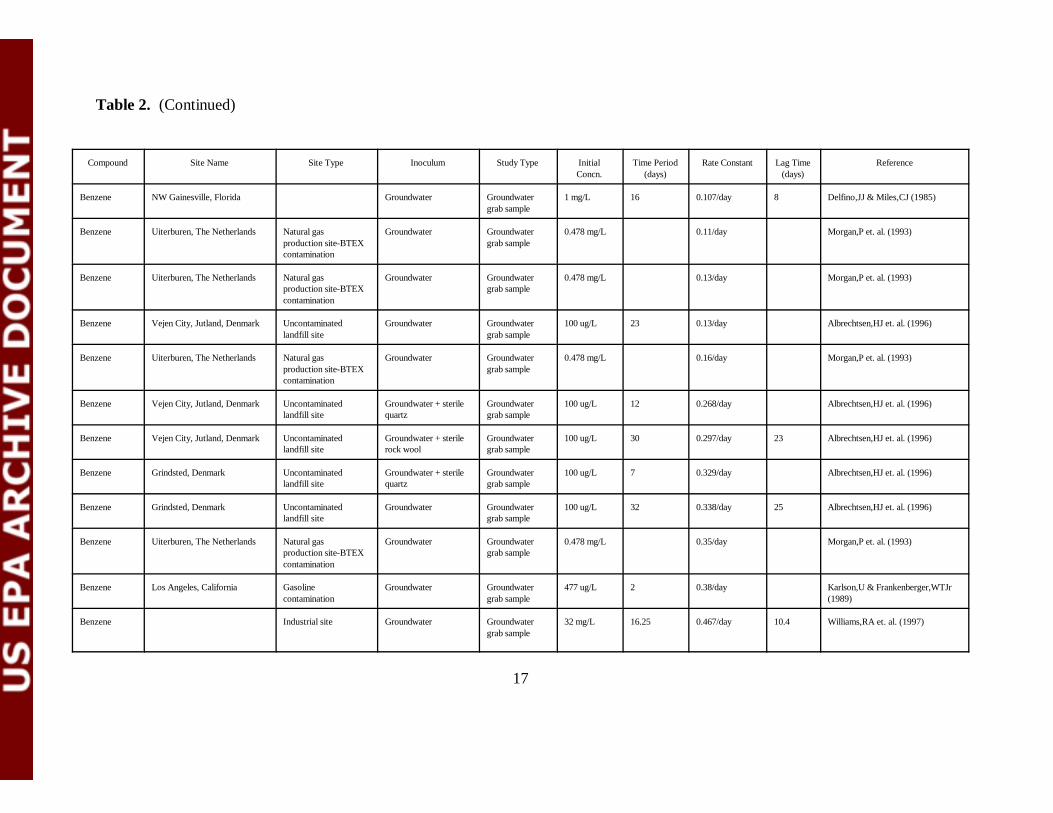
Table 2. (Continued)
Compound Site Name Site Type Inoculum Study Type InitialConcn.
Time Period(days)
Rate Constant Lag Time(days)
Reference
17
Benzene NW Gainesville, Florida Groundwater Groundwatergrab sample
1 mg/L 16 0.107/day 8 Delfino,JJ & Miles,CJ (1985)
Benzene Uiterburen, The Netherlands Natural gasproduction site-BTEXcontamination
Groundwater Groundwatergrab sample
0.478 mg/L 0.11/day Morgan,P et. al. (1993)
Benzene Uiterburen, The Netherlands Natural gasproduction site-BTEXcontamination
Groundwater Groundwatergrab sample
0.478 mg/L 0.13/day Morgan,P et. al. (1993)
Benzene Vejen City, Jutland, Denmark Uncontaminatedlandfill site
Groundwater Groundwatergrab sample
100 ug/L 23 0.13/day Albrechtsen,HJ et. al. (1996)
Benzene Uiterburen, The Netherlands Natural gasproduction site-BTEXcontamination
Groundwater Groundwatergrab sample
0.478 mg/L 0.16/day Morgan,P et. al. (1993)
Benzene Vejen City, Jutland, Denmark Uncontaminatedlandfill site
Groundwater + sterilequartz
Groundwatergrab sample
100 ug/L 12 0.268/day Albrechtsen,HJ et. al. (1996)
Benzene Vejen City, Jutland, Denmark Uncontaminatedlandfill site
Groundwater + sterilerock wool
Groundwatergrab sample
100 ug/L 30 0.297/day 23 Albrechtsen,HJ et. al. (1996)
Benzene Grindsted, Denmark Uncontaminatedlandfill site
Groundwater + sterilequartz
Groundwatergrab sample
100 ug/L 7 0.329/day Albrechtsen,HJ et. al. (1996)
Benzene Grindsted, Denmark Uncontaminatedlandfill site
Groundwater Groundwatergrab sample
100 ug/L 32 0.338/day 25 Albrechtsen,HJ et. al. (1996)
Benzene Uiterburen, The Netherlands Natural gasproduction site-BTEXcontamination
Groundwater Groundwatergrab sample
0.478 mg/L 0.35/day Morgan,P et. al. (1993)
Benzene Los Angeles, California Gasolinecontamination
Groundwater Groundwatergrab sample
477 ug/L 2 0.38/day Karlson,U & Frankenberger,WTJr(1989)
Benzene Industrial site Groundwater Groundwatergrab sample
32 mg/L 16.25 0.467/day 10.4 Williams,RA et. al. (1997)
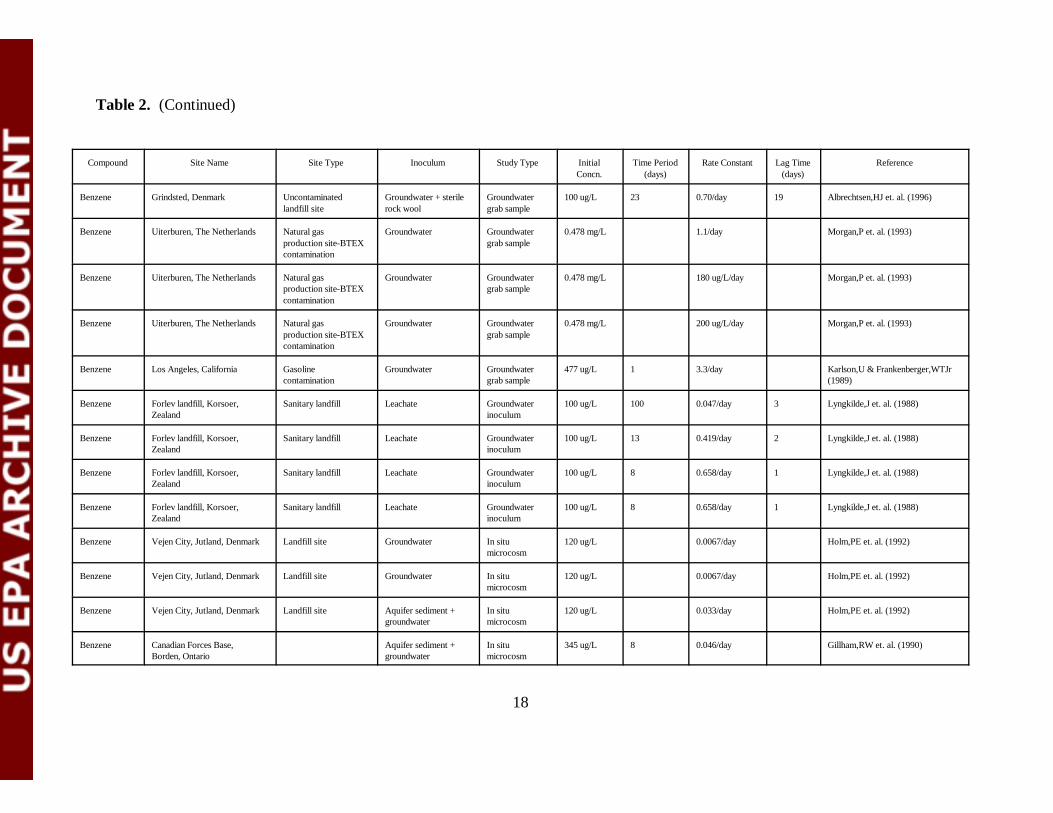
Table 2. (Continued)
Compound Site Name Site Type Inoculum Study Type InitialConcn.
Time Period(days)
Rate Constant Lag Time(days)
Reference
18
Benzene Grindsted, Denmark Uncontaminatedlandfill site
Groundwater + sterilerock wool
Groundwatergrab sample
100 ug/L 23 0.70/day 19 Albrechtsen,HJ et. al. (1996)
Benzene Uiterburen, The Netherlands Natural gasproduction site-BTEXcontamination
Groundwater Groundwatergrab sample
0.478 mg/L 1.1/day Morgan,P et. al. (1993)
Benzene Uiterburen, The Netherlands Natural gasproduction site-BTEXcontamination
Groundwater Groundwatergrab sample
0.478 mg/L 180 ug/L/day Morgan,P et. al. (1993)
Benzene Uiterburen, The Netherlands Natural gasproduction site-BTEXcontamination
Groundwater Groundwatergrab sample
0.478 mg/L 200 ug/L/day Morgan,P et. al. (1993)
Benzene Los Angeles, California Gasolinecontamination
Groundwater Groundwatergrab sample
477 ug/L 1 3.3/day Karlson,U & Frankenberger,WTJr(1989)
Benzene Forlev landfill, Korsoer,Zealand
Sanitary landfill Leachate Groundwaterinoculum
100 ug/L 100 0.047/day 3 Lyngkilde,J et. al. (1988)
Benzene Forlev landfill, Korsoer,Zealand
Sanitary landfill Leachate Groundwaterinoculum
100 ug/L 13 0.419/day 2 Lyngkilde,J et. al. (1988)
Benzene Forlev landfill, Korsoer,Zealand
Sanitary landfill Leachate Groundwaterinoculum
100 ug/L 8 0.658/day 1 Lyngkilde,J et. al. (1988)
Benzene Forlev landfill, Korsoer,Zealand
Sanitary landfill Leachate Groundwaterinoculum
100 ug/L 8 0.658/day 1 Lyngkilde,J et. al. (1988)
Benzene Vejen City, Jutland, Denmark Landfill site Groundwater In situmicrocosm
120 ug/L 0.0067/day Holm,PE et. al. (1992)
Benzene Vejen City, Jutland, Denmark Landfill site Groundwater In situmicrocosm
120 ug/L 0.0067/day Holm,PE et. al. (1992)
Benzene Vejen City, Jutland, Denmark Landfill site Aquifer sediment +groundwater
In situmicrocosm
120 ug/L 0.033/day Holm,PE et. al. (1992)
Benzene Canadian Forces Base,Borden, Ontario
Aquifer sediment +groundwater
In situmicrocosm
345 ug/L 8 0.046/day Gillham,RW et. al. (1990)
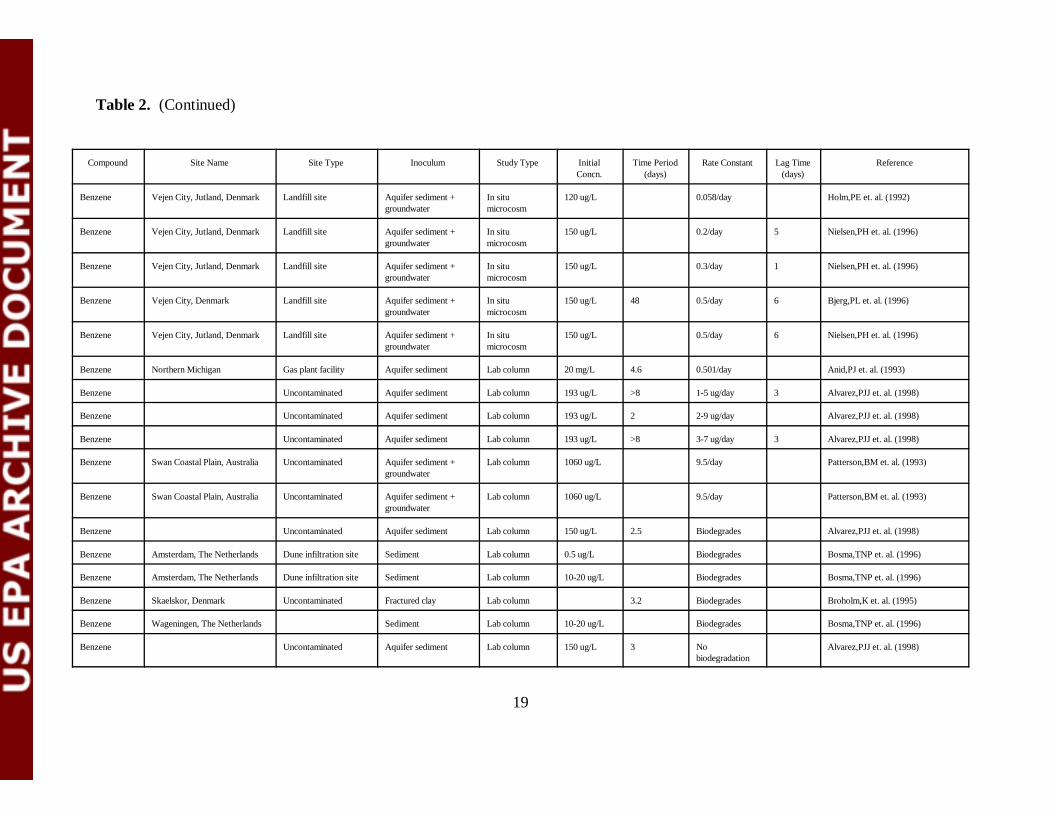
Table 2. (Continued)
Compound Site Name Site Type Inoculum Study Type InitialConcn.
Time Period(days)
Rate Constant Lag Time(days)
Reference
19
Benzene Vejen City, Jutland, Denmark Landfill site Aquifer sediment +groundwater
In situmicrocosm
120 ug/L 0.058/day Holm,PE et. al. (1992)
Benzene Vejen City, Jutland, Denmark Landfill site Aquifer sediment +groundwater
In situmicrocosm
150 ug/L 0.2/day 5 Nielsen,PH et. al. (1996)
Benzene Vejen City, Jutland, Denmark Landfill site Aquifer sediment +groundwater
In situmicrocosm
150 ug/L 0.3/day 1 Nielsen,PH et. al. (1996)
Benzene Vejen City, Denmark Landfill site Aquifer sediment +groundwater
In situmicrocosm
150 ug/L 48 0.5/day 6 Bjerg,PL et. al. (1996)
Benzene Vejen City, Jutland, Denmark Landfill site Aquifer sediment +groundwater
In situmicrocosm
150 ug/L 0.5/day 6 Nielsen,PH et. al. (1996)
Benzene Northern Michigan Gas plant facility Aquifer sediment Lab column 20 mg/L 4.6 0.501/day Anid,PJ et. al. (1993)
Benzene Uncontaminated Aquifer sediment Lab column 193 ug/L >8 1-5 ug/day 3 Alvarez,PJJ et. al. (1998)
Benzene Uncontaminated Aquifer sediment Lab column 193 ug/L 2 2-9 ug/day Alvarez,PJJ et. al. (1998)
Benzene Uncontaminated Aquifer sediment Lab column 193 ug/L >8 3-7 ug/day 3 Alvarez,PJJ et. al. (1998)
Benzene Swan Coastal Plain, Australia Uncontaminated Aquifer sediment +groundwater
Lab column 1060 ug/L 9.5/day Patterson,BM et. al. (1993)
Benzene Swan Coastal Plain, Australia Uncontaminated Aquifer sediment +groundwater
Lab column 1060 ug/L 9.5/day Patterson,BM et. al. (1993)
Benzene Uncontaminated Aquifer sediment Lab column 150 ug/L 2.5 Biodegrades Alvarez,PJJ et. al. (1998)
Benzene Amsterdam, The Netherlands Dune infiltration site Sediment Lab column 0.5 ug/L Biodegrades Bosma,TNP et. al. (1996)
Benzene Amsterdam, The Netherlands Dune infiltration site Sediment Lab column 10-20 ug/L Biodegrades Bosma,TNP et. al. (1996)
Benzene Skaelskor, Denmark Uncontaminated Fractured clay Lab column 3.2 Biodegrades Broholm,K et. al. (1995)
Benzene Wageningen, The Netherlands Sediment Lab column 10-20 ug/L Biodegrades Bosma,TNP et. al. (1996)
Benzene Uncontaminated Aquifer sediment Lab column 150 ug/L 3 Nobiodegradation
Alvarez,PJJ et. al. (1998)
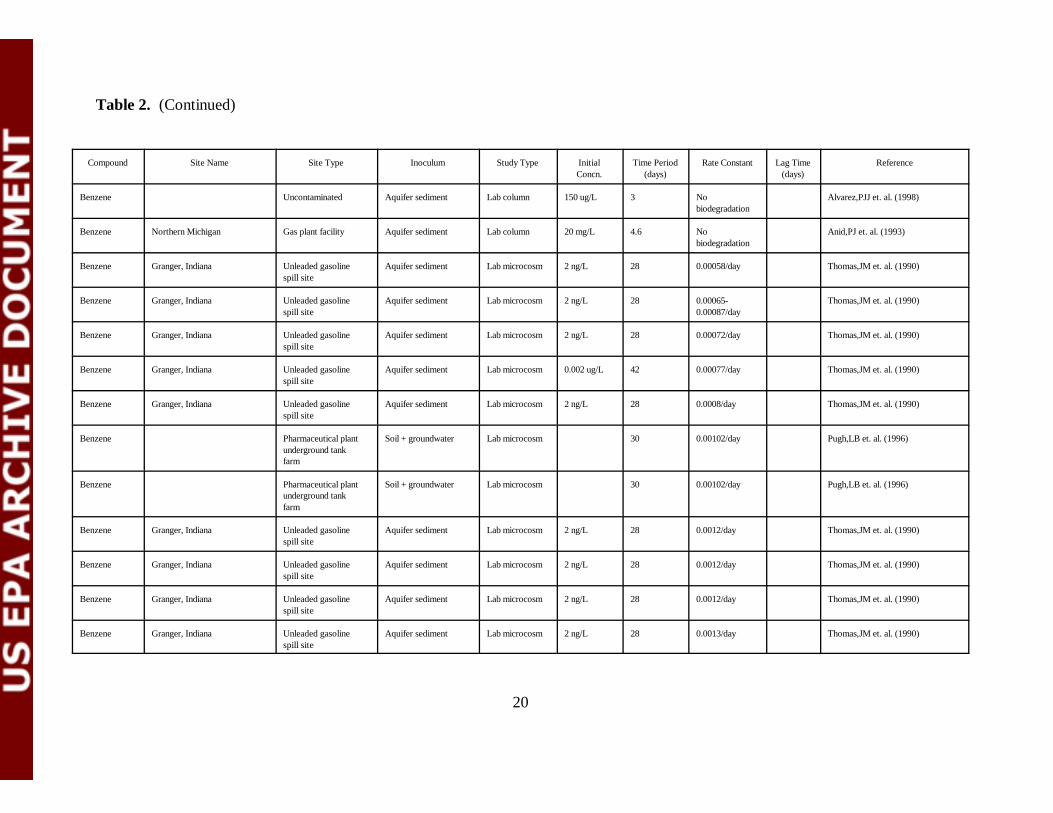
Table 2. (Continued)
Compound Site Name Site Type Inoculum Study Type InitialConcn.
Time Period(days)
Rate Constant Lag Time(days)
Reference
20
Benzene Uncontaminated Aquifer sediment Lab column 150 ug/L 3 Nobiodegradation
Alvarez,PJJ et. al. (1998)
Benzene Northern Michigan Gas plant facility Aquifer sediment Lab column 20 mg/L 4.6 Nobiodegradation
Anid,PJ et. al. (1993)
Benzene Granger, Indiana Unleaded gasolinespill site
Aquifer sediment Lab microcosm 2 ng/L 28 0.00058/day Thomas,JM et. al. (1990)
Benzene Granger, Indiana Unleaded gasolinespill site
Aquifer sediment Lab microcosm 2 ng/L 28 0.00065-0.00087/day
Thomas,JM et. al. (1990)
Benzene Granger, Indiana Unleaded gasolinespill site
Aquifer sediment Lab microcosm 2 ng/L 28 0.00072/day Thomas,JM et. al. (1990)
Benzene Granger, Indiana Unleaded gasolinespill site
Aquifer sediment Lab microcosm 0.002 ug/L 42 0.00077/day Thomas,JM et. al. (1990)
Benzene Granger, Indiana Unleaded gasolinespill site
Aquifer sediment Lab microcosm 2 ng/L 28 0.0008/day Thomas,JM et. al. (1990)
Benzene Pharmaceutical plantunderground tankfarm
Soil + groundwater Lab microcosm 30 0.00102/day Pugh,LB et. al. (1996)
Benzene Pharmaceutical plantunderground tankfarm
Soil + groundwater Lab microcosm 30 0.00102/day Pugh,LB et. al. (1996)
Benzene Granger, Indiana Unleaded gasolinespill site
Aquifer sediment Lab microcosm 2 ng/L 28 0.0012/day Thomas,JM et. al. (1990)
Benzene Granger, Indiana Unleaded gasolinespill site
Aquifer sediment Lab microcosm 2 ng/L 28 0.0012/day Thomas,JM et. al. (1990)
Benzene Granger, Indiana Unleaded gasolinespill site
Aquifer sediment Lab microcosm 2 ng/L 28 0.0012/day Thomas,JM et. al. (1990)
Benzene Granger, Indiana Unleaded gasolinespill site
Aquifer sediment Lab microcosm 2 ng/L 28 0.0013/day Thomas,JM et. al. (1990)
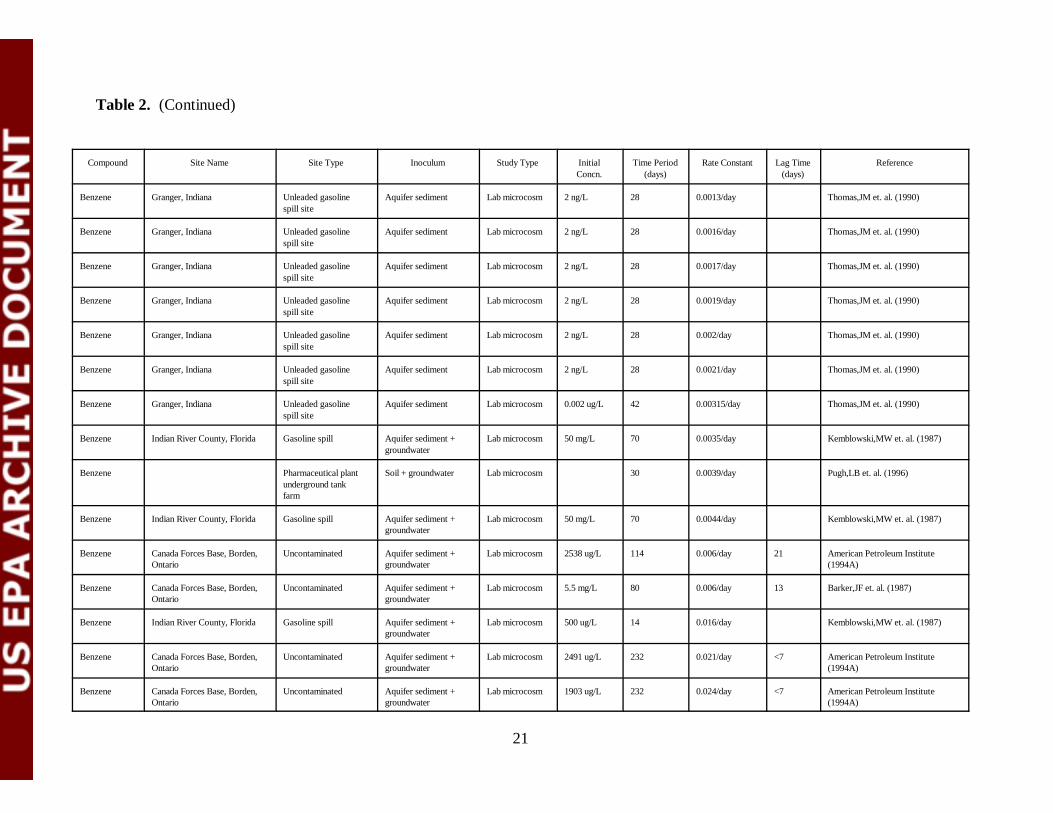
Table 2. (Continued)
Compound Site Name Site Type Inoculum Study Type InitialConcn.
Time Period(days)
Rate Constant Lag Time(days)
Reference
21
Benzene Granger, Indiana Unleaded gasolinespill site
Aquifer sediment Lab microcosm 2 ng/L 28 0.0013/day Thomas,JM et. al. (1990)
Benzene Granger, Indiana Unleaded gasolinespill site
Aquifer sediment Lab microcosm 2 ng/L 28 0.0016/day Thomas,JM et. al. (1990)
Benzene Granger, Indiana Unleaded gasolinespill site
Aquifer sediment Lab microcosm 2 ng/L 28 0.0017/day Thomas,JM et. al. (1990)
Benzene Granger, Indiana Unleaded gasolinespill site
Aquifer sediment Lab microcosm 2 ng/L 28 0.0019/day Thomas,JM et. al. (1990)
Benzene Granger, Indiana Unleaded gasolinespill site
Aquifer sediment Lab microcosm 2 ng/L 28 0.002/day Thomas,JM et. al. (1990)
Benzene Granger, Indiana Unleaded gasolinespill site
Aquifer sediment Lab microcosm 2 ng/L 28 0.0021/day Thomas,JM et. al. (1990)
Benzene Granger, Indiana Unleaded gasolinespill site
Aquifer sediment Lab microcosm 0.002 ug/L 42 0.00315/day Thomas,JM et. al. (1990)
Benzene Indian River County, Florida Gasoline spill Aquifer sediment +groundwater
Lab microcosm 50 mg/L 70 0.0035/day Kemblowski,MW et. al. (1987)
Benzene Pharmaceutical plantunderground tankfarm
Soil + groundwater Lab microcosm 30 0.0039/day Pugh,LB et. al. (1996)
Benzene Indian River County, Florida Gasoline spill Aquifer sediment +groundwater
Lab microcosm 50 mg/L 70 0.0044/day Kemblowski,MW et. al. (1987)
Benzene Canada Forces Base, Borden,Ontario
Uncontaminated Aquifer sediment +groundwater
Lab microcosm 2538 ug/L 114 0.006/day 21 American Petroleum Institute(1994A)
Benzene Canada Forces Base, Borden,Ontario
Uncontaminated Aquifer sediment +groundwater
Lab microcosm 5.5 mg/L 80 0.006/day 13 Barker,JF et. al. (1987)
Benzene Indian River County, Florida Gasoline spill Aquifer sediment +groundwater
Lab microcosm 500 ug/L 14 0.016/day Kemblowski,MW et. al. (1987)
Benzene Canada Forces Base, Borden,Ontario
Uncontaminated Aquifer sediment +groundwater
Lab microcosm 2491 ug/L 232 0.021/day <7 American Petroleum Institute(1994A)
Benzene Canada Forces Base, Borden,Ontario
Uncontaminated Aquifer sediment +groundwater
Lab microcosm 1903 ug/L 232 0.024/day <7 American Petroleum Institute(1994A)
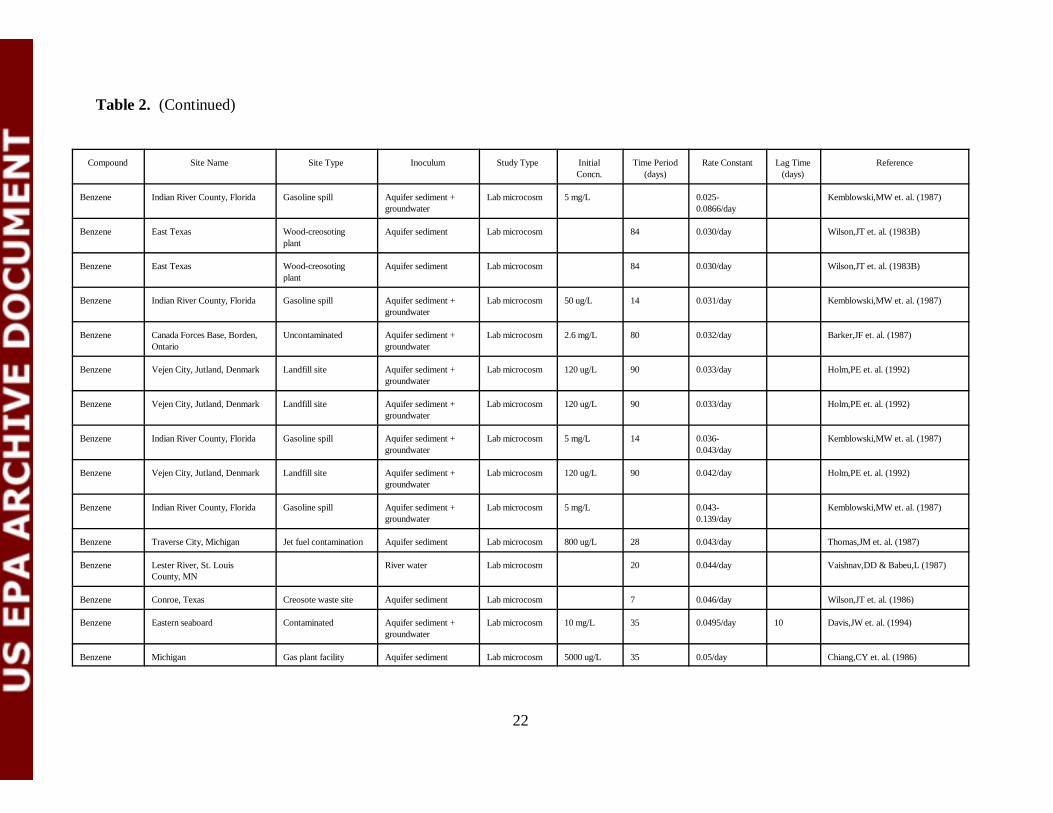
Table 2. (Continued)
Compound Site Name Site Type Inoculum Study Type InitialConcn.
Time Period(days)
Rate Constant Lag Time(days)
Reference
22
Benzene Indian River County, Florida Gasoline spill Aquifer sediment +groundwater
Lab microcosm 5 mg/L 0.025-0.0866/day
Kemblowski,MW et. al. (1987)
Benzene East Texas Wood-creosotingplant
Aquifer sediment Lab microcosm 84 0.030/day Wilson,JT et. al. (1983B)
Benzene East Texas Wood-creosotingplant
Aquifer sediment Lab microcosm 84 0.030/day Wilson,JT et. al. (1983B)
Benzene Indian River County, Florida Gasoline spill Aquifer sediment +groundwater
Lab microcosm 50 ug/L 14 0.031/day Kemblowski,MW et. al. (1987)
Benzene Canada Forces Base, Borden,Ontario
Uncontaminated Aquifer sediment +groundwater
Lab microcosm 2.6 mg/L 80 0.032/day Barker,JF et. al. (1987)
Benzene Vejen City, Jutland, Denmark Landfill site Aquifer sediment +groundwater
Lab microcosm 120 ug/L 90 0.033/day Holm,PE et. al. (1992)
Benzene Vejen City, Jutland, Denmark Landfill site Aquifer sediment +groundwater
Lab microcosm 120 ug/L 90 0.033/day Holm,PE et. al. (1992)
Benzene Indian River County, Florida Gasoline spill Aquifer sediment +groundwater
Lab microcosm 5 mg/L 14 0.036-0.043/day
Kemblowski,MW et. al. (1987)
Benzene Vejen City, Jutland, Denmark Landfill site Aquifer sediment +groundwater
Lab microcosm 120 ug/L 90 0.042/day Holm,PE et. al. (1992)
Benzene Indian River County, Florida Gasoline spill Aquifer sediment +groundwater
Lab microcosm 5 mg/L 0.043-0.139/day
Kemblowski,MW et. al. (1987)
Benzene Traverse City, Michigan Jet fuel contamination Aquifer sediment Lab microcosm 800 ug/L 28 0.043/day Thomas,JM et. al. (1987)
Benzene Lester River, St. LouisCounty, MN
River water Lab microcosm 20 0.044/day Vaishnav,DD & Babeu,L (1987)
Benzene Conroe, Texas Creosote waste site Aquifer sediment Lab microcosm 7 0.046/day Wilson,JT et. al. (1986)
Benzene Eastern seaboard Contaminated Aquifer sediment +groundwater
Lab microcosm 10 mg/L 35 0.0495/day 10 Davis,JW et. al. (1994)
Benzene Michigan Gas plant facility Aquifer sediment Lab microcosm 5000 ug/L 35 0.05/day Chiang,CY et. al. (1986)
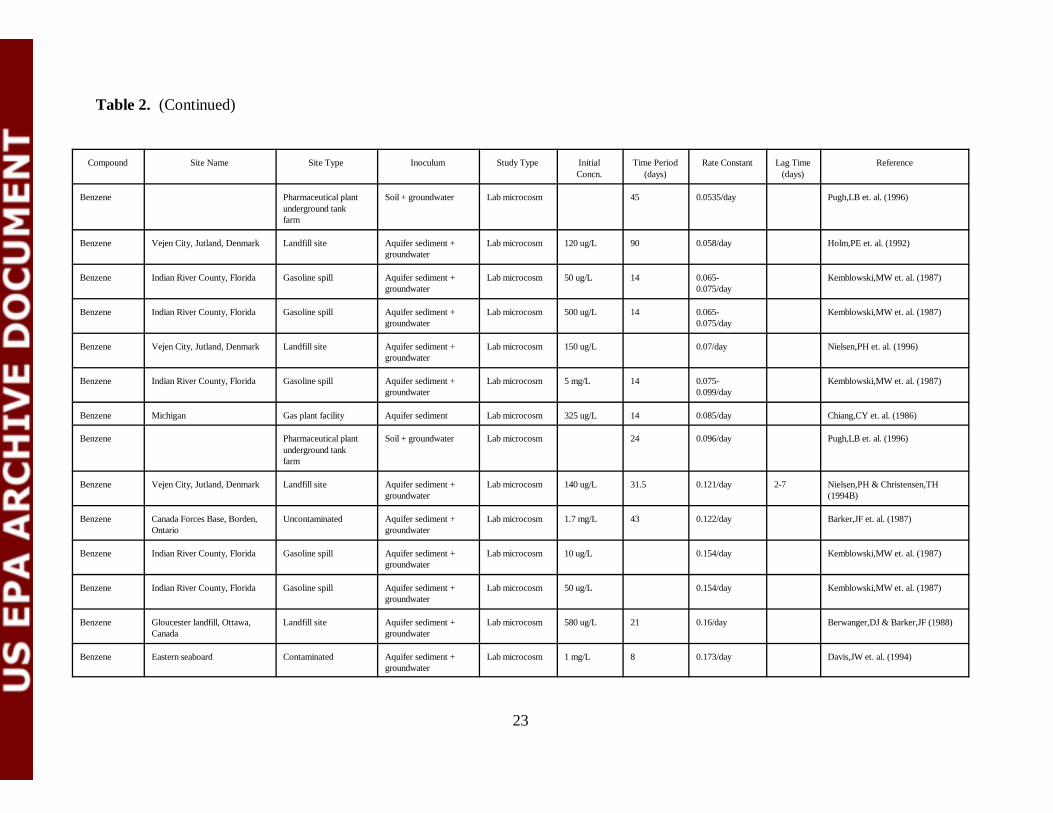
Table 2. (Continued)
Compound Site Name Site Type Inoculum Study Type InitialConcn.
Time Period(days)
Rate Constant Lag Time(days)
Reference
23
Benzene Pharmaceutical plantunderground tankfarm
Soil + groundwater Lab microcosm 45 0.0535/day Pugh,LB et. al. (1996)
Benzene Vejen City, Jutland, Denmark Landfill site Aquifer sediment +groundwater
Lab microcosm 120 ug/L 90 0.058/day Holm,PE et. al. (1992)
Benzene Indian River County, Florida Gasoline spill Aquifer sediment +groundwater
Lab microcosm 50 ug/L 14 0.065-0.075/day
Kemblowski,MW et. al. (1987)
Benzene Indian River County, Florida Gasoline spill Aquifer sediment +groundwater
Lab microcosm 500 ug/L 14 0.065-0.075/day
Kemblowski,MW et. al. (1987)
Benzene Vejen City, Jutland, Denmark Landfill site Aquifer sediment +groundwater
Lab microcosm 150 ug/L 0.07/day Nielsen,PH et. al. (1996)
Benzene Indian River County, Florida Gasoline spill Aquifer sediment +groundwater
Lab microcosm 5 mg/L 14 0.075-0.099/day
Kemblowski,MW et. al. (1987)
Benzene Michigan Gas plant facility Aquifer sediment Lab microcosm 325 ug/L 14 0.085/day Chiang,CY et. al. (1986)
Benzene Pharmaceutical plantunderground tankfarm
Soil + groundwater Lab microcosm 24 0.096/day Pugh,LB et. al. (1996)
Benzene Vejen City, Jutland, Denmark Landfill site Aquifer sediment +groundwater
Lab microcosm 140 ug/L 31.5 0.121/day 2-7 Nielsen,PH & Christensen,TH(1994B)
Benzene Canada Forces Base, Borden,Ontario
Uncontaminated Aquifer sediment +groundwater
Lab microcosm 1.7 mg/L 43 0.122/day Barker,JF et. al. (1987)
Benzene Indian River County, Florida Gasoline spill Aquifer sediment +groundwater
Lab microcosm 10 ug/L 0.154/day Kemblowski,MW et. al. (1987)
Benzene Indian River County, Florida Gasoline spill Aquifer sediment +groundwater
Lab microcosm 50 ug/L 0.154/day Kemblowski,MW et. al. (1987)
Benzene Gloucester landfill, Ottawa,Canada
Landfill site Aquifer sediment +groundwater
Lab microcosm 580 ug/L 21 0.16/day Berwanger,DJ & Barker,JF (1988)
Benzene Eastern seaboard Contaminated Aquifer sediment +groundwater
Lab microcosm 1 mg/L 8 0.173/day Davis,JW et. al. (1994)
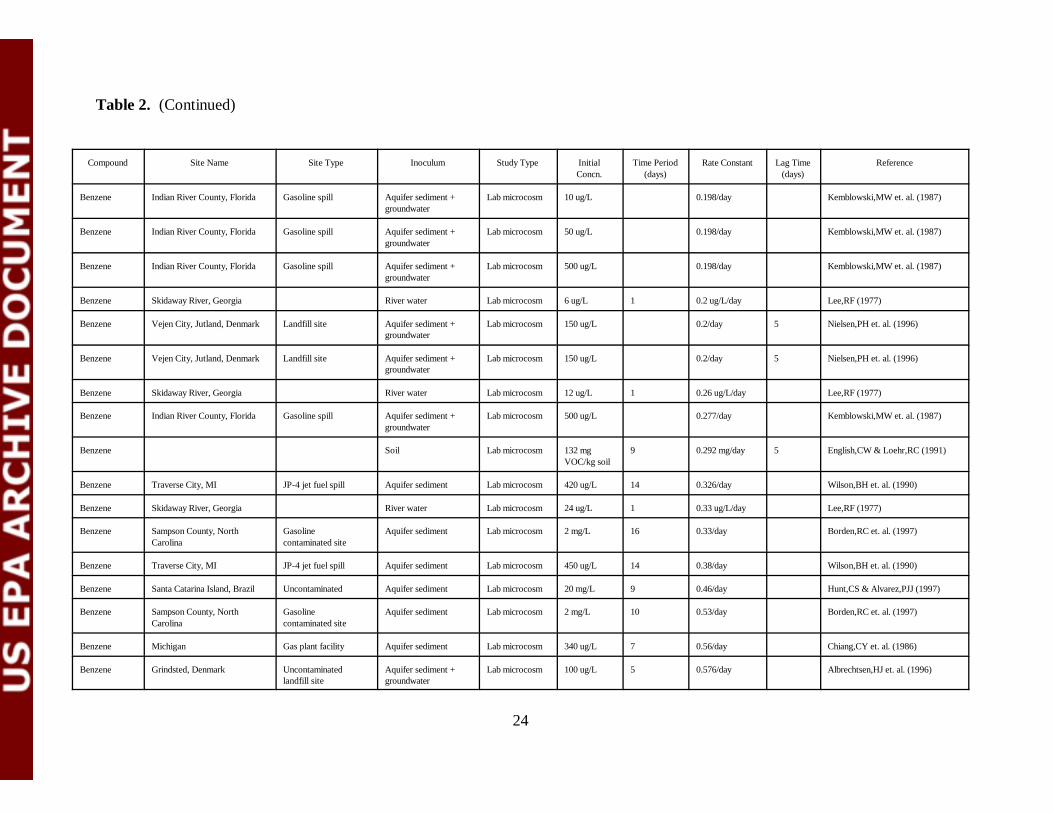
Table 2. (Continued)
Compound Site Name Site Type Inoculum Study Type InitialConcn.
Time Period(days)
Rate Constant Lag Time(days)
Reference
24
Benzene Indian River County, Florida Gasoline spill Aquifer sediment +groundwater
Lab microcosm 10 ug/L 0.198/day Kemblowski,MW et. al. (1987)
Benzene Indian River County, Florida Gasoline spill Aquifer sediment +groundwater
Lab microcosm 50 ug/L 0.198/day Kemblowski,MW et. al. (1987)
Benzene Indian River County, Florida Gasoline spill Aquifer sediment +groundwater
Lab microcosm 500 ug/L 0.198/day Kemblowski,MW et. al. (1987)
Benzene Skidaway River, Georgia River water Lab microcosm 6 ug/L 1 0.2 ug/L/day Lee,RF (1977)
Benzene Vejen City, Jutland, Denmark Landfill site Aquifer sediment +groundwater
Lab microcosm 150 ug/L 0.2/day 5 Nielsen,PH et. al. (1996)
Benzene Vejen City, Jutland, Denmark Landfill site Aquifer sediment +groundwater
Lab microcosm 150 ug/L 0.2/day 5 Nielsen,PH et. al. (1996)
Benzene Skidaway River, Georgia River water Lab microcosm 12 ug/L 1 0.26 ug/L/day Lee,RF (1977)
Benzene Indian River County, Florida Gasoline spill Aquifer sediment +groundwater
Lab microcosm 500 ug/L 0.277/day Kemblowski,MW et. al. (1987)
Benzene Soil Lab microcosm 132 mgVOC/kg soil
9 0.292 mg/day 5 English,CW & Loehr,RC (1991)
Benzene Traverse City, MI JP-4 jet fuel spill Aquifer sediment Lab microcosm 420 ug/L 14 0.326/day Wilson,BH et. al. (1990)
Benzene Skidaway River, Georgia River water Lab microcosm 24 ug/L 1 0.33 ug/L/day Lee,RF (1977)
Benzene Sampson County, NorthCarolina
Gasolinecontaminated site
Aquifer sediment Lab microcosm 2 mg/L 16 0.33/day Borden,RC et. al. (1997)
Benzene Traverse City, MI JP-4 jet fuel spill Aquifer sediment Lab microcosm 450 ug/L 14 0.38/day Wilson,BH et. al. (1990)
Benzene Santa Catarina Island, Brazil Uncontaminated Aquifer sediment Lab microcosm 20 mg/L 9 0.46/day Hunt,CS & Alvarez,PJJ (1997)
Benzene Sampson County, NorthCarolina
Gasolinecontaminated site
Aquifer sediment Lab microcosm 2 mg/L 10 0.53/day Borden,RC et. al. (1997)
Benzene Michigan Gas plant facility Aquifer sediment Lab microcosm 340 ug/L 7 0.56/day Chiang,CY et. al. (1986)
Benzene Grindsted, Denmark Uncontaminatedlandfill site
Aquifer sediment +groundwater
Lab microcosm 100 ug/L 5 0.576/day Albrechtsen,HJ et. al. (1996)
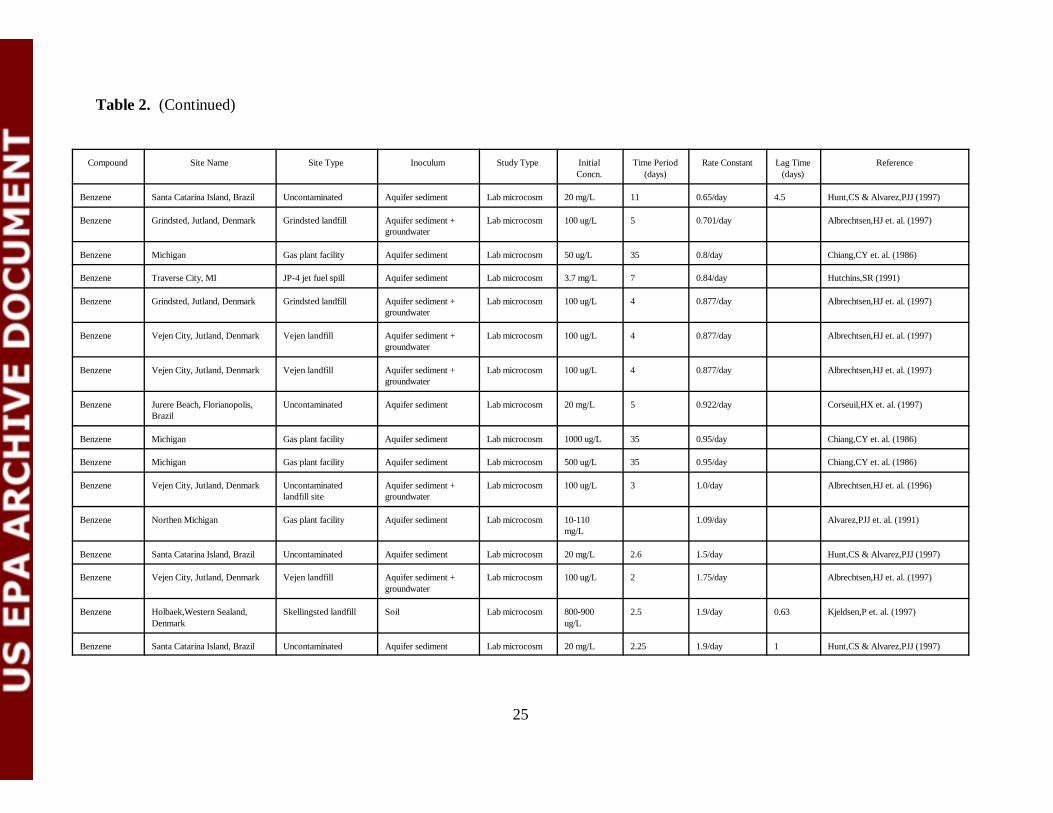
Table 2. (Continued)
Compound Site Name Site Type Inoculum Study Type InitialConcn.
Time Period(days)
Rate Constant Lag Time(days)
Reference
25
Benzene Santa Catarina Island, Brazil Uncontaminated Aquifer sediment Lab microcosm 20 mg/L 11 0.65/day 4.5 Hunt,CS & Alvarez,PJJ (1997)
Benzene Grindsted, Jutland, Denmark Grindsted landfill Aquifer sediment +groundwater
Lab microcosm 100 ug/L 5 0.701/day Albrechtsen,HJ et. al. (1997)
Benzene Michigan Gas plant facility Aquifer sediment Lab microcosm 50 ug/L 35 0.8/day Chiang,CY et. al. (1986)
Benzene Traverse City, MI JP-4 jet fuel spill Aquifer sediment Lab microcosm 3.7 mg/L 7 0.84/day Hutchins,SR (1991)
Benzene Grindsted, Jutland, Denmark Grindsted landfill Aquifer sediment +groundwater
Lab microcosm 100 ug/L 4 0.877/day Albrechtsen,HJ et. al. (1997)
Benzene Vejen City, Jutland, Denmark Vejen landfill Aquifer sediment +groundwater
Lab microcosm 100 ug/L 4 0.877/day Albrechtsen,HJ et. al. (1997)
Benzene Vejen City, Jutland, Denmark Vejen landfill Aquifer sediment +groundwater
Lab microcosm 100 ug/L 4 0.877/day Albrechtsen,HJ et. al. (1997)
Benzene Jurere Beach, Florianopolis,Brazil
Uncontaminated Aquifer sediment Lab microcosm 20 mg/L 5 0.922/day Corseuil,HX et. al. (1997)
Benzene Michigan Gas plant facility Aquifer sediment Lab microcosm 1000 ug/L 35 0.95/day Chiang,CY et. al. (1986)
Benzene Michigan Gas plant facility Aquifer sediment Lab microcosm 500 ug/L 35 0.95/day Chiang,CY et. al. (1986)
Benzene Vejen City, Jutland, Denmark Uncontaminatedlandfill site
Aquifer sediment +groundwater
Lab microcosm 100 ug/L 3 1.0/day Albrechtsen,HJ et. al. (1996)
Benzene Northen Michigan Gas plant facility Aquifer sediment Lab microcosm 10-110mg/L
1.09/day Alvarez,PJJ et. al. (1991)
Benzene Santa Catarina Island, Brazil Uncontaminated Aquifer sediment Lab microcosm 20 mg/L 2.6 1.5/day Hunt,CS & Alvarez,PJJ (1997)
Benzene Vejen City, Jutland, Denmark Vejen landfill Aquifer sediment +groundwater
Lab microcosm 100 ug/L 2 1.75/day Albrechtsen,HJ et. al. (1997)
Benzene Holbaek,Western Sealand,Denmark
Skellingsted landfill Soil Lab microcosm 800-900ug/L
2.5 1.9/day 0.63 Kjeldsen,P et. al. (1997)
Benzene Santa Catarina Island, Brazil Uncontaminated Aquifer sediment Lab microcosm 20 mg/L 2.25 1.9/day 1 Hunt,CS & Alvarez,PJJ (1997)
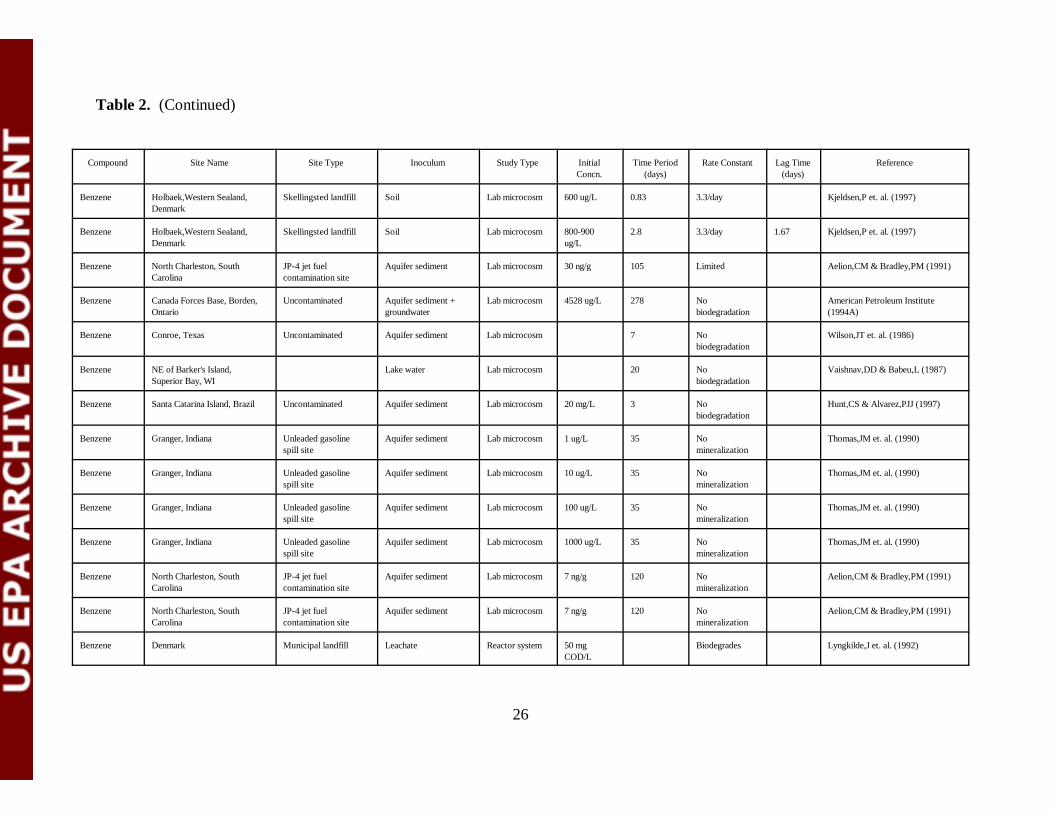
Table 2. (Continued)
Compound Site Name Site Type Inoculum Study Type InitialConcn.
Time Period(days)
Rate Constant Lag Time(days)
Reference
26
Benzene Holbaek,Western Sealand,Denmark
Skellingsted landfill Soil Lab microcosm 600 ug/L 0.83 3.3/day Kjeldsen,P et. al. (1997)
Benzene Holbaek,Western Sealand,Denmark
Skellingsted landfill Soil Lab microcosm 800-900ug/L
2.8 3.3/day 1.67 Kjeldsen,P et. al. (1997)
Benzene North Charleston, SouthCarolina
JP-4 jet fuelcontamination site
Aquifer sediment Lab microcosm 30 ng/g 105 Limited Aelion,CM & Bradley,PM (1991)
Benzene Canada Forces Base, Borden,Ontario
Uncontaminated Aquifer sediment +groundwater
Lab microcosm 4528 ug/L 278 Nobiodegradation
American Petroleum Institute(1994A)
Benzene Conroe, Texas Uncontaminated Aquifer sediment Lab microcosm 7 Nobiodegradation
Wilson,JT et. al. (1986)
Benzene NE of Barker's Island,Superior Bay, WI
Lake water Lab microcosm 20 Nobiodegradation
Vaishnav,DD & Babeu,L (1987)
Benzene Santa Catarina Island, Brazil Uncontaminated Aquifer sediment Lab microcosm 20 mg/L 3 Nobiodegradation
Hunt,CS & Alvarez,PJJ (1997)
Benzene Granger, Indiana Unleaded gasolinespill site
Aquifer sediment Lab microcosm 1 ug/L 35 Nomineralization
Thomas,JM et. al. (1990)
Benzene Granger, Indiana Unleaded gasolinespill site
Aquifer sediment Lab microcosm 10 ug/L 35 Nomineralization
Thomas,JM et. al. (1990)
Benzene Granger, Indiana Unleaded gasolinespill site
Aquifer sediment Lab microcosm 100 ug/L 35 Nomineralization
Thomas,JM et. al. (1990)
Benzene Granger, Indiana Unleaded gasolinespill site
Aquifer sediment Lab microcosm 1000 ug/L 35 Nomineralization
Thomas,JM et. al. (1990)
Benzene North Charleston, SouthCarolina
JP-4 jet fuelcontamination site
Aquifer sediment Lab microcosm 7 ng/g 120 Nomineralization
Aelion,CM & Bradley,PM (1991)
Benzene North Charleston, SouthCarolina
JP-4 jet fuelcontamination site
Aquifer sediment Lab microcosm 7 ng/g 120 Nomineralization
Aelion,CM & Bradley,PM (1991)
Benzene Denmark Municipal landfill Leachate Reactor system 50 mgCOD/L
Biodegrades Lyngkilde,J et. al. (1992)