Embed Size (px)
Citation preview

© 2019 IBRACON
Volume 12, Number 6 (December 2019) p. 1353 – 1382 • ISSN 1983-4195http://dx.doi.org/10.1590/S1983-41952019000600008
Aerodynamic effects on a high slenderness concrete chimney
Efeitos aerodinâmicos em uma chaminé de concreto armado de elevada esbeltez
a Universidade Federal do Rio Grande do Sul, Laboratório de Aerodinâmica das Construções, Porto Alegre, RS, Brasil;b Vento-S Consultoria em Engenharia do Vento Ltda., Porto Alegre, RS, Brasil.
Received: 11 Jan 2018 • Accepted: 30 Jul 2018 • Available Online:
This is an open-access article distributed under the terms of the Creative Commons Attribution License
A. M. LOREDO-SOUZA a
[email protected] https://orcid.org/0000-0002-6648-8315
M. M. ROCHA a
[email protected]://orcid.org/0000-0001-5640-1020
M. G. K. OLIVEIRA b
[email protected]://orcid.org/0000-0001-8014-9160
P. GRALA a
[email protected]://orcid.org/0000-0001-8570-6683
Abstract
Resumo
This paper presents the results of a theoretical-experimental study on the aerodynamic behavior of a 150m high, slenderness 30, concrete chim-ney. For the wind tunnel tests two scaled models were built: one rigid for the measurement of the external pressures, and other aeroelastic, in which the main dynamic characteristics of the real structure were reproduced. The dynamic response under atmospheric turbulence (along-wind direction) is described in the paper and is compatible with the methodology of the Brazilian wind code NBR-6123. A brief analysis of the transversal response due to vortex shedding is presented according to the Canadian Wind Code NBCC. It is observed that, due to the low frequency of the structure, the dynamic approach leads to results significantly larger than those obtained from applying the conventional static approach of gust wind speed. The presence of the neighborhood have increased the loads on the structures.
Keywords: wind, chimneys, dynamic response, wind tunnel, aeroelastic modeling.
Este trabalho apresenta os resultados da determinação teórico-experimental do comportamento aerodinâmico de uma chaminé esbelta de concreto armado, com 150m de altura e esbeltez 30. Foram construídos dois modelos reduzidos: um rígido para medição das pressões e outro aeroelástico, reproduzindo as principais características dinâmicas da estrutura real. A resposta dinâmica à turbulência atmosférica é descrita no trabalho, compatível com a metodologia da NBR-6123. Também é apresentada uma análise da resposta transversal ao desprendimento de vórtices, segundo o método da Norma Canadense NBCC. Devido à baixa frequência fundamental da estrutura, o método dinâmico conduz a esforços significativamente maiores do que aqueles obtidos com o método estático convencional de velocidade de rajada. Observa-se também que a presença da vizinhança influenciou negativamente os resultados, majorando os esforços atuantes nas estruturas.
Palavras-chave: vento, chaminés, resposta dinâmica, túnel de vento, modelagem aeroelástica.

1354 IBRACON Structures and Materials Journal • 2019 • vol. 12 • nº 6
Aerodynamic effects on a high slenderness concrete chimney
1. Introduction
For the proper design of slender chimneys of reinforced concrete is of fundamental importance the correct knowledge of the behavior of the structure under the action of the wind. This occurs in two stages: the first is related to the consideration of the static wind effects on the structure, taking into account the aerodynamic pe-culiarities of this type of building; the second stage refers to the consideration of the dynamic effects, being the dynamic charac-teristics of the structure fundamental in determining its response to the wind action.The notion that a slender structure has a predominantly dynam-ic behavior and responds to the fluctuality forces due to atmo-spheric turbulence and vortex shedding is relatively recent and has been considered in normative codes only since 1970. Prior to this, towers and buildings were designed as rigid structures. Dynamic amplifications, hitherto disregarded, were masked and suppressed by the generous safety factors considered in design. However, due to the increase in slenderness and the search for economy, problems associated with dynamic effects became more evident (Daly [1]).The study of transverse vibrations on bluff bodies is quite com-plicated because it involves the interaction between complex top-ics of fluid and structural mechanics, such as flow around non-aerodynamic bodies and the full range of factors that interfere in the response of this type of structure. These consist of the distri-bution of medium and fluctuating pressures, surface roughness, flow turbulence, tridimensionality effects, and finally, fluid-structure interaction. In addition, one must consider the variation of the wind speed with height and the existence of forces resulting from the movement of the structure.Although this type of structure is considered simple from the structural and aerodynamic viewpoints, reliable determination of response is one of the most complicated Wind Engineering prob-lems. Several researchers have been studying these phenomena over the years, seeking an approach that unites all the topics that involve the mechanism of vibration by vortex shedding. However, despite the efforts, the existing models for verification of structure response are empirical. Currently, there are some models and methods for dimensioning circular section structures subjected to vortex shedding phenomenon, but with many limitations. In the case of square and rectangular sections, the methodologies are even more scarce.The first two most accepted models by the Wind Engineering com-munity in the case of the circular section were developed in the 1980’s. The first model (Vickery and Basu [2], [3], [4], Basu and Vickery [5]), was developed at the University of Western Ontario, Canada, and considers the effects of fluid-structure interaction, in-corporating the concept of negative aerodynamic damping. The second model (Ruscheweyh, [6]), developed at the University of Aachen, Germany, considers that equivalent forces due to vortex shedding occur at a given correlation length. Both models were used as basis for several normative procedures.Although they are empirical models and full of inconsistencies, the research in relation to the circular section practically stopped in the last years, being more studied the phenomenon of vortex detach-ment in structures of square and rectangular section, particularly
for presenting a more predictable aerodynamic behavior. Bênia [7] studied the effects of the influence of 18 different neighborhoods on rectangular buildings, observing their transverse, torsional and longitudinal responses. Tamura et al. [8] presented characteristics of the correlations of the components of the wind forces in build-ings, trajectories of buildings in the plane, and combinations of loads. Mannini et al. [9] studied the interaction between vortex and gallop-induced vibrations in rectangular structures, concluding that the rectangular section most prone to dynamic effects is 3/2. Dong-mei et al. [10] made an aerodynamic and an aeroelastic analysis of the effects of interference on tall buildings, more specifically a case study of the Shanghai World Financial Center, the seventh-tallest building in the world, at an elevation of 492 m.This work aims to bring to the scientific community a contribution aimed at filling the existing gap in the knowledge regarding wind-structure interaction for circular sections. For that, a theoretical-ex-perimental study of the aerodynamic behavior of a slender, 150m high, reinforced concrete chimney, already built in Brazil, was de-veloped. Extensive wind tunnel tests were performed, as well as a theoretical analysis with methodologies available in the specialized literature. 2. Wind action on chimneys
2.1 Static wind action
The wind load usually applied to chimneys is based on data available in technical standards, such as NBR-6123 (ABNT [11]), Canadian Standard (NBCC [12]), Eurocode [13] and CICIND [14] for cylinders of constant circular cross-section, being adapted to the geometric forms of the structure under study. Moreover, it does not consider the surrounding effects due to the proximity of neighboring buildings,
Figure 1Flow characteristic regimes around cylinders. The Re values are illustrative only (Blessmann [15])

1355IBRACON Structures and Materials Journal • 2019 • vol. 12 • nº 6
A. M. LOREDO-SOUZA | M. M. ROCHA | M. G. K. OLIVEIRA | P. GRALA
which would lead to aerodynamic coefficients different from those usually adopted for isolated buildings and simple geometric forms.
2.1.1 Aerodynamics of chimneys
Circular cylinders, as well as all bodies composed of curved surfac-es, are highly sensitive to the parameter called Reynolds number, which influences the shape of the flow and, consequently, the pres-sures distribution and the forces exerted on the solid immersed in the flow. The Reynolds number, Re, expresses the relationship between inertia and viscosity forces acting on the flow, and can be written according to Equation 1:
(1)
Where:V = mean wind speed (m/s)d = characteristic dimension (m)ν = kinematic viscosity of air (m2/s)The effect of the variation of the drag coefficient, Ca, with Re for a circular section cylinder is indicated qualitatively in Figure 1 (Bless-mann [15]). The definition for Ca adopted in this work is given be-low. It is interesting to note that in some cases larger forces may result from smaller velocities, depending on the value of Ca.The drag coefficient is defined according to Equation 2:
(2)
Where:Fa = average drag force (N);
= dynamic pressure corresponding to the mean reference wind velocity (N/m2);ρ = air density (kg/m3);V = mean wind velocity at the level of the average portion of the section under analysis (m/s);Ae = effective reference area (m2). It is observed that the physical characteristics of the flow around circular cylinders change continuously with the value of Re. How-ever, for Re> 104, it is possible to distinguish some regimes where the characteristics of the flow can be considered constant. These regimes (subcritical, critical, supercritical and ultra-critical) are de-fined in Figure 1.In the subcritical regime, in uniform and smooth flow around nomi-nally smooth two-dimensional cylinders, the flow in the boundary layer is always laminar. The laminar separation occurs at about 75° from the stagnation line. Vortex shedding is extremely regular and orderly (strong Kármán vortices), and the wide wake causes a high Ca, which has a characteristic value of 1.2. In this range most of the aerodynamic parameters tend to remain constant. The separated boundary layer becomes turbulent (laminar to turbulent transition) at some distance beyond the separation line.As the Reynolds number increases, the transition in the boundary layer occurs more and more closely to the separation line (which moves further to leeward), until, when sufficiently close, a turbulent reattachment occurs. This region of laminar separation and turbulent reattachment is known as the separation bubble and characterizes
the critical regime. More to leeward a turbulent separation definitely occurs, but initially the wake is much smaller. This leads to a drastic drop in the drag coefficient which can reach values as low as 0.2 and 0.3, with the corresponding Reynolds number being called the critical Reynolds number, Recrit. The formation of the bubble may not occur simultaneously in both the sides of the cylinder.In the supercritical regime the turbulent separation moves wind-ward, the separation bubble decreases and finally disappears giv-ing rise to a definitive and turbulent separation. The wake enlarges, the drag coefficient increases, and the regular detachment of vor-tices, which at the beginning of the interval may not be discern-ible, reappears at the end of the interval yet still with little intensity (weak Karman vortices).Finally, in the ultra-critical regime, the vortex detachment is rees-tablished distinctly (strong Kármán vortices), and the boundary layer transition continues to move more and more windward, but the position of the separation line, the width of the wake and other flow characteristics appear to tend asymptotically to a condition of independence with respect to the Reynolds number. As shown in Figure 1 a characteristic value for Ca in this regimen is 0.6.In Figure 2 the circumferential distribution curves of the external pressure coefficients around circular cylinders are shown, where the distribution of the pressure coefficients obtained by Roshko [16] is characteristic of the ultra-critical regime (a), the Flachsbart curve [17] represents the critical regime (b), whereas the curve obtained by Fage and Falkner [18] has characteristics of the sub-critical regime (c).A common feature of experiments with circular cylinders subject-ed to turbulent flow is the tendency to transition from regimens to
Figure 2Circumferential distribution of pressure coefficients in circular cylinders (Roshko [16])

1356 IBRACON Structures and Materials Journal • 2019 • vol. 12 • nº 6
Aerodynamic effects on a high slenderness concrete chimney
smaller Reynolds numbers in relation to smooth or less turbulent flows. This feature complicates the interpretation of the aerodynamic coefficients, since a variation of the magnitude of this coefficient can only represent a variation in the Reynolds number. Both the rough-ness of the surface of the element under study and the turbulence of the incident flow can cause changes in the Ca x Re curve as shown in Figures 3 (Blessmann [15]), 4 and 5 (Scruton [19]). Therefore, extrapolations of data obtained for specific curved surfaces, such as chimneys, pipes, towers or roofs, are not recommended.The Brazilian standard NBR-6123 (ABNT [11]) provides, in Table
10, values for drag coefficients for bodies of constant circular cross-section, without considering the variation of the section along the height of a part of the chimney, nor the presence of existing details such as pipes, platforms, etc. In addition, there is no specific in-formation regarding aerodynamic coefficients for these structures with consideration of the effects of the existing surroundings.The vast majority of data on aerodynamic coefficients is obtained through experiments in which the cylinder extends over the entire width or height of the wind tunnel or in cylinders with end plates. Under these conditions, the magnitude of the coefficients is essen-tially constant over the entire length of the cylinder. However, when the cylinder has a free end the flow is disturbed by considerably affecting the magnitude of the drag coefficients. In other words, the top of the finite cylinder introduces three-dimensional effects in the flow, as it escapes through the top and sides. The intensity
Figure 3Rough long cylinders. Influence of increased roughness and flow turbulence (Blessmann [15])
Figure 4Values of Ca as a function of Re for different turbulence intensities I1 (Scruton [19])
Figure 5Influence of the Reynolds number variation on the drag coefficient according to the cross-sectional shape. The numbers 1, 2 and 3 in the last figure represent different (and increasing) roughnesses of the circular section surface and have similar effect to a variation of the turbulence in the incident flow (Scruton [19])

1357IBRACON Structures and Materials Journal • 2019 • vol. 12 • nº 6
A. M. LOREDO-SOUZA | M. M. ROCHA | M. G. K. OLIVEIRA | P. GRALA
with which these effects occur depends on the pressure difference between the windward and leeward faces of the cylinder. From this flow near the free edge and the sides of the cylinder, two stationary vortices are generated at a vertical distance approximately half a diameter from the top (Okamoto and Yagita [20]).Figure 6 shows the variation of the local drag coefficient with the height (Cook [21], Gould et al., [22] and Basu [23]). In both registers this variation is provided for different slendernesses (λ = h/d), in uniform and smooth flow at different Re (h corresponds to cylinder height).Another factor to be considered in any structure is the effect of Kár-mán’s vortices, which have shedding frequencies directly related to the flow velocity. This alternating detachment of vortices generates forces perpendicular to the direction of the average wind causing transverse movements of the structure. If this excitation frequency coincides with one of the natural frequencies of the structure, it may resonate and, depending on the value of the structural damp-ing, unacceptable values of displacements, either from a structural or service point of view, may occur.
2.1.2 Aerodynamic coefficients
From the records of the time series of the pressures obtained in wind tunnel tests, the coefficients of external pressure in the faces of the model, defined by, respectively, the mean pressure coefficient (Equation 3), the rms pressure coefficient (Equation 4 ), maximum pressure coefficient (Equation 5) and minimum pressure coefficient (Equation 6).
(3)
(4)
(5)
(6)
Where:p(t) = instantaneous pressure on the surface of the building mea-sured in relation to the static reference pressure (N/m2);
= mean value of p(t) for the sampling period T (N/m2);pmax = maximum value of p(t) for the sampling period T (N/m2);pmin = minimum value of p(t) for the sampling period T (N/m2);t = time (s);T = sampling period (s).The following sign convention is adopted:n positive coefficients: pressure (+) n negative coefficients: suction (-) The calculated mean pressure coefficients allow the determination of external shape coefficients (C), applicable to a flat surface of area A, defined by:
(7)
Where F is the perpendicular force (resulting from external pres-sures) on a flat surface (N). According to Equation 3, we have:
(8)
Substituting in Equation 7:
(9)
This last expression allows the obtaining of C from, by numerical integration. The mean pressures are integrated to provide mean values of the drag and lift forces. The drag coefficients correspond to the forces in the wind direction, whereas the lift coefficients cor-respond to the forces perpendicular to the direction of the wind. The drag coefficient (Ca) is defined in Equation 2 and the lift coef-ficient (CL) is defined as:
(10)
Where:Fs = average sustainable force (N);Aref = reference area (m2).
2.2 Dynamic response in the wind direction
The analysis methodology presented in this section is compatible with the dynamic method presented in Chapter 9 of NBR-6123. The same models (mathematical functions) are used for the wind speed spectral density and for its correlation structure dependent on frequency (coherence function). The dynamic response is cal-culated using the modal superposition method.
Figure 6Local drag coeficiente Ca as a function of the distance measured from the top, in diameters, for different slendernesses λ (Cook [21]; Gould et al. [22]; Basu [23])

1358 IBRACON Structures and Materials Journal • 2019 • vol. 12 • nº 6
Aerodynamic effects on a high slenderness concrete chimney
2.2.1 Calculation of aerodynamic forces
The dynamic force exerted by the wind in a given pressure integra-tion zone, with exposure area A and associated drag coefficient Ca, is given (with units in S.I.) by:
(11)
The wind velocity V (t) can be subdivided into a mean component over T seconds, and a fluctuating component:
(12)
and consequently its square turns out to be:
(13)
The approximation is possible because the magnitude of the fluc-tuating component is significantly smaller than that of the mean component. Consequently, the dynamic force can also be divided into an mean and a fluctuating component as:
(14)
(15)
(16)
The mean wind speed profile depends on the average time, T, and NBR-6123 adopts a potential law:
(17)
where z is the height from the ground surface (in meters), with 10m being the reference height. The other parameters are given in Table 1 for T = 10min, which is the average time adopted in the dynamic method of the Brazilian standard. If there was no dynamic amplification in the structural response, the static calculation of the code could be used, applying directly to Equation 13 with T defined by equation (NBR-6123, Annex A, item 2):
(18)
where L is the largest dimension of the wind exposure face (in me-ters) and is the mean wind speed at the top of the structure (in m/s). Note that Equation 18 requires an iteration for its calcula-tion, since it is unknown a priori. After the definition of Tgust, it would still be necessary to interpolate to determine the other parameters of Equation 17, b, Fr, and p.It should be noted, however, that the natural frequencies of free
vibration estimated for the structure in analysis imply the occur-rence of non-negligible dynamic amplifications. Therefore, in addition to the static response to the acting medium forces, it is also necessary to estimate the dynamic response to the fluctuat-ing componente. In this sense, it is recalled that the NBR-6123 uses average time T = 600s (10min), dividing the effects into static (mean and dynamic (fluctuating).It is noteworthy that by neglecting the term v2 (t), in Equation 13, a direct proportionality between the spectral densities of force and velocity was allowed, from Equation 8, which can be expressed as:
(19)
where f is the frequency (variable independent of the new domain of analysis, in Hz), and χA (f) is called the "aerodynamic admittance function". This function, which varies from 0 to 1, can be understood as a correction in the implicit drag coeficiente in , to consider the fact that rapid fluctuations in wind speed do not imply proportional fluctuations in aerodynamic force over the integration zone. By dis-regarding the admittance function, by inserting a unit value in Equa-tion 19, a conservative simplification is being adopted.For fluctuations in the longitudinal component of wind speed, NBR-6123 adopts the so-called “Harris spectrum”, expressed as:
(20)
where is the mean wind speed over time T (in meters per sec-ond) at the reference height z = 10m. In the Harris model, the wind speed variance, , is considered to be approximately independent of the height, and estimated by:
(21)
where cas is a "surface drag coefficient", dimensionless and depen-dent on the terrain roughness category as shown in Table 1.
2.2.2 Calculation of the spectral density of the structural response
Following the same methodology of Chapter 9 of NBR-6123, the struc-tural response calculation is done by superposition of modal responses. Thus, the dynamic equilibrium matrix equation of the structure:
(22)
can be decoupled through the modal shape vectors of the dynamic system qk, obtained from the solution of the eigenvalues/ eigenvec-tors problem (disregarding damping):
Table 1Parameters characteristic of the natural wind and roughness of the terrain
Categoria I II III IV Vb (10 min) 1.23 1.00 0.86 0.71 0.50Fr (10 min) 0.77 0.69 0.63 0.57 0.47p (10 min) 0.095 0.150 0.185 0.23 0.31
1000 cas 2.8 6.5 10.5 22.6 52.7
0.14 0.21 0.26 0.39 0.59

1359IBRACON Structures and Materials Journal • 2019 • vol. 12 • nº 6
A. M. LOREDO-SOUZA | M. M. ROCHA | M. G. K. OLIVEIRA | P. GRALA
(23)
In Equation 24 it is hypothesized that free vibration response in kth mode is given by:
(24)
where uk (t) is a scalar time function called "modal response". Sub-stituting in Equation 22, and pre-multiplying all terms by (transposed from , we arrive at:
(25)
Due to the properties of the eigenvalues , the bracketed terms are all scalar:
(26)
called modal mass Mk, modal damping Ck, modal stiffness Kk, and modal (external) force Pk (t).It is important to note that, for the sake of simplicity in the formulation, the degrees of freedom implicit in Equation 22 are compatible with the integration zones of the aerodynamic pressures. In practice, a pre-liminary calculation of distribution coefficients is necessary so that the aerodynamic forces are applied in correspondence with the respective degrees of freedom in the vector of external forces . For the sake of simplicity in the exposition, it is considered below that there are n de-grees of freedom of translation corresponding to n pressure integration zones, each with an exposure area Ai and a drag coefficient Cai.With the decoupling of Equation 22, and considering that the modal force is an ergodic and stationary random process, we can obtain the spectrum of the displacement response through the so-lution in the frequency domain for a system with a single degree of freedom:
(27)
Where Hk (f) is the so-called "mechanical admittance", given by:
(28)
(29)
(30)
Where βk is the resonant frequency ratio and ζk is the critical damping ratio. It is observed that in Equation 27 it is still necessary to define the spectrum of the modal force, which depends on the spectra of the forces in all n integration zones. Considering that the modal force is given by:
(31)
considering that spectral density is in fact density of variance, and considering that the variance of a sum is equal to the sum of the cross-covariance, we have for the spectrum of the modal force:
(32)
where SPiPj (f) is the cross-spectrum (analogous to covariance) be-tween the fluctuating component of the forces in the integration zones i and j, which is modelled through the individual spectra and a coherence function:
(33)
The coherence function Rij (f) adopted in NBR-6123, C = 10 and γ = -0.3, has the form:
(34)
(35)
(36)
Where ∆rij is the distance between the aerodynamic centers of the two integration zones and is the average height of these two zones. After some substitutions, we arrive at an expression for the spectral density of the modal response:
(37)
where it was considered that the spectral density of the wind speed, SV (f) is independent of the integration zone, and also that the aerodynamic admittance function is equal to unity. For very slender tall structures, the integration zones will be segments in the z-direction, and therefore, can be done in yi = yj = 0 Equations 34-37. Figure 7 illustrates the steps of calculating, in the frequency domain, Equation 27, for a given mode of vibration.
2.2.3 Calculation of the vector of equivalent static aerodynamic forces
Once the spectral density SUk (f) is calculated by Equation 37, the variance of the structural response can be obtained by the integral:
Figure 7Steps in calculating the structural response in the frequency domain. Above: spectral density of modal force. In the center: function of mechanical admittance. Below is the spectral density of the modal response, SUk
(f)

1360 IBRACON Structures and Materials Journal • 2019 • vol. 12 • nº 6
Aerodynamic effects on a high slenderness concrete chimney
(38)
while the expected value of the response peak for the mean time T is given by:
(39)
being gT the "peak factor" obtained from the theory of random processes:
(40)
The statistical parameter ν is the rate of zero crosses, calculated as:
(41)
which should result in a value very close to the natural frequency fk, since the structural response is a random narrowband process, i.e. the structure oscillates around that frequency. Note that for T = 10 min e = 1Hz, which is the frequency above which a little resonant response of the structure is expected, the peak factor becomes gT ≈ 3.7. The NBR-6123 adopts a default value of 4, re-gardless of fk. A more accurate calculation of the peak factor leads, however, to a more economical solution.
Figure 8Chimney geometry characteristics

1361IBRACON Structures and Materials Journal • 2019 • vol. 12 • nº 6
A. M. LOREDO-SOUZA | M. M. ROCHA | M. G. K. OLIVEIRA | P. GRALA
Finally, the total structural response is given by the sum of the mean response with the peak of the fluctuating responses in the various modes. It is considered, however, that these peaks have a low probability of simultaneous occurrence, and a quadratic super-position method is used:
(42)
where only the relevant responses, usually restricted to a few modes (often only the first or the second), are retained in the sum-mation. The average response, , is the response to the mean load vector given by Equation 15, with given by Equations 17 and 19.For the purposes of structural design, there is the possibility of defin-ing vectors of equivalent static aerodynamic forces. When the de-signer provides masses, frequencies, and modal shapes, the stiff-ness matrix is not explicitly available at first. If it were, the dynamic portion of the load vector, for each mode k, would be given by:
(43)
where substituting Equation 24 we have:
(44)
And applying Equation 23 we get to:
(45)
and does not explicitly use the stiffness matrix. This load vector can then be used in a finite element program to obtain the stress and strain response, as well as for design checks.
2.3 Determination of lateral force due to vortex shedding
The shedding of alternating vortices produces an imbalance of pressures which causes an oscillatory force transverse to the di-rection of the wind. Estimates of this force are not fully reliable, and predictions based on experimental wind tunnel studies should be preferred. For a preliminary theoretical estimate of the transverse dynamic response, we recommend the methodologies present in Cicind [14], Eurocode [13], Grala [24], NBCC [12], Paluch et al. [25], Ruscheweyh [6]. However, there are divergences among researchers regarding which methodology is most appropriate to represent the physical phenomenon, and this discussion is pre-sented in Grala [24] and in Santos and Pfeil [26]. For illustrative purposes, the Canadian Standard method [12] is presented below.
2.3.1 Canadian wind code
The wind speed at which the shedding frequency of the vortices equals the natural frequency of the structure is given by Equation 46:
(46)
Table 2Basic chimney data used in the theoretical analysis
Z (m) Dint (m) e (m) m (kg) E I (Nm2) P (N) A (m2)-2 9.446 0.460 35789 4.59E12 2.24E7 10.370 9.300 0.450 121075 4.28E12 2.21E7 35.705 8.964 0.436 161761 3.71E12 2.16E7 49.18
10 8.629 0.421 150670 3.21E12 2.11E7 47.3615 8.293 0.407 139972 2.75E12 2.06E7 45.5420 7.957 0.393 129666 2.35E12 2.02E7 43.7125 7.621 0.379 119753 1.99E12 1.97E7 41.8930 7.286 0.364 110233 1.67E12 1.92E7 40.0735 6.950 0.350 101106 1.40E12 1.88E7 38.2540 6.614 0.336 92371 1.16E12 1.83E7 36.4345 6.279 0.321 84029 9.48E11 1.77E7 34.6150 5.943 0.307 76080 7.70E11 1.73E7 32.7955 5.607 0.393 68523 6.17E11 1.68E7 30.9660 5.271 0.279 61359 4.89E11 1.63E7 29.1465 4.936 0.264 54588 3.81E11 1.59E7 27.3270 4.600 0.250 48216 2.93E11 1.54E7 25.5075 4.600 0.250 48210 2.93E11 1.49E7 25.5080 4.600 0.250 48210 2.93E11 1.44E7 25.5085 4.600 0.250 48210 2.93E11 1.39E7 25.5090 4.600 0.250 48210 2.93E11 1.33E7 25.5095 4.600 0.250 48210 2.93E11 1.26E7 25.50
100 4.600 0.250 48210 2.93E11 1.19E7 25.50105 4.600 0.250 55117 2.93E11 1.11E7 25.50110 4.600 0.250 48210 2.93E11 1.01E7 25.50115 4.600 0.250 48210 2.93E11 9.15E6 25.50120 4.600 0.250 48210 2.93E11 8.07E6 25.50125 4.600 0.250 48210 2.93E11 6.90E6 25.50130 4.600 0.250 48210 2.93E11 5.63E6 25.50135 4.600 0.250 48210 2.93E11 4.25E6 25.50140 4.600 0.250 48210 2.93E11 2.77E6 25.50145 4.600 0.250 48210 2.93E11 1.19E6 25.50150 4.600 0.250 31012 2.93E11 0.00E0 12.75

1362 IBRACON Structures and Materials Journal • 2019 • vol. 12 • nº 6
Aerodynamic effects on a high slenderness concrete chimney
Where:fn = natural frequency of structure (Hz);St = Strouhal number;VH = average hourly velocity at top of structure (m/s);D = diameter (m).
At this velocity the vortex shedding produces an oscillatory force with frequency equal to the fundamental frequency of the chimney, thus causing maximum resonant effect. The Strouhal number im-
plicit in this calculation is St = 0.2.The dynamic effects due to vortex shedding can be determined approximately by applying a lateral force per unit length acting on the upper third of the chimney given by Equation 47:
(47)
Where:FL = equivalent static force per unit length (N);β = critical damping ratio;λ = H/D = slenderness;H = height of structure (m)
= dynamic pressure corresponding to VH (N/m2)M = mass per unit length of the upper third of the structure (kg/m)C1, C2 = parameters indicated in the NBCC-1990 [12].
3. Structure characteristics
The structure analyzed here consists of a 150 m high reinforced concrete chimney, whose geometry can be observed in Figure 8. The main properties of the structure are presented in Table 2. Through numerical modelling based on finite elements a natural frequency of 0.24 Hz for the first mode was obtained, as shown in Figure 9, which also shows the characteristics of the second and third modes of vibration.
4. Wind tunnel testing
Two reduced models were constructed: a rigid model for measur-ing the pressures and corresponding aerodynamic coefficients, and another aeroelastic model, reproducing the main dynamic
Figure 9Vibration mode shapes and frequencies
Figure 10Reference for the wind angle of incidence

1363IBRACON Structures and Materials Journal • 2019 • vol. 12 • nº 6
A. M. LOREDO-SOUZA | M. M. ROCHA | M. G. K. OLIVEIRA | P. GRALA
characteristics of the real structure. Two vicinity configurations were studied and identified as Configuration I, corresponding to the isolated main chimney, and Configuration II, corresponding to the main chimney with the complete immediate vicinity.The rigid model was instrumented with a total of 288 pressure taps, distributed in a way to allow a representative survey of the pressures throughout the building, by rotating the model 360o. Pressures were measured at every 15o wind incidence, resulting in the amount of 7,200 pressure records for the two surrounding conditions tested. The reference for the wind angles of incidence is shown in Figure 10.The design of the aeroelastic model takes into account, besides the external geometry (aerodynamic shape) of the structure, also its mechanical properties: mass distribution, modal shapes and natu-ral frequencies of free vibration. These properties were provided by the designer and are: f1 = 0.26 Hz and f2 = 1.12 Hz. The theory of dimensional analysis says that it is possible to control the scales of three fundamental quantities, and the scales of all other quantities are defined from these. The scale of length (1: 250), the specific mass scale (1: 1), and finally the frequency scale, which depends on
the rigidity obtained for the model, are defined. The stiffness of the model is designed in order to produce a range of vibration frequen-cies that can be easily recorded, and at the same time a velocity scale that is compatible with the wind velocities obtained in the wind tunnel. The specific mass scale results from the fact that the same fluid (air) produces the dynamic pressures, both on the scale of the model and on the full scale. The tests were carried out at the Labo-ratório de Aerodinâmica das Construções da Universidade Federal Rio Grande do Sul (Blessmann [27]) and Figure 11 shows photo-graphs of the tested model and the test configurations.
5. Analysis of experimental results
5.1 Isolated model
The data for the isolated condition was obtained for compari-son with the theoretical estimates. The comparison parameter will be the bending moment at the base of the chimney. For the longitudinal direction in the isolated model condition (Figure 12), the aero-elastic model presents a result for the peak value
Figure 11Photograph of the chimney aeroelastic model inside the wind tunnel. Configuration I: isolated chimney. Configuration II: chimney with surrounding structures
Figure 12Longitudinal bending moment at the base of the chimney as a function of the wind speed at the top of the structure. Isolated configuration
Figure 13Transverse bending moment at the base of the chimney as a function of the wind speed at the top of the structure. Isolated configuration

1364 IBRACON Structures and Materials Journal • 2019 • vol. 12 • nº 6
Aerodynamic effects on a high slenderness concrete chimney
slightly below (8%) of what was estimated in the theoretical analysis (presented in item 6). For the transverse direction (Fig-ure 13), it is interesting to observe the small peak appearing at a velocity of about 6m/s (at the top) caused by the resonance of the first mode of vibration with the shedding of alternating vorti-ces. This critical velocity corroborates the theoretical velocity of 6.12 m/s calculated (item 6.2), confirming the Strouhal number adopted (≈0,2). However, a second peak is observed for veloc-ity around 32 m/s (at the top), caused by the resonance of the second vibration mode with the vortex shedding. At the design velocity the peak transverse bending moment is interpolated to 27.6 MNm, higher than the value recommended by the Brazilian
code, 1/3 of the longitudinal moment, but lower than the value of 38MNm recorded at a velocity inferior ro the design value (Figure 13). This increase is largely caused by the proximity of the resonance in the second mode. The transverse response must be vectorially superimposed on the longitudinal response.
5.2 Model with vicinity
The results for the model with vicinityare shown in Figure 14 and Figure 15, for the angle of 345°. The longitudinal (mean values, r.m.s and peak) and transverse (r.m.s and peak) bending mo-ments at the base of the chimney are presented separately. The graphs show the statistics of the moments as a function of the speed at the top of the model. The aim is to clarify the surround-ing effects in the dynamic response. The results show that, for almost all directions of wind incidence, the greatest longitudinal bending moment does not exceed 60 MNm at the base of the chimney. This result would therefore be lower than that estimat-ed at 67 MNm in the theoretical analysis (item 6.1.3, Figures 18 and 19). However, for the direction of the wind equal to 90o this maximum longitudinal moment already reaches 60MNm for the velocity (at the top) of the order of 28 m/s. For the angle of 345o a resonance phenomenon occurs with the shedding of alternat-ing vortices exciting the second mode of free vibration of the structure. This phenomenon is due to the low natural frequency of free vibration in the second mode, associated to the presence of the two smaller windward chimneys. The bending moment at the base, overlapping longitudinal and transverse responses, can reach 100 MNm at the moments when the maximum ampli-tudes occur simultaneously.
6. Theoretical analysis of the chimney
6.1 Response to the wind
For the application of the methodology exposed in the prior section to the 150 m high chimney, the following wind definition parameters are chosen: V0 = 30 m/s, S1 = 1.0, S2 = 1.1 and the categories are II and III. Applying these specifications to Equations 17, 18 and 21, the following analysis parameters are obtained: Tgust = 28,6 s,
= 39.3 m/s e σv = 5.12 m/s. These parameters are used for the determination of aerodynamic forces by the static method, presented in this report only for comparative purposes, since the dynamic method leads to significantly higher forces.A structural damping β = 1% (critical damping ratio) was adopted for the first two modes. When applying the methodology presented in section 2, we have the following characteristic parameters of the responses in the first mode of vibration: fk = 0.24 Hz, Mk = 2.82 ×10⁵ kg and Kk = (2πfk)2 Mk = 6.59 ×10⁵ N/m.
6.1.1 Isolated chimney with aerodynamic coefficients of NBR-6123
The first analysis to be discussed considers the chimney to be isolated, as well as drag coefficients equal to 0.6 throughout its height. The application of the methodology presented in section 2 leads to the following results in the first mode of vibration for
Figure 14Longitudinal bending moment at the base of the chimney as a function of the wind speed at the top of the structure. Configuration with surroundings. Angle of wind incidence: 345º
Figure 15Transverse bending moment at the base of the chimney as a function of the wind speed at the top of the structure. Configuration with neighborhood. Angle of wind incidence: 345º
1365IBRACON Structures and Materials Journal • 2019 • vol. 12 • nº 6
A. M. LOREDO-SOUZA | M. M. ROCHA | M. G. K. OLIVEIRA | P. GRALA
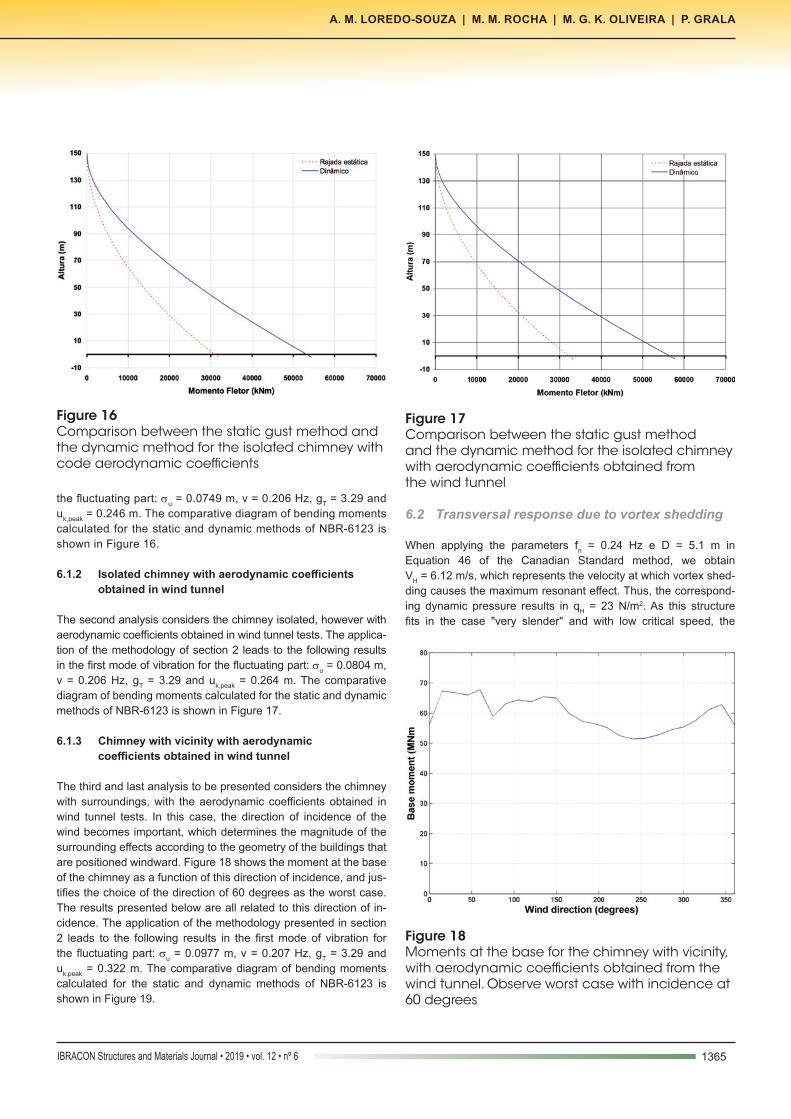
the fluctuating part: σu = 0.0749 m, v = 0.206 Hz, gT = 3.29 and uk,peak = 0.246 m. The comparative diagram of bending moments calculated for the static and dynamic methods of NBR-6123 is shown in Figure 16.
6.1.2 Isolated chimney with aerodynamic coefficients obtained in wind tunnel
The second analysis considers the chimney isolated, however with aerodynamic coefficients obtained in wind tunnel tests. The applica-tion of the methodology of section 2 leads to the following results in the first mode of vibration for the fluctuating part: σu = 0.0804 m, v = 0.206 Hz, gT = 3.29 and uk,peak = 0.264 m. The comparative diagram of bending moments calculated for the static and dynamic methods of NBR-6123 is shown in Figure 17.
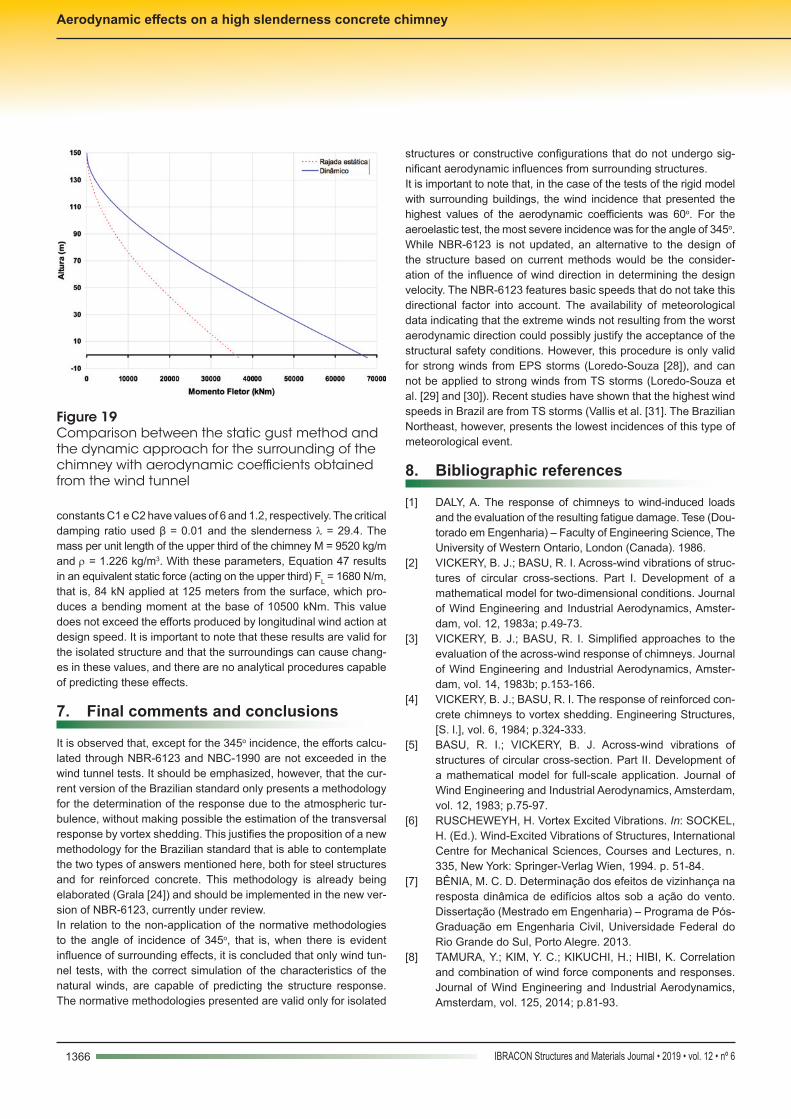
6.1.3 Chimney with vicinity with aerodynamic coefficients obtained in wind tunnel
The third and last analysis to be presented considers the chimney with surroundings, with the aerodynamic coefficients obtained in wind tunnel tests. In this case, the direction of incidence of the wind becomes important, which determines the magnitude of the surrounding effects according to the geometry of the buildings that are positioned windward. Figure 18 shows the moment at the base of the chimney as a function of this direction of incidence, and jus-tifies the choice of the direction of 60 degrees as the worst case. The results presented below are all related to this direction of in-cidence. The application of the methodology presented in section 2 leads to the following results in the first mode of vibration for the fluctuating part: σu = 0.0977 m, v = 0.207 Hz, gT = 3.29 and uk,peak = 0.322 m. The comparative diagram of bending moments calculated for the static and dynamic methods of NBR-6123 is shown in Figure 19.
6.2 Transversal response due to vortex shedding
When applying the parameters fn = 0.24 Hz e D = 5.1 m in Equation 46 of the Canadian Standard method, we obtain VH = 6.12 m/s, which represents the velocity at which vortex shed-ding causes the maximum resonant effect. Thus, the correspond-ing dynamic pressure results in qH = 23 N/m2. As this structure fits in the case "very slender" and with low critical speed, the
Figure 16Comparison between the static gust method and the dynamic method for the isolated chimney with code aerodynamic coefficients
Figure 17Comparison between the static gust method and the dynamic method for the isolated chimney with aerodynamic coefficients obtained from the wind tunnel
Figure 18Moments at the base for the chimney with vicinity, with aerodynamic coefficients obtained from the wind tunnel. Observe worst case with incidence at 60 degrees
1366 IBRACON Structures and Materials Journal • 2019 • vol. 12 • nº 6
Aerodynamic effects on a high slenderness concrete chimney
constants C1 e C2 have values of 6 and 1.2, respectively. The critical damping ratio used β = 0.01 and the slenderness λ = 29.4. The mass per unit length of the upper third of the chimney M = 9520 kg/m and ρ = 1.226 kg/m3. With these parameters, Equation 47 results in an equivalent static force (acting on the upper third) FL = 1680 N/m, that is, 84 kN applied at 125 meters from the surface, which pro-duces a bending moment at the base of 10500 kNm. This value does not exceed the efforts produced by longitudinal wind action at design speed. It is important to note that these results are valid for the isolated structure and that the surroundings can cause chang-es in these values, and there are no analytical procedures capable of predicting these effects.
7. Final comments and conclusions
It is observed that, except for the 345o incidence, the efforts calcu-lated through NBR-6123 and NBC-1990 are not exceeded in the wind tunnel tests. It should be emphasized, however, that the cur-rent version of the Brazilian standard only presents a methodology for the determination of the response due to the atmospheric tur-bulence, without making possible the estimation of the transversal response by vortex shedding. This justifies the proposition of a new methodology for the Brazilian standard that is able to contemplate the two types of answers mentioned here, both for steel structures and for reinforced concrete. This methodology is already being elaborated (Grala [24]) and should be implemented in the new ver-sion of NBR-6123, currently under review.In relation to the non-application of the normative methodologies to the angle of incidence of 345o, that is, when there is evident influence of surrounding effects, it is concluded that only wind tun-nel tests, with the correct simulation of the characteristics of the natural winds, are capable of predicting the structure response. The normative methodologies presented are valid only for isolated
structures or constructive configurations that do not undergo sig-nificant aerodynamic influences from surrounding structures.It is important to note that, in the case of the tests of the rigid model with surrounding buildings, the wind incidence that presented the highest values of the aerodynamic coefficients was 60o. For the aeroelastic test, the most severe incidence was for the angle of 345o.While NBR-6123 is not updated, an alternative to the design of the structure based on current methods would be the consider-ation of the influence of wind direction in determining the design velocity. The NBR-6123 features basic speeds that do not take this directional factor into account. The availability of meteorological data indicating that the extreme winds not resulting from the worst aerodynamic direction could possibly justify the acceptance of the structural safety conditions. However, this procedure is only valid for strong winds from EPS storms (Loredo-Souza [28]), and can not be applied to strong winds from TS storms (Loredo-Souza et al. [29] and [30]). Recent studies have shown that the highest wind speeds in Brazil are from TS storms (Vallis et al. [31]. The Brazilian Northeast, however, presents the lowest incidences of this type of meteorological event.
8. Bibliographic references
[1] DALY, A. The response of chimneys to wind-induced loads and the evaluation of the resulting fatigue damage. Tese (Dou-torado em Engenharia) – Faculty of Engineering Science, The University of Western Ontario, London (Canada). 1986.
[2] VICKERY, B. J.; BASU, R. I. Across-wind vibrations of struc-tures of circular cross-sections. Part I. Development of a mathematical model for two-dimensional conditions. Journal of Wind Engineering and Industrial Aerodynamics, Amster-dam, vol. 12, 1983a; p.49-73.
[3] VICKERY, B. J.; BASU, R. I. Simplified approaches to the evaluation of the across-wind response of chimneys. Journal of Wind Engineering and Industrial Aerodynamics, Amster-dam, vol. 14, 1983b; p.153-166.
[4] VICKERY, B. J.; BASU, R. I. The response of reinforced con-crete chimneys to vortex shedding. Engineering Structures, [S. l.], vol. 6, 1984; p.324-333.
[5] BASU, R. I.; VICKERY, B. J. Across-wind vibrations of structures of circular cross-section. Part II. Development of a mathematical model for full-scale application. Journal of Wind Engineering and Industrial Aerodynamics, Amsterdam, vol. 12, 1983; p.75-97.
[6] RUSCHEWEYH, H. Vortex Excited Vibrations. In: SOCKEL, H. (Ed.). Wind-Excited Vibrations of Structures, International Centre for Mechanical Sciences, Courses and Lectures, n. 335, New York: Springer-Verlag Wien, 1994. p. 51-84.
[7] BÊNIA, M. C. D. Determinação dos efeitos de vizinhança na resposta dinâmica de edifícios altos sob a ação do vento. Dissertação (Mestrado em Engenharia) – Programa de Pós-Graduação em Engenharia Civil, Universidade Federal do Rio Grande do Sul, Porto Alegre. 2013.
[8] TAMURA, Y.; KIM, Y. C.; KIKUCHI, H.; HIBI, K. Correlation and combination of wind force components and responses. Journal of Wind Engineering and Industrial Aerodynamics, Amsterdam, vol. 125, 2014; p.81-93.
Figure 19Comparison between the static gust method and the dynamic approach for the surrounding of the chimney with aerodynamic coefficients obtained from the wind tunnel

1367IBRACON Structures and Materials Journal • 2019 • vol. 12 • nº 6
A. M. LOREDO-SOUZA | M. M. ROCHA | M. G. K. OLIVEIRA | P. GRALA
[9] MANNINI, C.; MARRA, A. M.; BARTOLI, G. VIV-gallopping instability of rectangular cylinders: review and new experi-ments. Journal of Wind Engineering and Industrial Aerody-namics, Amsterdam, vol. 132, 2014; p.109-124.
[10] DONGMEI, H.; LEDONG, Z.; QUANSHUN, D.; XUE, Z.; WEI, C. Aeroelastic and aerodynamic interference effects on a high-rise building. Journal of Fluids and Structures, Am-sterdam, vol. 69, 2017; p.355-381.
[11] ASSOCIAÇÃO BRASILEIRA DE NORMAS TÉCNICAS. Forças devidas ao vento em edificações. NBR-6123, Rio de Janeiro, 1988.
[12] NATIONAL BUILDING CODE OF CANADA. National Re-search Council of Canada, Associate Committee on the Na-tional Building Code, Ottawa, NRCC No. 23178, 1990.
[13] EUROCÓDIGO 1. Actions on structures – Part 1-4: General Actions – Wind Actions EN 1991-1-4, The European Stan-dard, 2010.
[14] CICIND. Model code for steel chimneys. Zurich, 2002. [15] BLESSMANN, J. Aerodinâmica das Construções. Porto
Alegre: Editora Sagra, 2ed., 1990. [16] ROSHKO, A. Experiments on the flow past a circular cylinder
at very high Reynolds numbers. Journal of Fluid Mechanics, Cambridge, v. 10, 1961; p. 345-356.
[17] FLACHSBART, O. Results from 1929 experiment - article by H. Muttray. Handbook Experimental-physik, 4, part 2 (Leipzig), 316, 1932.
[18] FAGE, A.; FALKNER, V. M. Further experiments on the flow around a circular cylinder. London, Aeronautical Research Committee, (Reports and Memoranda – 1369), 1931, 26p.
[19] SCRUTON, C.; ROGERS, E. W. E. Steady and Unsteady Wind Loading of Building and Structures. In: Phil. Trans. Roy. Soc., London A269, 1971; p. 353-383.
[20] OKAMOTO, T.; YAGITA, M. (1973). The experimental Inves-tigation on the flow past a circular cylinder of finite length placed normal to the plane surface in a uniform stream. Bull. JSME, vol.16, 1973; p.805-814.
[21] COOK, N. J. The designer’s guide to wind loading of build-ing structures. Part 2: Static Structures. (Building Research Establishment). London, UK, 1990.
[22] GOULD, R. W. E.; RAYMER, W. G. E.; PONSFORD, P. J. Wind tunnel tests on chimneys of circular section at high Reynolds numbers. Proceedings Symposium on Wind Ef-fects on Buildings and Structures, Loughborough University of Technology, Loughborough, UK, 1968.
[23] BASU, R. I. Aerodynamic forces on structures of circular cross-section. Part II. The influence of turbulence and three-dimensional effects. Journal of Wind Engineering and Indus-trial Aerodynamics, Amsterdam, vol. 24, 1986; p.33-59.
[24] GRALA, P. Estudo das metodologias para o cálculo da res-posta de estruturas cilíndrico circulares frente ao fenômeno de desprendimento de vórtices: proposta atualizada para a NBR-6123. Dissertação (Mestrado em Engenharia) – Pro-grama de Pós-Graduação em Engenharia Civil, Universi-dade Federal do Rio Grande do Sul, Porto Alegre. 2016.
[25] PALUCH, M. J., LOREDO-SOUZA, A.M. e RIERA, J.D. Vi-brações transversais de torres e chaminés de concreto ar-mado devido ao desprendimento de vórtices – propostas
para a NBR-6123. In: Anais do 47o Congresso Brasileiro do Concreto, 2005.
[26] SANTOS, M. L., PFEIL, M. S. Vortex-induced vibrations of circular section towers. In: Proceedings of the 14th Interna-tional Conference on Wind Engineering, 2015.
[27] BLESSMANN, J. The Boundary Layer Wind Tunnel of UFRGS. Journal of Wind Engineering and Industrial Aerody-namics, vol. 10, 1982; p. 231-248.
[28] LOREDO-SOUZA, A. M. Meteorological events causing extreme winds in Brazil. Wind and Structures, vol. 15, n. 2, 2012; p.177-188.
[29] LOREDO-SOUZA, A. M., LIMA, E. G., VALLIS, M. B., RO-CHA, M. M., WITTWER, A. R., OLIVEIRA, M. G. K. Full-scale downburst damage versus boundary layer wind tun-nel pressures: a survey analysis. In: Proceedings of the 8th International Colloquium on Bluff Body Aerodynamics and Applications. Northeastern University, Boston, Massachus-setts, USA, 2016.
[30] LOREDO-SOUZA, A. M., LIMA, E. G., VALLIS, M. B., RO-CHA, M. M., WITTWER, A. R., OLIVEIRA, M. G. K. Down-burst related damages in Brazilian buildings: are they avoid-able?. In: Proceedings of the International Workshop on Wind-Related Disasters and Mitigation, Sendai, 2018.
[31] VALLIS, M. B., LOREDO-SOUZA, A. M., WATRIN, L. C., BÊ-NIA, M. C. D. Extreme winds east of the Andes. In: Proceed-ings of Jornadas Sudamericanas de Ingeniería Estructural, Lima, 2018.