Embed Size (px)
Citation preview
1
Abstract
This paper presents the key results from the Green Regional Aircraft Integrated Technology Demonstrator (GRA ITD), a European Union funded collaborative Project inside the Clean Sky Joint Technology Initiative (CS JTI) [1], investigating a fully automatic procedure for numerical aerodynamic optimization developed by Piaggio Aero Industries, integrating commercial software for geometry modeling/handling, mesh generation and Navier-Stokes flow simulations. The aerodynamic design based on numerical optimization procedure has been applied to design the Advanced Turbofan (ATF) clean wing-body configuration, with the aim to increase the aerodynamic efficiency in cruise conditions (Mach number (M) = 0.78, lift coefficient (CL) = 0.5, altitude (z) = 35 000 feet (ft), International Standard Atmosphere (ISA) conditions), taking into account geometric constraints of wing planform, fuel volume and spar thickness. A mesh sensitivity analysis has been carried out on the optimized geometry in order to verify the effects of mesh refinement. Aero data base has been generated considering the optimized geometry for several Mach numbers and lift coefficient values.
1 Introduction
In the framework of the EU (European Community) FP7 (Seventh Framework Programme for the Clean Sky Joint Technology Initiative, an aerodynamic design based on numerical optimization and aero data base generation of a green regional ATF aircraft
configuration have been performed. The optimization has been aimed at the reduction of aircraft’s drag in cruise condition (M = 0.78, CL = 0.5, z = 35 000 ft, ISA conditions) considering geometric constraints of wing planform, fuel volume and spar thickness.
An automatic numerical optimization procedure managing Computer Aided Design (CAD) environment, mesh generation, Computational Fluid Dynamic (CFD) analysis and post-processing has been developed by Piaggio Aero Industries and used to perform numerical aerodynamic optimization.
The optimized configuration has been analyzed using CFD to generate wing-body drag polar.
Further activity will be performed using CFD to design empennages, winglet, to integrate engine nacelle and pylon system and to generate the aero data base of the complete aircraft (A/C) configuration (the excrescence will be taken into account through statistical analyses).
2 ATF Reference A/C
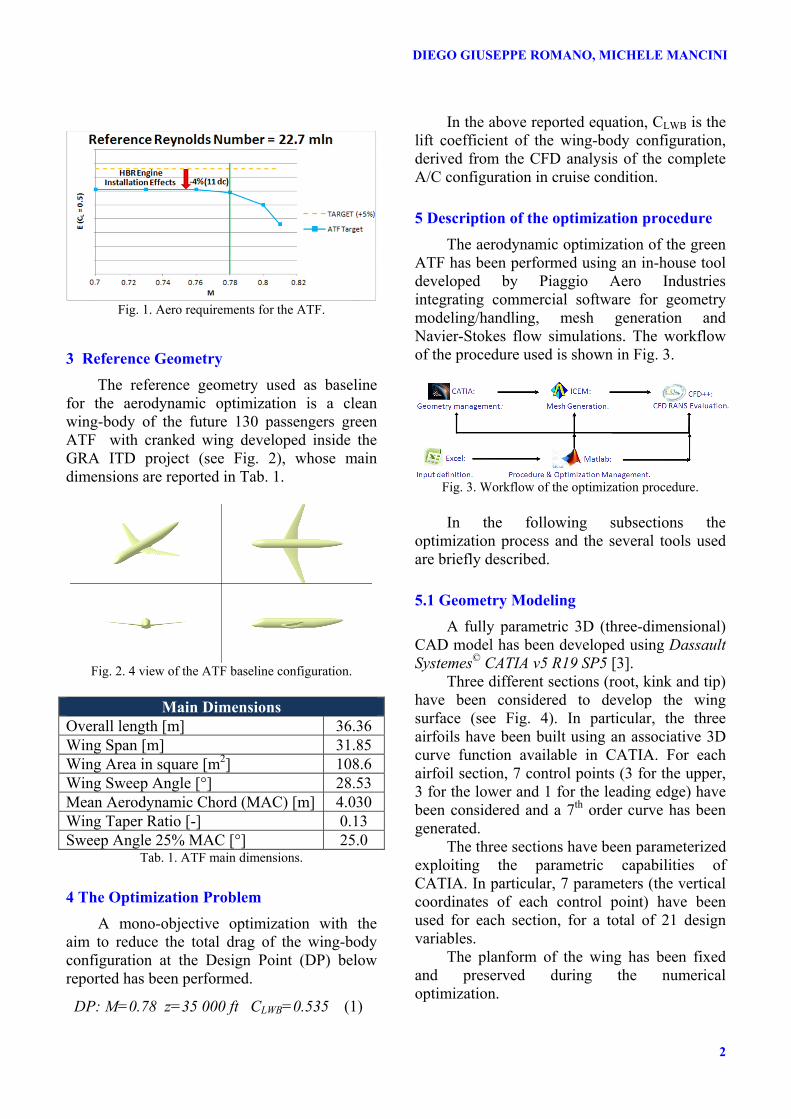
The reference ATF aircraft configuration is generated using empirical methods starting from available data of similar aircraft of the same seat-class and with similar TLARS (Top Level Aircraft Requirements) actually in service [2]. The target efficiency in cruise condition (CL = 0.5) has to be improved by 5% to take into account the Clean-Sky improvements for 2020 next generation of green regional aircrafts. However, due to the installation of High Bypass Ratio (HBR) engine on green regional aircraft ATF, a preliminary aerodynamic efficiency reduction of 4% has been estimated (see Fig. 1).
AERODYNAMIC OPTIMIZATION OF A GREEN ATF REGIONAL AIRCRAFT IN CRUISE CONDITION
Diego Giuseppe Romano*, Michele Mancini**
*Piaggio Aero Industries S.p.A., **Piaggio Aero Industries S.p.A.
Keywords: Aerodynamic, Design, Navier-Stokes, Optimization, 3D
DIEGO GIUSEPPE ROMANO, MICHELE MANCINI
2
Fig. 1. Aero requirements for the ATF.
3 Reference Geometry
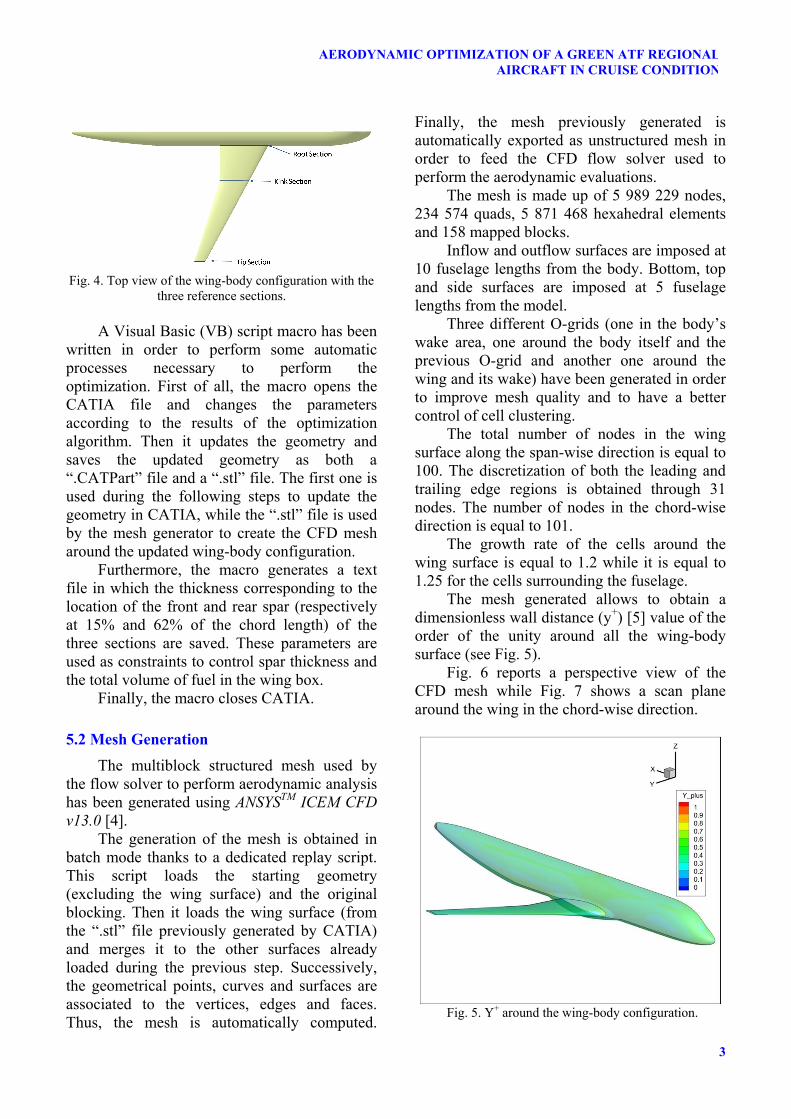
The reference geometry used as baseline for the aerodynamic optimization is a clean wing-body of the future 130 passengers green ATF with cranked wing developed inside the GRA ITD project (see Fig. 2), whose main dimensions are reported in Tab. 1.
Fig. 2. 4 view of the ATF baseline configuration.
Main Dimensions Overall length [m] 36.36 Wing Span [m] 31.85 Wing Area in square [m2] 108.6 Wing Sweep Angle [°] 28.53 Mean Aerodynamic Chord (MAC) [m] 4.030 Wing Taper Ratio [-] 0.13 Sweep Angle 25% MAC [°] 25.0
Tab. 1. ATF main dimensions.
4 The Optimization Problem
A mono-objective optimization with the aim to reduce the total drag of the wing-body configuration at the Design Point (DP) below reported has been performed.
DP: M=0.78 z=35 000 ft CLWB=0.535 (1)
In the above reported equation, CLWB is the lift coefficient of the wing-body configuration, derived from the CFD analysis of the complete A/C configuration in cruise condition.
5 Description of the optimization procedure
The aerodynamic optimization of the green ATF has been performed using an in-house tool developed by Piaggio Aero Industries integrating commercial software for geometry modeling/handling, mesh generation and Navier-Stokes flow simulations. The workflow of the procedure used is shown in Fig. 3.
Fig. 3. Workflow of the optimization procedure.
In the following subsections the
optimization process and the several tools used are briefly described.
5.1 Geometry Modeling
A fully parametric 3D (three-dimensional) CAD model has been developed using Dassault Systemes© CATIA v5 R19 SP5 [3].
Three different sections (root, kink and tip) have been considered to develop the wing surface (see Fig. 4). In particular, the three airfoils have been built using an associative 3D curve function available in CATIA. For each airfoil section, 7 control points (3 for the upper, 3 for the lower and 1 for the leading edge) have been considered and a 7th order curve has been generated.
The three sections have been parameterized exploiting the parametric capabilities of CATIA. In particular, 7 parameters (the vertical coordinates of each control point) have been used for each section, for a total of 21 design variables.
The planform of the wing has been fixed and preserved during the numerical optimization.
3
AERODYNAMIC OPTIMIZATION OF A GREEN ATF REGIONALAIRCRAFT IN CRUISE CONDITION
Fig. 4. Top view of the wing-body configuration with the
three reference sections.
A Visual Basic (VB) script macro has been written in order to perform some automatic processes necessary to perform the optimization. First of all, the macro opens the CATIA file and changes the parameters according to the results of the optimization algorithm. Then it updates the geometry and saves the updated geometry as both a “.CATPart” file and a “.stl” file. The first one is used during the following steps to update the geometry in CATIA, while the “.stl” file is used by the mesh generator to create the CFD mesh around the updated wing-body configuration.
Furthermore, the macro generates a text file in which the thickness corresponding to the location of the front and rear spar (respectively at 15% and 62% of the chord length) of the three sections are saved. These parameters are used as constraints to control spar thickness and the total volume of fuel in the wing box.
Finally, the macro closes CATIA.
5.2 Mesh Generation
The multiblock structured mesh used by the flow solver to perform aerodynamic analysis has been generated using ANSYSTM ICEM CFD v13.0 [4].
The generation of the mesh is obtained in batch mode thanks to a dedicated replay script. This script loads the starting geometry (excluding the wing surface) and the original blocking. Then it loads the wing surface (from the “.stl” file previously generated by CATIA) and merges it to the other surfaces already loaded during the previous step. Successively, the geometrical points, curves and surfaces are associated to the vertices, edges and faces. Thus, the mesh is automatically computed.
Finally, the mesh previously generated is automatically exported as unstructured mesh in order to feed the CFD flow solver used to perform the aerodynamic evaluations.
The mesh is made up of 5 989 229 nodes, 234 574 quads, 5 871 468 hexahedral elements and 158 mapped blocks.
Inflow and outflow surfaces are imposed at 10 fuselage lengths from the body. Bottom, top and side surfaces are imposed at 5 fuselage lengths from the model.
Three different O-grids (one in the body’s wake area, one around the body itself and the previous O-grid and another one around the wing and its wake) have been generated in order to improve mesh quality and to have a better control of cell clustering.
The total number of nodes in the wing surface along the span-wise direction is equal to 100. The discretization of both the leading and trailing edge regions is obtained through 31 nodes. The number of nodes in the chord-wise direction is equal to 101.
The growth rate of the cells around the wing surface is equal to 1.2 while it is equal to 1.25 for the cells surrounding the fuselage.
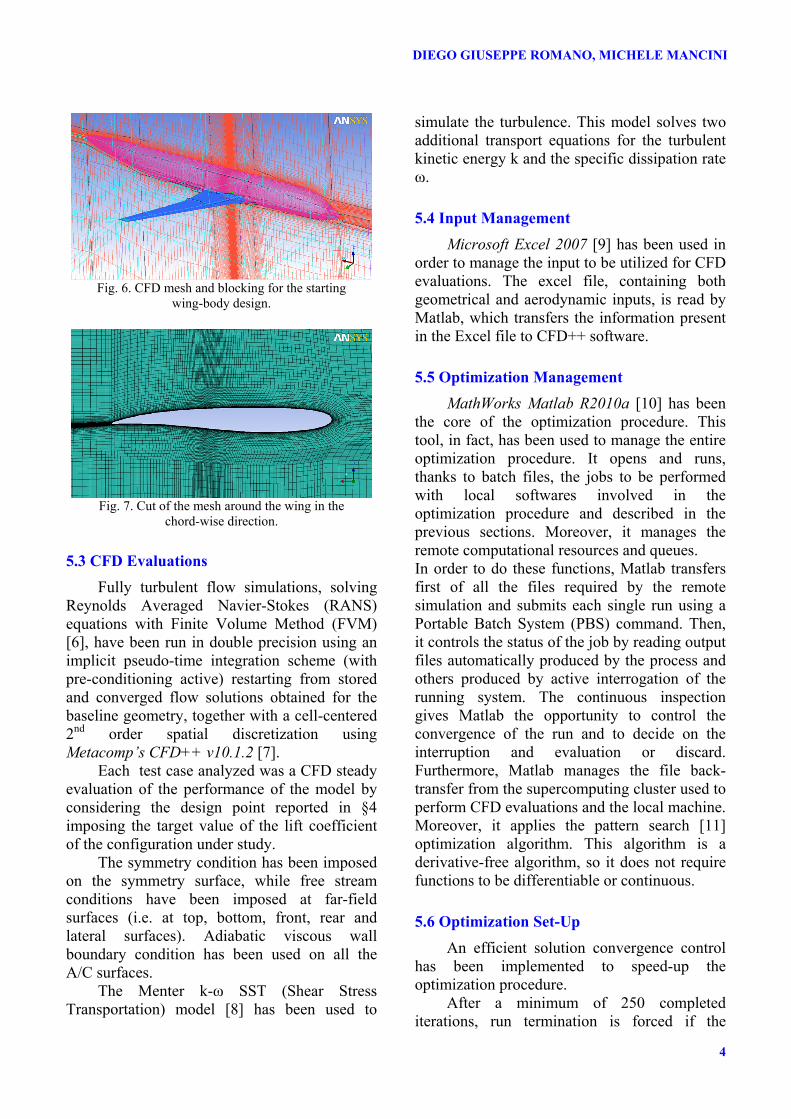
The mesh generated allows to obtain a dimensionless wall distance (y+) [5] value of the order of the unity around all the wing-body surface (see Fig. 5).
Fig. 6 reports a perspective view of the CFD mesh while Fig. 7 shows a scan plane around the wing in the chord-wise direction.
Fig. 5. Y+ around the wing-body configuration.
DIEGO GIUSEPPE ROMANO, MICHELE MANCINI
4
Fig. 6. CFD mesh and blocking for the starting
wing-body design.
Fig. 7. Cut of the mesh around the wing in the
chord-wise direction.
5.3 CFD Evaluations
Fully turbulent flow simulations, solving Reynolds Averaged Navier-Stokes (RANS) equations with Finite Volume Method (FVM) [6], have been run in double precision using an implicit pseudo-time integration scheme (with pre-conditioning active) restarting from stored and converged flow solutions obtained for the baseline geometry, together with a cell-centered 2nd order spatial discretization using Metacomp’s CFD++ v10.1.2 [7].
Each test case analyzed was a CFD steady evaluation of the performance of the model by considering the design point reported in §4 imposing the target value of the lift coefficient of the configuration under study.
The symmetry condition has been imposed on the symmetry surface, while free stream conditions have been imposed at far-field surfaces (i.e. at top, bottom, front, rear and lateral surfaces). Adiabatic viscous wall boundary condition has been used on all the A/C surfaces.
The Menter k-ω SST (Shear Stress Transportation) model [8] has been used to
simulate the turbulence. This model solves two additional transport equations for the turbulent kinetic energy k and the specific dissipation rate ω.
5.4 Input Management
Microsoft Excel 2007 [9] has been used in order to manage the input to be utilized for CFD evaluations. The excel file, containing both geometrical and aerodynamic inputs, is read by Matlab, which transfers the information present in the Excel file to CFD++ software.
5.5 Optimization Management
MathWorks Matlab R2010a [10] has been the core of the optimization procedure. This tool, in fact, has been used to manage the entire optimization procedure. It opens and runs, thanks to batch files, the jobs to be performed with local softwares involved in the optimization procedure and described in the previous sections. Moreover, it manages the remote computational resources and queues. In order to do these functions, Matlab transfers first of all the files required by the remote simulation and submits each single run using a Portable Batch System (PBS) command. Then, it controls the status of the job by reading output files automatically produced by the process and others produced by active interrogation of the running system. The continuous inspection gives Matlab the opportunity to control the convergence of the run and to decide on the interruption and evaluation or discard. Furthermore, Matlab manages the file back-transfer from the supercomputing cluster used to perform CFD evaluations and the local machine. Moreover, it applies the pattern search [11] optimization algorithm. This algorithm is a derivative-free algorithm, so it does not require functions to be differentiable or continuous.
5.6 Optimization Set-Up
An efficient solution convergence control has been implemented to speed-up the optimization procedure.
After a minimum of 250 completed iterations, run termination is forced if the

5
AERODYNAMIC OPTIMIZATION OF A GREEN ATF REGIONALAIRCRAFT IN CRUISE CONDITION
average flux residual drops 9 orders of magnitude below its initial value (over whole history) or if lift and drag coefficient variations are smaller than 1 lift count and 1.5 drag count respectively over the last 50 iterations.
5.7 Computational Hardware Resources
Relevant computational resources have been used to allow time-efficient RANS simulations. In particular, 144 CPU cores of the supercomputing facility of Piaggio Aero Industries have been used to perform CFD analyses. Considerable effort was dedicated to the development of robust and efficient routines to handle all possible errors occurring during the evaluation process (CAD, mesh and/or CFD run failures) and to manage data transfer and communication in the computational network, including both Windows (local workstation) and Linux (supercomputing cluster) machines.
The total elapsed time for each evaluation lasted about 23 minutes (see Fig. 8), so the entire optimization has been carried out within 2 months.
Fig. 8. Average machine time for each evaluation.
6 Optimization Results
The CFD analysis of the baseline design showed that there is an incipient separation in the forward area of the outer wing’s surface (see Fig. 9) which has detrimental effect on global efficiency.
Fig. 9. Pressure coefficient distribution and shear traces
around the baseline wing of the ATF.
The optimization procedure led to a sensible improvement of the configuration’s efficiency with few evaluations (about 8% of efficiency increase after only 24 iterations).
The highest improvement of the efficiency (about 10%) was reached after less than 130 iterations (see Fig. 10). Fig. 11 shows the CP and shear traces distribution for the optimized configuration. It is possible to see that the pressure expansion on wing’s outboard is sensibly reduced with respect to the starting design, preventing the separation in this area.
Fig. 10. Optimization’s convergence history.

DIEGO GIUSEPPE ROMANO, MICHELE MANCINI
6
Fig. 11. Pressure coefficient distribution and shear traces
around the optimal wing of the ATF.
A further improvement of the A/C efficiency has been obtained designing a proper fillet in the forward part of the root airfoil section.
Thanks to the introduction of the abovementioned fillet, a global improvement of about 11% has been reached (see Fig. 12 and Fig. 13).
Fig. 12. Detailed view of the shear traces and CP
distribution in the wing-fuselage junction without fillet.
Fig. 13. Detailed view of the shear traces and CP
distribution in the wing-fuselage junction with fillet.
The pressure coefficient distribution and the shear traces around the starting (half left side) and the optimized (half right side) half wing are compared in Fig. 14.
Fig. 14. CP and shear traces for the starting (half left side)
and the optimized (half right side) wings.
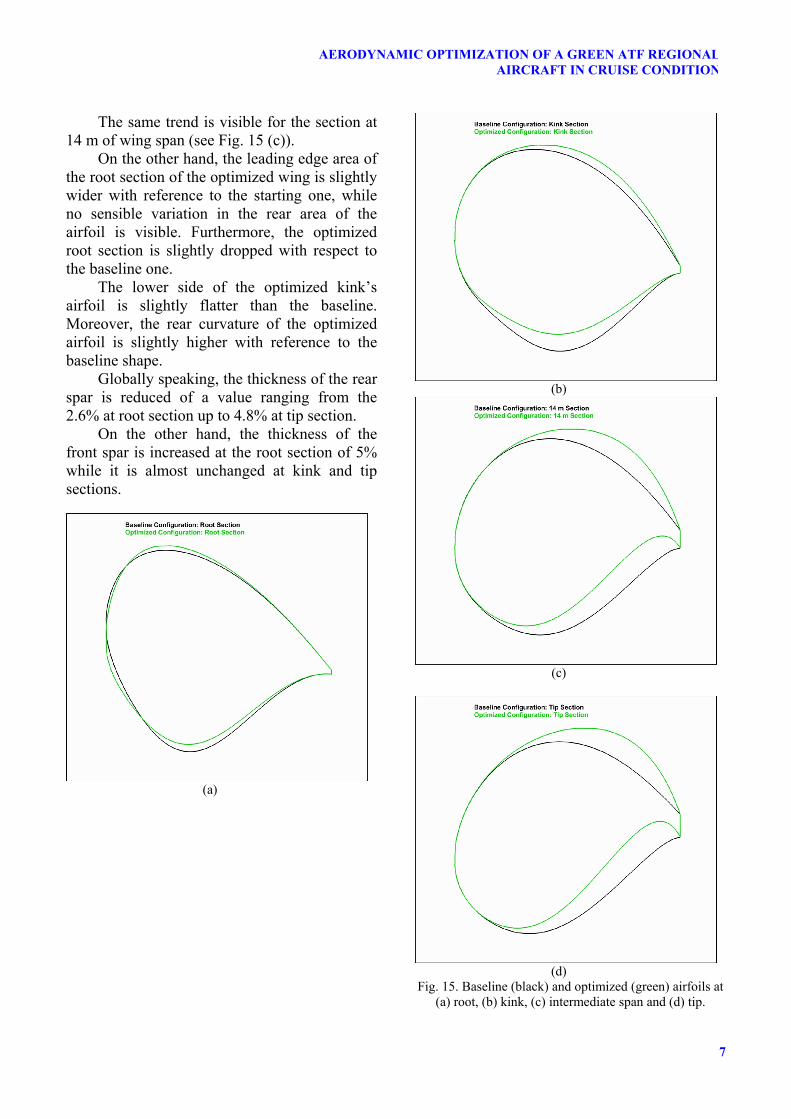
Fig. 15 depicts the comparison between the shapes of the initial reference airfoils (black lines) and the optimized ones (green lines). It can be noticed that the optimized tip section has a higher camber in its rear part with respect to the baseline design, in order to reduce the expansion peak on the leading edge area.
Moreover, the lower and upper tangents to the trailing edge are almost parallel, in order to reduce the separation area close to wing’s trailing edge.
7
AERODYNAMIC OPTIMIZATION OF A GREEN ATF REGIONALAIRCRAFT IN CRUISE CONDITION
The same trend is visible for the section at 14 m of wing span (see Fig. 15 (c)).
On the other hand, the leading edge area of the root section of the optimized wing is slightly wider with reference to the starting one, while no sensible variation in the rear area of the airfoil is visible. Furthermore, the optimized root section is slightly dropped with respect to the baseline one.
The lower side of the optimized kink’s airfoil is slightly flatter than the baseline. Moreover, the rear curvature of the optimized airfoil is slightly higher with reference to the baseline shape.
Globally speaking, the thickness of the rear spar is reduced of a value ranging from the 2.6% at root section up to 4.8% at tip section.
On the other hand, the thickness of the front spar is increased at the root section of 5% while it is almost unchanged at kink and tip sections.
(a)
(b)
(c)
(d)
Fig. 15. Baseline (black) and optimized (green) airfoils at (a) root, (b) kink, (c) intermediate span and (d) tip.
DIEGO GIUSEPPE ROMANO, MICHELE MANCINI
8
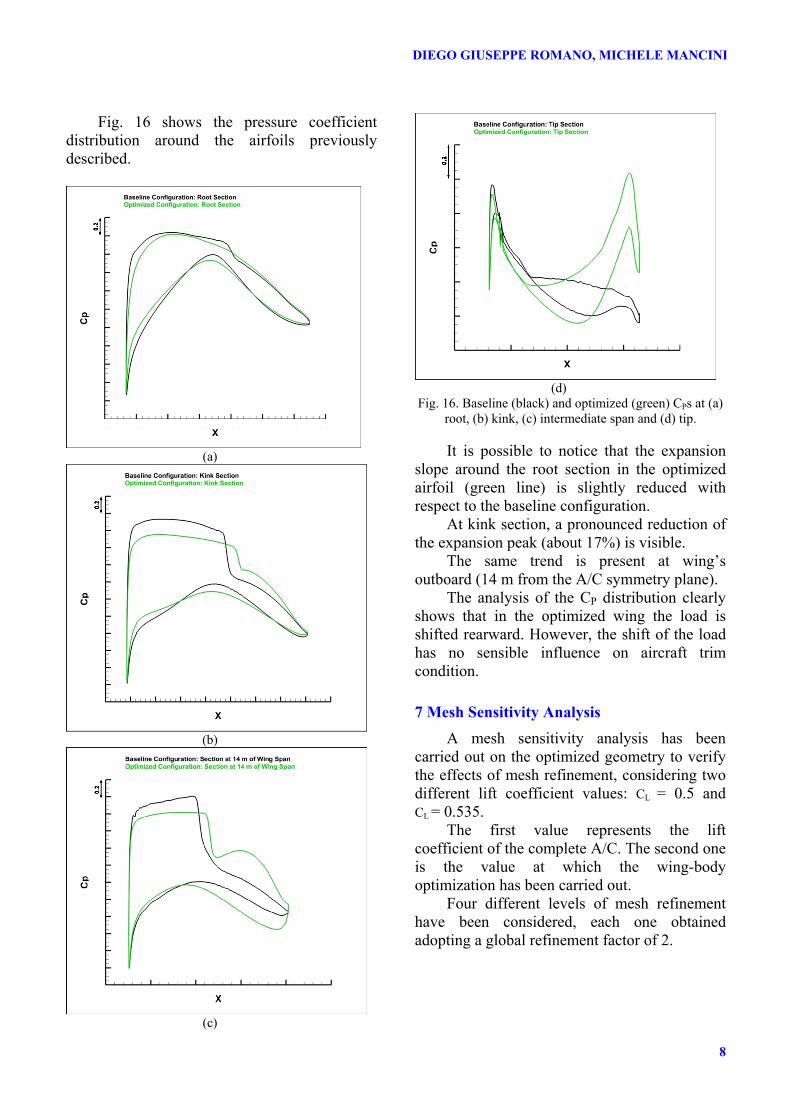
Fig. 16 shows the pressure coefficient distribution around the airfoils previously described.
(a)
(b)
(c)
(d)
Fig. 16. Baseline (black) and optimized (green) CPs at (a) root, (b) kink, (c) intermediate span and (d) tip.
It is possible to notice that the expansion
slope around the root section in the optimized airfoil (green line) is slightly reduced with respect to the baseline configuration.
At kink section, a pronounced reduction of the expansion peak (about 17%) is visible.
The same trend is present at wing’s outboard (14 m from the A/C symmetry plane).
The analysis of the CP distribution clearly shows that in the optimized wing the load is shifted rearward. However, the shift of the load has no sensible influence on aircraft trim condition.
7 Mesh Sensitivity Analysis
A mesh sensitivity analysis has been carried out on the optimized geometry to verify the effects of mesh refinement, considering two different lift coefficient values: CL = 0.5 and CL = 0.535.
The first value represents the lift coefficient of the complete A/C. The second one is the value at which the wing-body optimization has been carried out.
Four different levels of mesh refinement have been considered, each one obtained adopting a global refinement factor of 2.
9
AERODYNAMIC OPTIMIZATION OF A GREEN ATF REGIONALAIRCRAFT IN CRUISE CONDITION
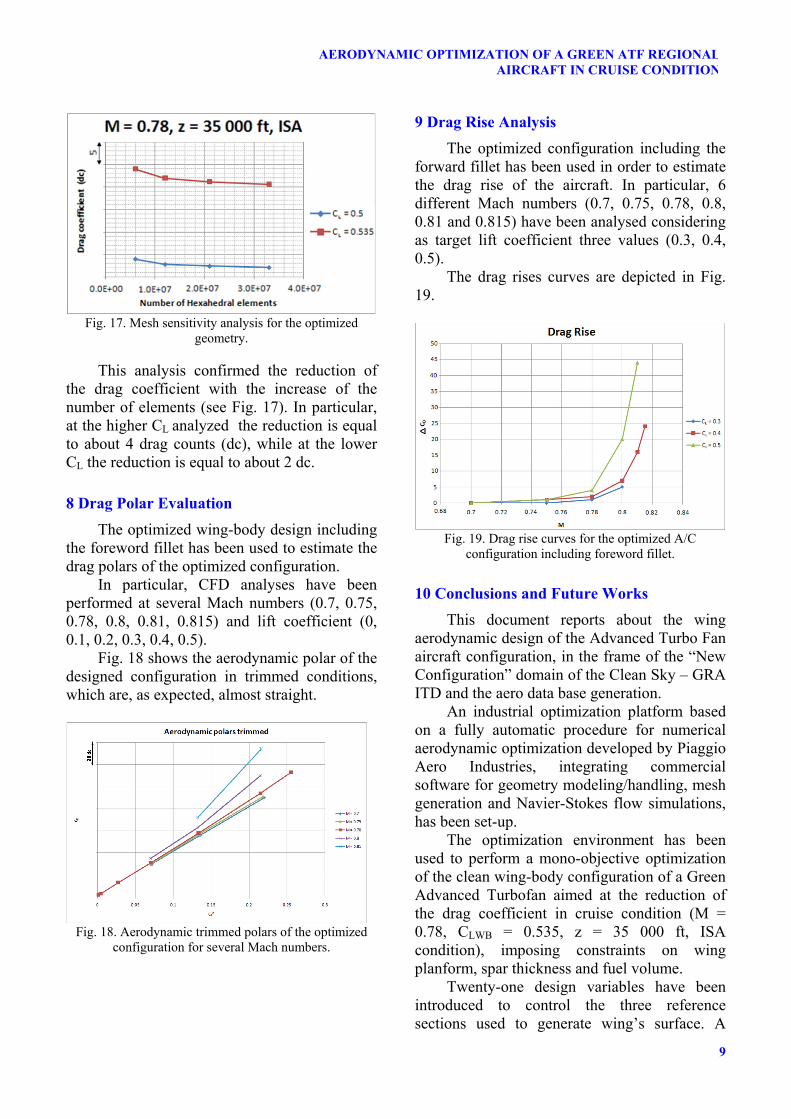
Fig. 17. Mesh sensitivity analysis for the optimized
geometry.
This analysis confirmed the reduction of the drag coefficient with the increase of the number of elements (see Fig. 17). In particular, at the higher CL analyzed the reduction is equal to about 4 drag counts (dc), while at the lower CL the reduction is equal to about 2 dc.
8 Drag Polar Evaluation
The optimized wing-body design including the foreword fillet has been used to estimate the drag polars of the optimized configuration.
In particular, CFD analyses have been performed at several Mach numbers (0.7, 0.75, 0.78, 0.8, 0.81, 0.815) and lift coefficient (0, 0.1, 0.2, 0.3, 0.4, 0.5).
Fig. 18 shows the aerodynamic polar of the designed configuration in trimmed conditions, which are, as expected, almost straight.
Fig. 18. Aerodynamic trimmed polars of the optimized
configuration for several Mach numbers.
9 Drag Rise Analysis
The optimized configuration including the forward fillet has been used in order to estimate the drag rise of the aircraft. In particular, 6 different Mach numbers (0.7, 0.75, 0.78, 0.8, 0.81 and 0.815) have been analysed considering as target lift coefficient three values (0.3, 0.4, 0.5).
The drag rises curves are depicted in Fig. 19.
Fig. 19. Drag rise curves for the optimized A/C
configuration including foreword fillet.
10 Conclusions and Future Works
This document reports about the wing aerodynamic design of the Advanced Turbo Fan aircraft configuration, in the frame of the “New Configuration” domain of the Clean Sky – GRA ITD and the aero data base generation.
An industrial optimization platform based on a fully automatic procedure for numerical aerodynamic optimization developed by Piaggio Aero Industries, integrating commercial software for geometry modeling/handling, mesh generation and Navier-Stokes flow simulations, has been set-up.
The optimization environment has been used to perform a mono-objective optimization of the clean wing-body configuration of a Green Advanced Turbofan aimed at the reduction of the drag coefficient in cruise condition (M = 0.78, CLWB = 0.535, z = 35 000 ft, ISA condition), imposing constraints on wing planform, spar thickness and fuel volume.
Twenty-one design variables have been introduced to control the three reference sections used to generate wing’s surface. A

DIEGO GIUSEPPE ROMANO, MICHELE MANCINI
10
multiblock structured mesh, generated in batch mode after an automatic update of the blocking topology to match the new geometry, has been used during the optimization loop to allow CFD solution restart without any re-meshing. In this way, time savings have been reached, allowing to perform a complete optimization in an industrial environment.
Dedicated routines to manage communication and data transfer between the different network machines involved in the optimization loop, as well as to provide the necessary software integration, handle all possible failures occurring during the procedure, and implement efficient run termination and convergence criteria, were developed.
The optimized geometry is characterized by a rear loading in the wing’s outboard area. As consequence, a sensible improvement of the aerodynamic behavior of the A/C has been reached (about 11% of gain in cruise efficiency with the introduction of a proper fillet at wing’s root).
A mesh sensitivity analysis has been carried out to analyze the effects of mesh refinement.
Moreover, the estimation of the aero data base (trimmed drag polars and drag rise analysis) of the A/C for several conditions in terms of Mach number and lift coefficient has been accomplished.
Further activities will be performed using CFD to design empennages and winglet, to integrate engine nacelle and pylon system and to generate the aero data base of the complete aircraft. Finally, aero targets imposed inside the GRA ITD project will be validated.
11 Acknowledgement
The research leading to the results showed in the present paper has received funding from the European Community's Seventh Framework Programme (FP7/2007-2013) for the Clean Sky Joint Technology Initiative under grant agreement n° CSJU-GAM-GRA-2008-001.
12 References
[1] http://www.cleansky.eu/.
[2] Roskam, J. Airplane Design Part II: Preliminary Configuration Design and Integration of the Propulsion System. DARcorporation, 1997.
[3] Dassault Systemes CATIA v5 R19 SP5 – Product Documentation.
[4] ANSYS ICEM CFD v12.1 – User’s Manual. [5] Kalitzin, G., Medic, G., Iaccarino, G. and Durbin, P.
Near-wall behavior of RANS turbulence models and implications for wall functions, Journal of Computational physics, 204 (2005) 265–291.
[6] Eymard, R., Gallouët, T. and Herbin, R. Handbook of Numerical Analysis, Vol. VII, 2000, p. 713-1020. Editors: P.G. Ciarlet and J.L. Lions.
[7] Metacomp Technologies Inc. CFD++ v10.1.2 R1 – User Manual.
[8] Menter, F R. Zonal Two Equation k-ω Turbulence Models for Aerodynamic Flows. AIAA Paper 93-2906, July 1993.
[9] 2006 Microsoft Corporation – Office Excel 2007 Product Guide.
[10] http://www.mathworks.it/index.html?s_tid=gn_logo. [11] Audet, Charles and J E Dennis Jr. Analysis of
Generalized Pattern Searches. SIAM Journal on Optimization, Volume 13, Number 3, 2003, pp. 889–903.
13 Contact Author Email Address
mailto [email protected] mailto [email protected] mailto [email protected] mailto [email protected]
Copyright Statement
The authors confirm that they, and/or their company or organization, hold copyright on all of the original material included in this paper. The authors also confirm that they have obtained permission, from the copyright holder of any third party material included in this paper, to publish it as part of their paper. The authors confirm that they give permission, or have obtained permission from the copyright holder of this paper, for the publication and distribution of this paper as part of the ICAS 2014 proceedings or as individual off-prints from the proceedings.