Embed Size (px)
Citation preview
Paper ID #15014
Aerodynamic Performance of the NACA 2412 Airfoil at Low Reynolds Num-ber
Dr. John E Matsson, Oral Roberts University
John Matsson is a Professor of Mechanical Engineering at Oral Roberts University in Tulsa, OK. Heearned M.S. and Ph.D. degrees from the Royal Institute of Technology in Stockholm, Sweden in 1988and 1994 respectively.
John A. Voth, Oral Roberts University
John Voth is a current Sophomore Undergraduate student at Oral Roberts University studying mechanicalengineering. He is also a member of he American Society of Mechanical Engineers and a Fellow inORU’s Honors Program.
Mr. Connor A. McCain, Oral Roberts University
Connor McCain is an undergraduate engineering student at Oral Roberts University
Mr. Connor McGraw, Oral Roberts University
Connor McGraw is currently a sophomore at Oral Roberts University studying Mechanical Engineering.
c©American Society for Engineering Education, 2016
Aerodynamic Performance of the NACA 2412
Airfoil at Low Reynolds Number
Abstract
This paper shows a project by three honors students in an undergraduate engineering program.
Students used a 3D printer to fabricate a wing section of the NACA 2412 airfoil. The section has
a chord length of 230 mm and a total assembled width of 305 mm. The wing was printed in three
separate, hollow sections including a 25mm wide inner section and two 140mm wide outer
sections assembled on each side of the inner section. The inner section contained 36 surface
holes that were attached by copper tubes and Tygon tubing connected to a multi-manometer. The
experiments were compared with CFD simulations using ANSYS Fluent software. Detailed
descriptions of the experimental design, fabrication, set-up, learning process and cost are
included in the paper together with links to tutorials to repeat the experimental setup as well as a
tutorial of the mesh generation and settings for the CFD simulations. Finally, the paper will
provide a description of the outcomes for the project, student involvement and response, and an
assessment of the student learning procedure.
Introduction
The experimental setup described in this paper is used for hands-on learning experience in labs
for the introduction to engineering, fluid mechanics, and experimental methods courses at the
university. Students who complete these labs apply conceptual knowledge that they have gained
from multiple undergraduate courses. The point of this experiment is to familiarize students with
a few basic aerospace concepts and terms such as Reynold’s number, coefficient of lift, and
coefficient of pressure1-4
. Furthermore, it teaches students how to read a multi-manometer5 and
perform and compare calculations obtained from experimental data and theoretical/virtual
simulations.
This experimental setup was inspired by a published paper by Dr. John Matsson titled, “A
Student Project on Airfoil Performance”6. In his experiment, data gathered from LabVIEW
software is compared to data obtained from CosmosFloWorks. The experiment detailed in this
paper, however, contributes the use of the powerful simulation software ANSYS, as well as data
obtained from a student designed multi-manometer, which allows students to observe the real-
time effects of the experiment. In addition, the airfoil in this experiment was 3D printed in order
to provide more precise results and allow for additional measurement points.
The wing used in this experiment is an extrusion of the NACA 2412 airfoil. The wing was 3D
printed in three hollow sections and joined together by two aluminum spars that spanned the
width of the three sections. The locations for the surface holes were precisely placed in the
SOLIDWORKS model and were created during the printing process using an Objet24 printer.
The multi-manometer was designed and constructed by the honors students. The model was
conceived in SOLIDWORKS before being fabricated in the university machine shop. It contains
thirty-six separate tubes joined together on a board. The board is hinged to a base and is capable
of resting at 30, 35, 40, 45, and 50 degrees above the horizontal base. Polycarbonate tubing is
used for the straight section of each of the individual manometers. Tygon tubing connects the top
ends of the polycarbonate tubing to the surface holes along the wing. Tygon tubing is also used
to connect the bottom ends of the polycarbonate tubes to a colored-water filled container. (A
detailed explanation of the design and fabrication of the multi-manometer can be found in the
appendix.)
ANSYS software was used for virtual testing of the aerodynamics of the NACA 2412 airfoil.
Using the Fluid Flow (Fluent) solver7, the coordinates of the NACA 2412 airfoil were rotated
against the wind velocity vector to simulate varying angles of attack. Then, the theoretical
coefficients of drag and lift were calculated at varying levels of mesh quality to compare with the
experimental results.
The NACA 2412 airfoil is part of the NACA 4 digit series of airfoil classification8. The four
digits are determined by the characteristics of the airfoil in the following way:
1. The first digit describes the maximum camber as a percent of the chord.
2. The second digit describes the location of that maximum camber measured from the
leading edge in percent of the chord.
3. The final two digits describe the maximum thickness of the airfoil in percent of the chord.
With all percentages given in respect to the length of the chord, the classification of the NACA
2412 determines that the airfoil has a maximum camber of 2% located at 40% from the leading
edge, with a maximum thickness of 12%.
The professor desired to experiment with the learning process of the honors students. He
provided them with a project and allowed them to learn about the different subjects involved
while they worked to complete this project rather than teaching all of the information to them
before they attempted the project. He offered instruction throughout the process, but also allowed
some learning through failure. The students learned new aspects of SOLIDWORKS, ANSYS,
and manufacturing by practical experience during this project.
Theory
The pressure distribution over the surface of the airfoil is described by the dimensionless
parameter known as the coefficient of pressure
𝐶𝑝 =𝑝−𝑝∞
1
2𝜌∞𝑉∞
2=
𝑝−𝑝∞
𝑝0−𝑝∞= 1 − (
𝑉
𝑉∞)
2
(1)
where the velocity ratio is defined by,
𝑉
𝑉∞= √
𝑝0−𝑝
𝑝0−𝑝∞ (2)
where 𝑉∞ is the freestream fluid velocity, 𝑝0 is the stagnation pressure9 that is assumed to be
constant through the whole flow-field, 𝑝∞ is the freestream static pressure, 𝜌∞ is the density of
air, 𝑝 is the pressure at a specific point along the surface of the airfoil, and 𝑉 is the fluid velocity
at the same point.
The freestream fluid velocity is determined from Bernoulli’s equation,
𝑝0 = 𝑝∞ +1
2𝜌∞𝑉∞
2 (3)
𝑉∞ = √2(𝑝0−𝑝∞)
𝜌∞ (4)
The pressure difference 𝑝0 − 𝑝∞ is determined by,
𝑝0 − 𝑝∞ = 𝜌𝑤𝑔𝛥ℎ𝑣 (5)
𝛥ℎ𝑣 = 𝛥ℎ𝑚𝑒𝑎𝑠𝑢𝑟𝑒𝑑𝑠𝑖𝑛(𝛼) (6)
where 𝜌𝑤 is the density of water, 𝑔 is the gravitational acceleration constant, 𝛥ℎ𝑣 is the vertical
height difference, 𝛥ℎ𝑚𝑒𝑎𝑠𝑢𝑟𝑒𝑑 is the measured change in height of the water in the multi-
manometer, and 𝛼 is the angle the multi-manometer makes with the horizontal base.
The density of air 𝜌∞ is found using the ideal gas law,
𝜌∞ =𝑝𝑎𝑡𝑚
𝑅𝑇 (7)
where 𝑝𝑎𝑡𝑚 is the atmospheric pressure measured in Pascals, 𝑇 is the temperature measured in
Kelvin, and 𝑅 is the universal gas constant, measured in J/kg*K. For dry air,
𝑅 = 287.058 𝐽
𝑘𝑔∗𝐾 (8)
Assuming negligible friction, a thin airfoil, and a small angle of attack, a relationship between
the coefficient of lift 𝐶𝐿 and coefficient of pressure 𝐶𝑝 can be derived,
𝐶𝐿 =1
𝑐∫ (𝐶𝑝,𝐿 − 𝐶𝑝,𝑈)𝑑𝑥
𝑐
0 (9)
where 𝑐 is the length of the chord, and 𝐶𝑝,𝐿 and 𝐶𝑝,𝑈 are the pressure coefficients on the lower
and upper surfaces of the airfoil respectively. The coefficient of lift is the area enclosed by the
difference in coefficients of pressure.
We define the Reynolds number based on the free stream velocity and the chord length
𝑅𝑒 =𝑉∞𝑐𝜌∞
𝜇 (10)
where 𝜇 is the dynamic viscosity of the air.
Design
The NACA 2412 airfoil was designed and printed as three separate parts. The central part is
mostly hollow, containing two slots which a metal bar acting as a spar runs through to connect
the three parts. On the surface of the central part, there are 36 small holes that are distributed
strategically across the top and bottom of the airfoil. On either side of the central part are two
larger outer parts that complete the wing. These sections act chiefly as support, but still maintain
the contour of the NACA 2412. Both outer parts are mostly hollow, with only two slots for the
spars to connect the entire model. These outer parts contain a larger hole so the Tygon tubing can
exit the wing. Hollow metal bars also extrude from the large holes so the wing may be suspended
in the wind tunnel. After a 3D printer fabricated the wing, thirty-six copper tubes with the same
outer diameter as the surface holes were inserted into the surface holes in the central part. Tygon
tubing was then connected to the copper tubes and numbered with respect to the holes’ locations.
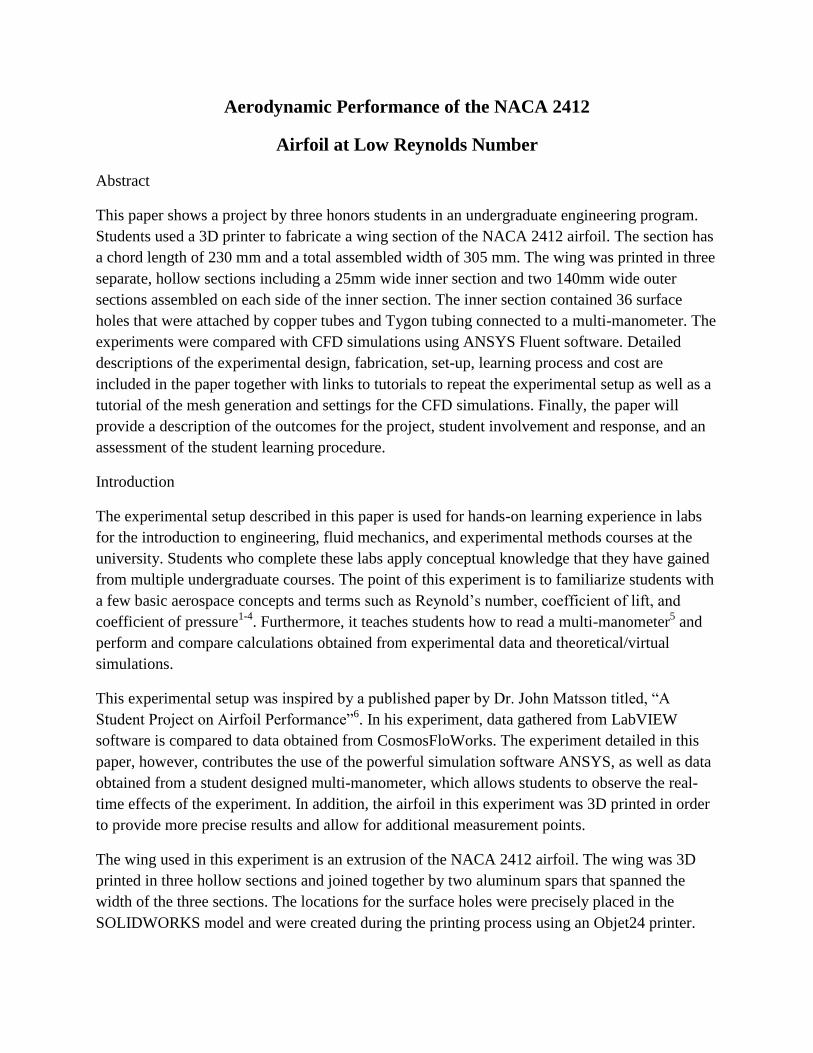
All three parts of the wing were assembled with the Tygon tubes fitting through the
aforementioned metal bars (Figure 1), and then the wing was suspended in the wind tunnel.
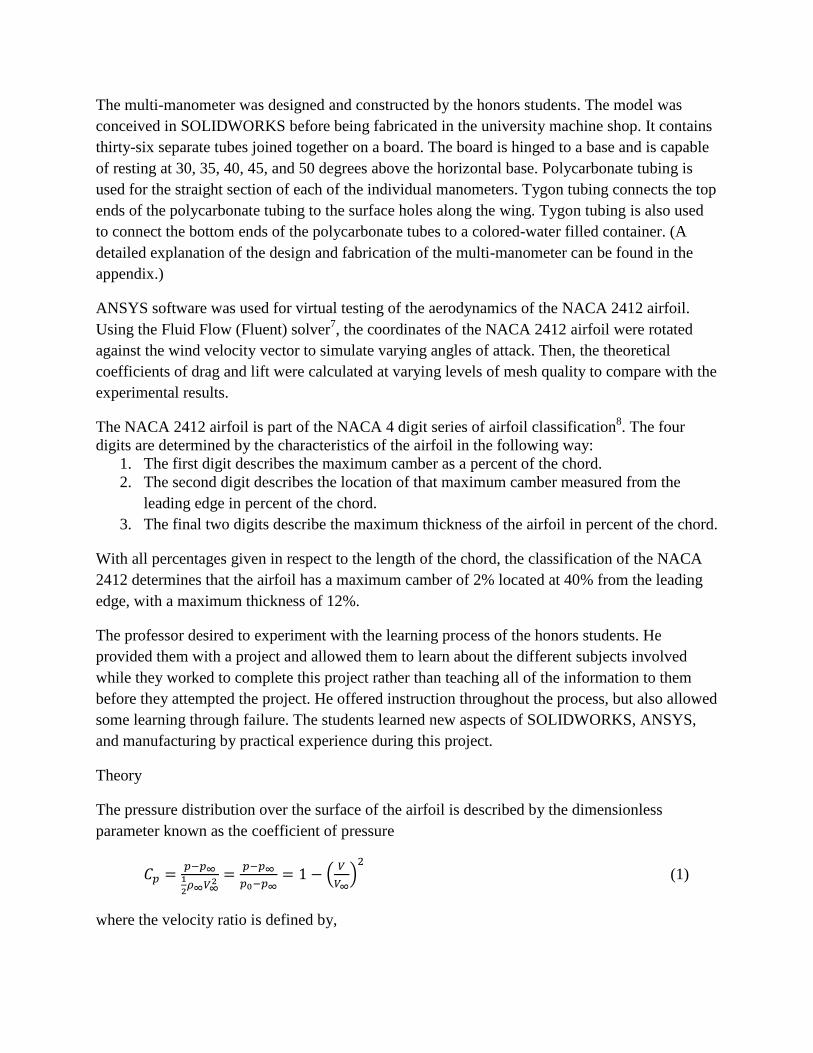
Figure 1: Assembled airfoil with tubing Figure 2: Multi-Manometer
A multi-manometer was used to measure the pressure distribution of the airfoil. The Tygon tubes
were connected to larger Tygon tubes using vacuum connectors. The larger Tygon tubes then
connected to the multi-manometer, which was built from scratch by the students in their
university’s machine shop. The multi-manometer is composed of tubes filled with colored water
that lie against a straight, white backboard. As the airflow around the airfoil produces varying
pressure according to the holes’ positions, the height of the water varies accordingly (Figure 2).
After measuring the heights of the fluid in each of the tubes, the airfoil’s pressure distribution
may be computed.
ANSYS Calculations
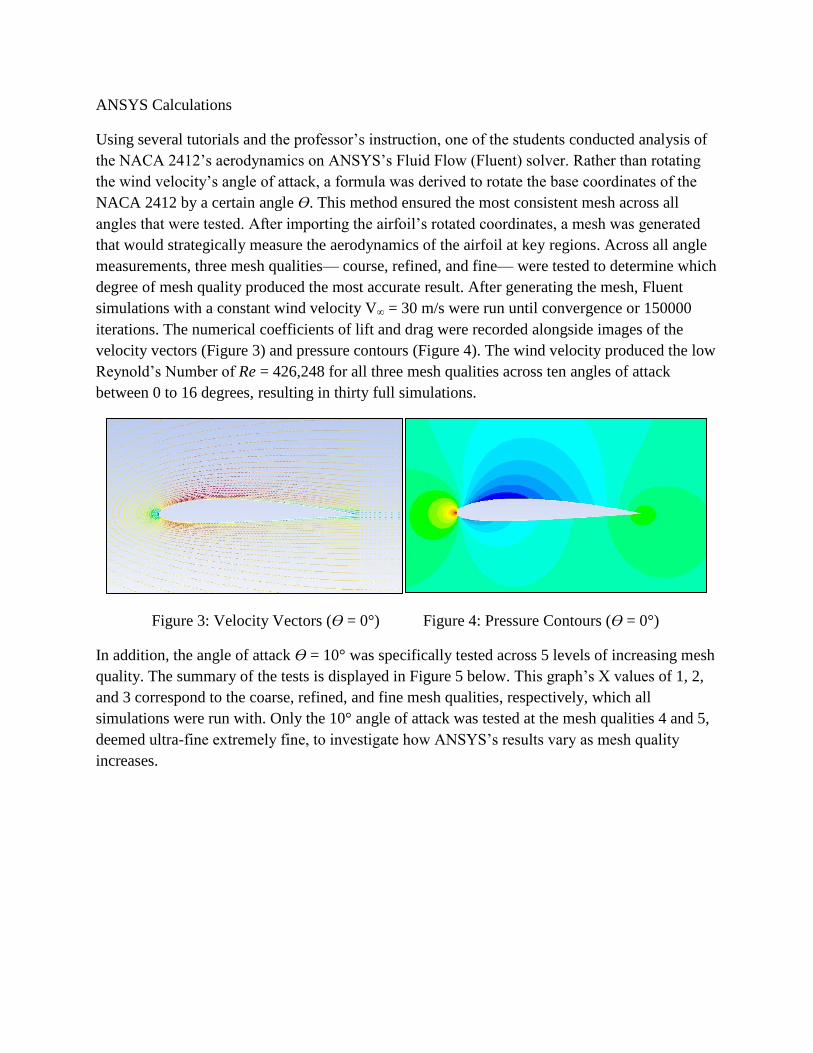
Using several tutorials and the professor’s instruction, one of the students conducted analysis of
the NACA 2412’s aerodynamics on ANSYS’s Fluid Flow (Fluent) solver. Rather than rotating
the wind velocity’s angle of attack, a formula was derived to rotate the base coordinates of the
NACA 2412 by a certain angle ϴ. This method ensured the most consistent mesh across all
angles that were tested. After importing the airfoil’s rotated coordinates, a mesh was generated
that would strategically measure the aerodynamics of the airfoil at key regions. Across all angle
measurements, three mesh qualities— course, refined, and fine— were tested to determine which
degree of mesh quality produced the most accurate result. After generating the mesh, Fluent
simulations with a constant wind velocity V∞ = 30 m/s were run until convergence or 150000
iterations. The numerical coefficients of lift and drag were recorded alongside images of the
velocity vectors (Figure 3) and pressure contours (Figure 4). The wind velocity produced the low
Reynold’s Number of Re = 426,248 for all three mesh qualities across ten angles of attack
between 0 to 16 degrees, resulting in thirty full simulations.
Figure 3: Velocity Vectors (ϴ = 0°) Figure 4: Pressure Contours (ϴ = 0°)
In addition, the angle of attack ϴ = 10° was specifically tested across 5 levels of increasing mesh
quality. The summary of the tests is displayed in Figure 5 below. This graph’s X values of 1, 2,
and 3 correspond to the coarse, refined, and fine mesh qualities, respectively, which all
simulations were run with. Only the 10° angle of attack was tested at the mesh qualities 4 and 5,
deemed ultra-fine extremely fine, to investigate how ANSYS’s results vary as mesh quality
increases.
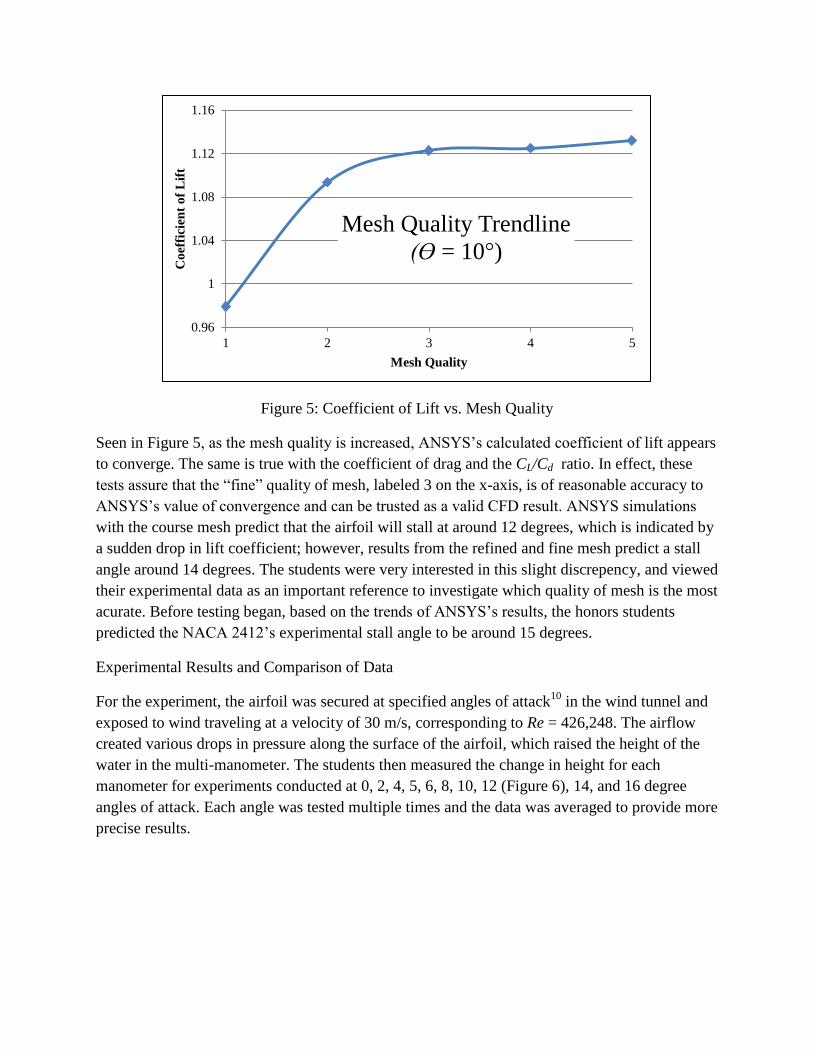
Figure 5: Coefficient of Lift vs. Mesh Quality
Seen in Figure 5, as the mesh quality is increased, ANSYS’s calculated coefficient of lift appears
to converge. The same is true with the coefficient of drag and the CL/Cd ratio. In effect, these
tests assure that the “fine” quality of mesh, labeled 3 on the x-axis, is of reasonable accuracy to
ANSYS’s value of convergence and can be trusted as a valid CFD result. ANSYS simulations
with the course mesh predict that the airfoil will stall at around 12 degrees, which is indicated by
a sudden drop in lift coefficient; however, results from the refined and fine mesh predict a stall
angle around 14 degrees. The students were very interested in this slight discrepency, and viewed
their experimental data as an important reference to investigate which quality of mesh is the most
acurate. Before testing began, based on the trends of ANSYS’s results, the honors students
predicted the NACA 2412’s experimental stall angle to be around 15 degrees.
Experimental Results and Comparison of Data
For the experiment, the airfoil was secured at specified angles of attack10
in the wind tunnel and
exposed to wind traveling at a velocity of 30 m/s, corresponding to Re = 426,248. The airflow
created various drops in pressure along the surface of the airfoil, which raised the height of the
water in the multi-manometer. The students then measured the change in height for each
manometer for experiments conducted at 0, 2, 4, 5, 6, 8, 10, 12 (Figure 6), 14, and 16 degree
angles of attack. Each angle was tested multiple times and the data was averaged to provide more
precise results.
0.96
1
1.04
1.08
1.12
1.16
1 2 3 4 5
Co
effi
cien
t o
f L
ift
Mesh Quality
Mesh Quality Trendline
(ϴ = 10°)
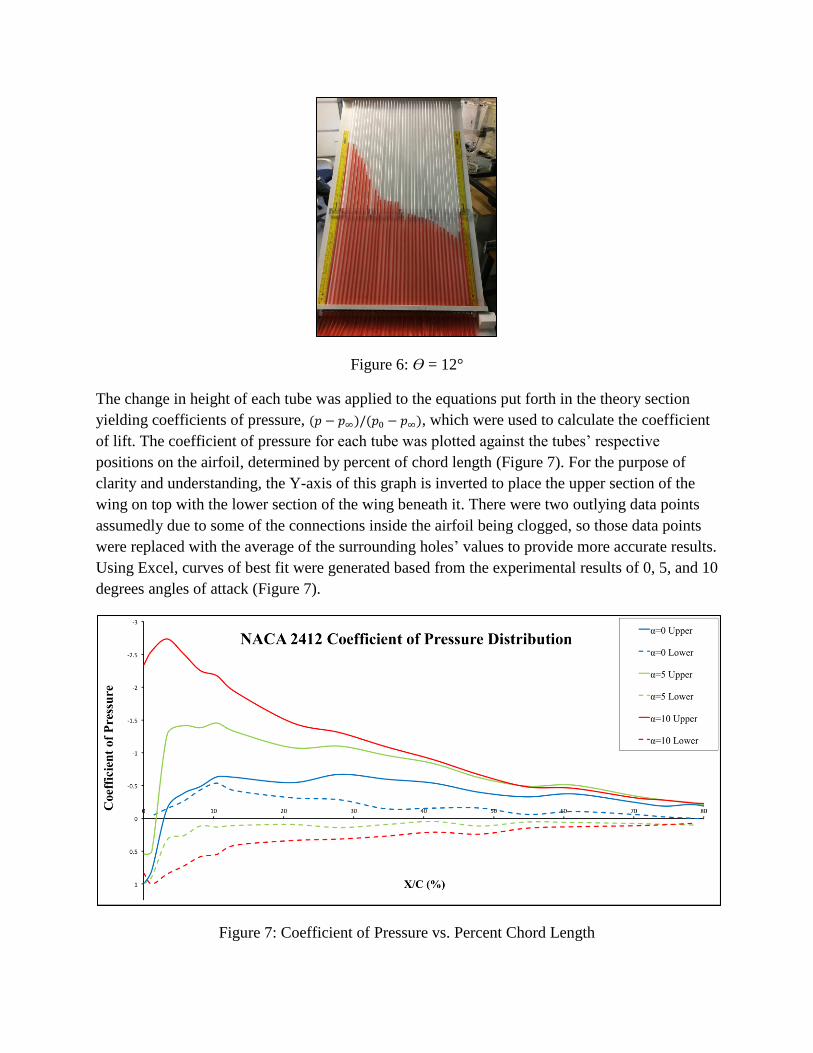
Figure 6: ϴ = 12°
The change in height of each tube was applied to the equations put forth in the theory section
yielding coefficients of pressure, (𝑝 − 𝑝∞)/(𝑝0 − 𝑝∞), which were used to calculate the coefficient
of lift. The coefficient of pressure for each tube was plotted against the tubes’ respective
positions on the airfoil, determined by percent of chord length (Figure 7). For the purpose of
clarity and understanding, the Y-axis of this graph is inverted to place the upper section of the
wing on top with the lower section of the wing beneath it. There were two outlying data points
assumedly due to some of the connections inside the airfoil being clogged, so those data points
were replaced with the average of the surrounding holes’ values to provide more accurate results.
Using Excel, curves of best fit were generated based from the experimental results of 0, 5, and 10
degrees angles of attack (Figure 7).
Figure 7: Coefficient of Pressure vs. Percent Chord Length
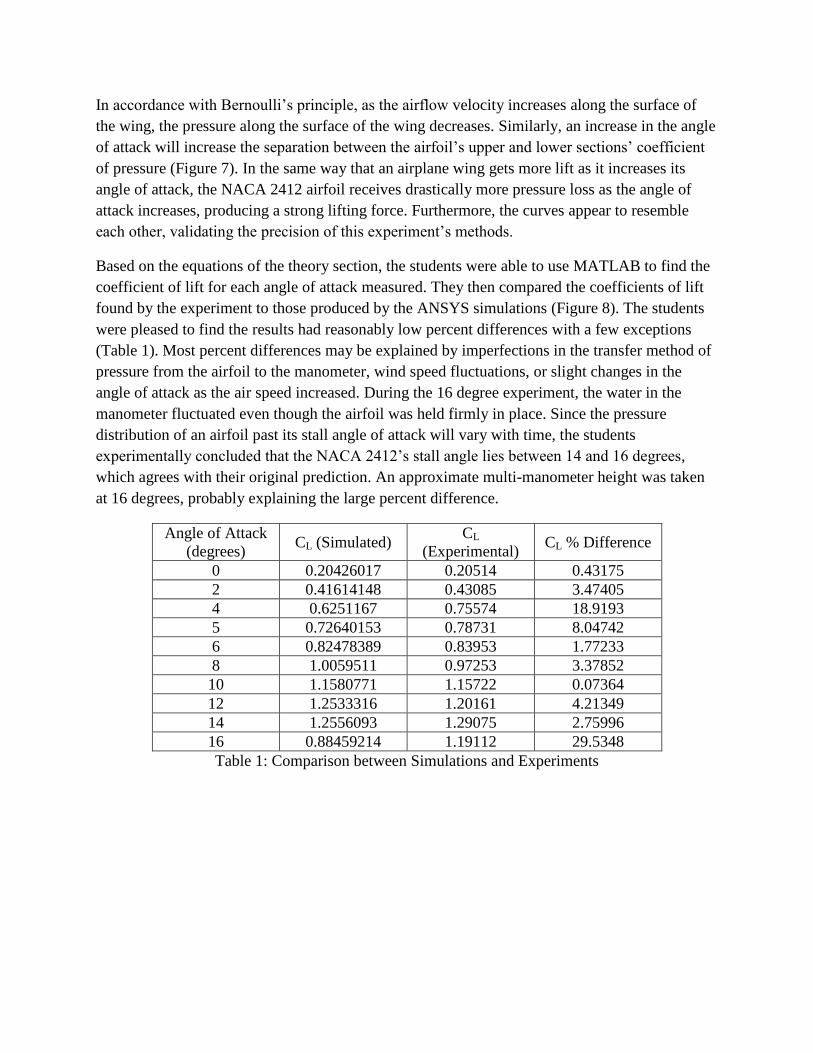
In accordance with Bernoulli’s principle, as the airflow velocity increases along the surface of
the wing, the pressure along the surface of the wing decreases. Similarly, an increase in the angle
of attack will increase the separation between the airfoil’s upper and lower sections’ coefficient
of pressure (Figure 7). In the same way that an airplane wing gets more lift as it increases its
angle of attack, the NACA 2412 airfoil receives drastically more pressure loss as the angle of
attack increases, producing a strong lifting force. Furthermore, the curves appear to resemble
each other, validating the precision of this experiment’s methods.
Based on the equations of the theory section, the students were able to use MATLAB to find the
coefficient of lift for each angle of attack measured. They then compared the coefficients of lift
found by the experiment to those produced by the ANSYS simulations (Figure 8). The students
were pleased to find the results had reasonably low percent differences with a few exceptions
(Table 1). Most percent differences may be explained by imperfections in the transfer method of
pressure from the airfoil to the manometer, wind speed fluctuations, or slight changes in the
angle of attack as the air speed increased. During the 16 degree experiment, the water in the
manometer fluctuated even though the airfoil was held firmly in place. Since the pressure
distribution of an airfoil past its stall angle of attack will vary with time, the students
experimentally concluded that the NACA 2412’s stall angle lies between 14 and 16 degrees,
which agrees with their original prediction. An approximate multi-manometer height was taken
at 16 degrees, probably explaining the large percent difference.
Angle of Attack
(degrees) CL (Simulated)
CL
(Experimental) CL % Difference
0 0.20426017 0.20514 0.43175
2 0.41614148 0.43085 3.47405
4 0.6251167 0.75574 18.9193
5 0.72640153 0.78731 8.04742
6 0.82478389 0.83953 1.77233
8 1.0059511 0.97253 3.37852
10 1.1580771 1.15722 0.07364
12 1.2533316 1.20161 4.21349
14 1.2556093 1.29075 2.75996
16 0.88459214 1.19112 29.5348
Table 1: Comparison between Simulations and Experiments
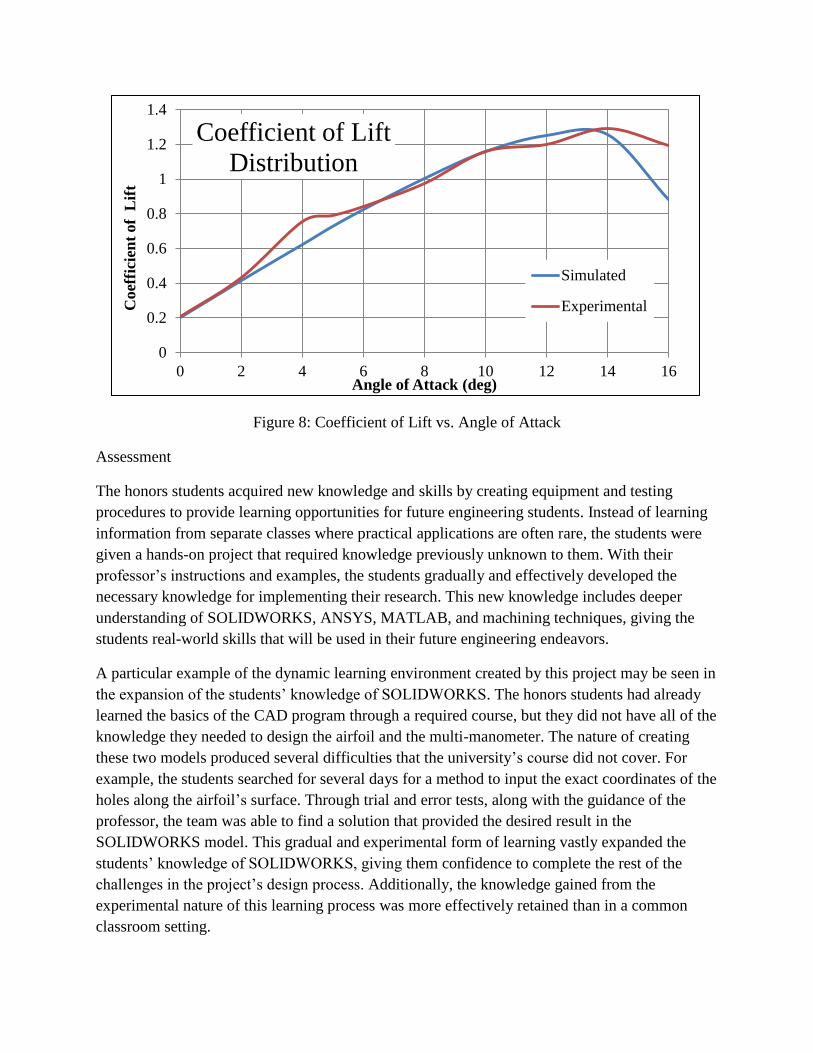
Figure 8: Coefficient of Lift vs. Angle of Attack
Assessment
The honors students acquired new knowledge and skills by creating equipment and testing
procedures to provide learning opportunities for future engineering students. Instead of learning
information from separate classes where practical applications are often rare, the students were
given a hands-on project that required knowledge previously unknown to them. With their
professor’s instructions and examples, the students gradually and effectively developed the
necessary knowledge for implementing their research. This new knowledge includes deeper
understanding of SOLIDWORKS, ANSYS, MATLAB, and machining techniques, giving the
students real-world skills that will be used in their future engineering endeavors.
A particular example of the dynamic learning environment created by this project may be seen in
the expansion of the students’ knowledge of SOLIDWORKS. The honors students had already
learned the basics of the CAD program through a required course, but they did not have all of the
knowledge they needed to design the airfoil and the multi-manometer. The nature of creating
these two models produced several difficulties that the university’s course did not cover. For
example, the students searched for several days for a method to input the exact coordinates of the
holes along the airfoil’s surface. Through trial and error tests, along with the guidance of the
professor, the team was able to find a solution that provided the desired result in the
SOLIDWORKS model. This gradual and experimental form of learning vastly expanded the
students’ knowledge of SOLIDWORKS, giving them confidence to complete the rest of the
challenges in the project’s design process. Additionally, the knowledge gained from the
experimental nature of this learning process was more effectively retained than in a common
classroom setting.
0
0.2
0.4
0.6
0.8
1
1.2
1.4
0 2 4 6 8 10 12 14 16
Coef
fici
ent
of
Lif
t
Angle of Attack (deg)
Coefficient of Lift
Distribution
Simulated
Experimental
The manufacturing process of the airfoil and multi-manometer also proved to be a great
educational tool to teach various machining techniques. Even with some previous experience in
the machine shop, the honors students were highly unqualified for the machining required by this
project. By partnering with the professor and machine shop technician, the team of students was
able to successfully replicate their SOLIDWORKS designs. The painstaking processes of
inserting 36 copper tubes into the airfoil’s holes, experimentally finding the optimal position for
multi-manometer’s base’s holes, and determining how to guide pressure flow from the airfoil to
the multi-manometer taught students valuable lessons about manufacturing and machining.
Many times the honors students realized their initial machining attempts needed revisions
because the process could be accomplished more efficiently and accurately through a different
method. At the beginning of the project, the students needed almost constant supervision and
assistance, but by the completion of their research, the students were almost entirely self-
sufficient in the machine shop. The manufacturing process provided the students with a hands-on
experience and knowledge about their specific project and general machining procedures that are
difficult to impart in a typical classroom setting. After completing the fabrication and testing of
the airfoil and multi-manometer, the students viewed their results as verification of CFD
software. Designing, building, and testing an airfoil via multi-manometer is a valuable learning
experience but is also an expensive and long process. For future engineering endeavors, the
honors students will have the experience to confidently use CFD software as an effective
alternative to real-world testing. The completion of this project allowed the students to receive
practical experience that they will bring into their future careers.
In addition to the individual learning of the honors students, the multi-manometer and 3D printed
airfoil will be used in future labs at the university in at least two classes. In the first course,
Introduction to Engineering, students will gain a basic understanding of aerodynamics through
airfoil and multi-manometer demonstrations. The airfoil’s visual example will be coupled with
data recorded from the multi-manometer so that the wing’s pressure distribution may be
calculated. A main goal for this lab is to improve the retention rate for freshmen engineering
students by exhibiting an interesting and interactive experiment.
A second course, Fluid Mechanics, has already implemented the experiment outlined in this
paper into the curriculum in order to further the students’ understanding of the coefficient of lift
at varying angles of attack. After solving for the coefficient of lift using the multi-manometer,
they construct an ANSYS simulation in order to provide a digital comparison to the experimental
data. The honors students created an ANSYS tutorial, available by following the appendix’s link,
which instructs how to simulate airflow to find the lift coefficients for different Reynold’s
numbers and angles of attack. In order to improve the lab, current students in the Fluid
Mechanics class were asked about their experience with the experiment and if it was able to help
them better understand the subject matter. Almost all of the students mentioned that it was
helpful to see the real time effects of the pressure difference across a wing. One student
mentioned, “It was good to see the practical proof of a lab we’ve done in SOLIDWORKS
multiple times.” Other students said it helped them better understand the theory behind the
coefficient of lift and how it relates to angle of attack. A greater understanding of the importance
of pressure difference over the top and bottom of the airfoil was also mentioned. Furthermore,
the experiment gave all the students a better understanding of how to operate both a wind tunnel
and a multi-manometer. Many students stressed that the visual aspect of the multi-manometer
was aesthetically pleasing and gave them a greater interest in the subject matter. Overall, the
students were grateful for the opportunity to gain hands-on experience and compare real-world
data to their computer-simulated data. As a result of this project, many university students will
benefit from new, exciting laboratory experiences.
Conclusion
This paper has shown a research project where the students designed, manufactured, and tested
an airfoil section and a multi-manometer, calculating the coefficient of lift across the surface of
the NACA 2412 at varying angles of attack. The students’ experimental methods were effective,
indicated by the coefficient of lift closely resembling the simulated results predicted by ANSYS.
Because an undergraduate degree in engineering requires a daunting amount of materiel to be
learned, students often struggle to obtain practical experience. This project successfully
partnered typical classroom learning with real-world applications. Through instruction from the
professor and the students’ studies, an extremely effective learning atmosphere was
demonstrated.
Bibliography
1. Warner E.P. “Airplane Design: Performance.” McGraw-Hill, New York, 1936
2. Riegels F.W. “Airfoil Sections.” Butterworths, London, 1961.
3. Mason W.H. “Experiment 7-Aero/Hydrodynamic Testing.”
(http://www.aoe.vt.edu/~devenpor/aoe3054/manual/expt7/text.html)
4. Jacobs E.N., Stack J. and Pinkerton R.M. “Airfoil Pressure Distribution Investigation in the Variable
Density Wind Tunnel.” NACA Report No. 353, 1930.
5. Stern F., Muste M., Houser D., Wilson M. and Ghosh S. “Measurement of Pressure Distribution and Forces
acting on an Airfoil.”, Laboratory Experiment #3, 57:020 Mechanics of Fluids and Transfer Processes
(http://css.engineering/uiowa.edu/fluidslab/pdfs/57-020/airfoil.doc)
6. Matsson, J. (2007, June), A Student Project On Airfoil Performance Paper presented at 2007 Annual
Conference & Exposition, Honolulu, Hawaii. https://peer.asee.org/1500
7. Mullen J.B. “FLUENT – Flow over an Airfoil”
(https://confluence.cornell.edu/display/SIMULATION/FLUENT+-+Flow+over+an+Airfoil)
8. “A Description of the NACA 4-Digit System” (http://www.akiti.ca/NACA4Bkgrnd.html)
9. Extech Instruments HD755 Differential Pressure Manometer
(http://www.extech.com/instruments/product.asp?catid=15&prodid=502)
10. M-D Building Projects 60cm Digital Level (http://www.mdteam.com/index.php/products/smarttool)
Appendix
Link to public drobox (all blind copy tutorial pdf’s):
https://www.dropbox.com/sh/zjofb67qokgjciw/AADcrGb8fyY4CLV8jNDVxMNKa?dl=0
The total cost of the project is $1611.14, excluding the cost of the wind tunnel and computer. A table of costs may
be seen on the following page:
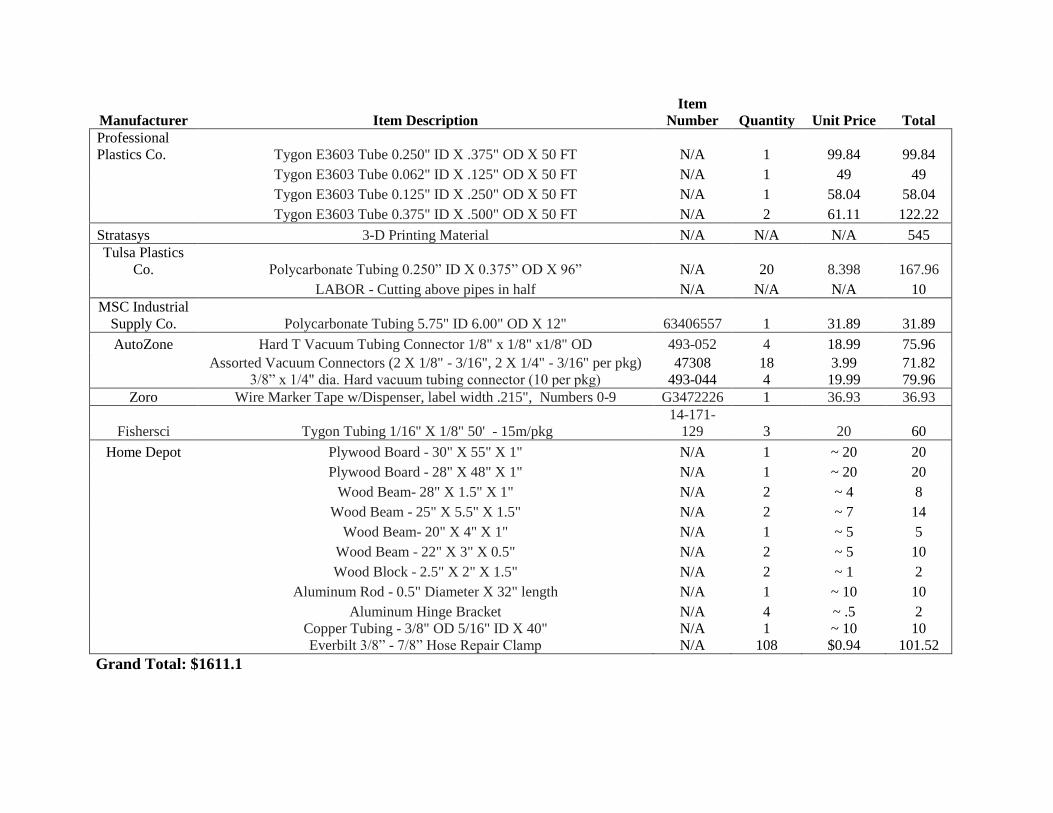
Manufacturer Item Description
Item
Number Quantity Unit Price Total
Professional
Plastics Co. Tygon E3603 Tube 0.250" ID X .375" OD X 50 FT N/A 1 99.84 99.84
Tygon E3603 Tube 0.062" ID X .125" OD X 50 FT N/A 1 49 49
Tygon E3603 Tube 0.125" ID X .250" OD X 50 FT N/A 1 58.04 58.04
Tygon E3603 Tube 0.375" ID X .500" OD X 50 FT N/A 2 61.11 122.22
Stratasys 3-D Printing Material N/A N/A N/A 545
Tulsa Plastics
Co. Polycarbonate Tubing 0.250” ID X 0.375” OD X 96” N/A 20 8.398 167.96
LABOR - Cutting above pipes in half N/A N/A N/A 10
MSC Industrial
Supply Co. Polycarbonate Tubing 5.75" ID 6.00" OD X 12" 63406557 1 31.89 31.89
AutoZone Hard T Vacuum Tubing Connector 1/8" x 1/8" x1/8" OD 493-052 4 18.99 75.96
Assorted Vacuum Connectors (2 X 1/8" - 3/16", 2 X 1/4" - 3/16" per pkg)
3/8” x 1/4" dia. Hard vacuum tubing connector (10 per pkg)
47308
493-044
18
4
3.99
19.99
71.82
79.96
Zoro Wire Marker Tape w/Dispenser, label width .215", Numbers 0-9 G3472226 1 36.93 36.93
Fishersci Tygon Tubing 1/16" X 1/8" 50' - 15m/pkg
14-171-
129 3 20 60
Home Depot Plywood Board - 30" X 55" X 1" N/A 1 ~ 20 20
Plywood Board - 28" X 48" X 1" N/A 1 ~ 20 20
Wood Beam- 28" X 1.5" X 1" N/A 2 ~ 4 8
Wood Beam - 25" X 5.5" X 1.5" N/A 2 ~ 7 14
Wood Beam- 20" X 4" X 1" N/A 1 ~ 5 5
Wood Beam - 22" X 3" X 0.5" N/A 2 ~ 5 10
Wood Block - 2.5" X 2" X 1.5" N/A 2 ~ 1 2
Aluminum Rod - 0.5" Diameter X 32" length N/A 1 ~ 10 10
Aluminum Hinge Bracket N/A 4 ~ .5 2
Copper Tubing - 3/8" OD 5/16" ID X 40"
Everbilt 3/8” - 7/8” Hose Repair Clamp
N/A
N/A
1
108
~ 10
$0.94
10
101.52
Grand Total: $1611.1