Embed Size (px)
Citation preview
Aerosol characterization in an oceaniccontext around Reunion island(AEROMARINE field campaign)
F. Mascaut, O. Pujol, J. Brioude, B. Verreyken,R. Peroni, L. Blarel, T. Podvin, J-M. Metzger,K. Sellegri and P. GoloubLaboratoire d’Optique Atmosphérique (LOA)Université de Lille EGU [email protected] April 29th 2021
Outline
1. Introduction1.1 Context1.2 AEROMARINE field campaign1.3 Models used
2. Results2.1 CAMS reanalyses2.2 Thermodynamic parameters2.3 In-flight measurements2.4 FLEXPART simulations2.5 Comparison with other databases
3. Conclusion & Prospects
EGU 2021 F.Mascaut et al. 1/20
IntroductionContext
• Southern Indian Ocean⇒ pristine region (land & humanactivities have little impact): crucial to quantify the contributionof natural emissions [Mallet et al. 2018]
• The Réunion Island: strategic location⇒ identified as a pristineregion, in a background aerosol environment [Koren et al.,2014]⇒ oceanic environment, long-term observations at theMaido observatory ...
EGU 2021 F.Mascaut et al. 2/20
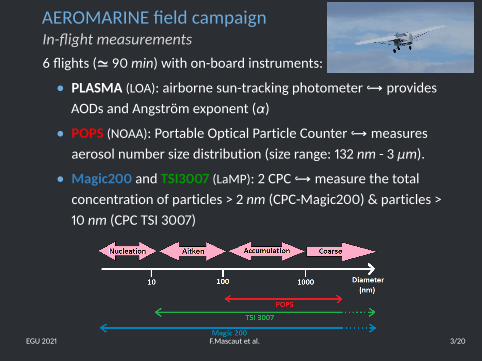
AEROMARINE field campaignIn-flight measurements6 flights (' 90min) with on-board instruments:
• PLASMA (LOA): airborne sun-tracking photometer ,→ providesAODs and Angström exponent (α)
• POPS (NOAA): Portable Optical Particle Counter ,→measuresaerosol number size distribution (size range: 132 nm - 3 μm).
• Magic200 and TSI3007 (LaMP): 2 CPC ,→measure the totalconcentration of particles > 2 nm (CPC-Magic200) & particles >10 nm (CPC TSI 3007)
EGU 2021 F.Mascaut et al. 3/20
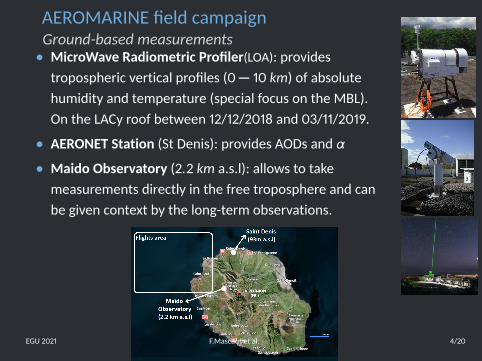
AEROMARINE field campaignGround-based measurements• MicroWave Radiometric Profiler(LOA): provides
tropospheric vertical profiles (0− 10 km) of absolutehumidity and temperature (special focus on the MBL).On the LACy roof between 12/12/2018 and 03/11/2019.
• AERONET Station (St Denis): provides AODs and α
• Maido Observatory (2.2 km a.s.l): allows to takemeasurements directly in the free troposphere and canbe given context by the long-term observations.
EGU 2021 F.Mascaut et al. 4/20
AEROMARINE field campaignObjectives
⇒ Aerosol-water vapor-cloud interactions (WP5 Labex CaPPA)
Objective of AEROMARINE field campaign
1. Characterize marine aerosol optical properties and their verticaldistribution
2. Examine the transport pathways of marine aerosols
3. Improve understanding of marine aerosol emissions,→ Better constrain marine aerosols in models
4. Better understand the impact of the Marine Boundary Layer(MBL) on the marine aerosols
EGU 2021 F.Mascaut et al. 5/20
Models used
• FLEXPART: Lagrangian particle dispersion model that simulatesthe transport, diffusion, dry and wet deposition and radioactivedecay of tracers released (forward or back in time)
• AROME: small-scale weather forecasting model used to obtainthe horizontal wind fields at different altitudes
• CAMS (previously MACC): atmospheric model to obtain themixing ratios of various aerosols, AODs or thermodynamicparameters on a large scale and regional scale (SSA, Dustaerosols, Black Carbon, Organic Matter and Sulfate)
EGU 2021 F.Mascaut et al. 6/20

Outline
1. Introduction1.1 Context1.2 AEROMARINE field campaign1.3 Models used
2. Results2.1 CAMS reanalyses2.2 Thermodynamic parameters2.3 In-flight measurements2.4 FLEXPART simulations2.5 Comparison with other databases
3. Conclusion & Prospects
EGU 2021 F.Mascaut et al. 7/20
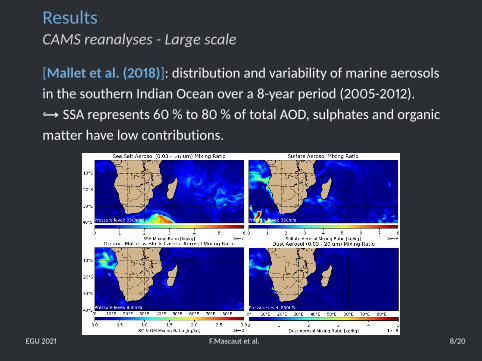
ResultsCAMS reanalyses - Large scale[Mallet et al. (2018)]: distribution and variability of marine aerosolsin the southern Indian Ocean over a 8-year period (2005-2012).,→ SSA represents 60 % to 80 % of total AOD, sulphates and organicmatter have low contributions.
EGU 2021 F.Mascaut et al. 8/20
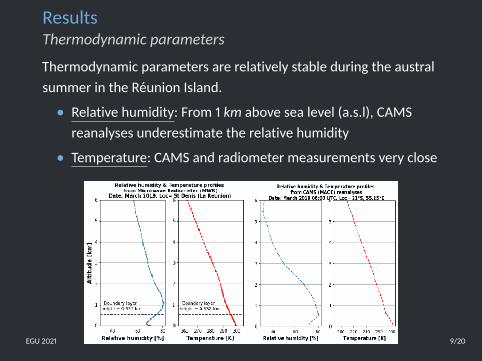
ResultsThermodynamic parametersThermodynamic parameters are relatively stable during the australsummer in the Réunion Island.
• Relative humidity: From 1 km above sea level (a.s.l), CAMSreanalyses underestimate the relative humidity
• Temperature: CAMS and radiometer measurements very close
EGU 2021 F.Mascaut et al. 9/20
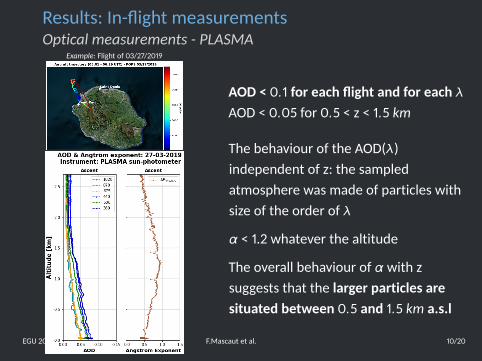
Results: In-flight measurementsOptical measurements - PLASMAExample: Flight of 03/27/2019
AOD < 0.1 for each flight and for each λAOD < 0.05 for 0.5 < z < 1.5 kmThe behaviour of the AOD(λ)independent of z: the sampledatmosphere was made of particles withsize of the order of λ
α < 1.2 whatever the altitude
The overall behaviour of α with zsuggests that the larger particles aresituated between 0.5 and 1.5 km a.s.l
EGU 2021 F.Mascaut et al. 10/20
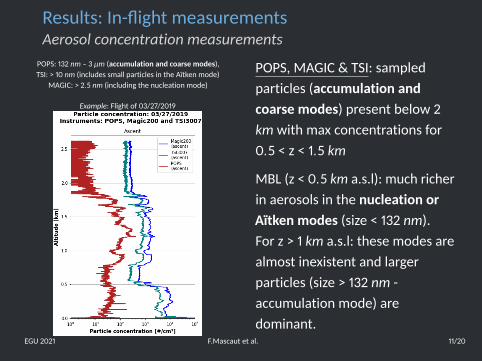
Results: In-flight measurementsAerosol concentration measurementsPOPS: 132 nm – 3 μm (accumulation and coarse modes),TSI: > 10 nm (includes small particles in the Aïtken mode)
MAGIC: > 2.5 nm (including the nucleation mode)
Example: Flight of 03/27/2019
POPS, MAGIC & TSI: sampledparticles (accumulation andcoarse modes) present below 2km with max concentrations for0.5 < z < 1.5 kmMBL (z < 0.5 km a.s.l): much richerin aerosols in the nucleation orAïtken modes (size < 132 nm).For z > 1 km a.s.l: these modes arealmost inexistent and largerparticles (size > 132 nm -accumulation mode) aredominant.
EGU 2021 F.Mascaut et al. 11/20
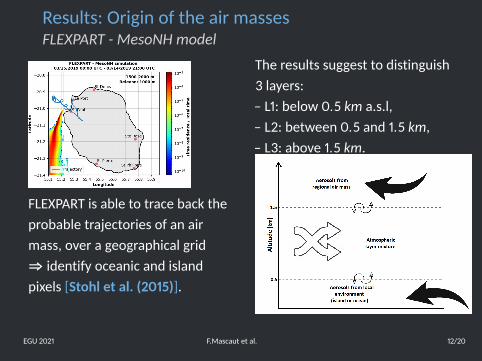
Results: Origin of the air massesFLEXPART - MesoNH model
FLEXPART is able to trace back theprobable trajectories of an airmass, over a geographical grid⇒ identify oceanic and islandpixels [Stohl et al. (2015)].
The results suggest to distinguish3 layers:– L1: below 0.5 km a.s.l,– L2: between 0.5 and 1.5 km,– L3: above 1.5 km.
EGU 2021 F.Mascaut et al. 12/20
Results: Comparison with other databasesComparison with AERONETBy comparing the AOD measurements made by the PLASMAsun-photometer (on the runway) and those of the AERONETsun-photometer (St Denis), we notice:
AODAERONET ' AODPLASMA and α AERONET ' α PLASMA[Hamill et al. (2016)]: Made an aerosol classification based onAERONET data between 1993 and 2012,→ Reunion Island site: dominated by maritime aerosols.
⇒ AERONET measurements are generally in agreement with thosecarried out during flights.
EGU 2021 F.Mascaut et al. 13/20
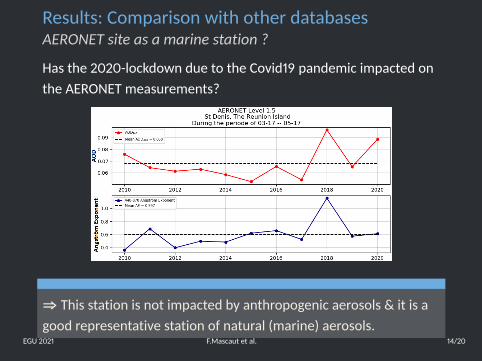
Results: Comparison with other databasesAERONET site as a marine station ?Has the 2020-lockdown due to the Covid19 pandemic impacted onthe AERONET measurements?
⇒ This station is not impacted by anthropogenic aerosols & it is agood representative station of natural (marine) aerosols.
EGU 2021 F.Mascaut et al. 14/20
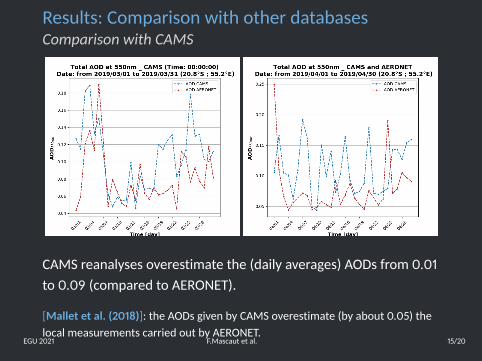
Results: Comparison with other databasesComparison with CAMS
CAMS reanalyses overestimate the (daily averages) AODs from 0.01to 0.09 (compared to AERONET).
[Mallet et al. (2018)]: the AODs given by CAMS overestimate (by about 0.05) thelocal measurements carried out by AERONET.
EGU 2021 F.Mascaut et al. 15/20
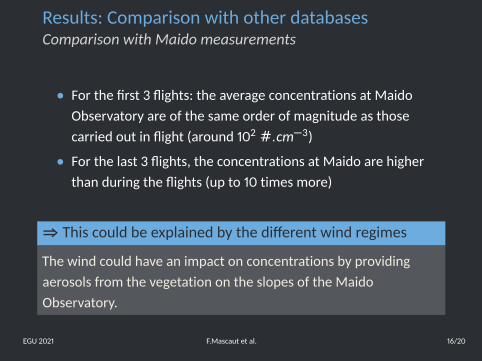
Results: Comparison with other databasesComparison with Maido measurements
• For the first 3 flights: the average concentrations at MaidoObservatory are of the same order of magnitude as thosecarried out in flight (around 102 #.cm−3)
• For the last 3 flights, the concentrations at Maido are higherthan during the flights (up to 10 times more)
⇒ This could be explained by the different wind regimes
The wind could have an impact on concentrations by providingaerosols from the vegetation on the slopes of the MaidoObservatory.
EGU 2021 F.Mascaut et al. 16/20
Outline
1. Introduction1.1 Context1.2 AEROMARINE field campaign1.3 Models used
2. Results2.1 CAMS reanalyses2.2 Thermodynamic parameters2.3 In-flight measurements2.4 FLEXPART simulations2.5 Comparison with other databases
3. Conclusion & Prospects
EGU 2021 F.Mascaut et al. 17/20
Conclusion & Prospects
Conclusion:
• Aerosols mainly localized below 2 km a.s.l
• 0− 0.5 km: aerosols from local environment (island or ocean)0.5− 1.5 km: aerosols from lower and upper atmospheric layers(mixing layer)> 1.5 km: Aerosols from regional air masses (low anthropogenicimpact)
• AERONET sun-photometer confirmed as a marine station
• Overestimation of AOD & underestimation of relative humidityby CAMS reanalyses
EGU 2021 F.Mascaut et al. 18/20
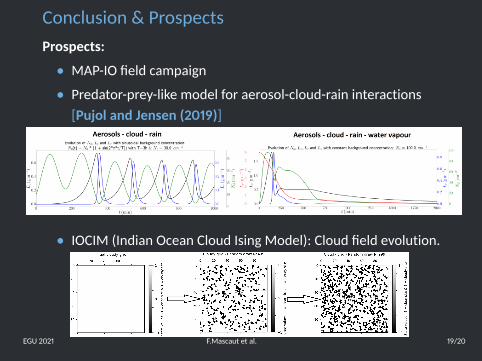
Conclusion & ProspectsProspects:
• MAP-IO field campaign
• Predator-prey-like model for aerosol-cloud-rain interactions[Pujol and Jensen (2019)]
• IOCIM (Indian Ocean Cloud Ising Model): Cloud field evolution.
EGU 2021 F.Mascaut et al. 19/20
Bibliography
Mallet, P-É. et al. (2018)Marine aerosol distribution and variability over the pristine Southern Indian Ocean.Atmospheric Environment, 182:17 - 30, 2018.
Lewis, E. and Schwartz, E. Sea salt aerosols production: mechanisms, methods, measurements and models.Geophysical monograph; 152, 2004.
Koren, I. et al. (2014) From aerosol-limited to invigoration of warm convective clouds. Science, 344; 6188 : 1143–1146,2014.
Andreae, M.O and Rosenfeld, D (2008) Aerosol–cloud–precipitation interactions. Part 1. The nature and sources ofcloud-active aerosols. Earth-science reviews, 89; 1-2 : 13-41, 2008.
Baray et al. (2013)Maido observatory: a new high-altitude station facility at Reunion Island (21° S, 55° E) forlong-term atmospheric remote sensing and in situ measurements Atmospheric Measurement Techniques, 6;2865-2877, 2013.
Hamill et al. (2016) An AERONET-based aerosol classification using the Mahalanobis distance AtmosphericEnvironment, 140; 213-233, 2016.
Stohl et al. (2015) Edited by B. Beeton and K. Berry. The Lagrangian particle dispersion model FLEXPART version 8.2https://www.flexpart.eu/wiki/FpDocumentation.
Pujol and Jensen (2019) Edited by B. Beeton and K. Berry. Cloud–rain predator–prey interactions: Analyzing someproperties of the Koren–Feingold model and introduction of a new species-competition bulk system with a Hopfbifurcation Physica D: Nonlinear Phenomena, 399; 86 - 94, 2019.
EGU 2021 F.Mascaut et al. 20/20