Embed Size (px)
Citation preview

AEROSOL FORMATION IN CO2 CAPTURE PLANTS – ASPEN
PLUS SIMULATION MODEL
Nursultan Galymzhanov, BEng Energy Engineering
Submitted in fulfilment of the requirements
for the degree of Masters of Science
in Chemical Engineering
School of Engineering
Department of Chemical Engineering
Nazarbayev University
53 Kabanbay Batyr Avenue,
Astana, Kazakhstan, 010000
Supervisors: Dr. Mehdi Torkmahalleh
Dr. Dhawal Shah
December, 2017

2
Declaration
I hereby, declare that this manuscript, entitled “Aerosol Formation in CO2
Capture Plants – Aspen Plus Simulation Model”, is the result of my own work except
for quotations and citations which have been duly acknowledged.
I also declare that, to the best of my knowledge and belief, it has not been
previously or concurrently submitted, in whole or in part, for any other degree or
diploma at Nazarbayev University or any other national or international institution.
Nursultan Galymzhanov
26/01/2018

3
Abstract
One of the most promising technologies available for decreasing CO2
concentration in the atmosphere is Post Combustion CO2 Capture (PCCC). The
process is based on absorption-desorption of carbon dioxide by a solvent. Amine
based aqueous solutions are considered as the state of the art solvent for PCCC.
However, its use is associated with MEA emissions from an absorber column
through vapour and aerosol phases. Aerosol emission has only recently been
detected, and reported to be related to the degree of supersaturation of gas.
The objective of this study was to develop a new conceptual model to estimate
heat and mass transfer rates between gas and particulate phases using Aspen Plus
simulation software. Also, validation of the model was performed by comparing it
with results of an experimental mini-plant developed by TNO group in Netherlands.
In the model presented in this study, interaction between the gas and the
solvent, and the gas and the particles was split by modelling the gas-solvent
interaction in the absorber and the gas-particles interaction in separate absorber
columns representing sections of a discretised absorber. A method was presented to
estimate particle formation due to nucleation and to correct the MEA loss predicted
by Aspen Plus.
The CO2 removal efficiency was estimated to be 95%. The estimated total
molecular mass transfer rate from the gas phase at the top of the absorber column to

4
the particle phase was found to be -7.3×10⁻¹⁰ kg/s, indicating net molecular mass
transfer from the particle to the gas phase. The mass transfer due to nucleation was
estimated to be 1.92487×10⁻⁶ kg/s. The amount of particle phase MEA emission was
found to depend on the temperature inside the absorber, temperature bulge, gas
supersaturation ratio, volume of particles entering the absorber and H2SO4
concentration in the entering gas. The particle phase MEA emission due to the
molecular mass transfer from the gas phase to the particle phase was found to be 0.3
mg/Nm3gas, while particle phase MEA emission resulted from the nucleation mass
transfer was 697.0 mg/Nm3gas. Thus, the total particle MEA emission was estimated
to be 697.3 mg/Nm3gas. The estimated nucleation rate is approximately 2×10¹⁵
particles.cm-3.s-1. Gas phase MEA emission was found to be 1.3 mg/Nm3gas.

5
Acknowledgements
I express my gratitude to my supervisor Dr. Mehdi Torkmahalleh and to my
co-supervisor Dr. Dhawal Shah. Their supervision and direction has allowed me to
complete this study. I am thankful to them for the knowledge they provided to me.
I thank Nazarbayev University and its staff for providing me the opportunity
to study Chemical Engineering and receive master’s degree.
I express my gratitude to my colleagues who shared this great journey with
me.
Finally, I thank my family who always supported and encouraged me in all of
my pursuits.

6
Table of Contents
Abstract .......................................................................................................................................... 3
Acknowledgements ....................................................................................................................... 5
Table of Contents .......................................................................................................................... 6
List of Tables ................................................................................................................................. 8
List of Figures ................................................................................................................................ 9
Chapter 1 - Introduction ................................................................................................................ 10
Chapter 2 - Literature review ........................................................................................................ 13
2.1. Experiments ........................................................................................................................... 13
2.2. Simulations ............................................................................................................................ 26
2.3. Literature review conclusion.................................................................................................. 34
Chapter 3 - Conducted Work and Research .................................................................................. 37
3.1.Model development ................................................................................................................ 37
3.1.1. Model ........................................................................................................................... 37
3.1.2. Thermodynamics ......................................................................................................... 39
3.1.3. Correlations ......................................................................................................................... 39
3.2. Conceptual model .................................................................................................................. 39
3.2.1. Interfacial area ............................................................................................................. 42
3.2.2. Mass transfer coefficient ............................................................................................. 44
3.2.3. Assumptions ........................................................................................................................ 46
3.3. Input parameters..................................................................................................................... 47
3.4. Chemistry and thermodynamic reactions ............................................................................... 50
3.5. Supersaturation ...................................................................................................................... 52
Chapter 4 – Results and Discussion .............................................................................................. 54
4.1. Absorber temperature profiles ............................................................................................... 54
4.2. MEA, H2O and CO2 mole flows in gas and particle phases .................................................. 55
4.3. CO2 removal efficiency .......................................................................................................... 61
4.4. Gas particles saturation .......................................................................................................... 62
4.5. Particle total volumetric flowrate ........................................................................................... 64
4.6. Dependence of outlet gas and aerosol MEA on particle inlet flowrate ................................. 65
4.7. Dependence of gas and particle MEA profiles on H2SO4 initial concentration .................... 66

7
4.8. Particle size profile along the column .................................................................................... 67
4.9. Total MEA concentration in combined gas and particle phase ............................................. 69
4.10. Nucleation rate ..................................................................................................................... 70
Chapter 5 - Conclusion and Future Work ..................................................................................... 73
List of References ........................................................................................................................ 75
Appendix A. Parameters for kinetic reactions ......................................................................... 78

8
List of Tables
Table 3.2.1.1: Defined variables for calculator block “Area” ...................................................... 43
Table 3.3.1: Inlet streams parameters ........................................................................................... 47
Table 3.3.2: Flue gas inlet flowrates ............................................................................................. 47
Table 3.3.3: Lean solvent inlet flowrates ...................................................................................... 48
Table 3.3.4: Particle inlet composition ......................................................................................... 48
Table 3.3.5: Absorber column specification ................................................................................. 50
Table 3.3.6: Aerosol columns specification .................................................................................. 50
Table 3.4.1: Chemistry set ............................................................................................................ 51
Table 3.4.2: Reactions set ............................................................................................................. 51
Table 4.3.1: Mini-plant and simulation results for CO2 removal efficiency ................................ 61
Table 4.9.1: Mini-plant and simulation results for total MEA concentration in combined gas and
particle phase ................................................................................................................................ 69
9
List of Figures Figure 2.1.1: Schematic representation of the pilot plant for sulphuric acid aerosol generation
(Khakharia et al., 2013) ................................................................................................................ 13
Figure 2.1.2: Schematic of PCC Pilot Plant and Testing apparatus (Fujita et al. 2017) ............... 22
Figure 2.1.3: Illustration of On-line and Batch analytical methods for amine emissions (Fujita et
al. 2017) ........................................................................................................................................ 23
Figure 2.2.1: Flowsheet used to predict supersaturation (Imle et al. 2014) .................................. 26
Figure 2.2.2: Temperature and saturation profiles (Imle et al., 2014) .......................................... 28
Figure 2.2.3. Schematic representation of modelling approach (Khakharia et al., 2014) ............ 30
Figure 3.1.1.1. Schematic diagram of the absorber and the aerosol column for one stage .......... 38
Figure 3.2.1.1: Calculator block screenshot.................................................................................. 42
Figure 4.1.1: Temperature profile inside absorber obtained from experiment and simulation .... 54
Figure 4.2.1. Total MEA mole flow in particle and gas phases .................................................... 55
Figure 4.2.2: MEA mass transfer between the solvent and the gas along the absorber-Positive
values represent mass transfer from vapor to the solvent phase ................................................... 57
Figure 4.2.3: Total H2O mole flow in the particle and the gas phases ......................................... 58
Figure 4.2.4. Water mass transfer between the solvent and the gas along the absorber-Positive
values represent mass transfer from vapor to the PM phase ......................................................... 59
Figure 4.2.5: Total CO2 mole flow in the particle and the gas phases .......................................... 60
Figure 4.2.6: MEA and MEACOO- mole flow along the column in particle phase……………..61
Figure 4.4.1: Gas particles saturation inside absorber .................................................................. 62
Figure 4.5.1: Particle volumetric flowrate profile ........................................................................ 64
Figure 4.6.1: Outlet gas and aerosol MEA (mg/Nm3) vs inlet particle volumetric flowrate (m3/s)
....................................................................................................................................................... 65
Figure 4.7.1: Gas and particle MEA profiles ................................................................................ 66
Figure 4.8.1. Particle size profile along the column ..................................................................... 67

10
Chapter 1 - Introduction
It is commonly known that nowadays human being utilises enormous amounts
of fossil fuels. Fossil fuels used today include oil and its products, coal, natural and
petroleum gas. The consensus, that is globally accepted and proven scientifically, is
that human activities lead to significant increase in CO2 concentration in the
atmosphere by combustion of fossil fuels. The increase in CO2 concentration results
in the global climate change observed over the past few decades. (Parliament of
Australia, 2010)
One of the most promising technologies, aiming to decrease global CO2
emissions, is Post Combustion CO2 Capture (PCCC) (Abu Zahra, 2007). It is a well-
understood and the most mature technology for preventing CO2 emissions (Rochelle,
2009). The basic technology for CO2 capture and storage was patented in 1930
(Rochelle, 2009). The process is based on absorption-desorption of carbon dioxide
by a solvent. In an absorber column the solvent flows from the top and the gas flows
from the bottom. Reaction between the two flows is exothermic, and results in
transfer of CO2 from the gas to the solvent. Desorption is a reverse process taking
place in a stripper. CO2 is removed from the solvent by supplying the stripping
column with additional heat.

11
The state of the art solvents for PCCC are amine based aqueous solutions (Rao
and Rubin, 2002; Alie et al., 2005). Their advantages include high reactivity, low
cost and high absorbing capacity (IEA CCC, 2007). However, one of the major
problems, associated with CO2 capture, is loss of solvent due to emissions, thermal
degradation and oxidative degradation (Khakharia et al., 2014a). Solvent losses due
to emissions subdivide into three categories: (1) vapour emissions (due to
component’s volatility); (2) carryover as a result of mechanical entrainment; and (3)
aerosol emissions (emissions due to particulate matter) (Khakharia et al., 2015). The
first two types of emissions are well understood. They are effectively reduced by a
water wash at the top of the absorber. However, the water wash is ineffective in
catching aerosol emissions due to their submicron size. (da Silva et al., 2013;
Gretscher and Schaber, 1999)
Schaber (1994) defines aerosols as “suspensions of particles and gases which
can be considered as stable systems in a gravitational field within a certain space of
time”. According to Gretscher and Schaber (1999), the mechanism of particle
formation and growth is related to the degree of supersaturation. When
supersaturation is high, then nucleation takes place. Nuclei can be formed by
molecules of condensing components (homogeneous nucleation), and/or on the
impurities in the flue gas (heterogeneous nucleation) (Gretscher and Schaber, 1999).

12
Aerosol emission from the carbon capture process is not yet well studied and
clearly understood by researchers. Available information is very limited. Therefore,
validation of a new study is frequently difficult.
The objective of this study was to develop a new conceptual model to estimate
heat and mass transfer rates between gas and particulate phases using Aspen Plus
simulation software. The new model gives opportunity to study particle emission
exiting from the absorber column, i.e. its composition and flowrate, and factors that
have influence on it. Also, validation of the model was performed by comparing it
with results of an experimental mini-plant developed by TNO group in Netherlands.

13
Chapter 2 - Literature review
Prediction of vapour based MEA emission from PCCC plants is easy and
straightforward task that has been extensively studied by researchers (Mertens et al.,
2012; Nguyen et al., 2010; Trollebø et al., 2013, Khakharia et al., 2014b). On the
other hand, number of experimental and simulation studies published on PM
emissions understanding is very limited. This chapter presents a literature review
that was performed to understand what studies have been conducted in the area of
PM emissions from PCCC plants.
2.1. Experiments
Khakharia et al., (2013) performed an investigation of aerosol based
emissions of MEA due to sulphuric acid aerosol and soot in a typical Post
Combustion CO2 capture process.
Figure 2.1.1: Schematic representation of the pilot plant for sulphuric acid aerosol generation
(Khakharia et al., 2013)

14
Flue gas containing particulate nuclei was generated in the pilot plant at the
Karlsruhe Institute of Technology, Germany. The schematic of the pilot plant is
shown in Figure 2.1.1. The particle concentration in this pilot plant could be varied
between 104 and 106 per cm3. SO3 was added to the flue gas where it completely
converted to H2SO4 by reacting with water vapour from combustion. The flue gas
was sent to a quench cooler where it was rapidly cooled, resulting in aerosol
generation with number concentration in the order of 108 and size well below 100
nm.
CO2 capture mini-plant was run at TNO, Netherlands. The absorber was 3.5
m high and 4.5 cm diameter packed with Sulzer Mellapak 2X. It had no water wash
or demister. Additional CO2 was added to the flue gas entering the mini-plant to
obtain CO2 concentrations in the range 0.7-13 vol.%.
To analyse the gas phase, a Fourier Transform InfraRed analyser GASMET
CX 4000 was used. The work of the FTIR analyser is based on the measurement of
a large wavelength band in the infrared region and calculating the concentration of
each component by using inverse optimisation technique.
A baseline study was conducted to observe the emissions in the absence of
soot and sulphuric acid. The MEA emission was found to be 45 mg/Nm3. In addition,
the temperature profile in the absorber was created. The temperature increased from
the bottom to approximately two-thirds of the column because of the exothermic

15
reaction between MEA and CO2. Then, in the upper zone of the column, the
temperature decreased because of heat transfer to the cold solvent entering from the
top.
At low soot concentration (104 per cm3), MEA emission increased to 100
mg/Nm3. At high soot concentration (106 per cm3), MEA emission reached 200
mg/Nm3. It was found that this behaviour was instantaneous and reversible. The
reason for the MEA emission increase was that as the soot number concentration
increased, more surface area was provided for MEA transfer to the soot.
Three levels of H2SO4 aerosol concentration were tested: 1.02, 1.18 and
1.42×10⁸ per cm3 indicated as low, medium and high, respectively. It was found that
MEA emissions directly depend on H2SO4 concentration in the flue gas. At high
H2SO4 concentrations, MEA emission can reach 600-1200 mg/Nm3. The effect was
found to be instantaneous. The reason for the increase in MEA emission is same as
in the case of soot.
Soot particle concentration was varied between 104 and 106 per cm3, and
H2SO4 particle concentration in the range of 108 per cm3 to observe their
simultaneous effect on MEA emission. It was found that effect of soot particle
concentration on MEA emission was higher than that of H2SO4 particle
concentration.

16
CO2 content in the flue gas variation from 0.7 vol.% to 12.1 vol.% was found
to have instantaneous and reversible effect on MEA emission. MEA emission
increased from 220 mg/Nm3 to 1600-1800 mg/Nm3 in seconds. When the CO2
content is increased, more heat is released during MEA-CO2 reaction resulting in a
higher temperature bulge. Temperature bulge is defined as the difference between
the gas temperature at the hottest and the top zones of the absorber.
Mertens et al. (2014) study was performed to present data on the particle size
distribution, and number entering and leaving the absorber. This work was the first
to present this kind of data.
Pilot plants used for H2SO4 generation and carbon capture, as well as an FTIR
analyser, were all same as used in Khakharia et al. (2013).
The main measurement instrument in this work was the electrical low pressure
impactor ELPI+. In this device the particles were charged by corona charging and
subsequently separated in a low pressure cascade impactor with 14 electrically
insulated collection stages. The measured current signals were proportional to the
number concentration and size.
The work results were compared to the work conducted by Brachert et al.
(2014). The experimental set-ups for H2SO4 aerosol generation in two works were
similar to each other. However, Mertens et al. (2014) used a fan to blow the flue gas

17
into the absorber, whereas Brachert et al. (2014) installed a vacuum pump behind
the absorber.
Particle sizes in front of the absorber measured by Brachert et al. (2014) were
larger than that of Mertens et al. (2014) because the particles shrinked as they passed
through a fan before entering the absorber. As a result, the number concentration of
particles increased from 2.1×10⁸ to 6.5×10⁸ per cm3. Similarly to Brachert et al.
(2014), it was confirmed that particle sizes entering the absorber were well below
200 nm.
It was found by comparing measured size distribution of particles entering the
absorber and leaving it that they grew inside the absorber. The largest size measured
before the absorber was approximately 0.3 μm. In contrast, the largest particle size
leaving the absorber was around 10 μm. This was due to the uptake of MEA and
water by particles.
The number concentration decreased from 6.5×10⁸ to 1.3×10⁸ per cm3 because
of larger particles and coagulation.
MEA emissions in the order of 3000-3500 mg/Nm3 were measured at the
outlet of the absorber. To compare, MEA emissions in the absence of H2SO4 aerosol
were 45 mg/Nm3.
Theoretical calculation was performed to evaluate whether the measured
particle sizes and numbers can contain 3000 mg/Nm3 of MEA emissions.

18
Kolderup et al. (2012) reported 15 wt.% MEA concentration in the flue gas
leaving an absorber column. To contain 3000 mg/Nm3 of MEA, the flue gas must
contain 20 ml of water per Nm3.
By assuming that particles were 100% water, the volume of water the particles
contain based on their size and number concentration was calculated. The plot of ml
of water in particle against particle size was plotted for different particle
concentrations. For number concentrations between 1×10⁷ and 1×10⁸ per cm3 and
20 ml water per Nm3, the particle size should be 1 μm. However, the actual size of
particles is less than 0.1 μm and contain very small amounts of water due to their
submicron size. At 0.1 μm particle size and a ten times dilution, the water content
was found to be 2.5 ml/Nm3. It was concluded that decreasing the dilution to zero
can result in increasing the water content by one order of magnitude. Also,
assumption of 15 wt.% MEA in the flue gas can be not accurate.
In the study performed by Khakharia et al. (2015) variation of the following
parameters in a CO2 capture mini-plant on particle formation was tested: lean solvent
temperature, pH of the lean solvent, and CO2 concentration in the flue gas. Also,
other commonly used solvents such as mixtures of AMP with Pz, and AMP with
potassium taurate (Ktau) were evaluated for the potential of particle formation.
Pilot plants used for H2SO4 generation and carbon capture, as well as an FTIR
analyser, were all same as described in Khakharia et al. (2013). The number

19
concentration of particles was measured by a condensation particle counter (CPC;
PALAS UFCPC with sensor 200).
Increasing the lean solvent temperature from 40oC to 80oC by increments of
10oC, and maintaining all other input parameters unchanged resulted in an increase
in the temperature along the column, especially in the upper part. The temperature
bulge (temperature difference between the hottest zone and the top zone) reduced at
higher lean solvent temperatures. The water content increased from 10 vol.% to 28
vol.%. Increasing the lean solvent temperature from 40oC to 50oC resulted in the
decrease in MEA emissions, which were aerosol based, from 1900 mg/Nm3 to 1600
mg/Nm3. At the lean solvent temperature of 60oC emissions were 1200 mg/Nm3.
Further increase in the lean solvent temperature decreased emissions less because
vapour emissions of MEA started to increase.
When AMP-Pz (next generation CO2 capture solvent) was used as the solvent,
the temperature in the absorber was lower, and the temperature bulge moved to the
bottom of the column. The emissions of AMP and Pz directly and instantaneously
followed the trend of particle number concentration. When the H2SO4 particle
concentration increased from 9.7×10⁷ to 1.4×10⁸ per cm3, emissions of AMP
increased from 2146 mg/Nm3 to 2940 mg/Nm3. Emissions of Pz increased from 312
mg/Nm3 to 416 mg/Nm3. In the case of absence of H2SO4 particles, the emissions
were 393 mg/Nm3 and 15 mg/Nm3 respectively.

20
The lean solvent pH depends on how much CO2 is stripped in the stripper and,
thus, on the stripper operating temperature. The more CO2 is stripped, the higher the
lean solvent pH is. It was found that as the pH of the lean solvent increased, so did
the AMP and Pz emissions. This increase occurred because more CO2 reacted with
MEA resulting in a higher temperature profile. The maximum pH of 11 resulted in
maximum AMP and Pz emissions, 2249 mg/Nm3 and 350 mg/Nm3 respectively.
When variation of the CO2 content in the flue gas from 12.7 vol.% to 0.7 vol.%
was tested with AMP-Pz as a solvent, the temperature inside the absorber decreased
with the decrease in the CO2 content as less CO2 participated in the exothermic
reaction with the solvent. The emission of AMP and Pz increased as the CO2 content
was decreased from 12.7 vol.% to 6 vol.% and reached 2200 mg/Nm3 and 226
mg/Nm3 respectively. During the further decrease in CO2 content up to 0.7 vol.%,
the emission of AMP and Pz reduced.
Solvent made of AMP and Ktau was tested to understand whether aerosol
emissions occur when a non-volatile amino acid salt was present. The maximum
temperature was observed in the bottom of the column in this case. It was found that
AMP emissions were approximately same in presence and absence of H2SO4
particles. It means that AMP is not present in the particle phase, but only in the gas
phase.

21
The authors stated that the three main parameters, that aerosol based
emissions depend on, are particle number concentration, supersaturation and
reactivity of amine.
A means of understanding the dynamics of aerosol fields in gas-liquid
contacting devices by developing an in situ particle analysis technique called Phase
Doppler Interferometry (PDI) was presented in the work by Fulk et al. (2017).
Particle size distributions (PSD) and total particle densities were measured and
compared to FTIR data on bench and pilot scale apparatuses for two amine systems:
Pz and MEA.
A portable, weatherproof, simultaneous sampling system for FTIR and PDI
was designed and constructed for testing at different pilot plants. A large slipstream
was withdrawn from a process duct through a blower. A small fraction of the
slipstream was drawn into DX4000 portable FTIR analyser. The rest of the
slipstream was passed through the PDI analyser.
The sampling locations were at the Pickle Research Campus (PRC) pilot plant
at the University of Texas at Austin, USA and at the Slipstream Solvent Test Unit
(SSTU) pilot plant of the National Carbon Capture Centre (NCCC) in Alabama,
USA.

22
PDI and FTIR sampling was performed at NCCC over a period of seven days.
The PDI measured total particle densities up to 107 particles per cm3, mostly of
micron range. The average fitting error between the PDI and FTIR was 40%.
Correlation between average diameter and total particle density for the two
blower locations showed that the average diameter decreased with the total particle
density due to the mass balance of condensable material. The more condensation
sites, that occur at higher particle densities, the less growth can a single particle
achieve.
In the study by Fujita et al. (2017), Toshiba performed evaluation of amine
emissions from 10 ton-CO2/day scale pilot plant within 30 wt.% MEA solution and
Toshiba solvent (TS-1).
Figure 2.1.2: Schematic of PCC Pilot Plant and Testing apparatus (Fujita et al. 2017)

23
The PCC Pilot Plant was installed in Mikawa Power Plant, Japan (Figure
2.1.2). Actual flue gas for the pilot plant was introduced from the existing coal-fired
power plant. The flue gas moved through the absorber and a water wash, and then
was returned to the stack. In addition, approximately 5% of the exit gas from the
water wash was directed to the testing apparatus consisting of the 1st tower
(additional water wash) and the 2nd tower (acid wash) to study methods of further
reduction of amine emissions.
There were six sampling points installed at the entrance and the exit of each
unit of the pilot plant for measuring gas and particles.
Figure 2.1.3: Illustration of On-line and Batch analytical methods for amine emissions
(Fujita et al. 2017)
On-line and Batch analytical methods were utilised to measure the
concentrations of amine in gas and aerosol phases. The sampling gas was divided
into three gas lines (Figure 2.1.3.). The first line was used to adjust suction gas flow
at the entrance of the sampling probe for isokinetic sampling. The second line (batch

24
analysis) was used to capture amines from the flue gas by ice water cooling and two
impingers. Captured amines were measured by LC/MS/MS (TSQ Quantum Access
Mass, Thermo Scientific) and GC/MS (GCMS-QP2010Ultra, Shimazu) and
detected amine concentration to less than 10 ppb (v/v). The third line (on-line
analysis) was used for supplying the sample gas into the Proton Transfer Reaction-
Mass Spectrometry (PTR-MS, Ionicon Analytik GmbH), which detected amine
concentration to less than 10 ppb (v/v).
Amine particles in 0.3-17.5 μm range contained in flue gas were detected by
the particle spectrometer (Welas2070, PALAS GmbH). Particles of 10-470 nm range
contained in flue gas at the entrance of absorber were detected by Scanning Mobility
Particle Sizer Spectrometer (Model 3034 SMPSTM, TSI).
By comparing the results of Batch analysis and On-line analysis with respect
to MEA, the differences between them were confirmed. Batch analysis gave the
average concentration during two-hour sampling. It was observed that both analyses
showed the same fluctuation tendency.
Plotting the highest-concentration amine measured at the exit from the
absorber for both MEA and TS-1 solvents, showed that TS-1 has much better
performance than MEA in terms of amine emissions.
It was found that the farther downstream the measured point is located, the
lower amine concentration is reduced by water wash and acid wash. It was also found

25
that the higher the vapour pressure of amines is, the higher the washing rate is. It
was suggested that particle-driven amine emissions are less likely to be reduced by
the water wash and the acid wash, compared to vapour-driven amine emissions.
Investigation was carried out to observe how gas and liquid types fed into the
absorber affect particle formation. It was found that feeding 30 wt.% MEA aqueous
solution with air resulted in much higher particle number concentration than water
with air. Furthermore, flue gas-30 wt.% MEA solution feed was compared to air-30
wt.% MEA solution feed. The flue gas case resulted in a dramatic increase in particle
formation. The authors state that the increase in the number concentration of
particles in the outlet is caused by the particles included in the flue gas.
How aerosol contained in the flue gas prior to entering the absorber impacts
particle formation and growth was investigated. A remarkable increase in particle
number concentration was observed at the outlet of the 1st tower followed by an
increase in particle number concentration in the flue gas. The authors concluded that
aerosol is a source of particle nuclei, and enhances particle growth inside the
absorber.
The authors confirmed the hypothesis of particle growth by comparing peak
diameters of particles in the inlet of the absorber and in its outlet. The fluctuation
tendencies of the peak diameters were very close to each other.

26
2.2. Simulations
Imle et al. (2014) presented a method to predict supersaturation of the gas
phase in absorption columns by rate-based modelling in Aspen Plus software.
Predicting supersaturation is important because it drives particle formation. The
influence of input parameters such as temperature of the inlet gas and solvent, and
concentration of carbon dioxide in the inlet gas on supersaturation of the gas was
studied by them. In their study only supersaturation was predicted, and particle
formation was not modelled.
Figure 2.2.1: Flowsheet used to predict supersaturation (Imle et al. 2014)
Flowsheet used in the study is shown in Figure 2.2.1. It includes the absorber,
the isothermal flash to calculate the supersaturation profiles and the adiabatic flash
used for determining the flowrate of the liquid formed by condensation.

27
To define supersaturation S of a gaseous mixture at given temperature and
pressure, components of the mixture were classified as either condensable or non-
condensable. According to Imle et al. (2014), a component was considered to be
condensable “if it is found in the first droplet formed when the gas is compressed at
constant temperature”.
In this model, pseudo-streams were withdrawn from every segment of an
absorption column. Pseudo-streams are absolute representatives of gas or liquid flow
inside the column, but their flow does not disturb the mass or energy balance inside
it.
The pseudo-stream was separated into condensable and non-condensable
streams. The condensable stream was fed into an isothermal flash separator with the
vapour fraction set to 0.9999. According to Imle et al. (2014), the corresponding
pressure is a numerical approximation of the dew point pressure. To calculate S
value of the pseudo-stream, Equation 2.2.1 was used.
𝑆 (𝑇, 𝑝, 𝑦) =𝑝 ∑ 𝑦𝑖
𝑁𝑐𝑖=1
𝑝𝑑𝑒𝑤(𝑇,𝑦∗) (2.2.1)
Where S - supersaturation
T and p – temperature and pressure;
Nc – number of condensable components;
y – mole fraction in a studied mixture;
y* - mole number in a “mixture of condensable components”.

28
Figure 2.2.2: Temperature and saturation profiles (Imle et al., 2014)
First, the base case was modelled and temperature and saturation profiles
along the column were presented (Figure 2.2.2). The temperature of gas increased
in the lower part of the column and decreased near its top as it was expected. In the
saturation profile there was a gradual increase of supersaturation as the gas
temperature became higher, and a drastic increase when the gas met cold solvent
entering from the top. The gas became supersaturated (S>1) in the bottom of the
column. The top supersaturation ratio was 1.21.
As expected, when the temperature of the rich gas increased, the
supersaturation ratio decreased. When the temperature of the gas is increased, the
dew point pressure of the mixture also increases. In addition, at higher temperatures
solubility of CO2 in aqueous MEA solution decreases and, thus, less heat is released
during their reaction so that less water is evaporated. According to the Equation
2.2.1, supersaturation then decreases.

29
The temperature of the lean solvent has a strong influence on the top
supersaturation ratio. The explanation is an increased temperature bulge at low lean
solvent temperatures. At the same time, it was found that the lean solvent
temperature has almost no effect on the supersaturation in the rest of the column.
It was found that variation of CO2 content in the rich gas has a strong effect
on supersaturation in the lower part of the column. In the upper part of the column,
effect was smaller. The highest top supersaturation was reached by 0.04 g/g CO2
concentration.
In the case when no CO2 was present in the rich gas and in the lean solvent,
no temperature bulge was observed as there was no exothermic reaction between
MEA and CO2. As a result, the top supersaturation reached just 1.01. Thus, no
aerosol formation was expected in this case.
Khakharia et al. (2014a) developed a model in Aspen Plus V8.8 software to
understand mechanisms of particulate matter formation and growth. They changed
input parameters such as CO2 content of the inlet flue gas, lean solvent temperature
and lean solvent loading to understand their effect on particle based emissions.

30
Figure 2.2.3. Schematic representation of modelling approach (Khakharia et al., 2014a)
In their study absorber column was discretised into a number of sections.
Figure 2.2.3 shows a schematic representation of the modelling approach for one
section of the absorber. Each section was represented by an absorber column and a
plug-flow reactor. Gas-solvent interaction was simulated in the absorber. Then,
outlet gas from the absorber was mixed with particulate matter flow coming from
the previous section on the bottom. The gas-particulate interaction was simulated in
the plug-flow reactor after which the two phases were separated in a flash separator
and sent to the following section on the top.
It was found that as the temperature of the flue gas increased along the
column, so did its supersaturation ratio. The increase in the supersaturation occurred
because of an increase in the partial pressure of volatile components such as MEA
and water. At two-thirds of the column the gas reached the maximum temperature
31
and then started to cool down because of contacting cold solvent entering from the
top. A drastic gas temperature decrease resulted in a significant increase in the
supersaturation ratio. The supersaturation ratio profile followed the same trend as in
the work by Imle et al. (2014). High supersaturation ratio results in high potential
for particle formation and growth.
By varying CO2 content in the inlet flue gas from 2 vol.% to 13 vol.%, it was
found that reducing CO2 content results in increase in supersaturation along the
column. It was also found that higher CO2 content results in higher top temperature
of the gas. In turn, the top temperature is proportional to the amount of vapour MEA
emissions. The highest amount of aerosol MEA emissions was found to occur at 10
vol.%, being a function of the supersaturation and the absolute top temperature.
Aerosol emissions increase with temperature because of the increase in the
concentration of volatile components available for transfer to aerosol phase.
However, aerosol based emissions decrease at higher CO2 concentrations because
MEA activity in the solvent decreases.
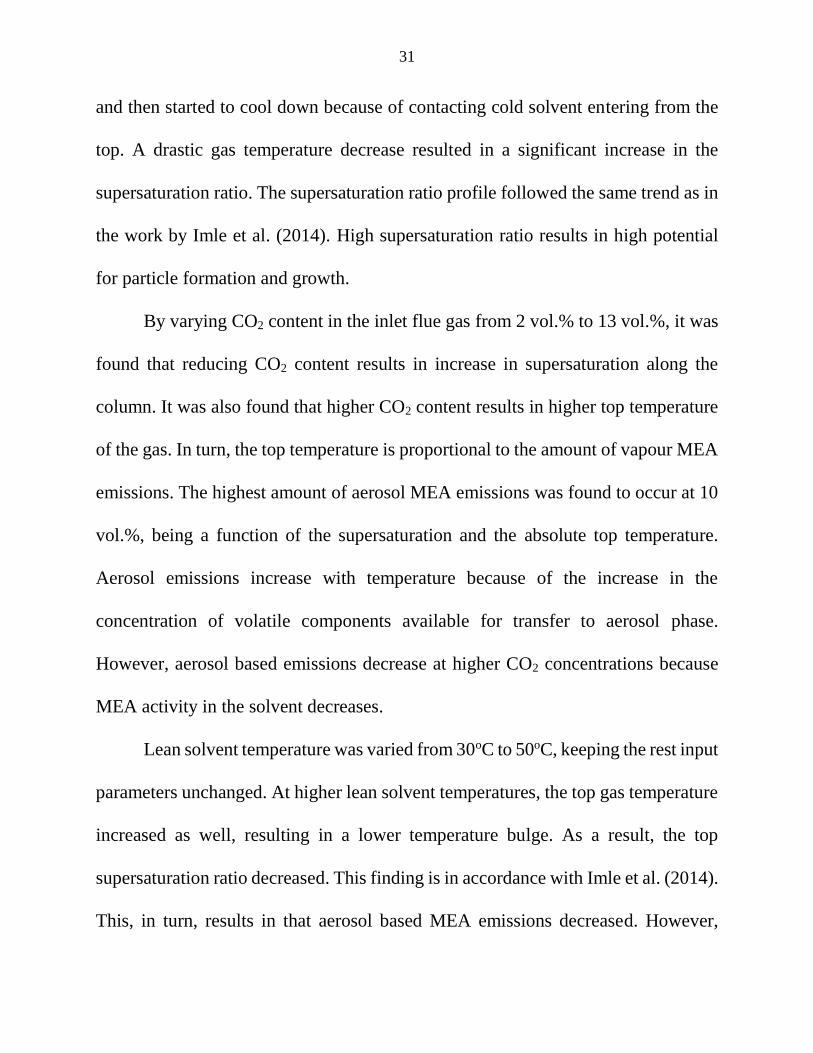
Lean solvent temperature was varied from 30oC to 50oC, keeping the rest input
parameters unchanged. At higher lean solvent temperatures, the top gas temperature
increased as well, resulting in a lower temperature bulge. As a result, the top
supersaturation ratio decreased. This finding is in accordance with Imle et al. (2014).
This, in turn, results in that aerosol based MEA emissions decreased. However,
32
vapour MEA emissions increased at higher flue gas temperatures, but they can be
removed by a conventional water wash.
By varying CO2 loading of the lean solvent, it was found that the higher the
loading, the lower the supersaturation ratio profile, especially at the top of the
column. As a result, the corresponding aerosol MEA emissions also decreased at
higher CO2 loadings. Vapour emissions also decreased at higher CO2 loadings.
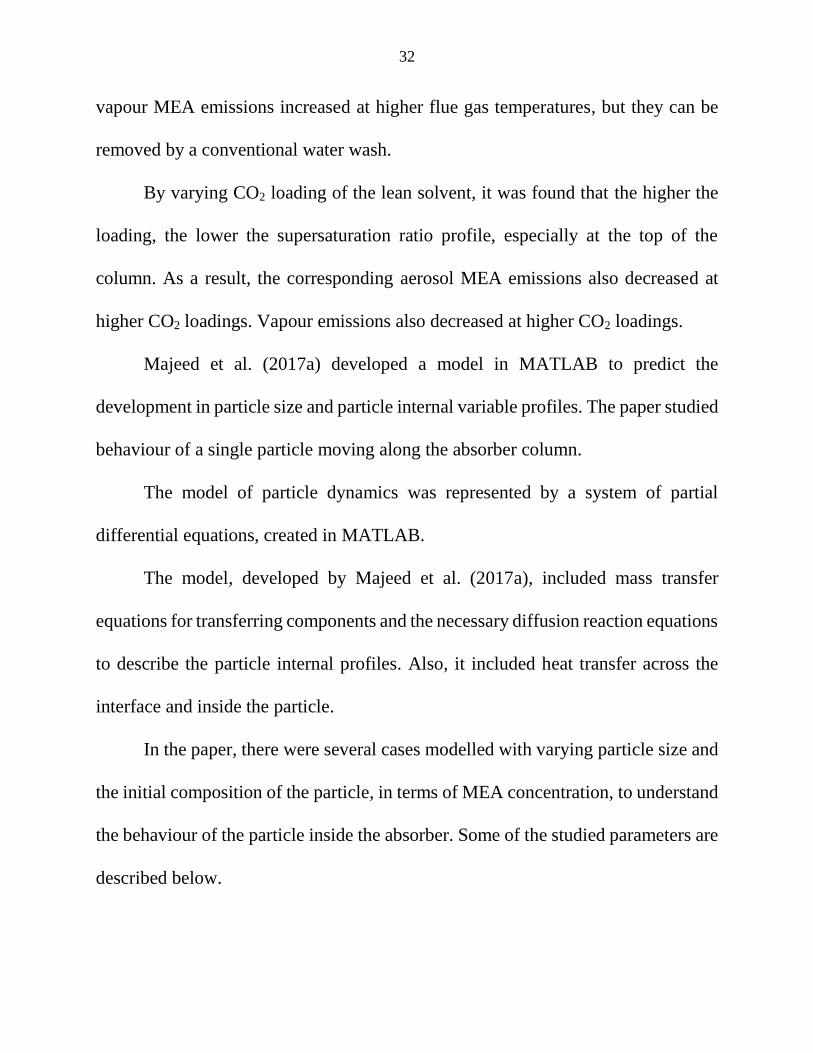
Majeed et al. (2017a) developed a model in MATLAB to predict the
development in particle size and particle internal variable profiles. The paper studied
behaviour of a single particle moving along the absorber column.
The model of particle dynamics was represented by a system of partial
differential equations, created in MATLAB.
The model, developed by Majeed et al. (2017a), included mass transfer
equations for transferring components and the necessary diffusion reaction equations
to describe the particle internal profiles. Also, it included heat transfer across the
interface and inside the particle.
In the paper, there were several cases modelled with varying particle size and
the initial composition of the particle, in terms of MEA concentration, to understand
the behaviour of the particle inside the absorber. Some of the studied parameters are
described below.
33
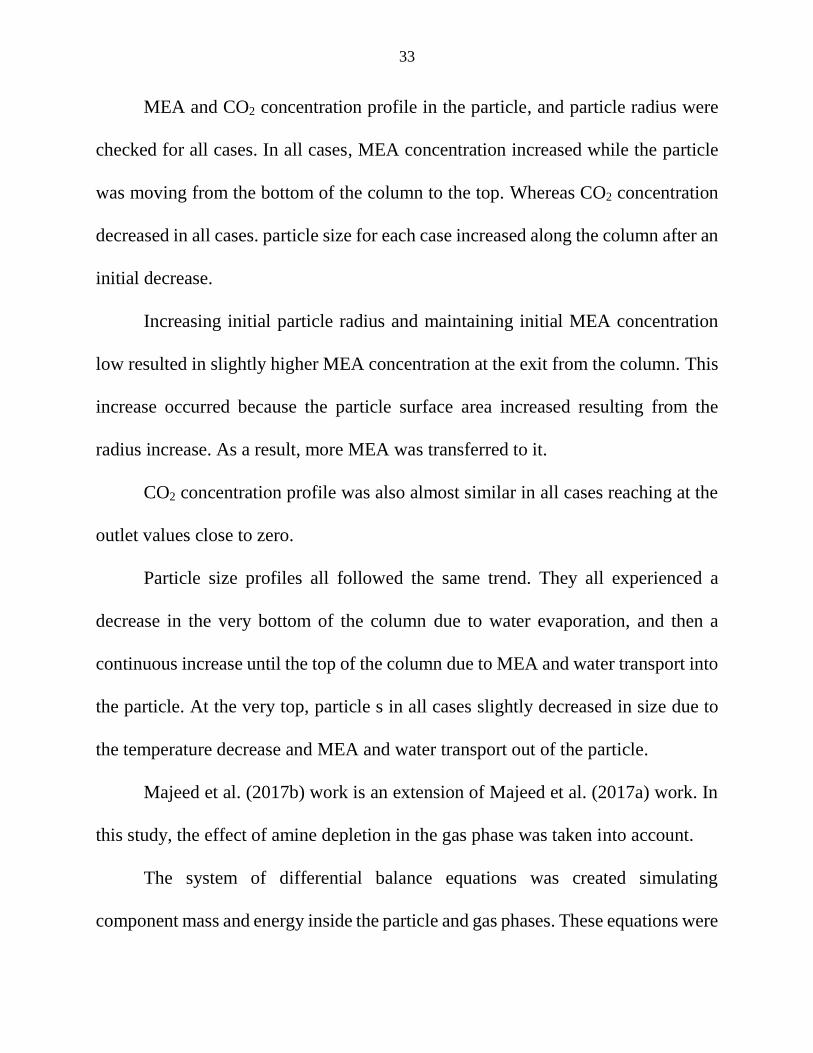
MEA and CO2 concentration profile in the particle, and particle radius were
checked for all cases. In all cases, MEA concentration increased while the particle
was moving from the bottom of the column to the top. Whereas CO2 concentration
decreased in all cases. particle size for each case increased along the column after an
initial decrease.
Increasing initial particle radius and maintaining initial MEA concentration
low resulted in slightly higher MEA concentration at the exit from the column. This
increase occurred because the particle surface area increased resulting from the
radius increase. As a result, more MEA was transferred to it.
CO2 concentration profile was also almost similar in all cases reaching at the
outlet values close to zero.
Particle size profiles all followed the same trend. They all experienced a
decrease in the very bottom of the column due to water evaporation, and then a
continuous increase until the top of the column due to MEA and water transport into
the particle. At the very top, particle s in all cases slightly decreased in size due to
the temperature decrease and MEA and water transport out of the particle.
Majeed et al. (2017b) work is an extension of Majeed et al. (2017a) work. In
this study, the effect of amine depletion in the gas phase was taken into account.
The system of differential balance equations was created simulating
component mass and energy inside the particle and gas phases. These equations were

34
used with a reaction model, an equilibrium model and models between for heat and
mass transfer between the gas and the solvent phases and between the gas and the
aerosol phases.
In the paper, there were several cases modelled with varying particle size and
the initial composition of the particles, in terms of MEA concentration, to understand
how various particle number concentrations (from 1 to 107 per cm3) affect the gas
phase composition. Some of the obtained results are described below.
It was found that for large particle number concentrations partial pressures of
MEA in the gas phase increase from the bottom of the column to the upper zone.
However, in the upper zone, the MEA partial pressure decrease until the outlet.
Partial pressure of water in the gas phase follows the same trend as MEA. Both
profiles are dependent on the temperature inside the absorber. As the temperature
increases, condensable components evaporate from the solvent to the gas phase.
When it decreases at the upper zone, MEA and water evaporation rate decreases.
2.3. Literature review conclusion
Based on the works reviewed in this chapter, several conclusions can be made
to understand what has been done in the area of particle formation and growth, and
what the current study can bring in to better understand mechanisms of particle
formation and growth.

35
In the experimental studies reviewed, the focus was on particle size and
number concentration at the outlet of the absorber. However, nothing has been
reported on particles behaviour inside absorber columns yet. Thus, the results on
particles behaviour inside absorbers, obtained in simulations, cannot be validated by
experiments.
The model for defining supersaturation ratio of a gaseous mixture developed
by Imle et al. (2014) was utilised in the present work. In comparison to the present
study, Imle et al. (2014) only predicted and tested supersaturation ratio, whereas
particulate formation was not modelled.
Khakharia et al. (2014a) used a plug-flow reactor to simulate gas-particle
interaction. Plug-flow reactors simulate only reactions between the components.
However, they do not provide information on mass and heat transfer between the
gas and the particles.
Majeed et al. (2017a) studied component profiles only for a single particle and
for gas phase. It was assumed that gas phase composition is not affected by the
particle phase.
Component profiles for gas at high particle number concentrations were
studied in Majeed et al. (2017b). However, component profiles for particles at high
number concentrations were not considered. They implemented the same approach
as in this work by estimating mass and heat transfer rates between the gas and the

36
particle phases. However, they only studied gas-particle interaction, whereas
simultaneous gas-solvent interaction was not considered. In addition, Majeed et al.
(2017b) did not develop any flowsheet simulation model within a commercial
software such as Aspen Plus to make it available for commercial applications.
To date, no studies have been developed to estimate the nucleation rate inside
absorber columns.
The present work aimed to further develop the simulation studies that were
reviewed in this chapter by introducing a new conceptual model to estimate heat and
mass transfer rates between gas and particulate phases using Aspen Plus simulation
software. Another objective was to validate the model by comparing it with results
of an experimental mini-plant developed by TNO group in Netherlands.
37
Chapter 3 - Conducted Work and
Research
3.1. Model development
3.1.1. Model
Aspen Plus V9.0 software was used in this study. The particulate phase flows
from the bottom to the top of the column co-currently with the gas phase. Existence
of particle flow means that the third phase must be introduced into the absorber
column as the interaction between all three phases occurs simultaneously. However,
in Aspen Plus, this cannot be done in a straightforward manner.
In order to simplify and simulate the real condition, the model developed by
Khakharia et al. (2014a) was further improved. The process was split into two steps.
In the first step, the gas phase contacts counter-currently with the solvent in an
absorber column modelled using a rate-based approach. Then, the treated gas meets
particle phase in another absorber column modelled using a rate-based approach. In
this column, the particle phase and the gas phase contact counter-currently, but the
modelling, as explained later, is set up in a way that a co-current contact is taken into
account.

38
Figure 3.1.1.1. Schematic diagram of the absorber and the aerosol column for one stage
The schematic diagram of the model is illustrated in Figure 3.1.1.1. For
modelling the first step of the process, a single absorber was developed consisting
of 25 stages to represent 5 sections of the experimental mini-plant. 25 pseudo-
streams were taken from the absorber, representing the gas outlet from each stage.
Pseudo streams have same temperature, pressure, flowrate and composition as the
gas inside the column. However, they do not disturb mass and energy balance inside
the column.
For modelling the second step of the process, there were other 25 absorbers
(aerosol columns) set in the model. They represented 25 sections of the experimental
absorber of the mini-plant. Each pseudo-stream entered a respective aerosol column,
consisting of two stages, where gas-particle interaction was simulated. Particle phase
acted as a solvent in the aerosol columns. The aerosol columns were connected to

39
each other by the flow of particle phase from the column on the bottom to the column
on the top.
3.1.2. Thermodynamics
To model interaction between gas and particles, and between gas and solvent,
a rate-based modelling was considered. Electrolyte-NRTL (ELECNRTL)
thermodynamic package in Aspen Plus was used to estimate the physical properties
and phase equilibrium. This is similar to what is provided in Aspen Plus “Rate-Based
Model of the CO2 Capture Process by MEA” example (Aspen Technology, Inc,
2014). The existing pure component and binary interaction parameter data in the
Aspen Properties databank was not changed. Henry’s law was used to obtain the
solubility of supercritical components such as CO2, N2, O2, CO, H2.
3.1.3. Correlations
For the absorber column, where gas and solvent interaction was simulated,
Aspen built-in correlations were used for mass transfer coefficient and for interfacial
area. In both cases the Bravo et al. (1985) correlation method was used. For heat
transfer coefficient in both absorber and aerosol columns the Chilton and Colburn
analogy was used.
3.2. Conceptual model
The next step was to develop a set of equations for creating a new conceptual
model to estimate heat and mass transfer rates between gas and particulate phases as

40
no experimental mass transfer correlations exist for gas streams flowing co-currently
with solid or liquid particles in a packed column (Khakharia et al., 2014a). The new
model is based on the two-film theory, that was suggested by Whitman in 1923
(Seader and Henley, 1998) for separation processes that involve contacting two fluid
phases. According to the two-film theory, “each film presents a resistance to mass
transfer, but concentrations in the two fluids at the interface are in equilibrium”
(Seader and Henley, 1998, p.150).
The two-film theory allows to predict the mass transfer between two fluid
phases across an interface, assuming that equilibrium exists at the interface. It
enables to model the interaction between the gas and the particle phases accurately.
It is assumed that the particles have an ideal spherical shape. The model
considers only gas-solvent and gas-particle interaction, assuming that the solvent
and the particle phases do not interact with each other. In the current model, it is also
assumed that the gas and the particles move with same velocity. Thus, they are
stationary relative to each other.
In order to estimate mass transfer between the gas and the particles, the
interfacial area and the mass transfer coefficient must be calculated. To do so, the
area available for the gas-particle contact must be calculated. The volume of the
particles flowing through the absorber section was divided by the number of the
particles in it to find volume of a single particle and its radius in this section. Having

41
found the particle radius, the surface area of all particles and, thus, the gas-particle
mass transfer can be computed for a particular section of the absorber.
The mathematical basis of the new conceptual model is described in Sections
3.2.1 and 3.2.2. The new model is applied to each of 25 aerosol columns through the
use of internal Fortran subroutine available in Aspen Plus.
First, number of particles in each of 25 sections of the absorber was calculated.
Equation 3.2.1 was used for estimation of particle number in the absorber section (i)
(unitless):
𝑃𝑀𝑁 = 𝑃𝑀𝑁𝐶 × 𝑉𝑂𝐿𝑖 Equation 3.2.1
Where PMN is the total particle number in each section of the column. PMNC
is the particle number concentration. PMNC inside the flue gas entering the column
was obtained from the measurements performed at the mini-plant at TNO to be
4.8×10⁷ particles/cm3. As no experimental values are reported for the particle
number concentration development along the column, PMNC was assumed to be
constant along the absorber. This assumption is fairly acceptable as the particle
nucleation occurs mainly on the surface of the existing particles, and not much
significant changes in the particle number concentrations will occur. VOLi
represents the free volume of the given column section through which the gas flows.

42
3.2.1. Interfacial area
For computing the interfacial area in each section of the absorber,
Flowsheeting Option such as Calculator Block was created and set for each aerosol
column. Figure 3.2.1.1 shows how Calculator Block looks. In the calculator block,
a set of equations for each section was written, enabling Aspen Plus to compute the
interfacial area in each section of the absorber. All variables, that were used or
calculated, were defined in advance.
Figure 3.2.1.1: Calculator block screenshot
All defined variables are shown in Table 3.2.1.1 below, where subscript (i) is
for the section number.

43
Table 3.2.1.1: Defined variables for calculator block “Area”
Variable Information
flow
Description Unit
Areai Export Ratio of the specific interfacial area to the
packing specific area
-
D Import Column diameter for the section m
H Import Packed height for the section m
N Import Number of theoretical stages, incl. condenser
and reboiler
-
Holdupi Tear Liquid holdup for liquid phase kinetic
reactions on a volume basis
m3
Vi Import Volumetric flowrate of the gas inlet to the
column
m3/s
PMVi Import Volumetric flowrate of the liquid inlet to the
column
m3/s
Ri Aerosol particle radius m
Aerosi Tear Liquid Sherwood number -
Next step was to develop a set of equations to calculate the export variable:
1. Particles number in each absorber section (no unit)
𝑃𝑀𝑁 = 3.28136 × 10¹¹
2. Equation for finding liquid holdup in each section, i.e. volume taken by
particle phase (unit: m3)
𝐻𝑂𝐿𝐷𝑈𝑃𝑖 =𝑃𝑀𝑁 × 4 × 𝜋 × 𝑅𝑖
3 ÷ 3
𝑁
3. Equation for finding volume of the section available for gas (unit: m3)
𝑉𝑂𝐿𝑖 = (𝜋 × (𝐷
2)2 × 𝐻) − 𝐻𝑂𝐿𝐷𝑈𝑃𝑖
44
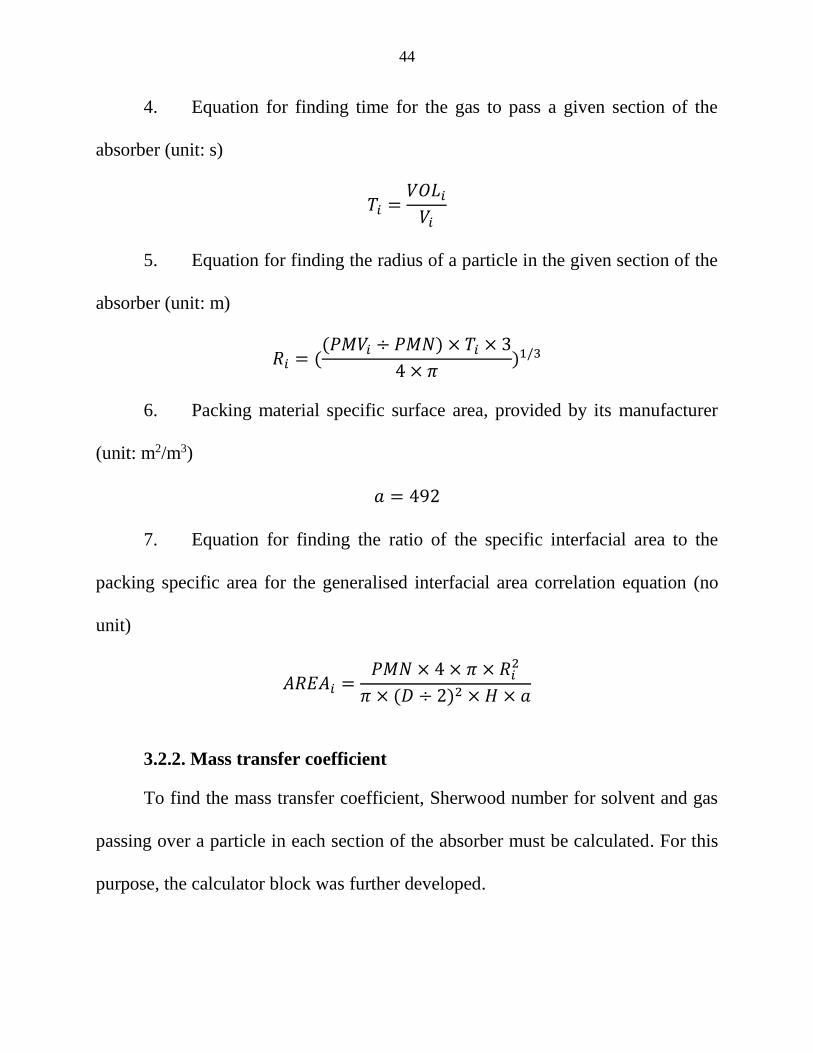
4. Equation for finding time for the gas to pass a given section of the
absorber (unit: s)
𝑇𝑖 =𝑉𝑂𝐿𝑖
𝑉𝑖
5. Equation for finding the radius of a particle in the given section of the
absorber (unit: m)
𝑅𝑖 = ((𝑃𝑀𝑉𝑖 ÷ 𝑃𝑀𝑁) × 𝑇𝑖 × 3
4 × 𝜋)1/3
6. Packing material specific surface area, provided by its manufacturer
(unit: m2/m3)
𝑎 = 492
7. Equation for finding the ratio of the specific interfacial area to the
packing specific area for the generalised interfacial area correlation equation (no
unit)
𝐴𝑅𝐸𝐴𝑖 =𝑃𝑀𝑁 × 4 × 𝜋 × 𝑅𝑖
2
𝜋 × (𝐷 ÷ 2)2 × 𝐻 × 𝑎
3.2.2. Mass transfer coefficient
To find the mass transfer coefficient, Sherwood number for solvent and gas
passing over a particle in each section of the absorber must be calculated. For this
purpose, the calculator block was further developed.

45
Sherwood number for liquid
Defined variables are same as shown in Table 3.2.1.1.
Set of equations for calculating the liquid Sherwood number is as follows:
1. Sherwood number is defined as
𝑆ℎ =𝑘 × 𝐿
𝐷
Where k – convective mass transfer film coefficient (m/s),
L – characteristic length (m)
D – mass diffusivity (m2/s)
2. Convective mass transfer film coefficient is defined as follows
𝑘 =𝐷
𝜎
Where D - mass diffusivity (m2/s)
σ – film thickness (m)
3. Rearranging gives
𝑆ℎ =𝐷 × 𝐿
𝐷 × 𝜎=
𝐿
𝜎
4. Column diameter, DC can be used for the characteristic length. Film
thickness was assumed to be equal to the radius of the particle, R. Thus,
𝐴𝑒𝑟𝑜𝑠𝑖 =𝐷𝐶
𝑅𝑖
5. Equation for finding volume of the section available for gas (unit: m3)

46
𝑉𝑂𝐿𝑖 = (𝜋 × (𝐷
2)2 × 𝐻) − 𝐻𝑂𝐿𝐷𝑈𝑃𝑖
6. Equation for finding time for the gas to pass a given section of the
absorber (unit: s)
𝑇𝑖 =𝑉𝑂𝐿𝑖
𝑉𝑖
7. Equation for finding the radius of a particle in the given section of the
absorber (unit: m)
𝑅𝑖 = ((𝑃𝑀𝑉𝑖 ÷ 𝑃𝑀𝑁) × 𝑇𝑖 × 3
4 × 𝜋)1/3
Sherwood number for vapour
Frossling equation for finding Sherwood number is as follows (Rousseau,
1987, p.114):
𝑆ℎ𝑉 = 2 + 0.6 × 𝑅𝑒1/2 × 𝑆𝑐1/3
Where Re – Reynolds number,
Sc – Schmidt number.
As gas and particulate matter are assumed to be stationary relative to each
other, Reynolds number becomes zero, and Sherwood number equals two.
3.2.3. Assumptions
1. Solvent and particulate phases do not interact with each other.
2. No coagulation and decay of particles is considered.
3. No nucleation
4. Particles and gas flow co-currently with same velocity

47
3.3. Input parameters
Absorber column parameters, and solvent, flue gas and particulate inlet
parameters were set to imitate a real experimental carbon capture mini-plant
developed and tested by TNO group in Netherlands.
In the experimental mini-plant the flue gas containing particles is generated
in several steps. In the beginning, SO2 gas reacts with air in a reactor. Then, the
product of this reaction consisting of SO3 gas and air is transferred to a quenching
column where H2SO4 is formed as a result of reaction between SO3 and cold water.
At the outlet of the quencher there is a mixture of PM and air. This stream is then
mixed with the flue gas stream and directed into the absorber column.
Inlet stream conditions are specified in Tables 3.3.1, 3.3.2, 3.3.3 and 3.3.4.
Table 3.3.1: Inlet streams parameters
Parameter Flue gas Solvent Particle
Temperature
(oC) 44 40 44
Pressure (bar) 1.12485 1.58325 1.12485
Flowrate
(kmol/h) 0.173004 0.612741 2.49199×10⁻⁵
Table 3.3.2: Flue gas inlet flowrates
Component Value Unit
N2 2765 l/h
O2 735 l/h
CO2 500 l/h
H2O 40 g/h
48
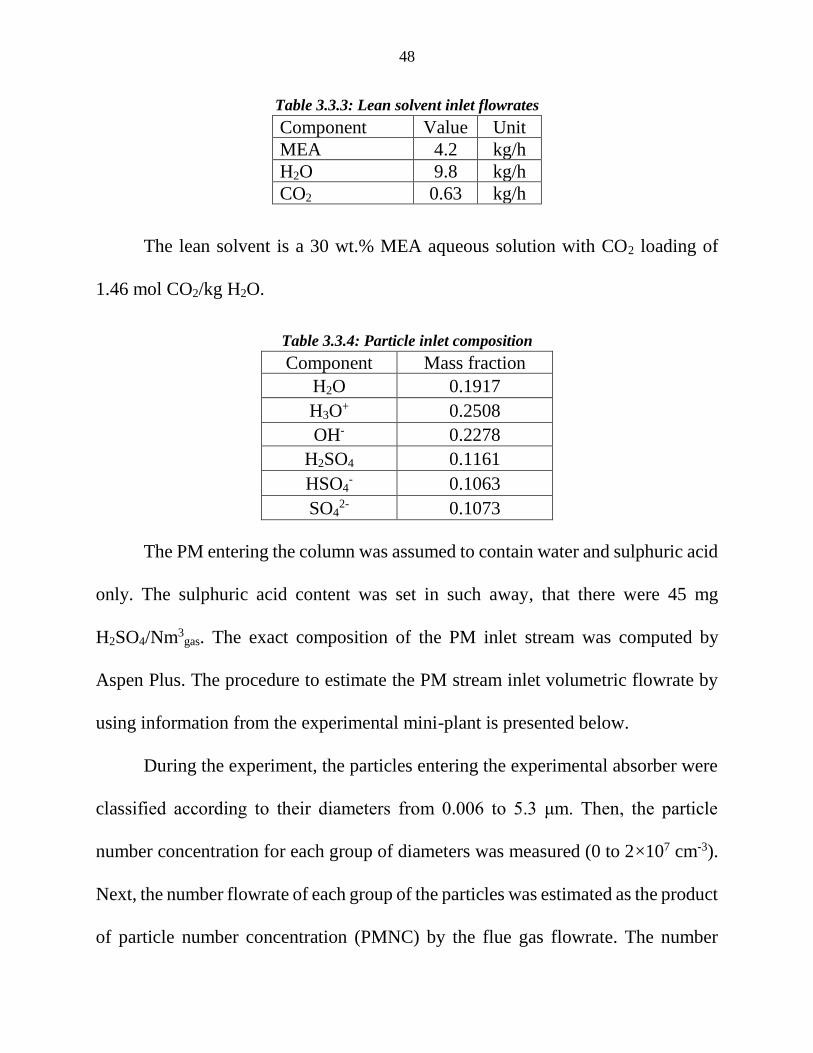
Table 3.3.3: Lean solvent inlet flowrates
Component Value Unit
MEA 4.2 kg/h
H2O 9.8 kg/h
CO2 0.63 kg/h
The lean solvent is a 30 wt.% MEA aqueous solution with CO2 loading of
1.46 mol CO2/kg H2O.
Table 3.3.4: Particle inlet composition
Component Mass fraction
H2O 0.1917
H3O+ 0.2508
OH- 0.2278
H2SO4 0.1161
HSO4- 0.1063
SO42- 0.1073
The PM entering the column was assumed to contain water and sulphuric acid
only. The sulphuric acid content was set in such away, that there were 45 mg
H2SO4/Nm3gas. The exact composition of the PM inlet stream was computed by
Aspen Plus. The procedure to estimate the PM stream inlet volumetric flowrate by
using information from the experimental mini-plant is presented below.
During the experiment, the particles entering the experimental absorber were
classified according to their diameters from 0.006 to 5.3 μm. Then, the particle
number concentration for each group of diameters was measured (0 to 2×107 cm-3).
Next, the number flowrate of each group of the particles was estimated as the product
of particle number concentration (PMNC) by the flue gas flowrate. The number
49
flowrate of each group was then multiplied by the volume of a single particle and
summed up to obtain the volumetric flowrate of the PM stream. The volumetric
flowrate of the particulate matter was found to be 1.59012×10⁻¹⁰ m3/s.
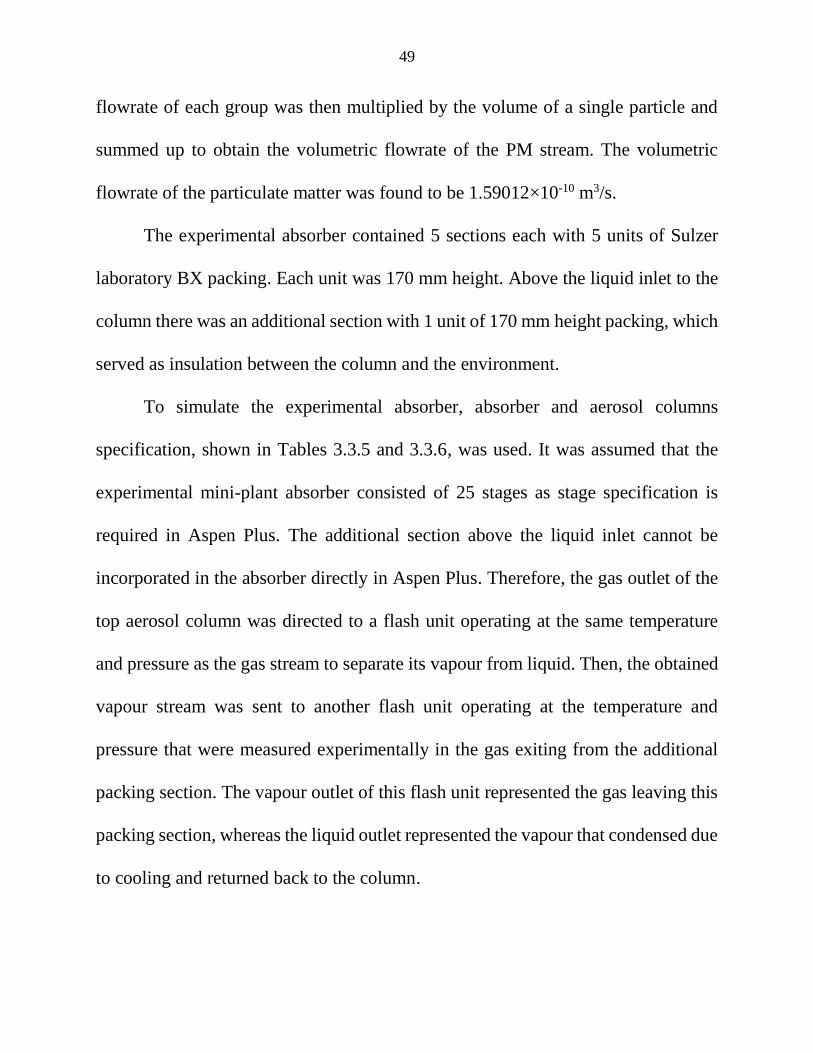
The experimental absorber contained 5 sections each with 5 units of Sulzer
laboratory BX packing. Each unit was 170 mm height. Above the liquid inlet to the
column there was an additional section with 1 unit of 170 mm height packing, which
served as insulation between the column and the environment.
To simulate the experimental absorber, absorber and aerosol columns
specification, shown in Tables 3.3.5 and 3.3.6, was used. It was assumed that the
experimental mini-plant absorber consisted of 25 stages as stage specification is
required in Aspen Plus. The additional section above the liquid inlet cannot be
incorporated in the absorber directly in Aspen Plus. Therefore, the gas outlet of the
top aerosol column was directed to a flash unit operating at the same temperature
and pressure as the gas stream to separate its vapour from liquid. Then, the obtained
vapour stream was sent to another flash unit operating at the temperature and
pressure that were measured experimentally in the gas exiting from the additional
packing section. The vapour outlet of this flash unit represented the gas leaving this
packing section, whereas the liquid outlet represented the vapour that condensed due
to cooling and returned back to the column.

50
Table 3.3.5: Absorber column specification
Parameter Value
Total packing height (m) 4.25
Diameter (m) 0.045
Stages (-) 25
Packing type (-) BX Sulzer Standard
Packing material (-) Standard
Table 3.3.6: Aerosol columns specification
Parameter Value
Sectional packing height (m) 0.17
Diameter (m) 0.045
Stages in section (-) 2
Packing type (-) BX Sulzer Standard
Packing material (-) Standard
3.4. Chemistry and thermodynamic reactions
The chemistry and reaction sets, used in the current study, are same as
provided in “Rate-Based Model of the CO2 Capture Process by MEA” example
(Aspen Plus, 2014). They are shown in tables 3.4.1 and 3.4.2 respectively. The only
modification was addition of sulphuric acid dissociation into the chemistry set for
particle simulation.
Equilibrium constants were computed by minimisation of Gibbs energies by
Aspen. The parameters for kinetic reactions were provided by the Aspen Plus
example (Appendix A).

51
Table 3.4.1: Chemistry set
Rxn No. Reaction type Stoichiometry
1 Equilibrium 2H2O ↔ H3O+ + OH-
2 Equilibrium CO2 + 2H2O ↔ HCO3- + H3O+
3 Equilibrium HCO3- + H2O ↔ CO32- + H3O
+
4 Equilibrium MEAH+ + H2O ↔ MEA + H3O+
5 Equilibrium MEACOO- + H2O ↔ MEA + HCO3-
6 Equilibrium H2SO4 + H2O ↔ H3O+ + HSO4
-
7 Equilibrium HSO4- + H2O ↔ H3O
+ + SO42-
Table 3.4.2: Reactions set
Rxn No. Reaction type Stoichiometry
1 Equilibrium MEAH+ + H2O ↔ MEA + H3O+
2 Equilibrium 2H2O ↔ H3O+ + OH-
3 Equilibrium HCO3- + H2O ↔ CO3
2- + H3O+
4 Kinetic CO2 + OH- → HCO3-
5 Kinetic HCO3- → CO2 + OH-
6 Kinetic MEA + CO2 + H2O → MEACOO- + H3O+
7 Kinetic MEACOO- + H3O+ → MEA + CO2 + H2O
In this study, total MEA refers to MEA, MEAH+ and MEACOO-, collectively.

52
3.5. Supersaturation
The saturation degree of a pure component in a mixture is reported in the
literature to be (Seinfield and Spyros, 2015):
𝑆 =𝑝𝑖(𝑦,𝑇)
𝑝𝑒𝑞(𝑦,𝑇) Eq. (3.5.1)
where p is partial pressure of a condensable component i, peq is the saturation vapour
pressure (dew pressure) of that component in equilibrium at temperature T.
According to Seinfield and Spyros (2015), the precondition for PM formation
through homogeneous nucleation is satisfied when Equation 3.5.1 predicts
supersaturation for a given mixture (S>1). There is no need for individual saturation
values to exceed 1 for nucleation to take place in systems with several condensing
components (Seinfield and Spyros, 2015). Moreover, for systems that contain more
than one condensable component, Equation 3.5.2 is applied (Gretscher and Schaber,
1999):
𝑆 =𝑃𝐶 (𝑇,𝑦1,𝑦2,…𝑦𝑛)
𝑃𝐶𝑆(𝑇,𝑦1,𝑦2,…𝑦𝑛) Eq. (3.5.2)
where PC is the total partial pressure of all condensing vapour components at
the actual temperature T and mole fraction, yi of the supersaturated gas, and PCS is
the total partial pressure of all the condensing components corresponding to the
phase equilibrium. Nevertheless, the extension of Equation 3.5.1 to Equation 3.5.2

53
does not have strong scientific support and may not be sufficient to observe the
supersaturation in a mixture containing several condensing components.
In this work, the method developed by Imle et al. (2014) was utilised in order
to estimate the saturation ratio of the gas inside the absorber column. A gas pseudo
stream, withdrawn from each stage of the absorber column, was directed to a flash
unit, that operated at constant temperature and a vapour fraction of 0.9999. As a
result, the mixture at the outlet of the flash unit had the pressure that represented the
PCS in Equation 3.5.2.
54
Chapter 4 – Results and Discussion
4.1. Absorber temperature profiles
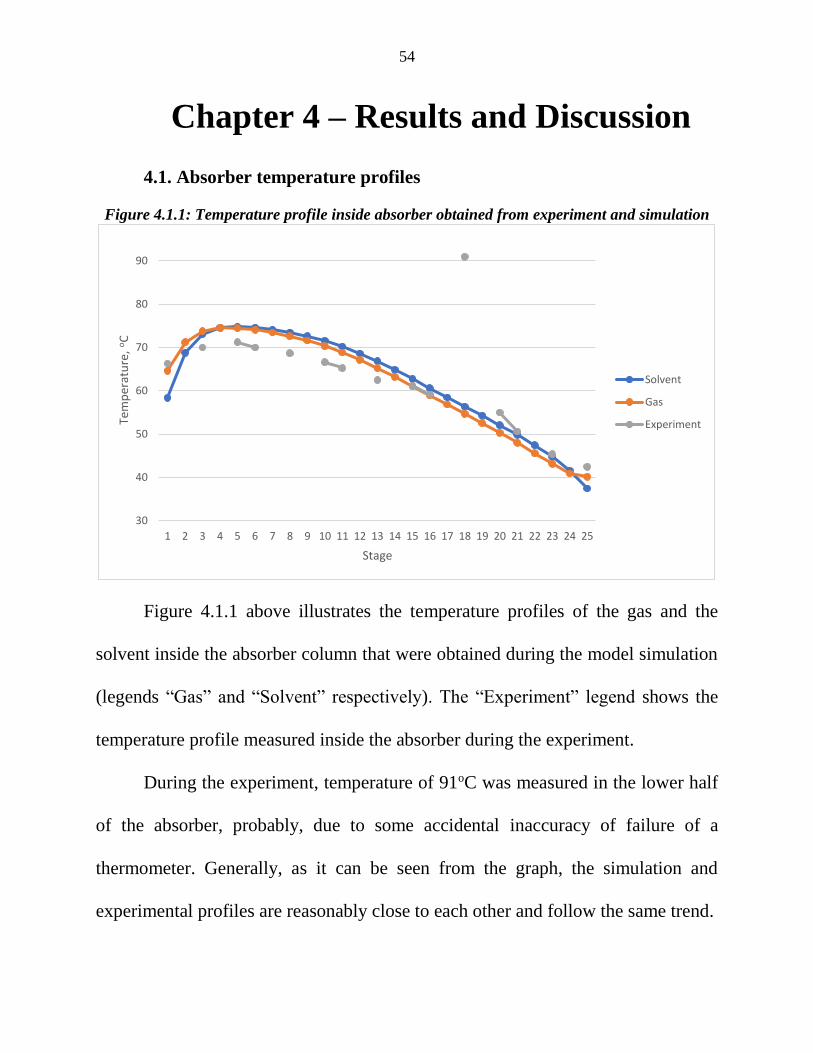
Figure 4.1.1: Temperature profile inside absorber obtained from experiment and simulation
Figure 4.1.1 above illustrates the temperature profiles of the gas and the
solvent inside the absorber column that were obtained during the model simulation
(legends “Gas” and “Solvent” respectively). The “Experiment” legend shows the
temperature profile measured inside the absorber during the experiment.
During the experiment, temperature of 91oC was measured in the lower half
of the absorber, probably, due to some accidental inaccuracy of failure of a
thermometer. Generally, as it can be seen from the graph, the simulation and
experimental profiles are reasonably close to each other and follow the same trend.
30
40
50
60
70
80
90
1 2 3 4 5 6 7 8 9 10 11 12 13 14 15 16 17 18 19 20 21 22 23 24 25
Tem
per
atu
re,
oC
Stage
Solvent
Gas
Experiment

55
The obtained profiles are typical for CO2 absorption process. Similar
temperature profiles were obtained in experiments (Khakharia et al., 2013) and
simulations (Imle et al., 2014, Khakharia et al., 2014a). Temperature of the gas
increases while it moves from the bottom of the column up to stage 4 due to
exothermic nature of reaction between CO2 and MEA. In the region above stage 4,
the temperature goes down because of a leading effect of heat transfer from the gas
to the cold solvent entering from the top. The temperature difference between the
maximum flue gas temperature and its temperature at the top of the absorber is
known as the temperature bulge. (Khakharia et al., 2013)
4.2. MEA, H2O and CO2 mole flows in gas and particle phases
Figure 4.2.1. Total MEA mole flow in particle and gas phases
0.00E+00
1.00E-11
2.00E-11
3.00E-11
4.00E-11
5.00E-11
6.00E-11
7.00E-11
0.00E+00
5.00E-09
1.00E-08
1.50E-08
2.00E-08
2.50E-08
3.00E-08
1 3 5 7 9 11 13 15 17 19 21 23 25
Par
ticl
e M
EA (
kmo
l/s)
Gas
MEA
(km
ol/
s)
Stage
Gas phase
Particle phase

56
Figure 4.2.1 shows that MEA mole flowrate in the particle phase gradually
increases along the column. The same result was obtained by Majeed et al. (2017a).
It increases because the gas and the particle phases interact with each other while
moving from the bottom of the column to the top. As the temperature increases,
MEA from the solvent evaporates, and then it is transferred from the gas to the
particles. At the outlet of the absorber MEA flowrate in the particle phase was
estimated to be 6.12×10⁻¹¹ kmol/s or 0.28 mg/Nm3. Hereinafter, the normal condition
for the gas was considered to be 293.15 K and 101325 Pa.
MEA mole flow profile in the gas phase is also illustrated in Figure 4.2.1. It
follows the same trend as the partial pressure profile of MEA in the gas phase studied
by Majeed et al. (2017b). MEA mole flow in gas gradually increases from the bottom
of the column up to stage 4. Then it decreases significantly until the top of the
packing, reaching 1.59×10⁻⁸ kmol/s or 751 mg/Nm3. This profile can be related to
the temperature profile inside the absorber. As the temperature increases, MEA
evaporates and transfers to the gas phase. When the temperature decreases at the top
of the column, amount of MEA evaporated decreases.
57
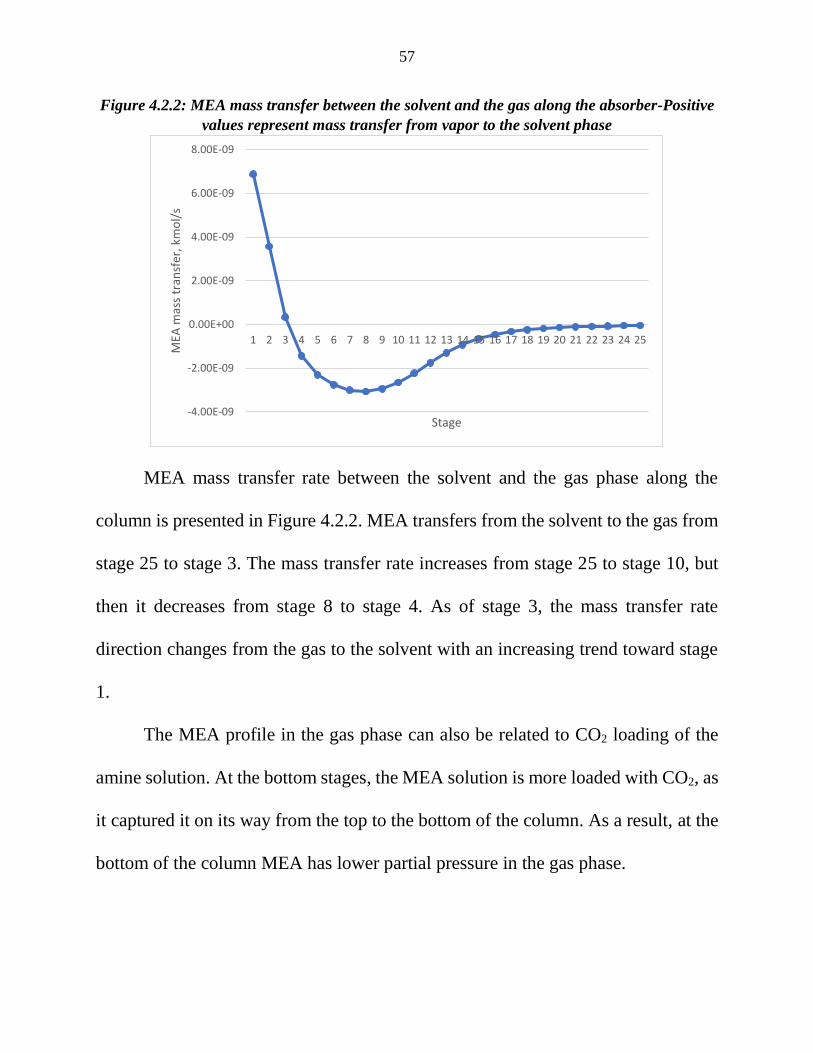
Figure 4.2.2: MEA mass transfer between the solvent and the gas along the absorber-Positive
values represent mass transfer from vapor to the solvent phase
MEA mass transfer rate between the solvent and the gas phase along the
column is presented in Figure 4.2.2. MEA transfers from the solvent to the gas from
stage 25 to stage 3. The mass transfer rate increases from stage 25 to stage 10, but
then it decreases from stage 8 to stage 4. As of stage 3, the mass transfer rate
direction changes from the gas to the solvent with an increasing trend toward stage
1.
The MEA profile in the gas phase can also be related to CO2 loading of the
amine solution. At the bottom stages, the MEA solution is more loaded with CO2, as
it captured it on its way from the top to the bottom of the column. As a result, at the
bottom of the column MEA has lower partial pressure in the gas phase.
-4.00E-09
-2.00E-09
0.00E+00
2.00E-09
4.00E-09
6.00E-09
8.00E-09
1 2 3 4 5 6 7 8 9 10 11 12 13 14 15 16 17 18 19 20 21 22 23 24 25
MEA
mas
s tr
ansf
er, k
mo
l/s
Stage

58
As was mentioned, there was an additional packing section installed above
the liquid inlet to the column that served as an insulation resulting in the exit gas
temperature decrease from 68oC to 53oC. When the temperature of the gas decreases,
a certain fraction condenses and flows back to the column in the form of liquid,
which has MEA in it. The rest of the gas exits the column. It was found that the gas
cooled to 53oC has just 1.32 mg MEA/Nm3.
Figure 4.2.3: Total H2O mole flow in the particle and the gas phases
Figure 4.2.3 shows water mole flowrate in the gas and the particle phases. In
the gas phase the water mole flowrate strongly depends on the temperature profile.
As the temperature increases, water evaporates from the solvent and transfers to the
gas phase. At the top of the column, as the temperature decreases, the water
condenses back to the solvent. The same profile was obtained for partial pressure of
H2O development along the absorber by Majeed et al. (2017b). The flowrate in the
5.00E-09
5.50E-09
6.00E-09
6.50E-09
7.00E-09
7.50E-09
5.00E-09
5.01E-06
1.00E-05
1.50E-05
2.00E-05
2.50E-05
1 3 5 7 9 11 13 15 17 19 21 23 25
Par
ticl
e H
2O (
kmo
l/s)
Gas
H2O
(km
ol/
s)
Stage
Gas phase
Particle phase

59
particle phase steadily increases along the column and reaches its maximum at stage
3, then it slightly decreases until stage 1. The mole flowrate of water in the particle
phase depends on amount of water that is transferred to it from the gas phase. As at
the top of the absorber mole flowrate of water in the gas phase decreases, less water
is transferred to the particle phase.
Figure 4.2.4. Water mass transfer between the solvent and the gas along the absorber-Positive
values represent mass transfer from vapor to the PM phase
The water mass transfer rate from the solvent to the gas (Figure 4.2.4)
fluctuates from stage 25 to stage 5. However, as of stage 4, the transfer direction
reverses from the gas to the solvent with an increasing trend.
-2.00E-06
-1.00E-06
0.00E+00
1.00E-06
2.00E-06
3.00E-06
4.00E-06
5.00E-06
6.00E-06
1 2 3 4 5 6 7 8 9 10 11 12 13 14 15 16 17 18 19 20 21 22 23 24 25
Wat
er m
ass
tran
sfer
, km
ol/
s
Stage
60
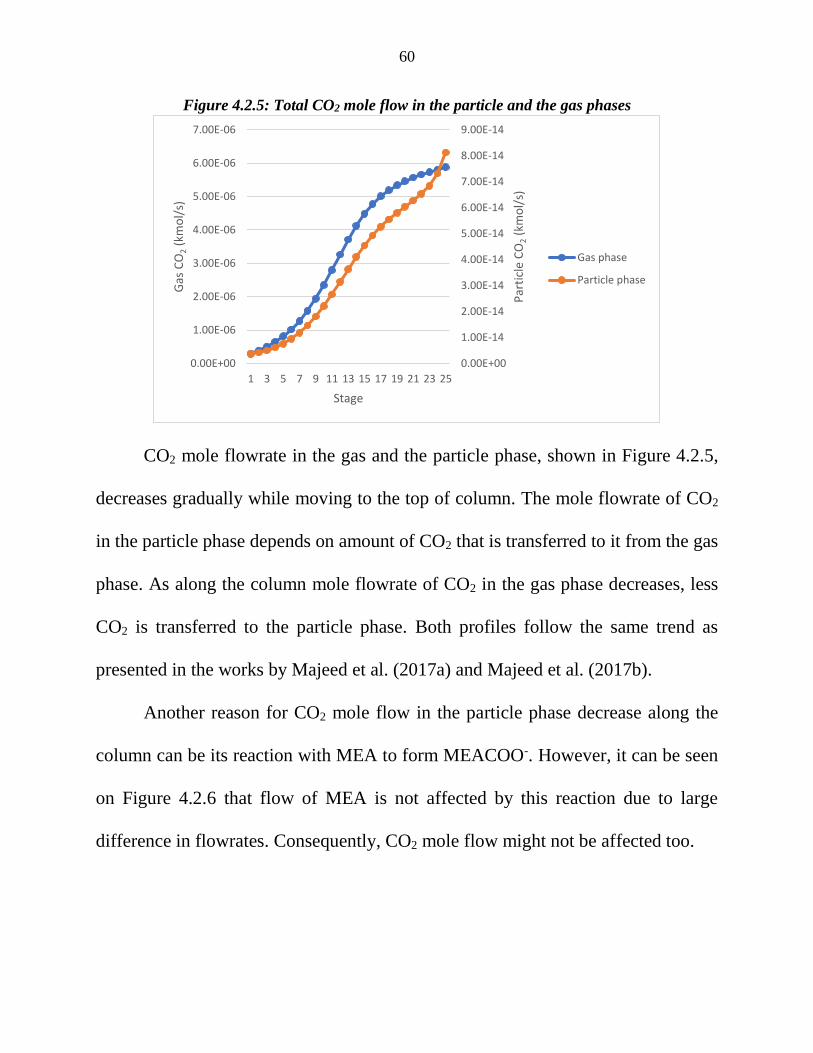
Figure 4.2.5: Total CO2 mole flow in the particle and the gas phases
CO2 mole flowrate in the gas and the particle phase, shown in Figure 4.2.5,
decreases gradually while moving to the top of column. The mole flowrate of CO2
in the particle phase depends on amount of CO2 that is transferred to it from the gas
phase. As along the column mole flowrate of CO2 in the gas phase decreases, less
CO2 is transferred to the particle phase. Both profiles follow the same trend as
presented in the works by Majeed et al. (2017a) and Majeed et al. (2017b).
Another reason for CO2 mole flow in the particle phase decrease along the
column can be its reaction with MEA to form MEACOO-. However, it can be seen
on Figure 4.2.6 that flow of MEA is not affected by this reaction due to large
difference in flowrates. Consequently, CO2 mole flow might not be affected too.
0.00E+00
1.00E-14
2.00E-14
3.00E-14
4.00E-14
5.00E-14
6.00E-14
7.00E-14
8.00E-14
9.00E-14
0.00E+00
1.00E-06
2.00E-06
3.00E-06
4.00E-06
5.00E-06
6.00E-06
7.00E-06
1 3 5 7 9 11 13 15 17 19 21 23 25
Par
ticl
e C
O2
(km
ol/
s)
Gas
CO
2(k
mo
l/s)
Stage
Gas phase
Particle phase
61
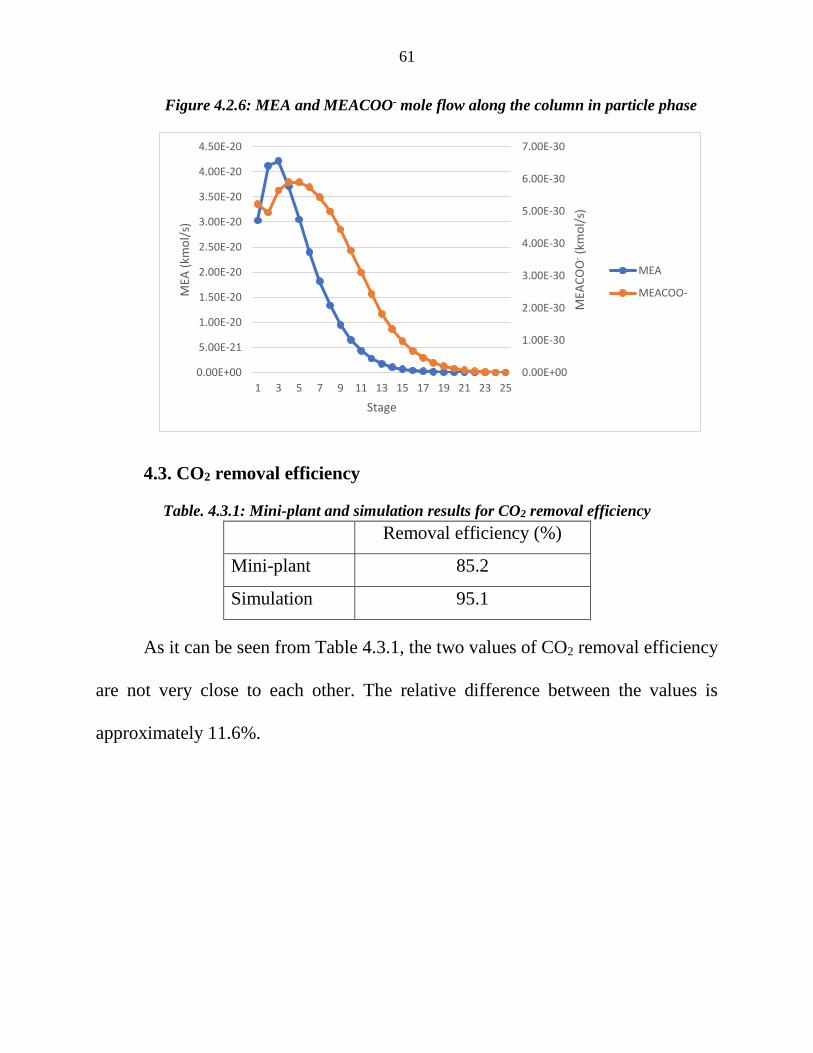
Figure 4.2.6: MEA and MEACOO- mole flow along the column in particle phase
4.3. CO2 removal efficiency
Table. 4.3.1: Mini-plant and simulation results for CO2 removal efficiency
Removal efficiency (%)
Mini-plant 85.2
Simulation 95.1
As it can be seen from Table 4.3.1, the two values of CO2 removal efficiency
are not very close to each other. The relative difference between the values is
approximately 11.6%.
0.00E+00
1.00E-30
2.00E-30
3.00E-30
4.00E-30
5.00E-30
6.00E-30
7.00E-30
0.00E+00
5.00E-21
1.00E-20
1.50E-20
2.00E-20
2.50E-20
3.00E-20
3.50E-20
4.00E-20
4.50E-20
1 3 5 7 9 11 13 15 17 19 21 23 25
MEA
CO
O-(k
mo
l/s)
MEA
(km
ol/
s)
Stage
MEA
MEACOO-
62
4.4. Gas particles saturation
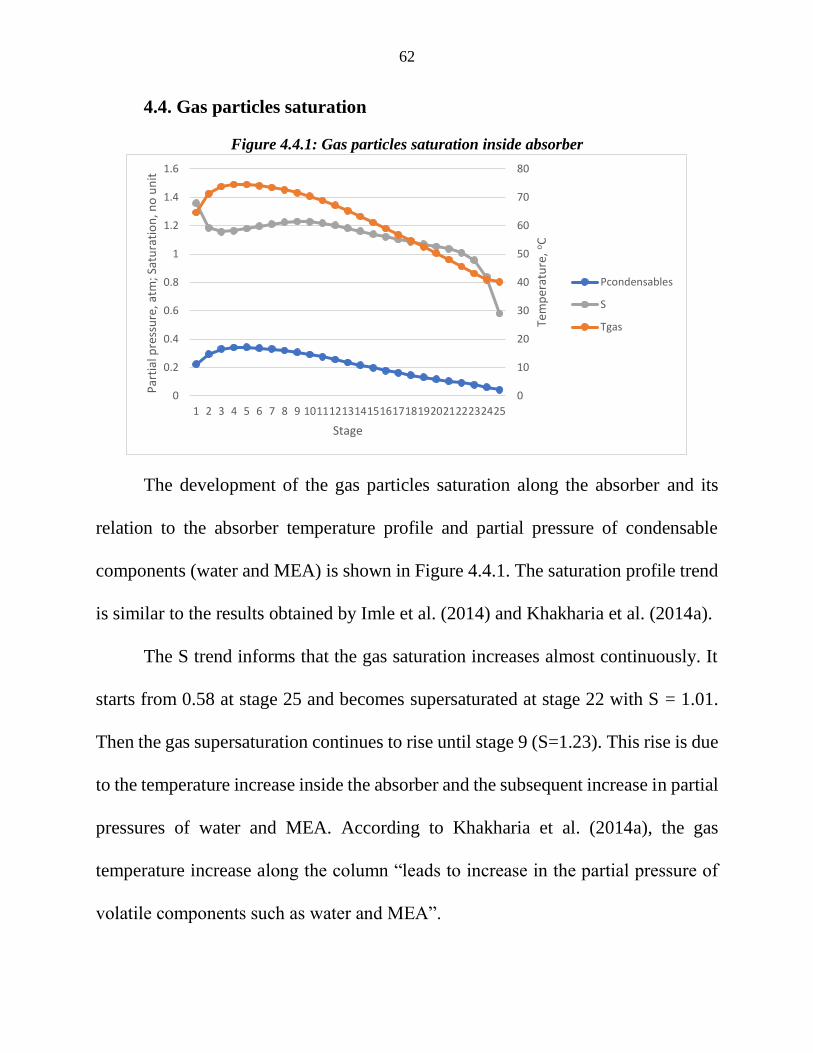
Figure 4.4.1: Gas particles saturation inside absorber
The development of the gas particles saturation along the absorber and its
relation to the absorber temperature profile and partial pressure of condensable
components (water and MEA) is shown in Figure 4.4.1. The saturation profile trend
is similar to the results obtained by Imle et al. (2014) and Khakharia et al. (2014a).
The S trend informs that the gas saturation increases almost continuously. It
starts from 0.58 at stage 25 and becomes supersaturated at stage 22 with S = 1.01.
Then the gas supersaturation continues to rise until stage 9 (S=1.23). This rise is due
to the temperature increase inside the absorber and the subsequent increase in partial
pressures of water and MEA. According to Khakharia et al. (2014a), the gas
temperature increase along the column “leads to increase in the partial pressure of
volatile components such as water and MEA”.
0
10
20
30
40
50
60
70
80
0
0.2
0.4
0.6
0.8
1
1.2
1.4
1.6
1 2 3 4 5 6 7 8 9 10111213141516171819202122232425
Tem
per
atu
re,
oC
Par
tial
pre
ssu
re, a
tm;
Satu
rati
on
, no
un
it
Stage
Pcondensables
S
Tgas
63
Along stages 9 to 3, gas supersaturation decreases reaching the local minimum
value of 1.16. The decrease mainly occurs because the temperature increase rate
slowed down, and the partial pressures of volatile components stopped increasing
and started to decrease.
At stages 2 and 1 the gas phase meets cold solvent. As a result, the temperature
of the gas drops from 73.8oC at stage 3 to 71.2oC at stage 2 and to 64.6oC at stage 1.
Temperature bulge at the top of the absorber results in the gas becoming colder than
the solvent. Therefore, the gas saturation ratio in this area increases significantly
(Khakharia et al., 2014a). As a result, the gas saturation jumps to S = 1.36 at stage
1.
Saturation and consequent supersaturation can contribute to the particle
growth in size. As it was already mentioned, when a particle becomes
supersaturated, “nuclei are formed by molecules of condensing components and/or
on the impurities in the flue gas” (Khakharia et al., 2014a). This is referred to
homogeneous and heterogeneous nucleation respectively. It means that when
heterogeneous nucleation takes place, condensing components, such as MEA and
water, attach to the existing aerosol particles and, thus, the size of particles increases.
Whereas when homogeneous nucleation occurs, then new aerosol particles appear
by condensed components.

64
4.5. Particle total volumetric flowrate
Figure 4.5.1: Particle volumetric flowrate profile
Particle total volumetric flowrate continuously increases from the bottom of
the column up to stages 2 and 3. It then slightly decreases at stage 1 (Fig. 4.6.1). An
increase in mole flow of condensable components, such as MEA and water, in the
particle phase results in total particle flowrate increase. As water mole flow in the
particle phase is two orders of magnitude higher than that of MEA, it has more effect
on total particle volumetric flowrate.
This finding is in accordance with the work by Mertens et al. (2014), that
states that particles grow inside the absorber due to the uptake of MEA and water by
particles.
1.5E-10
1.55E-10
1.6E-10
1.65E-10
1.7E-10
1.75E-10
1.8E-10
1.85E-10
1.9E-10
1.95E-10
1 2 3 4 5 6 7 8 9 10 11 12 13 14 15 16 17 18 19 20 21 22 23 24 25
Par
ticl
e (m
3 /s)
Stage

65
4.6. Dependence of outlet gas and aerosol MEA on particle inlet flowrate
Figure 4.6.1: Outlet gas and aerosol MEA (mg/Nm3) vs inlet particle volumetric flowrate
(m3/s)
According to Khakharia et al. (2014a), particle MEA concentration in the
outlet gas can reach several grams per Nm3. However, in the current study particle
MEA concentration is in the order of several mg per Nm3. To understand the result
obtained and its cause, the plot shown on Figure 4.6.1 was created.
It can be seen from Figure 4.6.1 that there is a dependence of outlet particle
MEA concentration on inlet particle volumetric flowrate. Based on the information
shown in Figure 4.6.1, it can be noticed that the relation might be hyperbolic.
Evidently, the trend will continue at higher inlet particle flowrates.
This phenomenon can occur because higher flowrate of the PM phase
increases its mass transfer rate. To confirm this hypothesis, MEA mass transfer rate
from gas to particles estimated at the top stage by Aspen Plus was compared at
1.59E-10
2.00E-10
3.00E-10
4.00E-10
6.00E-10
7.00E-10
8.00E-10
1.00E-09
1.50E-09
2.00E-09
3.00E-09
3.64E-09
4.85E-09
1.45E-08
Aerosol 2.9 4.5 4.7 5.7 7.5 8.5 9.9 12.8 13.4 16.5 22.8 28.1 57.2 117.0
Gas 752.4 752.2 752.2 752.1 752.0 751.9 751.8 751.5 751.3 751.1 750.7 750.3 747.8 742.7
0.0
100.0
200.0
300.0
400.0
500.0
600.0
700.0
800.0
Tota
l MEA
, mg/
Nm
3

66
different PM inlet flowrates. In the baseline case, when the PM inlet volumetric
flowrate was 1.59012×10⁻¹⁰ m3/s, the MEA mass transfer from the gas phase to the
particle phase was 5.3×10⁻¹² kmol/s. In comparison, when the PM inlet volumetric
flowrate was increased to 2.5×10⁻⁹ m3/s, the MEA mass transfer from gas to particles
became 3.58×10⁻¹¹ kmol/s. At the PM inlet flowrate of 3.927×10⁻⁷ m3/s, MEA mass
transfer was 1.71×10⁻⁹ kmol/s.
4.7. Dependence of gas and particle MEA profiles on H2SO4 initial
concentration
Figure 4.7.1: Gas and particle MEA profiles
Figure 4.7.1 illustrates gas and particle MEA profiles along the absorber at
two levels of H2SO4 concentration in the inlet flue gas: high (45 mg/Nm3) and low
(12 mg/Nm3).
0.00E+00
5.00E-09
1.00E-08
1.50E-08
2.00E-08
2.50E-08
3.00E-08
0.00E+00
1.00E-11
2.00E-11
3.00E-11
4.00E-11
5.00E-11
6.00E-11
7.00E-11
1 3 5 7 9 11 13 15 17 19 21 23 25
Tota
l par
ticl
e M
EA (
kmo
l/s)
Stage
High, particle
Low, particle
Low, gas
High, gas

67
It can be seen that the high initial H2SO4 concentration results in slightly
higher profile of total particle MEA along the absorber than the low initial H2SO4
concentration. Particle MEA emission at the outlet of the absorber at high H2SO4
concentration was observed to be 6.12×10⁻¹¹ kmol/s. At low H2SO4 concentration it
was found to be 5.41×10⁻¹¹ kmol/s. At high inlet H2SO4 concentration the MEA mass
transfer rate from the gas to the particle phase in the top aerosol column was
approximately 3.24×10⁻¹² kmol/s. At low inlet H2SO4 concentration, the MEA mass
transfer rate was approximately 2.82×10⁻¹² kmol/s. It can be noted that the increase
in MEA emission is not as significant as increase in H2SO4 concentration. In
comparison, the gas phase MEA emission was found to be independent of the H2SO4
concentration in the inlet flue gas as in both cases the profiles copy each other.
4.8. Particle size profile along the column
Figure 4.8.1. Particle size profile along the column
0.160
0.165
0.170
0.175
0.180
0.185
0.190
0.195
0.200
1 2 3 4 5 6 7 8 9 10 11 12 13 14 15 16 17 18 19 20 21 22 23 24 25
Par
ticl
e d
iam
eter
, μm
Stage

68
Figure 4.8.1. shows that the particle size gradually increases as it enters the
absorber column up to stage 4. At stage 25 the particle size was 0.162 μm. At stage
4 it reached 0.196 μm. Then the size of particles slightly decreases until the top of
the column reaching the size of 0.183 μm at the top stage. If mass size distribution
was studied experimentally, this particles size would be representative of the mode
particle diameter.
Comparing Figure 4.8.1 with Figures 4.2.1 and 4.2.3 shows relation between
particle diameter and the mole flows of MEA and water in the PM phase. As the
mole flow of condensable components, such as MEA and water, in the particle phase
increases along the column, the particle size also grows. As the water mole flow in
the particle phase is two orders of magnitude higher than that of MEA, it has a higher
effect on the particle diameter. In addition, the total particle volumetric flowrate
increases along the column (Figure 4.5.1) as a result of particle size increase.
The particle size profile is similar to what was found in literature. In particular,
Majeed et al. (2017a) found that particles decrease in size slightly at the bottom and
the top of the column, and significantly increase along the main body of the column.

69
4.9. Total MEA concentration in combined gas and particle phase
Table 4.9.1: Mini-plant and simulation results for total MEA concentration in combined gas
and particle phase
Steady state value (mg/Nm3) Range (mg/Nm3)
Mini-plant 595 590 - 600
Simulation 754 -
As it can be seen from Table 4.9.1, the total MEA concentration value in the
combined gas and particle phase at the outlet of the absorber from the simulation
and the experiment are the same order of magnitude. The relative error is
approximately 27%. However, when there were no particle nuclei in the flue gas, the
MEA emission was 150 mg/Nm3. Therefore, particle contribution to the MEA
emission from the mini-plant at steady-state operation was 445 mg/Nm3. These
values sharply differ from what was found in this simulation (1.32 mg/Nm3 and 0.28
mg/Nm3 respectively). The gas phase MEA concentration found experimentally can
be higher than that found in simulation because a certain fraction of the MEA,
condensed in the packing section above the liquid inlet, can be picked up by the gas
to the exit from the column. The difference in the particle phase MEA concentration
can occur because of nucleation phenomenon, which is discussed in the following
section. Moreover, the differences can arise because experimental measurements of
the MEA emission is a difficult task and could be subject to measurement
uncertainties (Khakharia et al., 2014b).

70
4.10. Nucleation rate
In theory, minimisation of the Gibbs energy of a supersaturated gas at constant
temperature and pressure results in saturation of the gas, and subsequent formation
of new particulate matter from the excess mass leaving the gas phase (Seinfield and
Spyros, 2016). The formed PM and the remaining gas are then in equilibrium. The
obtained mass of the particulate matter can be estimated as the sum of the masses
produced through two mechanisms: molecular mass trasnfer to the preexisting
particles and the mass transfer due to the cluster formation (nucleation). In the
present study, a rate-based model was implemented to estimate mass transfer
between the supersaturated gas and the particles in aerosol columns. This mass
transfer is understood to be molecular mass transfer because existing theoretical and
empirical mass transfer correlations in literature typically estimate the molecular
mass transfer rather than nucleation mass transfer. Therefore, there is a possibility
to improve results of the current study by taking into account MEA loss due to
nucleation. In this regard, the Gibbs energy of the vapour stream leaving the top
aerosol column was minimised by directing it to a flash unit in Aspen Plus, operated
at the same temperature (337.78 K) and pressure (1 atm) of the vapour stream. The
flash unit produced the total liquid mass of 1.92414×10⁻⁶ kg/s. The estimated total
mass transfer rate from the gas phase at the top of the absorber column to the particle
phase was found to be -7.3×10⁻¹⁰ kg/s, indicating net mass transfer direction from

71
the particle to the gas phase. Thus, the mass transfer due to the nucleation was
estimated to be approximately (1.92414×10⁻⁶ kg/s - (-7.3×10⁻¹⁰ kg/s) 1.92487×10⁻⁶
kg/s, representing an estimate of the total particle formation due to nucleation. If the
diameter of the particles leaving the column is 0.183 µm, then the estimated
nucleation rate would approximately be 2×10¹⁵ particles.cm-3.s-1, respectively.
In general, depending on the method used to estimate the nucleation rate, their
values can range over several orders of magnitude (Diemand et al., 2013, Sosso et
al., 2016). Experimental value for nucleation rate of water is found to be three orders
of magnitude less than the value obtained by classical nucleation theory (CNT)
(Sosso et al., 2016). Seven orders of magnitude difference was reported between the
value found in the study of homogeneous nucleation of water in an argon media
using molecular dynamics (MD) simulation, performed by Yasuoka and Matsumoto,
and the theoretical value (Yasuoka et al., 1998a). MD simulations were also used in
another study by Yasuoka and Matsumoto to estimate nucleation rate of water at
350K (Yasuoka et al., 1998b). The nucleation rate was identified to be 4.21×1029
cm-3s-1, whereas the value calculated using CNT was 3.7×1028 cm-3s-1. Nucleation
rate for CO2 at 269 K was reported by Horsch et al. (2008) to be 4.1×1027 cm-3s-1,
and the value predicted by CNT was 2.5×1027 cm-3s-1. To summarise, CNT model
values for nucleation rate differ from experimental values by up to 26 orders of
72
magnitude, whereas MD simulation results in up to 14 orders of magnitude
difference from experimental values (Sosso et al., 2016).
The nucleation values, reported in this study, should not be considered as an
exact value of the nucleation rate for such a system. Currently, there are no
experimental and modelling nucleation data for such a multicomponent mixture in
the absorption column. Hence, the nucleation rate estimated in this work can serve
as a starting point to improve the simulation results using commercial software that
exclude nucleation rate in their calculations.
In this work, it was attempted to correct the estimated MEA loss through the
PM phase. The flowrate of the total MEA in the flash liquid outlet stream
(8.15893×10⁻⁷ kg/s) was considered as the MEA formed due to the nucleation and
molecular mass transfer. Using the rate-based method, the MEA mass transfer rate
from the gas phase to the particle phase due to the molecular diffusion (mass
transfer) was estimated to be 3.25×10⁻¹⁰ kg/s. Hence, the mass transfer due to the
nucleation was estimated to be 8.15568×10⁻⁷ kg/s. Given the nucleation mass
transfer for MEA and the gas flowrate inside the aerosol column, the total MEA
emission through the PM due to the nucleation is estimated to be 696.98 mg/Nm3.
Finally, the particulate phase total MEA concentration (molecular and nucleation
mass transfer rates) is estimated to be (0.28 mg/Nm3gas + 696.98 mg/Nm3
gas) 697.3
mg/Nm3gas.

73
Chapter 5 - Conclusion and Future
Work
The new conceptual model to estimate heat and mass transfer rates between
gas and particulate phases using Aspen Plus simulation software presented in this
work was successfully validated with the results of the experimental carbon capture
mini-plant. The model simulation was used in order to estimate MEA loss through
the particle phase and factors that influence it.
Particle formation and growth is a complex phenomenon that depends on
multiple factors. High temperature inside the absorber results in evaporation of MEA
from the solvent to the gas phase, and, subsequently, in its transfer to the particle
phase. Temperature bulge in the upper zone of the absorber results in the
supersaturation jump just before the exit from the column and a subsequent
condensation of MEA on particles’ surface. Transfer of condensable components to
the particle phase results in the increase in the particle size and volumetric flowrate
along the column. When the inlet flowrate of particle phase increases, particle phase
MEA emissions increase because more MEA is transferred to particles. Increasing
H2SO4 concentration in the inlet gas also results in particle phase MEA emission
increase.
Definitely, aerosol phenomenon needs continuous research to better
understand mechanisms of particle formation and growth. Similarly to other studies,
74
Equation 3.5.2 was employed in this work to predict the saturation ratio of a
condensable mixture. Equation 3.5.2 is the extension of Equation 3.5.1 but for a
multicomponent mixture. However, this extension does not have strong scientific
support. One concern regarding Equation 3.5.2 is that particle nucleation can occur
at S values below 1. In addition, Equation 3.5.2 estimates nucleation of the whole
condensing mixture, resulting in a multicomponent PM phase. A detailed study is
required in future to evaluate reliability of Equation 3.5.2.
Different particle size distribution can be used along the column if such kind
of information is available from experiments. Another issue of this study was its
inability to predict particle decay on their way through the column. Namely, particle
coagulation and particle attachment to the inside surfaces of the column are
expected. Particle coagulation takes place when particle number concentrations
increase such that particles start to coagulate and grow in size but not in mass.
Particle attachment occurs when particles attach to inner surfaces of the column,
such as wall and mechanical parts. Finally, the current model does not estimate
particle nucleation rates. If such information is found from experiments or
modelling, then it can be integrated in this model to obtain more accurate results.

75
List of References Abu Zahra, M. R. M. 2009. Carbon dioxide capture from flue gas. Development and
evaluation of existing and novel process concepts. Ph. D. thesis. Delft University of
Technology.
Alie, C., Backham, L., Croiset, E. and Douglas, P. L. 2005. Simulation of CO2
capture using MEA scrubbing: a flowsheet decomposition method. Energy
Conversion and Management. 46, pp. 475-487.
Aspen Technology, Inc. 2014. Rate-Based Model of the CO2 Capture Process by
MEA using Aspen Plus. Available from:
http://home.aspentech.com/products/engineering/aspen-plus
Brachert, L., Mertens, J., Khakharia, P. and Schaber, K., 2014. The challenge of
measuring sulfuric acid aerosols: number concentration and size evaluation using a
condensation particle counter (CPC) and an electrical low pressure impactor
(ELPI+). Journal of Aerosol Science. 67, pp. 21–27.
Bravo, J.L., Rocha, J.A. and Fair, J.R., 1985. Mass transfer in gauze
packings. Hydrocarbon processing, 64 (1), pp.91-95.
Da Silva, E.F., Kolderup, H., Goetheer, E., Hjarbo, K.W., Huizinga, A., Khakharia,
P., Tuinman, I., Mejdell, T., Zahlsen, K., Vernstad, K., Hyldbakk, A., Holten, T.,
Kvamsdal, H.M., van Os and P., Einbu, A. 2013. Emission studies from a CO2
capture pilot plant. Energy Procedia. 37, pp. 778–783.
Diemand, J., et al., Large scale molecular dynamics simulations of homogeneous
nucleation. The Journal of Chemical Physics, 2013. 139(7): p. 074309.
Fujita, K, Muraoka, D., Kaseda, T., Saito, S., Kitamura, H., Kato, Y., Udatsu, M.,
Handa, Y. and Suzuki, K. 2017. Impact of the aerosol particle included in actual flue
gas on amine mist formation/growth in the Post-Combustion Capture Pilot Plant.
Energy Procedia. 114, pp. 930-938.
Fulk, S. M., Beaudry, M. R., Rochelle, G. T. 2017. Amine Aerosol Characterization
by Phase Doppler Interferometry. Energy Procedia. 114, pp. 939-951.
Gretscher, H. and Schaber, K. 1999. Aerosol formation by heterogeneous nucleation
in wet scrubbing processes. Chemical Engineering and Processing. 38, pp. 541–548.
Horsch, M., et al., Homogeneous nucleation in supersaturated vapors of methane,
ethane, and carbon dioxide predicted by brute force molecular dynamics. The
Journal of Chemical Physics, 2008. 128(16): p. 164510.

76
IEA Clean Coal Center. 2007. Post-combustion carbon capture from coal fired
plants – solvent scrubbing. Available from: http://www.iea-
coal.org.uk/documents/81793/6448/Carbon-capture
Imle, M., von Harbou, E., Brachert, L., Schaber, K. and Hasse, H. 2014. Predicting
supersaturation by rate-based simulations of reactive absorption. Chemical
Engineering Science. 118, pp. 41-49.
Khakharia, P., Brachert, L., Mertens, J., Huizinga, A., Schallert, B., Schaber, K.,
Vlugt, T. G. H. and Goetheer, E. 2013. Investigation of aerosol based emission of
MEA due to sulphuric acidaerosol and soot in a Post Combustion CO2 Capture
process. International Journal of Greenhouse Gas Control.
Khakharia, P., Mertens, J., Vlugt, T. J. H. and Goetheer, E. 2014a. Predicting
Aerosol Based Emissions in a Post Combustion CO2 Capture Process Using an
Aspen Plus Model. Energy Procedia.
Khakharia, P., M Kvamsdal, H., da Silva, E.F., Vlugt, T.J.H. and Goetheer, E.
2014b. Field study of a Brownian Demister Unit to reduce aerosol based emission
from a Post Combustion CO2 Capture plant. International Journal of Greenhouse
Gas Control. 28, pp. 57-64.
Khakharia, P., Brachert, L., Mertens, J., Anderlohr, C., Huizinga, A., Fernandez, E.
S., Schallert, B., Schaber, K., Vlugt, T. G. H. and Goetheer, E. 2015. Understanding
aerosol based emissions in a Post Combustion CO2 Capture process: Parameter
testing and mechanisms. International Journal of Greenhouse Gas Control. 34, pp.
63-74.
Majeed, H., Knuutila, H.K., Hillestad, M. and Svendsen, H.F., 2017a.
Characterization and modelling of aerosol droplet in absorption columns.
International Journal of Greenhouse Gas Control. 58, pp. 114–126.
Majeed, H., Knuutila, H., Hillestad, M. and Svendsen. H. F. 2017b. Gas phase amine
depletion created by aerosol formation and growth. International Journal of
Greenhouse Gas Control. 64, pp. 212-222.
Mertens, J., Knudsen, J., Thielens, M.-L. and Andersen, J. 2012. On-line monitoring
and controlling emissions in amine post combustion carbon capture: A field test.
International Journal of Greenhouse Gas Control. 6, pp. 2–11.
Mertens, J., Brachert, L., Desagher, D., Thielens, M. L., Khakharia, P., Goetheer, E.
and Schaber, K. 2014. ELPI+ measurements of aerosol growth in an amine
absorption column. International Journal of Greenhouse Gas Control. 23, pp. 44-
50.

77
Nguyen, T., Hilliard, M. and Rochelle, G.T. 2010. Amine volatility in CO2 capture.
International Journal of Greenhouse Gas Control. 4, pp. 707–715.
Parliament of Australia. 2010. Human contribution to climate change. Available
from:
https://www.aph.gov.au/About_Parliament/Parliamentary_Departments/Parliament
ary_Library/Browse_by_Topic/ClimateChangeold/whyClimate/human/human
Rao, A. B. and Rubin, E. S. 2002. A technical, economic and environmental
assessment of amine-based CO2 capture technology for power plant greenhouse gas
control. Environmental Science and Technology. 36 (20), pp. 4467-4475.
Rochelle, G. T. 2009. Amine Scrubbing for CO2 Capture. Science. 325, pp. 1652-
1654.
Rousseau, R.W. 1987. Handbook of Separation Process Technology.
Schaber, K. 1994. Aerosol formation in absorption processes. Chemical Engineering
Science. 50, pp. 1347–1360.
Seader, J.D., Henley, E.J. and Roper, D.K., 1998. Separation process principles.
Seinfield, J.H.P., Spyros N, Atmospheric Chemistry and Physics: From Air
Pollution to Climate Change. Third ed2016, New Jersey: John Wiley and Sons, Inc.
449.
Sosso, G.C., et al., Crystal Nucleation in Liquids: Open Questions and Future
Challenges in Molecular Dynamics Simulations. Chemical Reviews, 2016. 116(12):
p. 7078-7116.
Trollebø, A.A., Saeed, M., Hartono, A., Kim, I. and Svendsen, H.F. 2013. Vapour-
Liquid Equilibrium for Novel Solvents for CO2 Post Combustion Capture. Energy
Procedia. 37, pp. 2066–2075.
Yasuoka, K. and M. Matsumoto, Molecular dynamics of homogeneous nucleation
in the vapor phase. I. Lennard-Jones fluid. The Journal of Chemical Physics, 1998a.
109(19): p. 8451-8462.
Yasuoka, K. and M. Matsumoto, Molecular dynamics of homogeneous nucleation
in the vapor phase. II. Water. The Journal of Chemical Physics, 1998b. 109(19): p.
8463-8470.

78
Appendix A. Parameters for kinetic reactions
Reaction k E (cal/mol) Reaction rate, r
CO2 + OH- → HCO3- 4.32 x 10¹³ 13249 [𝐶𝑂2][𝑂𝐻−]
HCO3- → CO2 + OH- 2.38 x 10¹⁷ 29451 [𝐻𝐶𝑂3
−]
MEA + CO2 + H2O → MEACOO- + H3O+ 9.77 x 10¹⁰ 9855.8 [𝑀𝐸𝐴][𝐶𝑂2]
MEACOO- + H3O+ → MEA + CO2 + H2O 3.23 x 10¹⁹ 15655 [𝑀𝐸𝐴𝐶𝑂𝑂−][𝐻3𝑂+]


![The S-CO2 Brayton cycle code development and the thermal ... · Chang (2004 [3] ,2006 [4]) evaluated the suitability of commercial software ASPEN PLUS and HYSYS in S-CO2 cycle design](https://img.pdfslide.net/doc/110x75/5b26c75f7f8b9a09628b4e33/the-s-co2-brayton-cycle-code-development-and-the-thermal-chang-2004-3.jpg)