Embed Size (px)
Citation preview
Atmos. Chem. Phys., 10, 8551–8562, 2010www.atmos-chem-phys.net/10/8551/2010/doi:10.5194/acp-10-8551-2010© Author(s) 2010. CC Attribution 3.0 License.
AtmosphericChemistry
and Physics
Aerosol mass and black carbon concentrations, a two year record atNCO-P (5079 m, Southern Himalayas)
A. Marinoni 1, P. Cristofanelli1, P. Laj2, R. Duchi1, F. Calzolari1, S. Decesari1, K. Sellegri3, E. Vuillermoz4,G. P. Verza4, P. Villani2, and P. Bonasoni1,4
1CNR -ISAC- Institute for Atmospheric Sciences and Climate, Bologna, Italy2Laboratoire de Glaciologie et Geophysique de l’Environnement, CNRS-University of Grenoble, Grenoble, France3Laboratoire de Meteorologie Physique, CNRS-University of Clermont Ferrand, Clermont-Ferrand, France4Ev-K2-CNR Committee, Bergamo, Italy
Received: 16 March 2010 – Published in Atmos. Chem. Phys. Discuss.: 31 March 2010Revised: 8 July 2010 – Accepted: 10 August 2010 – Published: 10 September 2010
Abstract. Aerosol mass and the absorbing fraction are im-portant variables, needed to constrain the role of atmosphericparticles in the Earth radiation budget, both directly and in-directly through CCN activation. In particular, their mon-itoring in remote areas and mountain sites is essential fordetermining source regions, elucidating the mechanisms oflong range transport of anthropogenic pollutants, and val-idating regional and global models. Since March 2006,aerosol mass and black carbon concentration have been mon-itored at the Nepal Climate Observatory-Pyramid, a perma-nent high-altitude research station located in the Khumbuvalley at 5079 m a.s.l. below Mt. Everest. The first two-year averages of PM1 and PM1−10 mass were 1.94 µg m−3
and 1.88 µg m−3, with standard deviations of 3.90 µg m−3
and 4.45 µg m−3, respectively, while the black carbon con-centration average is 160.5 ng m−3, with a standard deviationof 296.1 ng m−3. Both aerosol mass and black carbon showwell defined annual cycles, with a maximum during the pre-monsoon season and a minimum during the monsoon. Theyalso display a typical diurnal cycle during all the seasons,with the lowest particle concentration recorded during thenight, and a considerable increase during the afternoon, re-vealing the major role played by thermal winds in influenc-ing the behaviour of atmospheric compounds over the highHimalayas. The aerosol concentration is subject to high vari-ability: in fact, as well as frequent “background conditions”(55% of the time) when BC concentrations are mainly be-low 100 ng m−3, concentrations up to 5 µg m−3 are reachedduring some episodes (a few days every year) in the pre-monsoon seasons. The variability of PM and BC is the result
Correspondence to:A. Marinoni([email protected])
of both short-term changes due to thermal wind developmentin the valley, and long-range transport/synoptic circulation.At NCO-P, higher concentrations of PM1 and BC are mostlyassociated with regional circulation and westerly air massesfrom the Middle East, while the strongest contributions ofmineral dust arrive from the Middle East and regional cir-culation, with a special contribution from North Africa andSouth-West Arabian Peninsula in post-monsoon and winterseason.
1 Introduction
Atmospheric aerosols particles are the focus of increasing at-tention, due to their role in many atmospheric processes, inparticular those involved in the Earth’s radiative balance. Theuncertainty linked to aerosol forcing is a major obstacle to theaccurate prediction of future anthropogenic-induced climatechanges (Forster et al., 2007). Aerosol radiative forcing de-pends either directly or indirectly on several intensive prop-erties of particles, including mass concentration, presence ofabsorbing material in their composition and size distribution.
While the variability of aerosol mass (PM) concentrationis well documented in urban and peri-urban areas due to airquality regulations, uneven global and regional coverage ofPM observations remains a limitation for assessing globalaerosol atmospheric loadings and source identification. Ac-cess to PM information is limited in many parts of the world,especially in remote regions and the free troposphere (Laj etal., 2009). In many studies on climate and air quality, knowl-edge of PM variability needs to be integrated with informa-tion on the main constituents of fine atmospheric aerosol,
Published by Copernicus Publications on behalf of the European Geosciences Union.

8552 A. Marinoni et al.: Aerosol mass and black carbon concentrations, 5079 m, Southern Himalayas
inorganic ions, mineral dust, organic compounds and blackcarbon (BC).
Aerosol particles may be transported over long distancesand reach remote areas, especially in dry climates, becauseof the slow rate of their removal from the atmosphere in theabsence of precipitation. Long range transport of aerosolto clean background areas may have a substantial effect onregional climate change, but also on public health issues(Chung and Seinfeld, 2005; Kanakidou et al., 2005; Sun andAriya, 2006).
Ubiquitous throughout the atmosphere, BC is present inlow levels in remote areas, like the South Pole (Andreae etal., 1984; Hansen et al., 1984, 1988) and Manua Loa (Bod-haine, 1995) but higher concentrations (1–30 µg m−3) are ob-served near sources, in urban areas and biomass burning re-gions (Cachier at al., 1986; Ruellan et al., 1999). Jacobson(2001) pointed out that the magnitude of direct radiative forc-ing due to BC may exceed that due to methane, thereby mak-ing it one of the main species contributing to global warming.INDOEX measurements have reported 14% of BC in fineaerosol dry mass in the marine boundary layer (Lelieveld etal., 2001; Ramanathan et al., 2001). Apportionment of BCis a major concern when modelling aerosol radiative proper-ties. Such estimates are extremely rare for Indian locations,where surprisingly high pollution levels have also been ob-served over the surrounding ocean. The Indian subcontinentis a region where atmospheric pollution is rapidly on the rise,causing extensive air quality degradation, with local, regionaland global implications, including an impact on the oxidizingpower of the atmosphere. (Lelieveld 2001). In fact, recentlysurface and satellite observations have pointed to the persis-tence of so-called “Brown Clouds”, i.e. wide polluted tropo-spheric layers characterised by anthropogenic aerosol opti-cal depth (AOD) greater than 0.3 and absorbing AOD greaterthan 0.03 (Ramanathan et al., 2007)
A knowledge of aerosol mass and black carbon concentra-tions in remote regions is therefore necessary to determineemission sources, quantify long range transport and validateboth regional and global models. High-elevation sites arewell-suited for documenting components of the free tropo-sphere, in order to characterize its typical background con-ditions and investigate the influence of human activity on itscomposition. For these reasons, aerosol mass and black car-bon concentrations have been monitored at the Nepal Cli-mate Observatory-Pyramid (NCO-P) since March 2006 inthe framework of ABC (Atmospheric Brown Clouds) UNEPand SHARE (Station at High Altitude for Environmental Re-search) Ev-K2-CNR projects. Located in the Khumbu valleyat 5079 m a.s.l. below Mt. Everest, NCO-P is one of the veryfew monitoring stations in this area. The two-year continu-ous record (March 2006–February 2008) of fine and coarseaerosol mass concentrations and black carbon content com-pletes the very rare records published for this area (Shresthaet al., 2000; Carrico et al., 2003).
The present paper describes observations of PMs and BCat the site and discusses factors influencing aerosol diurnaland seasonal variability. In particular, the role of valleybreezes and synoptic circulation on the aerosol transport upto such high altitude is also investigated. Because NCO-P islocated within the area of the Himalayan glaciers, a knowl-edge of concentrations and sources of BC, the most efficientlight-absorber in atmosphere and snow, is a key step towardsa better assessment of anthropogenic pressures on snow-packand glacier dynamics.
With the presentation of an unique data set referring toaerosol mass and black carbon observations carried out in acrucial area that plays a key role in climate change, the mainobjectives of this paper are to present and discuss the princi-pal factors influencing the aerosol variability, in order to pro-vide important information for the characterization of tropo-spheric background conditions and precious input to improvethe performance of climate and atmospheric chemistry mod-els at different scales.
2 Measurement site and experimental set up
A complete description of the NCO-P station (Nepal,27.95 N, 86.82 E, 5079 m a.s.l.) is provided in Bonasoni etal. (2008) and Bonasoni et al. (2010). At NCO-P, the sea-sonal variation of atmospheric conditions is influenced bothby the local mountain wind system (with a strong diurnal val-ley wind and a weaker mountain night-time breeze), and bythe large-scale Asian monsoon circulation. In particular, be-sides determining the seasonal variations of meteorologicalparameters, the annual variations of the main synoptic circu-lation can also modulate the diurnal cycles characterizing thelocal mountain weather regime (Bonasoni et al., 2010).
The instrumentation includes a Multi-Angle AbsorptionPhotometer (MAAP 5012, Thermo Electron Corporation)and an optical particle counter (GRIMM#190), both devicessampling air from a TSP (Total Suspended Particle) head.On-site technical support is provided year-round by the Ev-K2-CNR Committee, while a field campaign on site is or-ganized once a year for extra maintenance work, instrumentcalibration, and possible technical upgrades. The energy re-quired for NCO-P operations is provided by 98 photovoltaiccells and 120 battery storage, other than those supplied byPyramid panels and cells. A diesel generator (located 100 mbelow NCO-P) is used to supply electricity in the event ofsolar-energy shortage, although this occurs rarely (less than6% of total period), and tests have been performed to insurethat no contamination of NCO-P measurements occurs dueto diesel use.
PM is measured using the optical particle counter (OPC),which measures the size distributions for particle with diame-ters greater than 0.25 up to 32 µm by means of 90◦ laser lightscattering. The optical diameters determined by the OPC(classified in 31 bins) are converted into geometric diameters
Atmos. Chem. Phys., 10, 8551–8562, 2010 www.atmos-chem-phys.net/10/8551/2010/
A. Marinoni et al.: Aerosol mass and black carbon concentrations, 5079 m, Southern Himalayas 8553
assuming spherical particles. According to the manufacturer,the accuracy of the Grimm 190 OPC in particle countingis ±2% over the entire measurement size range. The OPCparticle sizing is based on a calibration with latex spheres(1 µm Duke Scientific Corp.) performed by the manufacturerprior to starting measurements at NCO-P. Additional cali-bration was performed in February 2008 using latex spheres(400 nm Duke Scientific Corp.), showing a slight, but accept-able, diameter underestimation of less than 5%. To calcu-late the apparent particulate mass within the different sizeranges (PM1, PM2.5 and PM10), the particle density was cho-sen by the manufacturer during the first calibration usingMicro Dolomit DR80 (Basserman & Co). Particles smallerthan 0.3 µm were assumed not to significantly contribute tothe particulate mass: the error associated to PM determi-nation was lower than 2% in each size fraction. The OPCwas placed in the NCO-P shelter with temperature almostconstant (between 20 and 25◦C), at least 10◦C higher withrespect to the external one, thanks to heating produced bythe instrument energy consumption. The particles were thusmeasured at a relative humidity slightly lower than ambientRH. However above 70% RH (measured in the sample head),a dehumidification system becomes active, removing humid-ity over a Nafion ® membrane-tube from the sample pipeto avoid condensation during measurement. The detectionlimit was determined as 3σ of 12 h of measurement with anabsolute filter, corresponding to 5.8 p L−1, i.e. equivalent to0.06 µg m−3.
The measurement of the aerosol absorption coefficient wasobtained by MAAP: it measures the transmission and theback scattering of a light beam (Petzold and Schonlinner,2004) incident on a fibre filter where aerosol particles aredeposited by sampling flow. As determined during an inter-comparison experiment (March 2007) at the Leibniz Institutefor Tropospheric Research (Leipzig, Germany), the wave-length of the light source employed in the MAAP is 635 nm(T. Muller, personal communication, 2008). The reductionof light transmission, multiple reflection intensities, air sam-ple volume are continuously integrated over the sample runperiod to provide real-time data output of the particle lightabsorption coefficientσabsand thus black carbon concentra-tion.
In the visible spectral range, black carbon is the most ef-ficient light-absorbing aerosol species (Horvarth, 1993). Therelationship between the aerosol absorption coefficientσabs(m−1) and the corresponding black carbon mass concentra-tion BC (ng m−3) is established by a mass absorption effi-ciencyσme, BC (m2 g−1) via the relationship:
BC=σabs
σme,BC(1)
whereσme,BC andσabs are wavelength dependent.σme,BCdepends on the type of aerosol, the ageing and the size of theBC particles (Liousse et al., 1993). A thermo-optical method(OC/EC analyzer, Sunset laboratory Inc.) was used to de-
termine the mass absorption efficiency (σme,BC), assumingthat elemental carbon (EC) is equivalent to BC (details ofanalyses in Decesari et al., 2009). Here, the value ofσme,BC adopted was 6.5 m2 g−1, as recommended by Petzold etal. (2002) and set by default on MAAPs. The very good cor-relation between EC and equivalent BC (R2=0.94), obtainedby totally independent methods confirms the fact that, de-spite the presence of high levels of dust (Duchi et al., 2010),MAAP absorption measurements are primarily influenced byBC. This justifies the use, in the remaining part of the paper,of the term “equivalent BC” for MAAP measurements.
In order to check the MAAP noise and detection limit, a 12h measurement with an absolute filter was performed duringthe calibration campaign in February 2008, together with thecalibration of flow and temperature-pressure sensors. Thedetection limit (3σ of blank measurements) was calculatedas 11 ng m−3, with an integration time of a 30 min basis.
Both instruments worked continuously without major fail-ures, and interruptions were extremely rare and of limitedduration. Measurements (available in real-time at the webaddress http://evk2.isac.cnr.it/realtime.html) were performedwith a time resolution of 1 min and data were averaged to acommon time base of 30 min. All measurements presentedin this study refer to STP conditions (1 atm and 0◦C) andNepal Standard Time (NST, UTC+5.45).
3 Results and discussion
3.1 Variability of PMs and BC concentrations
Mass concentrations of accumulation (0.25–1 µm) and coarse(1–10 µm) particulate matter calculated by OPC, as well asequivalent BC mass concentration, are reported in Fig. 1,while their seasonal statistics are given in Table 1. The accu-mulation fraction mass will be referred hereinafter as PM1,since the sum of chemical species analysed on PM1 filters(Decesari et al., 2009) accounts on average for 91% of theaccumulation fraction mass calculated by OPC: the fractionof particles smaller than 0.25 µm (not detected by OPC) arethus assumed as negligible.
The two-year average of PM1 and PM1−10 mass were1.94 µg m−3 and 1.88 µg m−3, with a standard deviation of3.90 µg m−3 and 4.45 µg m−3, respectively. Thus, the coarsefraction accounts for half of the aerosol mass measured byOPC, with a greater variability with respect to the accumu-lation fraction. The black carbon concentration averagedover two years of measurements was 160.5 ng m−3, with astandard deviation of 296.1 ng m−3, accounting for 10.8% ofPM1 on average.
3.1.1 Seasonal variations of PMs and BC
Both fine and coarse fractions of aerosol mass exhibit a welldefined diurnal cycle, as well as significant annual variations.In fact, as shown in Figs. 1 and 2, large mass concentrations
www.atmos-chem-phys.net/10/8551/2010/ Atmos. Chem. Phys., 10, 8551–8562, 2010
8554 A. Marinoni et al.: Aerosol mass and black carbon concentrations, 5079 m, Southern Himalayas
Table 1. Seasonal average and standard deviation for BC, PM1, PM1−10 (30-min averaged values). In brackets, the annual average valuesfor 2006 (Y06) and 2007 (Y07) are also reported.N represents the number of averaged values.
Seasons PM1 (µg m−3) PM1−10 (µg m−3) BC (ng m−3) BC/PM1 (%)
Pre-monsoon 3.9±5.5(Y06: 4.4; Y07: 3.5)N = 10045
3.4±6.7(Y06: 2.5; Y07: 3.6)N = 10045
320±469(Y06: 376; Y07: 279)N = 10237
10.5±28.0(Y06: 9.0; Y07: 11.7)N = 9844
Monsoon 0.6±1.1(Y06: 0.8; Y07: 0.3)N = 10653
1.1±2.7(Y06: 1.4; Y07: 0.6)N = 10653
56±75(Y06: 85; Y07:41)N = 9406
40.0±141(Y06: 6.8; Y07: 71.8)N = 6472
Post-monsoon 1.5±1.4(Y06: 1.5; Y07: 1.5)N = 4189
0.5±1.4(Y06: 0.5; Y07: 0.6)N = 4189
137±126(Y06: 132; Y07: 144)N = 4144
10.0±5.0(Y06: 8.5; Y07: 12.4)N = 4078
Winter 1.4±3.6(Y06: 1.0; Y07: 2.3)N = 4777
1.6±4.3(Y06: 1.4; Y07: 2.2)N = 4777
125±147(Y06: 124; Y07: 126)N = 7539
12.4±7.4(Y06: 12.8;Y07: 11.7)N = 4417
1
2
3
4
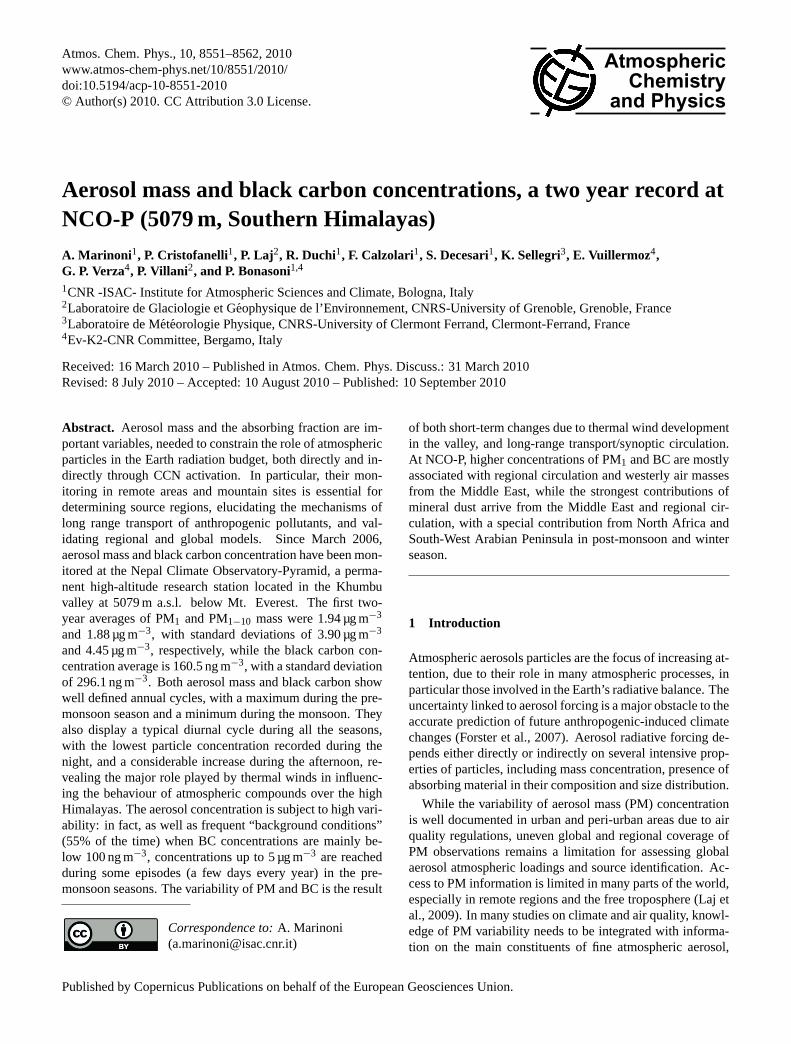
Figure 1. Time series of 30-min averaged BC (black), PM1 (cyan) and PM1-10 (brown) at
NCO-P
26
Fig. 1. Time series of 30-min averaged BC (black), PM1 (cyan) andPM1−10 (brown) at NCO-P.
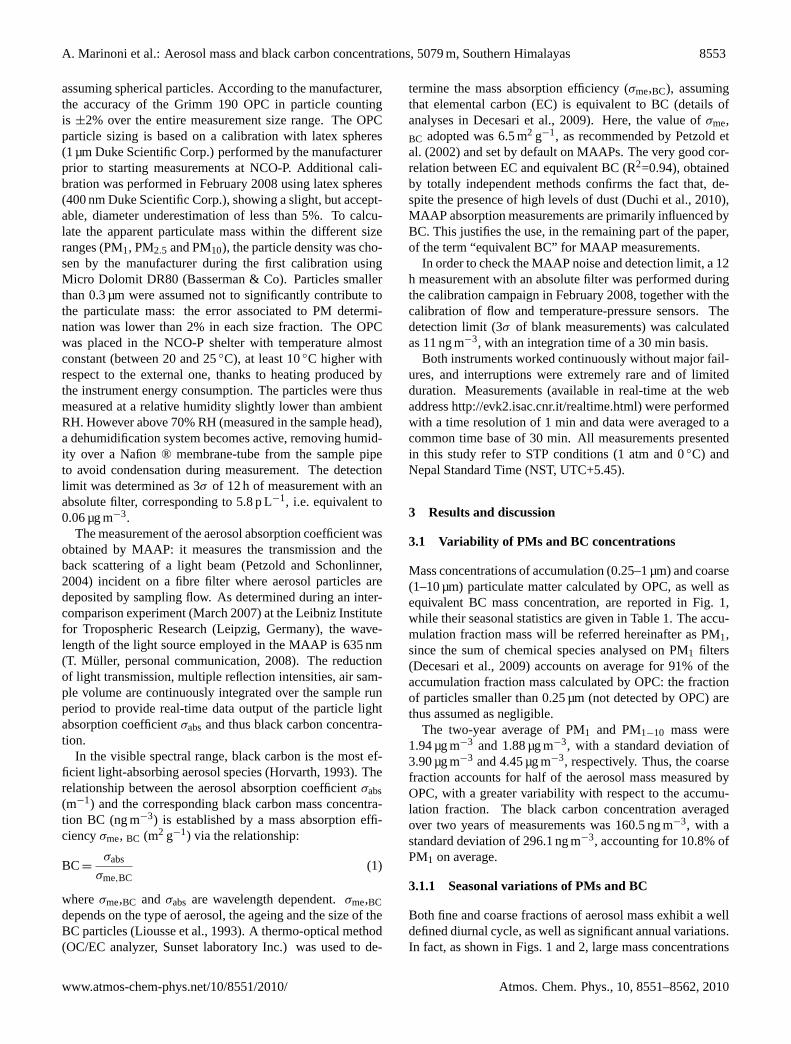
occur during the pre-monsoon season, while the minima ap-pear during the monsoon season (prolonged to the post mon-soon for the coarse fraction). PM1 shows a more enhancedannual variation than PM1−10: the pre-monsoon average islarger by a factor of 5.6 with respect to the monsoon meanvalue, while the coarse fraction mass (characterised by alarger year-to-year variation) shows a pre-monsoon averagevalue larger than the monsoon average by a factor of 3.0. Theyear 2007 was characterized by a more peaked variation, es-pecially for coarse fraction. The ratio between the seasonalmaximum and minimum of aerosol mass in 2007 was 11.4for the coarse fraction and 5.6 for the fine fraction, whilein 2006 they were 1.7 and 5.7, respectively. The origin ofthe inter-annual difference may be associated with the inter-annual variations in meteorological and dynamic conditionsalready observed in this area, such as the Tropospheric Bi-ennial Oscillation, leading to warmer and wetter even yearsthan odd years (Bertolani et al., 2000; Pillai and Mohanku-mar, 2007).
The annual behaviour of BC concentration is very sim-ilar to the PM1 annual cycle, with a maximum during thepre-monsoon season, a minimum during the monsoon and asimilar cycle amplitude (pre-monsoon average value is largerthan the monsoon value by a factor of 5.0 over the 2 years,4.5 in 2006 and 6.6 in 2007). A weak inter-annual variationcharacterised the BC behaviour at NCO-P. In fact, except forthe post-monsoon and winter season, the year 2006 appearsslightly more “polluted” than 2007 (see Table 1 and Fig. 2).The very high BC standard deviation reflects the high vari-ability of BC concentrations: frequent “background condi-tions” (55% of the time), with concentrations mainly below100 ng m−3 are observed, while during some episodes (a fewdays every year) in pre-monsoon seasons, BC concentrationsup to 5 µg m−3 (30 min averaged values) are reached (Fig. 1).
The aerosol mass and BC seasonality observed at NCO-Pis similar to the variations observed at other Indian sites,with lower values during the monsoon season, mostlydue to wet scavenging, and larger ones in the winter andpre-monsoon periods (Chandra Mouli et al., 2006; Gangulyet al., 2006). In the Indogangetic plain, at Gadanki station(India, 375 m a.s.l., 13.5◦ N, 79.2◦ E), Krishnan and Kun-hikrishnan (2004) observed that the atmospheric boundarylayer height was maximum during the pre-monsoon period,and minimum during the winter months. It can thereforebe supposed that the high pre-monsoon values observed atNCO-P are influenced by the larger vertical extension of theregional PBL (indicative of the ABC vertical extension),which together with the valley breezes, can favour thetransport of regional pollution up to the 5000 m a.s.l. ofNCO-P.
Variations of BC/PM1
The contribution of BC to fine aerosol mass at NCO-P wasfound to be 10.8%, with a very large variability (standard
Atmos. Chem. Phys., 10, 8551–8562, 2010 www.atmos-chem-phys.net/10/8551/2010/
A. Marinoni et al.: Aerosol mass and black carbon concentrations, 5079 m, Southern Himalayas 8555
µg m
-3µg
m-3
ngm
-3
14
12
10
8
6
4
2
0
a)
c)
b)
Fig. 2. Monthly averages (black line within the boxes), medians(red line within the boxes) and percentiles (10-25-75-90, boxes andwhiskers) of 30-min PM1 (a), PM1−10 (b) and BC (c) at NCO-P. The continuous red lines represent the 2 year averaged monthlybehaviours.
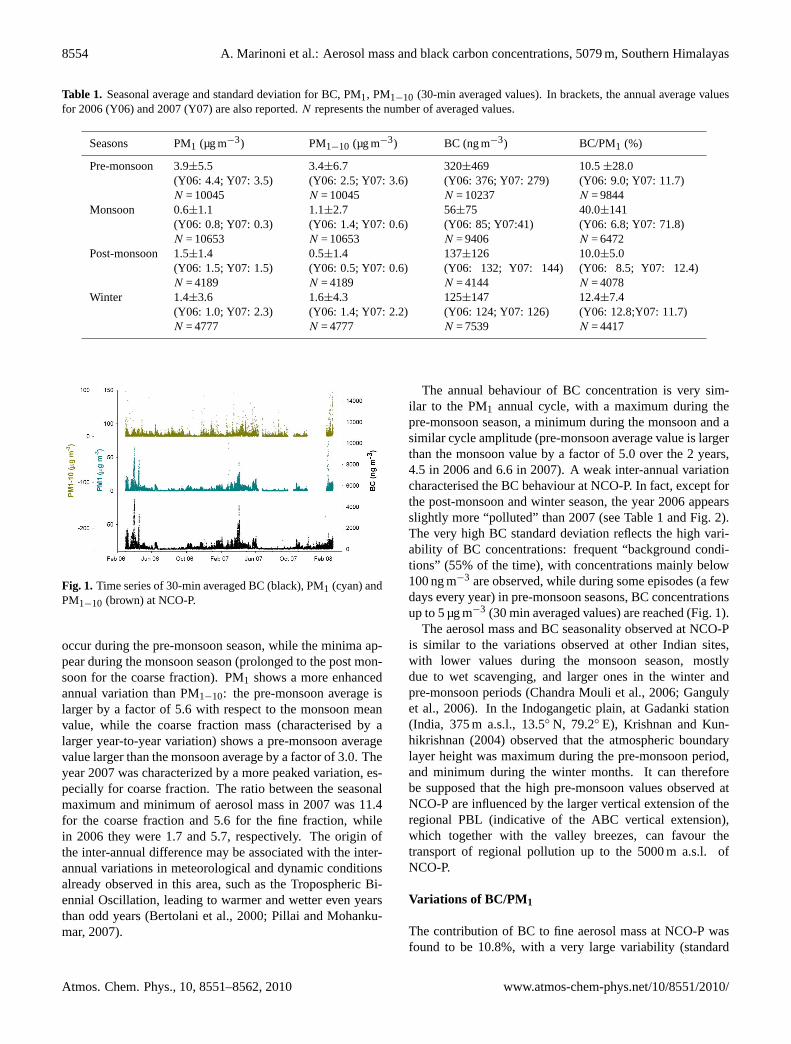
deviation: 9.5%). As shown in Fig. 3, the BC/PM1 ratioshows a maximum contribution of carbonaceous absorbingmaterial to the fine particulate matter during the monsoonseason (about 18% in July-August), while the minimum val-ues characterizes the pre-monsoon season (less than 9% inApril-May). This is plausibly due to a preferential scav-enging by monsoon precipitation of the inorganic fractionof aerosol with respect to the less hygroscopic black car-bon (Sellegri et al., 2003). Moreover, this may also be ad-dressed to the influence of local BC emissions due to incom-plete combustion processes from domestic heating and cook-ing activities. In fact, during the monsoon season highly effi-cient scavenging processes clean air masses originating overIndian plains, while local/regional sources, even when weak,could influence the background composition of Himalayasatmosphere. Even though BC contributes only a few percentto the total aerosol mass, it produces significant radiative ef-fects. The apportionment of BC is therefore very importantin assessing the aerosol radiative properties, as confirmed byMarcq et al. (2010) who report lower single scattering albedovalues during the monsoon season.
jan febmaraprmayjun jul augsep oct novdec
BC
/PM
1 %
0
10
20
30
4040
10
20
30
0J F M A M J J A S O N D
BC
/PM
1 (%
)
Fig. 3. Annual variation of BC to PM1 mass fraction (2 year aver-age; error bars represent the standard deviation).
The BC/PM1 ratio observed at NCO-P is higher than val-ues observed at lower altitude Himalayan sites in India. Infact, Saha et al. (2005) found a winter average value of∼5%, at Manora Peak (29.4◦ N; 79.5◦ E; 1951 m a.s.l., India)during winter 2004, while Hyvarinen et al. (2009) pointedout a∼4% average BC/PM2.5 ratio at Mukteshwar (29.4◦N;79.6◦ E, 2180 m a.s.l., India). This indicates the existenceof significant differences in aerosol composition along Hi-malayas ridge. In fact, for NCO-P, the BC/PM1 is similar tothose observed within brown clouds over Indian Ocean andpopulated urban areas. Moreover the BC/PM1 ratio seemsto be higher with cleaner atmospheric conditions, suggest-ing a preferential removing of non-BC aerosol. INDOEXmeasurements (January to March 1999) reported surprisinglyhigh pollution levels (comparable to urban air pollution inNorth America and Europe) over the entire northern IndianOcean, with 14% of BC in fine aerosol dry mass in the marineboundary layer (Lelieveld et al., 2001; Ramanathan et al.,2001b). Novakov et al. (2000) found a BC content similar tothe NCO-P one in the Indian Ocean haze, as high as 17% ofthe total fine particle mass. This very high fraction correlatedvery well with total carbon and sulphate, suggesting the pre-dominantly primary nature of aerosol carbon and the signifi-cant influence of fossil fuel combustion sources. As reportedby Babu and Moorthy (2002), BC/PM1 values ranging from∼3–4% (during monsoon) to 9% (during winter) were ob-served at Trivandrum (∼1 million inhabitants, South India).Except for the remote site of Mukteshwar (2180 m, North In-dia), where on average only 4% of PM2.5 mass consisted ofBC, the ensemble of Asian observations shows values gener-ally higher than the European continental background: Cozicet al. (2006) found a BC contribution to PM1 equal to 2.5%in summer and 4.7% in winter at the free troposphere stationof Jungfraujoch (Switzerland, 3850 m a.s.l.), while Putaudet al. (2004) found a contribution in the range of 5–10% toPM2.5 at a European natural background sites. As indicated
www.atmos-chem-phys.net/10/8551/2010/ Atmos. Chem. Phys., 10, 8551–8562, 2010

8556 A. Marinoni et al.: Aerosol mass and black carbon concentrations, 5079 m, Southern Himalayas
Fig. 4. 2-year seasonal diurnal variation of BC, PM1, PM1−10and specific humidity (SH) at NCO-P: pre-monsoon (red), monsoon(blue), post-monsoon (green) and winter (brown).
by Babu et al. (2004), the BC/PM1 ratio is a key parame-ters to define the atmospheric forcing efficiency of aerosols.Thus, the high BC/PM1 ratio observed at the NCO-P sug-gests that BC plays a major role in driving atmosphere energybudget over High Himalayas, as also indicated by Marcq etal. (2010).
3.1.2 Diurnal variations
The NCO-P average seasonal diurnal variations of PM1,PM1−10 and black carbon, together with specific humidity(SH), often used as a tracer of PBL-influenced air masses formountain sites (e.g. Henne et al., 2008), are shown in Fig. 4.Alongside day-to-day variability, PM1 and black carbon alsoshow a typical diurnal cycle in all the seasons with the lowestparticle concentrations at night and a considerable increaseduring the afternoon. As shown by Venzac et al. (2008) andBonasoni et al. (2010), such behaviours suggest an impor-tant influence of thermal winds in determining the variationof atmospheric compounds over the high Himalayas. Similarphenomena have been observed at many mountain stations inthe European Alps (Baltensperger et al., 1997), Italian Apen-nines (Marinoni et al., 2008), Massif Central in France (Ven-zac et al., 2009), and Hawaii (Bodhaine, 1995). The max-imum of pollutant (PM1 and BC) concentrations is reachedbetween 16:00 and 18:00 NST during the pre-monsoon sea-son and about one or two hours earlier in the other seasons,while the minimum appears between 06:00 and 08:00 NST inall the seasons, except for the winter one, when it is reachedaround 04:00 NST and persists longer.
It is interesting to note that the SH diurnal cycle showsthe same behaviour as BC and PM1 variations, except in themonsoon season, when the BC and PM peaks and minima aredelayed by about two hours with respect to SH. Here, it is hy-pothesized that the early peak of SH in the monsoon season
Table 2. Diurnal cycle amplitudes of the typical day in differentseasons for specific humidity (SH), black carbon (BC), PM1 andPM1−10. Amplitudes are expressed as the ratio between the highestand the lowest 30-min averaged values.
Parameter Pre-monsoon Monsoon Post-monsoon Winter
SH 1.7 1.2 1.8 2.5BC 4.8 1.4 3.5 3.8PPM1 2.1 1.9 4.2 7.2PM1−10 1.2 0.7 1.9 2.0
is due to an additional water vapour source from evapotran-spiration along the valley in central hours of the day, whileoutside the monsoon season, humidity reaches NCO-P si-multaneously with pollutants from low levels of the KhumbuValley and Pahar region.
Pollutants reaching the high altitude site, pumped up bythermal winds or transported by synoptic circulation, canbe injected into the free troposphere, where they attain alonger life time, and/or accumulate in high residual layers.As shown in Table 2, the amplitude of the BC and PM1 di-urnal cycle is very close to that of SH during the monsoonseason, and higher in other seasons. Additionally, the night-time BC contribution to the fine aerosol mass is, on average,between 2% and 10% higher than the day-time contribution.The higher BC fraction in night-time aerosol sampled at thestation may reflect an ageing of the aerosol population; infact the polymerisation of organic material in aerosol parti-cles can lead to increasingly absorbing properties (Andreaeand Gelenscer, 2006).
Following the approach of Baltensperger et al. (1997), thefraction of days showing a strong influence of valley-inducedthermal convection was calculated, on the basis of the blackcarbon concentration. Applying this criterion a “strong” di-urnal variation was found in 38% of all days (55% in thepre-monsoon and only 7% in the monsoon season).
The most “polluted” days (characterized by a daily BCaverage larger than the 90th percentile) were characterizedby a larger amplitude of pollutant diurnal variation: for thetotal average the 15:00–21:00 (NST) period shows a meanBC value 3.5 higher than the 03:00–09:00 period, while con-sidering only days with a daily BC average over the 90thpercentile (345 ng m−3), the 15:00–21:00 period became 8.2times higher than the 03:00–09:00. Nevertheless, among the“polluted” days, more than 30% showed limited amplitudeof the diurnal cycle and therefore not classified as days with“strong” diurnal variation. The recirculation and transport ofpollutants possibly stored in reservoir layers can partially ex-plain the limited amplitude of the diurnal cycle. However,these findings seem to confirm that two main mechanismsare involved in the transport of pollutants to NCO-P: thermalwinds, leading to an enhanced diurnal cycle, and synopticcirculation, which constrains and limits the thermal wind in-fluence.
Atmos. Chem. Phys., 10, 8551–8562, 2010 www.atmos-chem-phys.net/10/8551/2010/
A. Marinoni et al.: Aerosol mass and black carbon concentrations, 5079 m, Southern Himalayas 8557
Typical events with marked diurnal variations, with thehighest concentration of PM1 (around 60 µg m−3) and BC(attaining 5 µg m−3), were recorded in March–April of both2006 and 2007: the strongest of such events are recogniz-able also in 30-min averaged time series shown in Fig. 1 (i.e.30–31 March, 1–3 and 15–17 April 2006, 30–31 March, 1and 3–6 April 2007). Conversely, when the rise in pollu-tion concentration shows a very limited diurnal cycle, it ismost likely that the air mass is transported by synoptic cir-culation, which superimposes and masks locally originatedthermal winds. A typical prolonged long range transport isrecorded both in 2006 and 2007 in the monsoon onset period(12–22 June 2006 and 22 May–7 June 2007).
The aerosol coarse mass has a more irregular diurnal vari-ation than PM1 and BC, with daytime concentrations (10:00–18:00 NST) higher than night-time ones in all seasons exceptfor the monsoon. The diurnal peaks are not linked with thelifting of air masses by valley winds, but seem to be linkedwith wind strength, with a maximum at midday (4–5 h be-fore pollution maximum), suggesting a limited contributionfrom the local re-suspension of coarse particles. Further-more the coarse mass variations are weaker than the seasonaland diurnal cycles of the fine fraction (see Table 2), whilePM1−10 and the respective diurnal cycle amplitude are higherin the post monsoon and winter seasons, when the soil is drier(Fig. 4).
3.1.3 Comparison with other sites
At NCO-P, the two-year average of PM1 and PM1−10 masswere 1.94 µg m−3 and 1.88 µg m−3, with a standard devia-tion of 3.90 µg m−3 and 4.45 µg m−3, respectively, while theBC mean concentration was 160.5 ng m−3, with a standarddeviation of 296.1 ng m−3, accounting for 10.8% of PM1 onaverage.
As expected, the aerosol mass values observed at NCO-P were much lower (at least one order of magnitude) thanthe corresponding ones measured everywhere else in the In-dian Subcontinent: the annual average mass of PM10 was33 µg m−3 (annual average, with similar seasonality as NCO-P) in Tirupati, South of India (Chandra Mouli et al., 2006),74 µg m−3 in Agra (Khemani et al., 1982), 66 µg m−3 inAhmedabad (Ganguly et al., 2006) both cities in the Indo-Gangetic Plain. This reflects the influence of the brownclouds, as well as the larger transcontinental pollution overSouth and East Asia (Ramanathan, 2001).
The PM10 mean value recorded at NCO-P is comparablewith TSP concentrations measured at Nam Co (4730 m a.s.l.,Tibetan Plateau) for the period August 2006 to July 2007showing an annual average of 7 µg m−3 and falling in therange 0.5–36 µg m−3 (Cong et al., 2009), while in the re-mote and rural area of Tengchong (1960 m a.s.l., TibetanPlateau), PM10 was measured as 34 µg m−3 and PM2.5 as28 µg m−3 (Chan et al., 2006). The aerosol mass values ob-served at NCO-P are also lower than the European natural
background defined by Putaud et al. (2004), within the range5–10 µg m−3.
The BC concentration levels at NCO-P appear very simi-lar to values at Nam Co. For the period when BC measure-ments are available at both sites (July 2006–January 2007),BC was on average 82±70 ng m−3 at Nam Co (Ming at al.,2010) and 91±113 ng m−3 at NCO-P, suggesting that bothstations are representatives of Himalayan background con-ditions. The monthly mean BC concentration for Decem-ber 2004, measured at the mountain site of Nainital (ManoraPeak, 1950 m a.s.l., located in the Shivalik ranges of the cen-tral Himalayas) was 1.36±0.99 µg m−3 (Pant et al. 2006),thus significantly higher than NCO-P levels for the sameseason, probably because of the lower altitude and greatervicinity to the strong sources of the Indo-Gangetic plain.In fact, on the Indian plains, BC daily levels range fromfew µg m−3 up to 27 µg m−3 measured in Delhi by Beegumet al. (2009) and Babu et al. (2002). Even on the southern In-dian Ocean, BC concentrations are mostly higher than thoseobserved at NCO-P, especially during winter, testifying tothe widely extending atmospheric brown cloud over this area.At NCO-P, monsoon averaged BC values fall mainly in therange of the European continental background, measured be-tween 8 and 104 ng m−3 (monthly median) at Jungfraujoch(Alps, 3450 m a.s.l.) by Nyeki et al. (1998) and at MonteCimone (winter average below 100 ng m−3) by Marinoni etal. (2008). The NCO-P monsoon values are approximatelytwo orders of magnitude higher than Antarctic backgroundconcentrations (∼0.65 ng m−3) at the South Pole, one orderof magnitude higher with respect to a remote marine bound-ary location on the island of Mauna Loa (∼5.8 ng m−3), andon the same order than the baseline atmospheric station ofBarrow, on the northernmost tip of Alaska (∼41 ng m−3)(Bodhaine, 1995).
3.2 Source origin: thermal wind regime versus longrange circulation
As shown by Bonasoni et al. (2010), NCO-P atmosphericcompound concentrations are the result of local/regionalscale dynamics along the Khumbu valley and long-rangetransport and synoptic circulation. During the pre-monsoonseason in particular, the Khumbu valley is an efficient andpersistent channel for transporting large amounts of particlesto NCO-P during the day-time up-valley breeze, as also sug-gested by the analysis of diurnal variations investigated inSect. 3.1.2. Figure 5 shows the seasonal average BC, PM1and PM1−10 split into clusters with respect to wind direc-tion (anabatic or catabatic) and typically clean (night-time)or polluted (afternoon) periods. It is clear that valley breezesplay an important role in pollution transport from the lowlevel of Khumbu valley and Himalayan foothills during allseasons (blue bars), while the lowest pollutant concentrationsare recorded during mountain breeze conditions (brown andyellow bars). Nevertheless, the effect of seasonality strongly
www.atmos-chem-phys.net/10/8551/2010/ Atmos. Chem. Phys., 10, 8551–8562, 2010

8558 A. Marinoni et al.: Aerosol mass and black carbon concentrations, 5079 m, Southern Himalayas 1
2 3
4
5
Figure 5. PM1 (a), PM1-10 (b) and BC (c) at NCO-P in function of wind direction during
nigh-time (00:00 – 06:00) and during afternoon (12:00 – 18:00). The numbers reported on the
x-axis specify the number of averaged 30-min values
30
Fig. 5. PM1 (a), PM1−10 (b) and BC(c) at NCO-P in functionof wind direction during nigh-time (00:00–06:00) and during after-noon (12:00–18:00). The numbers reported on the x-axis specifythe number of averaged 30-min values.
affect the BC and PM1 concentrations, with pre-monsoonvalues larger than other seasons. The afternoon concentra-tions observed under valley wind show same seasonality ofthe entire data-set, with a peak in the pre-monsoon period,a marked decrease during the monsoon, and “the ramp-upperiod” in fall and winter, already highlighted by Carrico etal. (2003) in behaviours of PM2.5 both in Langtang (remoteHimalayas, 3920 m a.s.l.) and Nagarkot (a hilltop town onthe eastern edge of the Kathmandu Valley, 800 m a.s.l.). Thiscommon seasonal trend reflects the accumulation of mainlyanthropogenic aerosols in the Indian Subcontinent in winterand pre-monsoon season. This could be due to the strongemissions in relatively stable and dry atmospheric conditions(Ramanathan et al., 2007), suggesting the influence of browncloud up to at least the altitude of NCO-P, due to thermalcirculation in the valleys.
In Fig. 5, it is interesting to note that pre-monsoon lowestconcentrations of PM1 and BC are associated with moun-tain winds. This is particularly evident during the afternoon,when the day-time valley winds from South-West are sup-pressed by synoptic scale forcing, transporting air-massesfrom North, often characterised by high levels of mineraldust aerosol (Duchi et al., 2010). In fact, as shown in Fig. 5the largest PM1−10 concentrations (about one order of mag-nitude larger than the overall average) observed in winter andpre-monsoon season, are associated with mountain wind dur-ing the afternoon, suggesting a not-negligible role of min-eral dust mobilisation and recirculation from the TibetanPlateau and Taklimakan desert. However, a significant con-tribution of PM1−10 is carried to NCO-P by afternoon val-ley winds, especially in the pre-monsoon seasons, when theIndo-Gangetic Plains are strongly influenced by the trans-port of dust outbreaks originating in the north-western desertin India (Thar desert, see Gautam et al., 2009), and perhapseven from far off regions (North Africa, see Decesari et al.,2009).
Besides local/regional circulation, synoptic air-mass cir-culation can also influence the atmospheric composition atNCO-P. To evaluate the possible influence of synoptic-scaleair-mass transport on atmospheric composition observed atNCO-P, BC, PM1 and PM1−10 data were analysed as a func-tion of the air-mass cluster classification provided by Bona-soni et al. (2010). In particular, depending on geographicalorigin and paths of the analysed back-trajectories, seven clus-ters were identified and classified into three main classes:SW south-westerly (SW-AP: Arabian Peninsula, SW-AS:Arabian Sea, SW-BG: Bengal Gulf); W westerly (W-NA:North Africa, W-EU: Europe, W-ME: Middle East) andREG regional. Following the same methodology presentedby Bonasoni et al. (2010), only night time data (00:00–06:00) were considered, in order to avoid interaction withair masses carried up with valley winds, and data over the95th percentile (6 h average night-time values) were ne-glected (5.0 µg m−3 for PM1−10, 3.4 µg m−3 for PM1 and267 µg m−3 for BC) to avoid the influence of outliers.
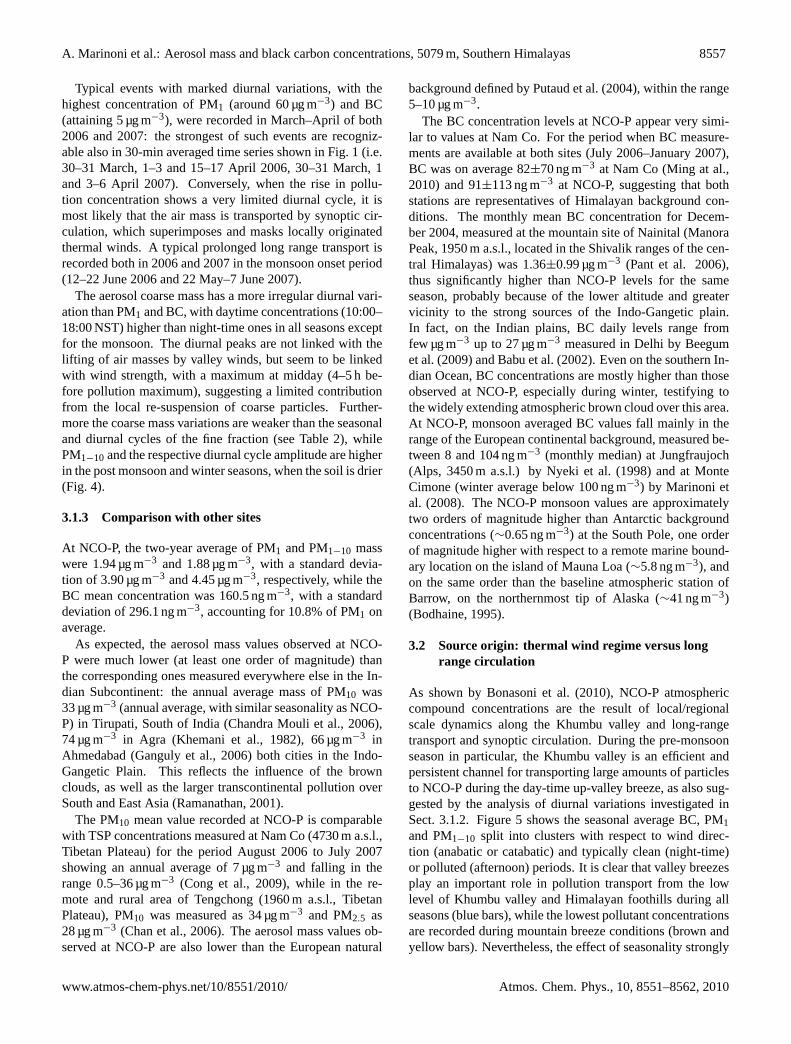
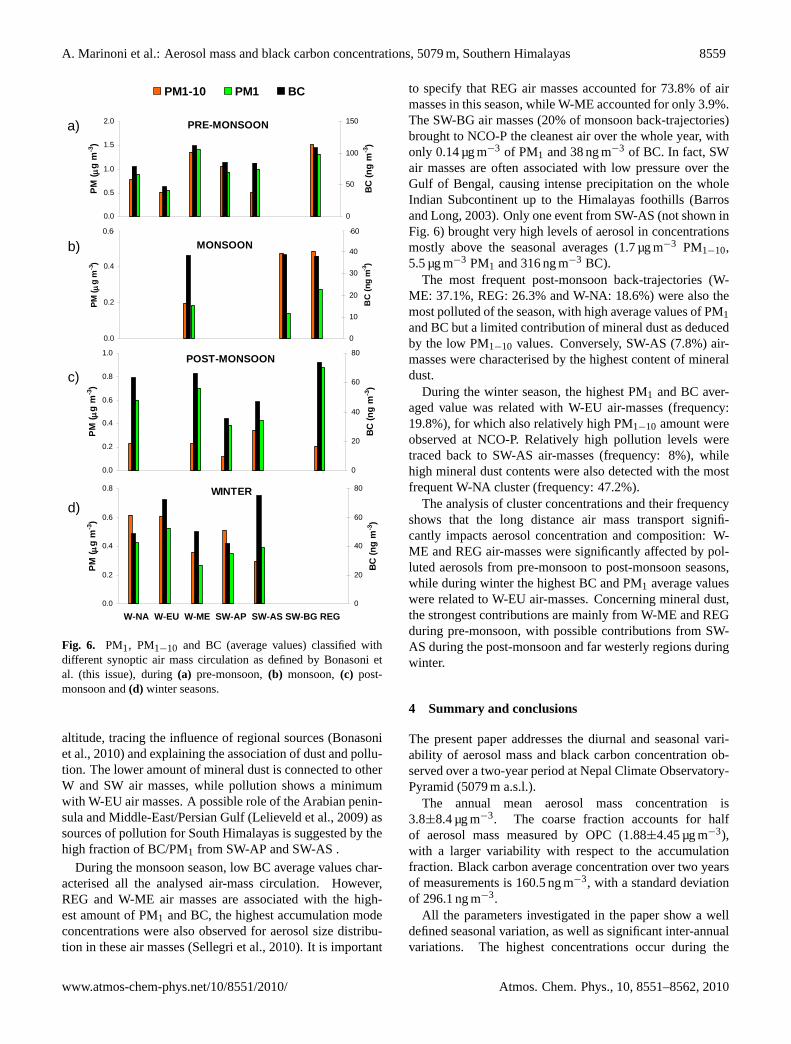
Figure 6 shows the averaged concentrations of aerosolmass (PM1 and PM1−10) and BC split into the different back-trajectory clusters for each season. Even if seasonality playsan important role in defining atmospheric composition atNCO-P, as is evident looking at scales of the graphs, sig-nificant differences are observed within each season betweenaerosol concentration in air masses of different origin.
During the pre-monsoon season, the largest content ofaerosol is associated with westerly air masses from W-ME:such air masses are characterised by a large mineral dustload, together with a high pollution level, and they repre-sents 19.3% of air masses in this season. To a lesser ex-tent, REG air masses also bring a significant amount of dustand pollution to NCO-P. This cluster represents the secondmain class of air masses for the pre-monsoon season (23.9%)and differs from others because of its lower back-trajectory
Atmos. Chem. Phys., 10, 8551–8562, 2010 www.atmos-chem-phys.net/10/8551/2010/
A. Marinoni et al.: Aerosol mass and black carbon concentrations, 5079 m, Southern Himalayas 8559
MONSOON
0.0
0.2
0.4
0.6
W -N A W -E U W -M E S W -A P S W -A S S W -B G R E G
PM ( μ
g m
-3)
0
10
20
30
40
50
BC
(ng
m-3
)
PRE-MONSOON
0.0
0.5
1.0
1.5
2.0
W -N A W -E U W -M E S W -
A P
S W -
A S
S W -
B G
R E G
PM ( μ
g m
-3)
0
50
100
150
BC (n
g m
-3)
POST-MONSOON
0.0
0.2
0.4
0.6
0.8
1.0
W -N A W -E U W -M E S W -
A P
S W -
A S
S W -
B G
R E G
PM ( μ
g m
-3)
0
20
40
60
80
BC (n
g m
-3)
WINTER
0.0
0.2
0.4
0.6
0.8
W -N A W -E U W -M E S W -A P S W -A S S W -B G R E G
PM ( μ
g m
-3)
0
20
40
60
80
BC (n
g m
-3)
PM1-10 PM1 BC
a)
W-NA W-EU W-ME SW-AP SW-AS SW-BG REG
b)
c)
d)
0.6 60
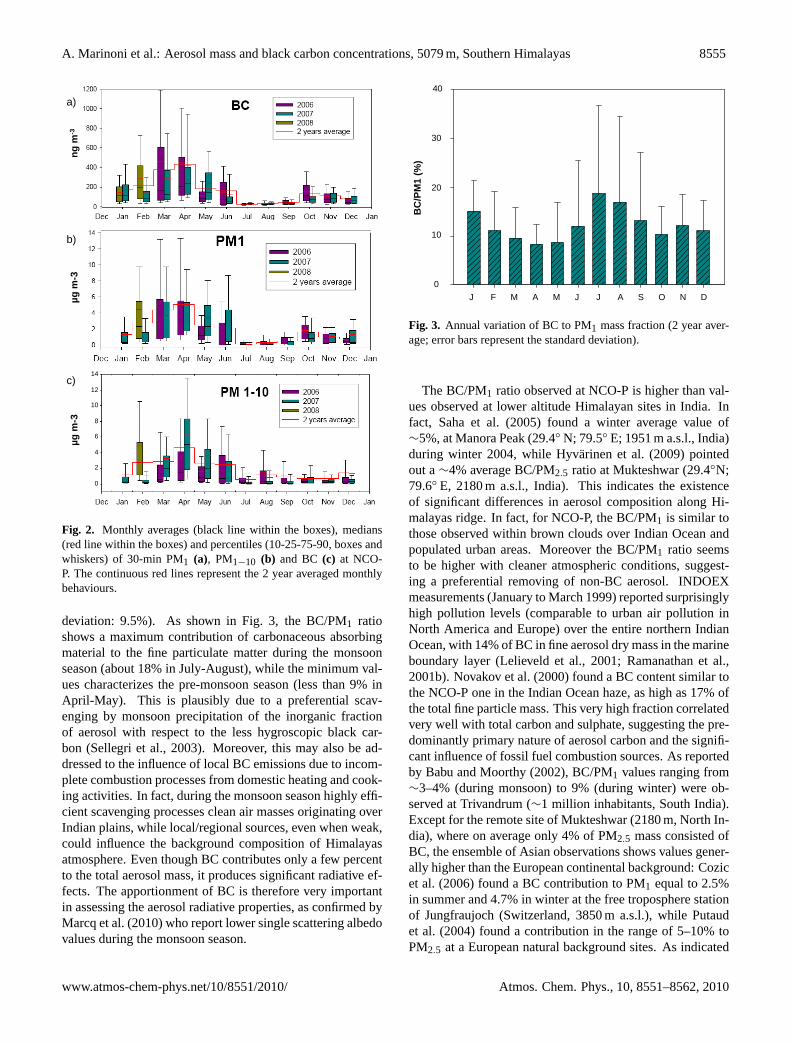
Fig. 6. PM1, PM1−10 and BC (average values) classified withdifferent synoptic air mass circulation as defined by Bonasoni etal. (this issue), during(a) pre-monsoon,(b) monsoon,(c) post-monsoon and(d) winter seasons.
altitude, tracing the influence of regional sources (Bonasoniet al., 2010) and explaining the association of dust and pollu-tion. The lower amount of mineral dust is connected to otherW and SW air masses, while pollution shows a minimumwith W-EU air masses. A possible role of the Arabian penin-sula and Middle-East/Persian Gulf (Lelieveld et al., 2009) assources of pollution for South Himalayas is suggested by thehigh fraction of BC/PM1 from SW-AP and SW-AS .
During the monsoon season, low BC average values char-acterised all the analysed air-mass circulation. However,REG and W-ME air masses are associated with the high-est amount of PM1 and BC, the highest accumulation modeconcentrations were also observed for aerosol size distribu-tion in these air masses (Sellegri et al., 2010). It is important
to specify that REG air masses accounted for 73.8% of airmasses in this season, while W-ME accounted for only 3.9%.The SW-BG air masses (20% of monsoon back-trajectories)brought to NCO-P the cleanest air over the whole year, withonly 0.14 µg m−3 of PM1 and 38 ng m−3 of BC. In fact, SWair masses are often associated with low pressure over theGulf of Bengal, causing intense precipitation on the wholeIndian Subcontinent up to the Himalayas foothills (Barrosand Long, 2003). Only one event from SW-AS (not shown inFig. 6) brought very high levels of aerosol in concentrationsmostly above the seasonal averages (1.7 µg m−3 PM1−10,5.5 µg m−3 PM1 and 316 ng m−3 BC).
The most frequent post-monsoon back-trajectories (W-ME: 37.1%, REG: 26.3% and W-NA: 18.6%) were also themost polluted of the season, with high average values of PM1and BC but a limited contribution of mineral dust as deducedby the low PM1−10 values. Conversely, SW-AS (7.8%) air-masses were characterised by the highest content of mineraldust.
During the winter season, the highest PM1 and BC aver-aged value was related with W-EU air-masses (frequency:19.8%), for which also relatively high PM1−10 amount wereobserved at NCO-P. Relatively high pollution levels weretraced back to SW-AS air-masses (frequency: 8%), whilehigh mineral dust contents were also detected with the mostfrequent W-NA cluster (frequency: 47.2%).
The analysis of cluster concentrations and their frequencyshows that the long distance air mass transport signifi-cantly impacts aerosol concentration and composition: W-ME and REG air-masses were significantly affected by pol-luted aerosols from pre-monsoon to post-monsoon seasons,while during winter the highest BC and PM1 average valueswere related to W-EU air-masses. Concerning mineral dust,the strongest contributions are mainly from W-ME and REGduring pre-monsoon, with possible contributions from SW-AS during the post-monsoon and far westerly regions duringwinter.
4 Summary and conclusions
The present paper addresses the diurnal and seasonal vari-ability of aerosol mass and black carbon concentration ob-served over a two-year period at Nepal Climate Observatory-Pyramid (5079 m a.s.l.).
The annual mean aerosol mass concentration is3.8±8.4 µg m−3. The coarse fraction accounts for halfof aerosol mass measured by OPC (1.88±4.45 µg m−3),with a larger variability with respect to the accumulationfraction. Black carbon average concentration over two yearsof measurements is 160.5 ng m−3, with a standard deviationof 296.1 ng m−3.
All the parameters investigated in the paper show a welldefined seasonal variation, as well as significant inter-annualvariations. The highest concentrations occur during the
www.atmos-chem-phys.net/10/8551/2010/ Atmos. Chem. Phys., 10, 8551–8562, 2010
8560 A. Marinoni et al.: Aerosol mass and black carbon concentrations, 5079 m, Southern Himalayas
pre-monsoon season, while the minima appear during themonsoon season (prolonged to the post-monsoon period forthe coarse mass). The monsoon minimum is attributed towet scavenging due to frequent cloud and precipitation in thisseason. The pre-monsoon maximum is linked to an increaseof anthropogenic emissions in Indian Subcontinent coupledwith the dry meteorological conditions, and to the larger ver-tical extent of the regional PBL on the Indo-Gangetic plains,associated to the efficient “chimney” effect of the Himalayanvalleys.
In fact, PMs and BC concentrations show a strong diurnalvariation: the daytime maxima of PM1 and BC are linked toup-valley thermal winds with a maximum in the afternoon,while PM1−10 is linked to wind strength, with a maximumpeaked at noon, suggesting a limited contribution from localre-suspension of coarse particles. Night-time mass and BCconcentrations are relatively low throughout the year, pro-viding information on free tropospheric background levels athigh altitudes in the Himalayas. However, although lowerthan the daytime values, the night-time levels follow thesame seasonality as the diurnal values, suggesting that pollu-tants reaching the high altitude, pumped by thermal winds ortransported by synoptic circulation, can be injected into thefree troposphere, where they attain a longer lifetime, and/oraccumulate in high residual layers. This is particularly ev-ident in the pre-monsoon season, when the night-time/earlymorning concentrations remain still high with respect to therest of the year.
The mean values of PM reported in this study are definitelylower than the Asian and Europe background. However,as shown by the high mean BC values, at NCO-P the non-monsoon seasons are more affected by regional/continentalemissions than European high altitude sites, indicating theinfluence of the brown cloud up to 5000 m a.s.l.
The contribution of BC to the total aerosol mass at NCO-Pis, on average, higher than 10% (standard deviation: 9.5%).The BC/PM1 ratio shows a maximum contribution of car-bonaceous absorbing material to the fine particulate mat-ter during the monsoon season (about 18% in July-August),while the minimum values characterize the pre-monsoon sea-son (less than 9% in April-May). Such values are muchhigher than those measured at other mountain sites, and moresimilar to the values reported for urban polluted sites. Themonsoon maximum can be attributed to a preferential scav-enging by monsoon precipitation of the inorganic aerosolfraction with respect to the less hygroscopic black carbon.However, during this season, a possible role of local/regionalsources cannot be completely ruled out.
Besides valley breeze regime, synoptic air-mass circula-tion can also influence the atmospheric composition at NCO-P. The analysis of BC, PM1 and PM1−10 night-time obser-vations as a function of the air-mass cluster classificationprovided by Bonasoni et al. (2010), confirms that long dis-tance transport of air masses significantly impacts aerosolconcentration and composition. Significant differences are
observed within each season between aerosol concentrationin air masses of different origin/path: polluted aerosols aremainly related to W-ME, REG and W-EU air masses, whilethe strongest contributions of mineral dust are mainly fromW-ME and REG during pre-monsoon and monsoon, with aspecial contribution from W-AS during post-monsoon andfar westerly regions during winter.
Acknowledgements.This work was carried out in the frameworkof the UNEP-ABC (Atmospheric Brown Clouds) and Ev-K2-CNR-SHARE (Stations at High Altitude for Research on theEnvironment) projects. The contribution of CNRS through thePICS bilateral program between CNR and CNRS and through theLEFE-INSU program is gratefully acknowledged. The authorsalso thank Tenzing C. Sherpa, Kaji Bista, Laxman Adhikary,Pema Sherpa, Lhakpa T Sherpa, Lakpa T Sherpa, Chhimi TSherpa and Hari Shrestha for their support at the Nepal ClimateObservatory-Pyramid, and Michael Sprenger (ETHZ) for providingLAGRANTO back-trajectories.
Edited by: G. McFiggans
References
Andreae, M. O., Andreae, T. W., Ferek, R. J., and Raemdonck, H.:Long range transport of soot carbon in the marine atmosphere,Sci. Total Environ., 36, 73–80, 1984.
Andreae, M. O. and Gelencser, A.: Black carbon or brown car-bon? The nature of light-absorbing carbonaceous aerosols, At-mos. Chem. Phys., 6, 3131–3148, doi:10.5194/acp-6-3131-2006,2006.
Baltensperger, U., Gaggeler, H. W., Jost, D. T., Lugauer, M.,Schwikowski, M., Weingartner, E., and Seibert, P.: Aerosol cli-matology at the high-alpine site Jungfraujoch, Switzerland, J.Geophys. Res., 102, 19707–19715, 1997.
Babu, S. S. and Moorthy, K. K.: Aerosol black carbon over atropical coastal station in India, Geophys. Res. Lett., 29, 2098,doi:10.1029/2002GL015662, 2002.
Babu, S. S., Satheesh, S. K., and Moorthy, K. K: Aerosol radia-tive forcing due to enhanced black carbon at an urban site in In-dia, Geophys. Res. Lett., 29, 1880, doi:10.1029/2002GL015826,2002.
Babu, S. S., Moorthy, K. K., and Satheesh, S. K.: Aerosolblack carbon over Arabian Sea during intermonsoon and sum-mer monsoon seasons, Geophys. Res. Lett., 31, L06104,doi:10.1029/2003GL018716, 2004.
Barros, A. P. and Lang, T. J.: Monitoring the Monsoon in theHimalayas: Observations in Central Nepal, June 2001, Mon.Weather Rev., 131, 1408–1427, 2003.
Beegum, G. N., Moorthy, K. K., Babu, S. S., Sathhesh, S., Vi-noj, V., Badarinath, K., Safai, P., Devara, P., Singh, S., Vinod,Dumka, U., and Pant, P.: Spatial distribution of aerosol 5 blackcarbon over India during pre-monsoon season, Atmos. Environ.,43, 1071–1078, 2009.
Bertolani, L., Bollasina, M., and Tartari, G.: Recent biennial vari-ability of meteorological features in the eastern Highland Hi-malayas, Geophys. Res. Lett., 27, 2185–2188, 2000.
Atmos. Chem. Phys., 10, 8551–8562, 2010 www.atmos-chem-phys.net/10/8551/2010/
A. Marinoni et al.: Aerosol mass and black carbon concentrations, 5079 m, Southern Himalayas 8561
Bodhaine, B. A.: Aerosol absorption measurements at Barrow,Mauna Loa, and South Pole, J. Geophys. Res., 100, 8967–8975,1995.
Bonasoni, P., Laj, P., Angelini, F., Arduini, J., Bonafe, U., Calzo-lari, F., Cristofanelli, P., Decesari, S., Facchini, M. C., Fuzzi, S.,Gobbi, G. P., Maione, M., Marinoni, A., Petzold, A., Roccato, F.,Reger, J. C., Sellegri, K., Sprenger, M., Venzac, H., Verza, G. P.,Villani, P., and Vuillermoz, E.: The ABC-Pyramid AtmosphericResearch Observatory in Himalayas for aerosol, ozone and halo-carbon measurements, Sci. Total Environ., 391, 241–251, 2008.
Bonasoni, P., Laj, P., Marinoni, A., Sprenger, M., Angelini, F., Ar-duini, J., Bonafe, U., Calzolari, F., Colombo, T., Decesari, S., DiBiagio, C., di Sarra, A. G., Evangelisti, F., Duchi, R., Facchini,M. C., Fuzzi, S., Gobbi, G. P., Maione, M., Panday, A., Roccato,F., Sellegri, K., Venzac, H., Verza, G. P., Villani, P., Vuillermoz,E., and Cristofanelli, P.: Atmospheric Brown Clouds in the Hi-malayas: first two years of continuous observations at the NepalClimate Observatory-Pyramid (5079 m), Atmos. Chem. Phys.,10, 7515–7531, doi:10.5194/acp-10-7515-2010, 2010.
Carrico, C. M., Bergin, M. H., Shrestha, A. B., Dibb, J. E., Gomes,L., and Harris. J. M.: The importance of carbon and mineral dustto seasonal aerosol properties in the Nepal Himalaya, Atmos. En-viron., 37, 2811–2824, 2003.
Cachier, H., Buat-Menard, P., Fontugne, M., and Chesselet, R.:Long- range transport of continentally-derived particulate carbonin the marine atmosphere: Evidence from stable isotope studies,Tellus, 38B, 161–177, 1986.
Chan, C. Y., Wong, K. H., Li, Y. S., Chan, L. Y., and Zheng, X.D.: The effects of Southeast Asia fire activities on troposphericozone, trace gases and aerosols at a remote site over Tibetan Pla-teu of Southwest China, Tellus, 58B, 310–318, 2006.
Chandra Mouli, P., Venkata Mohan, S., and Jayarama Reddy, S.:Chemical composition of atmospheric aerosol (PM10) at a semi-arid urban site: influence of terrestrial sources, Environ. Monit.Assess., 117, 291–305. 2006.
Cong, Z., Kang, S., Smirnov, A., and Holben, B.: Aerosol opticalproperties at Nam Co, a remote site in central Tibetan Plateau,Atmos. Res., 92, 42–48, 2009.
Cozic, J., Verheggen, B., Mertes, S., Connolly, P., Bower, K.,Petzold, A., Baltensperger, U., and Weingartner, E.: Scav-enging of black carbon in mixed phase clouds at the highalpine site Jungfraujoch, Atmos. Chem. Phys., 7, 1797–1807,doi:10.5194/acp-7-1797-2007, 2007.
Chung, S. H. and Seinfeld, J. H.: Climate response of direct ra-diative forcing of anthropogenic black carbon, J. Geophys. Res.,110, D11102, doi:10.1029/2004JD005441, 2005.
Decesari, S., Facchini, M. C., Carbone, C., et al.: Chemical compo-sition of PM10 and PM1 at the high-altitude Himalayan stationNepal Climate Observatory-Pyramid (NCO-P) (5079 m a.s.l.),Atmos. Chem. Phys., 10, 4583-4596, doi:10.5194/acp-10-4583-2010, 2009.
Duchi, R., Cristofanelli, P., Marinoni, A., Calzolari, F., Decesari, S.,Laj, P., Sprenger, M., Vuillermoz, E., and Bonasoni, P.: Mineraldust transport events at NCO-P (South Himalayas,5079 m a.s.l.),Atmos. Chem. Phys. Discuss., in preparation, 2010.
Forster, P., Ramaswamy, V., Artaxo, P., et al.: Changes in At-mospheric Constituents and in Radiative Forcing, in ClimateChange 2007: The Physical Science Basis. Contribution ofWorking Group I to the Fourth Assessment Report of the Inter-
governmental Panel on Climate Change, edited by: Solomon, S.,Qin, D., Manning, M., Chen, Z., Marquis, M., Averyt, K. B., Tig-nor M., Miller, H. L., Cambridge University Press, Cambridge,UK and New York, NY, USA, 2007.
Ganguly, D., Jayaraman, A., Rajesh, T. A., and Gadhavi,H.: Wintertime aerosol properties during foggy and non-foggy days over urban center Delhi and their implications forshortwave radiative forcing, J. Geophys. Res., 111, D15217,doi:10.1029/2005JD007029, 2006.
Gautam, R., Liu Z,. Singh, R. P., and Hsu, N. C.: Twocontrasting dust-dominant periods over India observed fromMODIS and CALIPSO, Geophys. Res. Lett., 36, L06813,doi:10.1029/2008GL036967, 2009.
Hansen, J, Lacis, A., Rind, D., Russell, G., Stone, P., Fung, I.,Ruedy, R., and Lerner, J.: Climate sensitivity: Analysis of feed-back mechanisms, Climate Processes and Climate Sensitivity,Geophys. Monogr. Ser. 29, edited by: Hansen, J. E., and Taka-hashi, T., AGU, Washington DC, USA, 130–163, 1984.
Hansen, J., Fung, I., Lacis, A., Rind, D., Lebedeff, Ruedy, R., Rus-sell, G., and Stone, P.: Global climate changes as forecast byGoddard Institute for Space Studies three-dimensional model, J.Geophys. Res., 93, 9341–9364, doi:10.1029/88JD00231, 1988.
Henne, S., Klausen, J., Junkermann, W., Kariuki, J. M., Aseyo,J. O., and Buchmann, B.: Representativeness and climatologyof carbon monoxide and ozone at the global GAW station Mt.Kenya in equatorial Africa, Atmos. Chem. Phys., 8, 3119–3139,doi:10.5194/acp-8-3119-2008, 2008.
Horvarth, H.: Atmospheric light absorption, Atmos. Environ., 27A,293–317, 1993.
Hyvarinen, A. P., Lihavainen, H., Komppula, M., Sharma, V. P.,Kerminen, V. M., Panwar, T. S., and Viisanen, Y.: Continu-ous measurements of optical properties of atmospheric aerosolsin Mukteshwar, northern India, J. Geophys. Res., 114, D08207,doi:10.1029/2008JD011489, 2009.
Jacobson, M. Z.: Strong radiative heating due to the mixing stateof black carbon in atmospheric aerosols, Nature, 409, 695–697,2001.
Kanakidou, M., Seinfeld, J. H., Pandis, S. N., Barnes, I., Dentener,F. J., Facchini, M. C., Van Dingenen, R., Ervens, B., Nenes, A.,Nielsen, C. J., Swietlicki, E., Putaud, J. P., Balkanski, Y., Fuzzi,S., Horth, J., Moortgat, G. K., Winterhalter, R., Myhre, C. E.L., Tsigaridis, K., Vignati, E., Stephanou, E. G., and Wilson,J.: Organic aerosol and global climate modelling: a review, At-mos. Chem. Phys., 5, 1053–1123, doi:10.5194/acp-5-1053-2005,2005.
Khemani, L. T., Momin, G. A., Naik, M. S., Vijay Kumar, R., andRamana Murthy, B. H: Chemical composition and size distribu-tion of atmospheric aerosol over Deccan Plateau, India, Tellus,34, 151–158, 1982.
Krishnan, P. and Kunhikrishnan, P. K.: Temporal variations of ven-tilation coefficient at a tropical Indian station using UHF windprofiler, Curr. Sci., 86, 447–451, 2004.
Laj, P., Klausen, J., Bilde, M., et al.: Measuring atmo-spheric composition change. Atmos. Environ., 43, 5351–5414,doi:10.1016/j.atmosenv.2009.08.020, 2009.
Lelieveld, J., Crutzen, P. J., Ramanathan, V., et al.: The IndianOcean Experiment: Widespread air pollution from south andsouth east Asia, Science, 291, 1031–1036, 2001.
Lelieveld, J., Hoor, P., Joockel, P., Pozzer, A., Hadjinicolaou, P.,
www.atmos-chem-phys.net/10/8551/2010/ Atmos. Chem. Phys., 10, 8551–8562, 2010
8562 A. Marinoni et al.: Aerosol mass and black carbon concentrations, 5079 m, Southern Himalayas
Cammas, J.-P., and Beirle, S.: Severe ozone air pollution inthe Persian Gulf region, Atmos. Chem. Phys., 9, 1393–1406,doi:10.5194/acp-9-1393-2009, 2009.
Liousse, C., Cachier, H., and Jennings, S. G.: Optical and thermalmeasurements of black carbon aerosol content in different envi-ronments: variation of specific attenuation cross section, sigma,Atmos. Environ., 27A, 1203–1211, 1993.
Marinoni, A., Cristofanelli, P., Calzolari, F., Roccato, F., Bonafe, U.and Bonasoni, P.: Continuous measurements of aerosol physicalparameters at the Mt. Cimone GAW Station (2165 m asl, Italy)Sci. Tot. Environ., 391, 241–251, 2008.
Marcq, S., Laj, P., Villani, P., Roger, J. C., Sellegri, K., Bonasoni, P.,Marinoni, A., Cristofanelli, P., Vuillermoz, E., Verza, G. P., andBergin, M.: Aerosol Optical Properties and Radiative Forcing inthe High Himalayas Based on Measurements at the Nepal Cli-mate Observatory – Pyramid Site (5079 m a.s.l), 10, 5859–5872,doi:10.5194/acp-10-5859-2010, 2010.
Ming J., Xiao C., Sun J, Kang S. and Bonasoni P., Carbonaceousparticles in the atmosphere and precipitation of the Nam Co re-gion, central Tibet, accepted for publication in J. Environ. Sci-ences, 2010.
Novakov, T., Andreae, M. O., Gabriel, R., Kirchstetter, T. W.,Mayol-Bracero, O. L., and Ramanathan, V.: Origin of carbona-ceous aerosols over the tropical Indian Ocean: Biomass burningor fossil fuels?, Geophys. Res. Lett., 27, 4061–4064, 2000.
Nyeki, S., Baltensperger, U., Colbeck, I., Jost, D. T., Weingartner,E., and Gaggeler, H. W.: The Jungfraujoch high-alpine researchstation (3454 m) as a background clean continental site for themeasurement of aerosol parameters, J. Geophys. Res., 103(D6),6097–6107, 1998.
Pant, P., Hedge, P., Dumka, U. C., Sagar, R., Satheesh, S. K., Moor-thy, K. K., Saha, A., and Srivastava, M. K.: Aerosol charac-teristics at high-altitude location in central Himalayas: Opticalproperties and radiative forcing, J. Geophys. Res., 111, D17206,doi:10.1029/2005JD006768, 2006.
Petzold, A., Kramer, H., and Schonlinner, M.: Continuous Mea-surement of Atmospheric Black Carbon Using a Multi-AngleAbsorpton Photometer, Environ. Sci. Pollut. Res., 4, 78–82,2002.
Petzold, A. and Schonlinner, M.: Multi-Angle Absorption Pho-tometry. A New Method for the Measurement of Aerosol LightAbsorption and Atmospheric Black Carbon, J. Aerosol Sci., 35,421–441, 2004.
Pillai, P. A. and Mohankumar K.: Tropospheric biennial oscil-lation of the Indian summer monsoon with and without theEl Nino-Southern Oscillation, Int. J. Climatol., 27, 2095-2101,doi:10.1002/joc.1503, 2007.
Putaud, J.-P., Raes, F., Van Dingenen, R., Bruggemann, E., Fac-chini, M. C., Decesari, S., Fuzzi, S., Gehrig, R., Huglin, C., Laj,P., Lorbeer, G., Maenhaut, W., Mihalopoulos, N., Muller, K.,Querol, X., Rodriguez, S., Schneider, J., Spindler, G,, Ten Brink,H., Torseth, K., and Wiedensohler, A.:A European aerosol phe-nomenology – 2:chemical characteristics of particulate matter atkerbside, urban, rural and background sites in Europe, Atmos.Environ., 38, 2579–2595, 2004.
Ramanathan, V., Crutzen, P. J., Lelieveld, J., et al.: Indian OceanExperiment: An integrated analysis of the climate forcing and ef-fects of the great Indo-Asian haze, J. Geophys. Res., 106, 28371–28398, 2001.
Ramanathan, V., Li, F., Ramana, M. V., at al.: Atmospheric brownclouds: Hemispherical and regional variations in long-rangetransport, absorption, and radiative forcing, J. Geophys. Res.,112, D22S21, doi:10.1029/2006JD008124, 2007.
Ruellan, S., Cachier, H., Gaudichet, A., Masclet, P., and Lacaux J.P.: Airborne aerosols over central Africa during the Experimentfor Regional Sources and Sinks of Oxidants (EXPRESSO), J.Geophys. Res., 104(D23), 30673–30690, 1999.
Saha, A., Pant, P., Dumka, U. C., Hegde, P., Srivastava, M. K.,and Sagar, R.: Aerosol Characteristics at a high-altitude stationNainital during the ISRO-GBP Land Campaign-II. Proceedingsof the SRO-GBP Land-Campaign-II meeting, Physical ResearchLaboratory, Ahmadabad, 1–2 March 2005.
Sellegri, K., Laj, P., Venzac, H., Picard, D., Villani, P., Bona-soni, P., Marinoni, A., Cristofanelli, P., and Vuillermoz, E.: Sea-sonal variation of aerosol size distribution based on long-termmeasurements at the high altitude Himalayan site of Nepal Cli-mate Observatory-Pyramid (5079 m), Nepal, submitted, Atmos.Chem. Phys. Discuss., 2010.
Sellegri, K., Laj, P., Marinoni, A., Dupuy, R., Legrand, M., andPreunkert, S.: Contribution of gaseous and particulate speciesto droplet solute composition at the Puy de Dome, France, At-mos. Chem. Phys., 3, 1509–1522, doi:10.5194/acp-3-1509-2003,2003.
Shrestha, A. B.,Wake, C. P., Dibb, J. E., Mayewski, P. A., Whitlow,S. I., Carmichael, G. R., and Ferm, M.: Seasonal variations inaerosol concentrations and compositions in the Nepal Himalaya,Atmos. Environ., 34, 3349–3363, 2000.
Sun, J. and Ariya, P. A.: Atmospheric organic and bio-aerosols ascloud condensation nuclei (CCN): A review, Atmos. Environ.,40, 795–820, 2006.
Venzac, H., Sellegri, K., Laj, P., Villani, P., Bonasoni, P., Marinoni,A., Cristofanelli, P., Calzolari, F., Fuzzi, S., Decesari, S., Fac-chini, M.-Cr., Vuillermoz, E., Verza, G.P.: High Frequency NewParticle Formation in the Himalayas, PNAS, 105, 41, 15666–15671, 2008.
Venzac, H., Sellegri, K., Villani, P., Picard, D., and Laj, P.: Seasonalvariation of aerosol size distributions in the free troposphere andresidual layer at the puy de Dome station, France, Atmos. Chem.Phys., 9, 1465–1478, doi:10.5194/acp-9-1465-2009, 2009.
Atmos. Chem. Phys., 10, 8551–8562, 2010 www.atmos-chem-phys.net/10/8551/2010/