Embed Size (px)
Citation preview

DOE/SC-ARM-15-076
Aerosol Properties Downwind of Biomass Burns
Field Campaign Report
April 2016
PR Buseck

DISCLAIMER
This report was prepared as an account of work sponsored by the U.S. Government. Neither the United States nor any agency thereof, nor any of their employees, makes any warranty, express or implied, or assumes any legal liability or responsibility for the accuracy, completeness, or usefulness of any information, apparatus, product, or process disclosed, or represents that its use would not infringe privately owned rights. Reference herein to any specific commercial product, process, or service by trade name, trademark, manufacturer, or otherwise, does not necessarily constitute or imply its endorsement, recommendation, or favoring by the U.S. Government or any agency thereof. The views and opinions of authors expressed herein do not necessarily state or reflect those of the U.S. Government or any agency thereof.

DOE/SC-ARM-15-076
Aerosol Properties Downwind of Biomass
Burns Field Campaign Report PR Buseck, Arizona State University Principal Investigator April 2016 Work supported by the U.S. Department of Energy, Office of Science, Office of Biological and Environmental Research

PR Buseck, April 2016, DOE/SC-ARM-15-076
iii
Executive Summary
We determined the morphological, chemical, and thermal properties of aerosol particles generated by biomass burning during the Biomass Burning Observation Project (BBOP) campaign during the wildland fire season in the Pacific Northwest from July to mid-September, 2013, and in October, 2013 from prescribed agricultural burns in the lower Mississippi River Valley. BBOP was a field campaign of the U.S. Department of Energy (DOE)’s Atmospheric Radiation Measurement (ARM) Climate Research Facility. The morphological information was both two-dimensional, as is typical of most microscopy images and that have many of the characteristic of shadows in that they lack depth data, and three-dimensional (3D). The electron tomographic measurements will provided 3D data, including the presence and nature of pores and interstices, and whether the individual particles are coated by or embedded within other materials. These microphysical properties were determined for particles as a function of time and distance from the respective sources in order to obtain detailed information regarding the time evolution of changes during aging.
In the process of the making these measurements, we provided insight into the results of measurements made with the Single-Particle Soot Photometer (SP2), which has produced important but, in some cases, unpredicted and surprising results. The issue is that the SP2, like an Aerosol Mass Spectrometer (AMS), destroys the particles being measured. A consequence is that unexpected results must be explained by making simplifying inferences about the particles producing these results, just as with an AMS one needs to reconstruct the measured particles by combining the fragments produced during the analyses. Making parallel Transmission Electron Microscope (TEM) measurements on the same sample sets provided complementary information regarding the online measurements.

PR Buseck, April 2016, DOE/SC-ARM-15-076
iv
Acronyms and Abbreviations
AMS Aerosol Mass Spectrometer ARM Atmospheric Radiation Measurement Climate Research Facility BBOP Biomass Burning Observation Project C Celsius CPC Condensation Particle Counter DOE U.S. Department of Energy G-1 Gulfstream aircraft jpeg Joint Photographic Experts Group nm nanometer NW northwest OM organic matter SE southeast SP2 Single-Particle Soot Photometer SW southwest TB tar balls TEM Transmission Electron Microscope UTC Coordinated Universal Time 3D three-dimensional

PR Buseck, April 2016, DOE/SC-ARM-15-076
v
Contents
Executive Summary ..................................................................................................................................... iii Acronyms and Abbreviations ...................................................................................................................... iv 1.0 Sampling ............................................................................................................................................... 1 2.0 TEM Image Analyses ........................................................................................................................... 1 3.0 Tar Ball Formation in the July 30B Sample: An Example ................................................................... 2 4.0 Heating Experiment .............................................................................................................................. 4 5.0 Ns-Soot Mixing States .......................................................................................................................... 6 6.0 Wildfire Versus Agricultural Burns ...................................................................................................... 8 7.0 Presentations of Research Results ........................................................................................................ 1
Figures
1 Examples of TEM images from the BBOP campaign ............................................................................ 2 2 Particle evolution with distance from a flame (BBOP, July 30, 2013) .................................................. 3 3 Aerosol mass concentrations measured using the SP2 and TEM sampling periods (yellow and
grey areas) on the July 30 flight ............................................................................................................. 4 4 Evaporation of tar balls .......................................................................................................................... 5 5 TEM images of BBOP aerosol particles at ambient temperature (top) and after heating to ~600
ºC (bottom) ............................................................................................................................................. 5 6 Volume remaining fraction of organic aerosol particles from wild fire, urban plume, and
agriculture burns ..................................................................................................................................... 6 7 Mixing states of ns-soot particles in samples collected on July 30 ........................................................ 7 8 Ns-soot coated by high-viscosity organic matter ................................................................................... 7 9 Examples of embedding as a variety of internal mixing ........................................................................ 8 10 Comparison of particles in samples from agricultural burning (left) and wildfire (right) ...................... 8

PR Buseck, April 2016, DOE/SC-ARM-15-076
1
1.0 Sampling
We conducted sampling during the wildland fire season in the Pacific Northwest from July to mid-September, 2013, and in October, 2013 from prescribed agricultural burns in the lower Mississippi River Valley. Urban plumes from seven cities in the northwest (NW) and southeast (SE) United States provided a contrasting set of samples and observations. We used an automated, two-stage aerosol impactor on the DOE Gulfstream (G-1) aircraft flying through smoke plumes as close to a fire as allowed by aviation rules, followed by one or two sets of three to six transects covering a transport time of two to four hours. We collected up to 16 TEM grid samples on lacy-carbon grids per flight. TEM samples were collected when crossing the smoke plume that resulted from biomass burning. In total, 443 samples were collected for both fine- and coarse-mode aerosol particles (0.3 and 1 µm 50% cutoff aerodynamic diameters, respectively) from 33 flights.
2.0 TEM Image Analyses
Each sample grid contains several thousands of individual particles. We obtained ~10 TEM images of all fine-mode samples (e.g., Figure 1). Each image includes several hundred particles. The goal was to determine the mixing states of each sample and the formation and amounts of tar balls. A representative TEM image for each sample has been uploaded to the BBOP data storage site (443 images in total). Each image is in Joint Photographic Experts Group (jpeg) format and has 4008 × 2664 pixel resolution.

PR Buseck, April 2016, DOE/SC-ARM-15-076
2
Figure 1. Examples of TEM images from the BBOP campaign. a) Sunnyside Fire, Oregon (7/23/13
am); b) Sunnyside Fire, Oregon (7/23/13 pm); c) Research flight #5 - fire near Goldendale, Washington (mile marker 28) (7/26/13); d) Research flight #10 - Pony Fire complex near Mountain Home, Idaho (8/13/13); e) Research flight #11 - Pony Fire complex (8/14/13); f) Research flight #19 - agriculture burns, western Idaho panhandle and Dead Canyon southwest (SW) of Pasco, Washington (9/11/13); g) Research flight #20 - Nashville plume; h) Research flight #25 - agricultural fire (10/14/13); and i) Research flight #27 - fire plume survey in box 2 and 3 west and south of Memphis (10/18/13). Scale bars: 2 µm.
3.0 Tar Ball Formation in the July 30B Sample: An Example
We focused on the July 30B flight to investigate the aging process of biomass-burning smoke (Figure 2). We sampled the Colockum Fire, which occurred southeast of Wenatchee, Washington, from 15:39:00 Coordinated Universal Time (UTC) to 18:15:00. For samples collected just above the fire (0-hour aging), organic matter (OM) with potassium inclusions dominated. The OM spread over the substrate, indicating that it had low viscosity when collected. As we collected more aged and dispersed particles, as seen from the SP2 data (Figure 3), we observed that the OM became more viscous. Most OM was solid and spherical, some on the way to becoming tar balls (TBs), in the smoke that aged for >2.5 hour. They, together with other biomass-burning particles, also occurred outside the smoke plumes, perhaps as a result of dilution.

PR Buseck, April 2016, DOE/SC-ARM-15-076
3
Figure 2. Particle evolution with distance from a flame (BBOP, July 30, 2013). The bold green arrow
points downwind from the source fire. The numbered yellow spots indicate places where we collected particles, with image numbers matching those in the surrounding panels. The blue arrows between panels indicate the evolution sequence, with elapsed time for collection indicated on the right above the panels, except for panel 8 where it is in the upper left on the image. The small spots mark places where Condensation Particle Counter (CPC) results were obtained each minute.

PR Buseck, April 2016, DOE/SC-ARM-15-076
4
Figure 3. Aerosol mass concentrations measured using the SP2 and TEM sampling periods (yellow and
grey areas) on the July 30 flight. Red numbers indicate TEM samples that contain tar balls. They generally dominated when TEM samples were collected outside smoke (lower particle number concentrations).
4.0 Heating Experiment
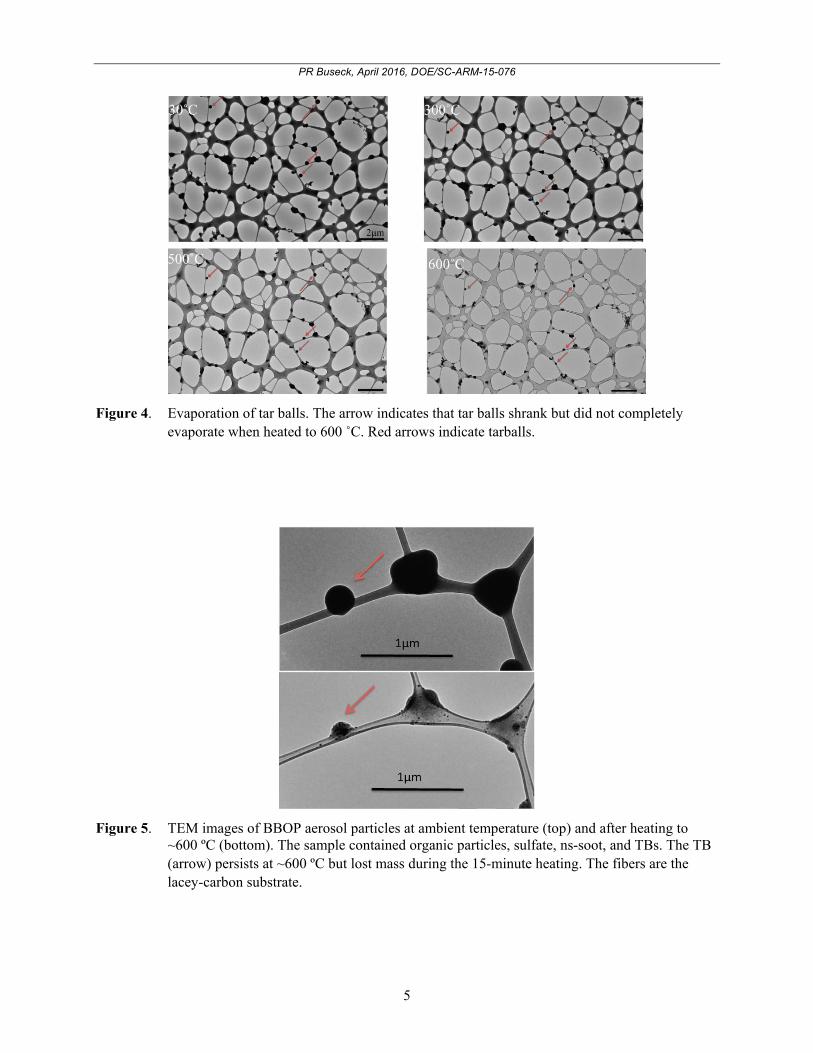
We conducted heating experiments on biomass-burning samples, including TBs, using a standard TEM heating holder, which can heat samples up to ~1000 ºC during TEM observation. The TBs started to shrink when the temperature was increased (Figure 4, Figure 5, and Figure 6). The TBs still existed at 650 ºC, which is the highest temperature of the substrate we used, although they had lost much volume. In contrast, all the sulfate had evaporated by ~180 ºC. The ns-soot did not change during heating, although its coating evaporated. The heating behavior at 600 ºC is important because it is the filament temperature used by the AMS, suggesting that the TB detection efficiency in biomass-burning smoke may be low.
PR Buseck, April 2016, DOE/SC-ARM-15-076
5
Figure 4. Evaporation of tar balls. The arrow indicates that tar balls shrank but did not completely
HYDSRUDWH�ZKHQ�KHDWHG�WR�����Û&��5HG�DUURZV�LQGLFDWH�WDUEDOOV�
Figure 5. TEM images of BBOP aerosol particles at ambient temperature (top) and after heating to
~600 ºC (bottom). The sample contained organic particles, sulfate, ns-soot, and TBs. The TB (arrow) persists at ~600 ºC but lost mass during the 15-minute heating. The fibers are the lacey-carbon substrate.

PR Buseck, April 2016, DOE/SC-ARM-15-076
6
Figure 6. Volume remaining fraction of organic aerosol particles from wild fire, urban plume, and
agriculture burns. Three TEM samples were measured for each flight (>100 particles for each flight). About 50% in volume was lost between 150 and 300 Ԩ and ~30% of volume remained after 600 ºC heating. No obvious differences were found between samples.
5.0 Ns-Soot Mixing States
One of the most abundant species in the BBOP plumes is ns-soot, and its mixing state, which varied considerably, is important for evaluating optical properties. Its coatings are relatively thin (Figure 7) relative to anthropogenic sources such as Mexico City and Los Angeles. Also, many ns-soot particles were partly coated and not compacted even when coated (Figure 8; also cf. right panel in Figure 9), similar to what we observed in southern Africa. We interpret the BBOP observations as indicating that the OM had a relatively high viscosity when it coated or embedded the ns-soot. As the result, the OM only coated parts of many particles.

PR Buseck, April 2016, DOE/SC-ARM-15-076
7
Figure 7. Mixing states of ns-soot particles in samples collected on July 30. Ns-soot particles are coated
or partly embedded within OM. Yellow arrows indicate ns-soot.
Figure 8. Ns-soot coated by high-viscosity organic matter. Note the small spheres of the ns-soot.

PR Buseck, April 2016, DOE/SC-ARM-15-076
8
Figure 9. Examples of embedding as a variety of internal mixing. Left: 3D isosurface electron
tomographic image of embedded ns-soot within OM and sulfate from an urban area (Mexico City). The individual ns-soot spherules can be seen embedded within the OM (from Adachi et al. 2010). Right: ns-soot embedded within OM. Scale bar = 250 nanometers (nm).
6.0 Wildfire versus Agricultural Burns
The mixing states of agricultural-burning smoke and wildfire smoke differed (Figure 10). Aerosol particles in the agricultural smoke had larger sulfate inclusions, whereas the wildfire particles included smaller and scattered potassium inclusions within OM. The agricultural smoke particles had lower viscosity than those from the wild fires and contained fewer TBs.
Figure 10. Comparison of particles in samples from agricultural burning (left) and wildfire (right).

PR Buseck, April 2016, DOE/SC-ARM-15-076
1
7.0 Presentations of Research Results
The following presentations of research results were made at scientific and professional meetings:
Adachi, K, PR Buseck, A Sedlacek, L Kleinman, and D Chand. 2015. “Evolution and micro physical properties of biomass-burning aerosol particles.” Presented at 9th Asian Aerosol Conference, Kanazawa, Ishikawa, Japan, June, 2015.
Buseck, PR, K Adachi, D Chand, LI Kleinman, and AJ Sedlacek. 2014. “Transmission electron microscopy analysis of tarball formation and volatility from biomass-burning aerosol particles during the 2013 BBOP Campaign.” Presented at American Geophysical Union (AGU) Fall Meeting, San Francisco, California, Abstract A52A-03, December 2014.
Kleinman, LI, AJ Sedlacek III, RJ Yokelson, TB Onasch, K Adachi, PR Buseck, D Chand, S Collier, MK Dubey, F Mei, JE Shilling, SR Springston, J Wang, NL Wigder, and Q Zhang. 2014. “Time dependence of aerosols in biomass burn plumes from BBOP.” American Geophysical Union (AGU) Fall Meeting, San Francisco, California, Abstract A52A-01, December 2014.
Adachi, K, AJ Sedlacek, L Kleinman, D Chand, and P Buseck. 2014. “Transmission electron microscopy analysis of biomass-burning aerosol particles during BBOP Campaign.” American Association for Aerosol Research (AAAR) Annual Conference, Orlando, Florida, October, 2014.
Adachi, K. 2014. “Mixing states of aerosol particles from various environment: transmission electron microscopy analysis.” International Aerosol Conference 2014, Busan, South Korea.
Busek, PR, and K Adachi. 2014. “What information can TEM provide for aerosol research?” Pacific Northwest National Laboratory workshop, Pasco, Washington.
Sedlacek, AJ, L Kleinman, WP Arnott, K Adachi, P Buseck, E Lewis, T Onasch, M Pikridas, J Shilling, S Springston, J Wang, and R Yokelson. 2014. “Evolution of biomass burning aerosols in the near field.” European Geosciences Union (EGU) General Assembly 2014, Vienna, Austria (Geophysical Research Abstracts 16:EGU2014-9226).
Sedlacek, AJ, LI Kleinman, K Adachi, WP Arnott, PR Buseck, S Collier, A Freedman, DA Jaffe, TB Onasch, M Pikridas, JE Shilling, SR Springston, J Wang, RJ Yokelson, NL Wigder, Q Zhang, and S Zhou. 2013. “Near-field evolution of biomass burning aerosols.” American Geophysical Union (AGU) Fall Meeting, San Francisco, CA, Abstract A33D-0246, December 2013.