Embed Size (px)
Citation preview

www.harriswilliams.de
Harris Williams & Co. Ltd is a private limited company incorporated under English law having its registered office at 5th Floor, 6 St. Andrew Street, London EC4A 3AE, UK, registered withthe Registrar of Companies for England and Wales under company number 7078852. Directors: Mr. Christopher Williams, Mr. Ned Valentine, Mr. Paul Poggi and Mr. Thierry Monjauze,authorised and regulated by the Financial Conduct Authority.
Harris Williams & Co. Ltd Niederlassung Frankfurt (German branch) is registered in the Commercial Register (Handelsregister) of the Local Court (Amtsgericht) of Frankfurt am Main,Germany, under registration number HRB 96687, having its business address at Bockenheimer Landstrasse 33-35, 60325 Frankfurt am Main, Germany. Permanent Representative(Ständiger Vertreter) of the Branch Niederlassung: Mr. Jeffery H. Perkins.
AEROSPACE, DEFENSE & GOVERNMENT SERVICES
INDUSTRY UPDATE │ OCTOBER 2015
0

PAGE |
HARRIS WILLIAMS & CO. ADG UPDATE
CONTENTS
ADG Group Insights:Government Services
Market Updates:
• Aerospace
• Defense
• Government Services
ADG CONTACTS
Jon NemoManaging [email protected]+1 (267) 675-5911
Chris RogersManaging [email protected]+1 (804) 915-0188
Doug KinardVice [email protected]+1 (804) 915-0127
Chris SmithVice [email protected]+1 (804) 932-1383
+1 (804) 887-6014
David [email protected]
+1 (804) 887-6079
AEROSPACE, DEFENSE & GOVERNMENT SERVICES
INDUSTRY UPDATE │ OCTOBER 2015
1
www.harriswilliams.de
Harris Williams & Co. is pleased to present our Aerospace, Defense & Government
Services (ADG) update for October 2015.
In this update, we revisit our June 2015 article on the near-term opportunity in
government services for private equity buyers and offer updated perspectives
underpinned by sector activity over the last four months.
As always, we hope you enjoy the content of this month’s reader and look forward
to hearing your thoughts and opinions.
Regards,
Industry Sectors
Aerospace
• Aircraft Interiors
• Airframe and Engine Components
• Avionics & Electronics
• Electromechanical and Power
• Fixed Base Operations
• Maintenance, Repair & Overhaul
• Software and Information
Services
• Specialty Materials & Metals
• Supply Chain Management &
Distribution
Defense
• Air, Land, and Sea Platforms and
Subsystems
• C4ISR Systems & Sensors
• Defense Electronics
• Satellite Equipment
• Homeland Security Technologies
• Supply Chain Management and
Distribution
• Tactical Products & Accessories
• Unmanned Systems
• Weapon Systems & Munitions
Government Services
• Cybersecurity
• Intelligence Services
• Simulation and Training
• Platform Maintenance &
Modernization
• Software and Information Services
• Systems Engineering &
Technical Assistance (SETA)
• Technical, Operations, and
Logistics Support Services
• Technology and Professional
Services
ADG Group Overview
Chris Rogers
Managing Director
Jon Nemo
Managing Director
Harris Williams & Co.’s Aerospace, Defense & Government Services (ADG) Group
combines deep industry knowledge and relationships with the best M&A advisory
services in the middle market. As a pure-play advisor with no conflicts of interest,
our ADG Group offers differentiated strategic advice and seamless execution to a
global base of leading aerospace, defense, and government services clients.

PAGE |
Sponsor Target Investment Thesis
Opportunity to better capitalize and accelerate the
growth trajectory of a leading engineering
services provider
Opportunity to unlock the value of a strategically
compelling merger of equals
Opportunity to capitalize on the accelerating importance
of big data and advanced analytics to both national
security and commercial markets
ADG GROUP INSIGHTS: GOVERNMENT SERVICES
AEROSPACE, DEFENSE & GOVERNMENT SERVICES
INDUSTRY UPDATE │ OCTOBER 2015
2
$2.1B$1.8B
Sponsor-Led Strategic-Led
EXHIBIT 1: GOV’T SERVICES M&A DEALS (ENTERPRISE VALUE > $100M)
June – October 2015Source: Public Information and Harris Williams &Co Estimates
5 Deals 1 Deal
Government Services: Revisiting the Near-Term Opportunity for Private Equity
When we last shared our observations on the government services market back in early June, we discussed
reasons to expect increased deal-making from private equity, reasons to expect a more shallow landscape
of aggressive strategic acquirers (at least for the near-term), and the growing importance of the equity
capital markets to pure-play federal services platforms. What has followed since our last post was a very
active four months of sector M&A and notable strategic announcements. With this in mind, a brief recap of
recent developments seems timely -- and also valuable context for our latest outlook for the remainder of
2015 and beyond.
As we predicted, financial sponsors
have led the sector’s most recent run of
M&A activity. As illustrated in Exhibit 1,the aggregate transaction value of
government services deals of $100M or
more over the last four months was $2.1B
for sponsor-led transactions, in
comparison with $1.8B for strategic-led
transactions. However, the most
important context for this comparison is
the footnote that the $1.8B for strategics
represents a single deal -- CSGov’s
pending acquisition of Providence Equity
backed SRA International.
This is in contrast to five sizeable sponsor-led deals – which involved nine different private equity groups.
Bolstered by an abundance of low cost debt financing, select sponsors have clearly demonstrated
conviction behind a variety of different investment theses (see Exhibit 2) and have done so in a window of
time during which most of the sector’s largest strategics are either digesting, divesting, or distracted.
Along these lines, strategic buyers do continue to actively shop, but the shifting and yet unsettled sector
landscape is limiting the near-term boldness of their deal-making. Despite the resurgence in sponsor-led
deals, strategic buyers have by no means left the M&A field -- as evidenced by SAIC’s $790M acquisition of
Scitor earlier this year, the pending CSGov/SRA combination, a string of smaller technology-oriented
transactions, and our expectation that another large strategic-led services deal will likely be announced in
the near term.
EXHIBIT 2: SELECT RECENT SPONSOR-LED TRANSACTIONS

PAGE |
ADG GROUP INSIGHTS: GOVERNMENT SERVICES
AEROSPACE, DEFENSE & GOVERNMENT SERVICES
INDUSTRY UPDATE │ OCTOBER 2015
EXHIBIT 3: PENDING DIVESTITURES / SPIN-OUTS (ENTERPRISE VALUE > $100M)
Source: Public Information and Harris Williams &Co Estimates
$6.2B
$4.7B
$1.7B
$10.9B
Sponsor-Led Strategic-Led
That said, the current buyer universe for services
deals has been decidedly less strategic than in
years past. A key driver of this shift is the
competitive landscape disruption that is being
effected by multiple, large spin-outs and the
decision by many of the defense primes to exit
all or large segments of their services businesses.
Reference Exhibit 3, which highlights our
estimated enterprise values of large government
services assets that are currently in the process of
being spun-out or divested. This totals $12.6B
and includes $1.7B of sponsor-owned platforms
and $4.7B of major strategic divestitures (a figure
which excludes the pending spin-out of CSGov)
– most of whom under their current ownership
had historically been heavyweight impact
players within government services M&A.
Once the dust settles and these large pending services transactions are acquired or otherwise recapitalized,
the universe of strategic buyers for core middle market government services transactions will take on
materially greater breadth and depth.
As we discussed back in June, the equity capital markets also remain well positioned to play a much more
prominent role within the future federal services landscape. While the planned IPOs of Alion and SRA that
were in the works earlier this year have since resulted in M&A deals, several other sponsor-owned platforms
(and strategic divestitures) are already, or should be, considering future public offerings (or spin-outs) for their
government services businesses. As we highlighted in our last article, a number of factors have markedly
increased the appetite and sentiment in recent months within the public equity markets for pure-play
government services companies, which have outperformed the S&P by 6.5% since June 30th. As illustrated in
Exhibit 4, the current universe of public pure-play government services companies is both larger, more diverse,
and more highly valued in early October 2015 than it was five years ago.
9.7x
Median TEV / CY15E EBITDA
EXHIBIT 4: PUBLIC PURE-PLAY PUBLIC GOVERNMENT SERVICES (TOTAL ENTERPRISE VALUE)
($ in billions)
$14.8
$16.7
$1.9
$11.2 $11.2
$27.9
12/31/2010 Existing Pure-Plays New Pure-Plays 10/15/2015
Net TEV increase includes impact of Six3 Systems, Scitor, and 15+
Other M&A Deals
3
6.9x
Median TEV / CY10 EBITDA
October 2015 TEV of Public Pure-Play Government
Services Companies Nearly 2x that of Five Years Ago
PAGE |
ADG GROUP INSIGHTS: GOVERNMENT SERVICES
AEROSPACE, DEFENSE & GOVERNMENT SERVICES
INDUSTRY UPDATE │ OCTOBER 2015
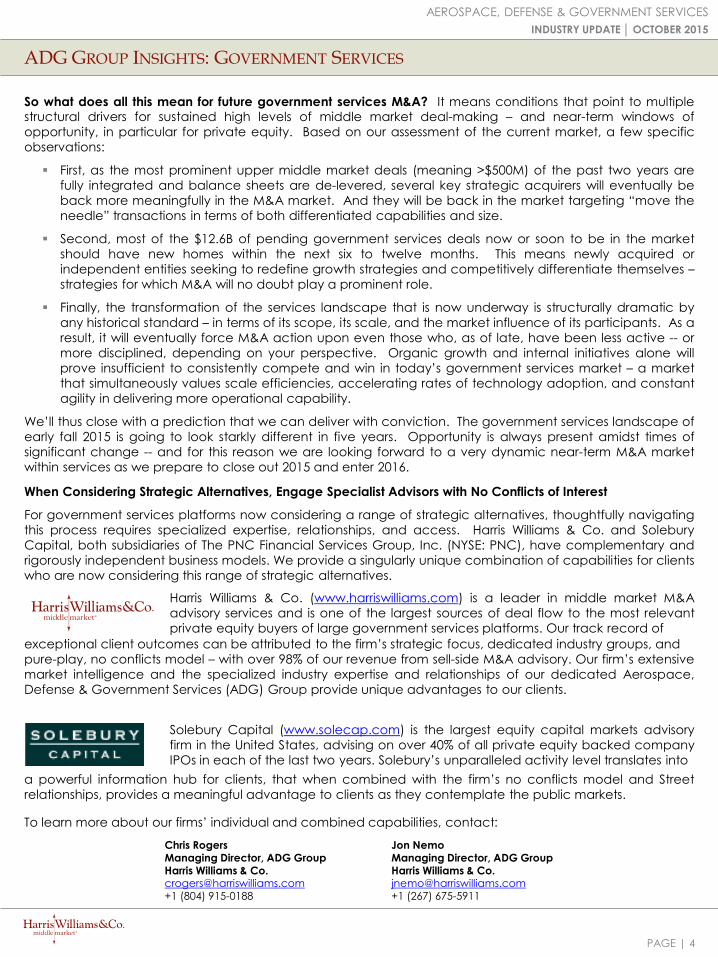
So what does all this mean for future government services M&A? It means conditions that point to multiplestructural drivers for sustained high levels of middle market deal-making – and near-term windows of
opportunity, in particular for private equity. Based on our assessment of the current market, a few specific
observations:
First, as the most prominent upper middle market deals (meaning >$500M) of the past two years are
fully integrated and balance sheets are de-levered, several key strategic acquirers will eventually be
back more meaningfully in the M&A market. And they will be back in the market targeting “move the
needle” transactions in terms of both differentiated capabilities and size.
Second, most of the $12.6B of pending government services deals now or soon to be in the market
should have new homes within the next six to twelve months. This means newly acquired or
independent entities seeking to redefine growth strategies and competitively differentiate themselves –
strategies for which M&A will no doubt play a prominent role.
Finally, the transformation of the services landscape that is now underway is structurally dramatic by
any historical standard – in terms of its scope, its scale, and the market influence of its participants. As a
result, it will eventually force M&A action upon even those who, as of late, have been less active -- or
more disciplined, depending on your perspective. Organic growth and internal initiatives alone will
prove insufficient to consistently compete and win in today’s government services market – a market
that simultaneously values scale efficiencies, accelerating rates of technology adoption, and constant
agility in delivering more operational capability.
We’ll thus close with a prediction that we can deliver with conviction. The government services landscape of
early fall 2015 is going to look starkly different in five years. Opportunity is always present amidst times of
significant change -- and for this reason we are looking forward to a very dynamic near-term M&A market
within services as we prepare to close out 2015 and enter 2016.
When Considering Strategic Alternatives, Engage Specialist Advisors with No Conflicts of Interest
For government services platforms now considering a range of strategic alternatives, thoughtfully navigating
this process requires specialized expertise, relationships, and access. Harris Williams & Co. and Solebury
Capital, both subsidiaries of The PNC Financial Services Group, Inc. (NYSE: PNC), have complementary and
rigorously independent business models. We provide a singularly unique combination of capabilities for clients
who are now considering this range of strategic alternatives.
Solebury Capital (www.solecap.com) is the largest equity capital markets advisory
firm in the United States, advising on over 40% of all private equity backed company
IPOs in each of the last two years. Solebury’s unparalleled activity level translates into
To learn more about our firms’ individual and combined capabilities, contact:
Chris RogersManaging Director, ADG GroupHarris Williams & [email protected]+1 (804) 915-0188
Jon NemoManaging Director, ADG GroupHarris Williams & [email protected]+1 (267) 675-5911
a powerful information hub for clients, that when combined with the firm’s no conflicts model and Street
relationships, provides a meaningful advantage to clients as they contemplate the public markets.
Harris Williams & Co. (www.harriswilliams.com) is a leader in middle market M&A
advisory services and is one of the largest sources of deal flow to the most relevant
private equity buyers of large government services platforms. Our track record of
exceptional client outcomes can be attributed to the firm’s strategic focus, dedicated industry groups, and
pure-play, no conflicts model – with over 98% of our revenue from sell-side M&A advisory. Our firm’s extensive
market intelligence and the specialized industry expertise and relationships of our dedicated Aerospace,
Defense & Government Services (ADG) Group provide unique advantages to our clients.
4
PAGE |
13.3x
9.6x
7.7x
7.2x
16.8x
15.3x
14.3x
13.5x
13.3x
12.7x
12.4x
12.2x
12.0x
11.7x
11.0x
10.8x
10.4x
10.1x
10.0x
9.8x
9.7x
9.7x
9.5x
9.2x
9.0x
8.5x
8.4x
8.4x
7.5x
7.3x
6.6x
6.1x
13.8x
10.9x
9.5x
9.3x
8.8x
8.2x
8.2x
8.1x
7.9x
EMBR3
BA
BBD.B
AIR
TDG
ROLL
BEAV
PCP
ZC
MGGT
HXL
HEI
AIR
HRX
COL
WAI R
BBA
SAF
SNR
TGI
WWD
ESL
LMIA
MAL
B
ATRO
KAMN
MOG.A
DCO
KLXI
SPR
GKN
AME
HON
CW
ETN
TXT
RR.
CR
UTX
PH
GE
LTM LTM Current Market % of Stock Price
Rev enue EBITDA Stock Price Cap 52-Wk High YoY Change
Embraer $4,054 $420 $6.51 $4,790 94.5% 15.3%
Boeing 94,944 9,479 134.22 91,202 84.5% 9.8%
Bombardier 19,883 1,088 1.31 2,928 38.4% (52.8%)
Airbus 69,514 5,212 64.20 50,535 82.7% 22.3%
TransDigm Group $2,540 $1,129 $211.77 $11,337 86.5% 22.7%
RBC Bearings 475 118 62.41 1,466 80.2% 16.3%
B/E Aerospace 2,682 474 44.99 4,779 55.9% (39.0%)
Precision Castparts 9,897 2,832 231.01 31,763 94.3% 3.2%
Zodiac Aerospace 5,047 652 25.66 7,057 62.6% (3.5%)
Meggitt 2,561 562 7.26 5,614 79.2% 8.0%
Hexcel 1,871 397 45.09 4,347 82.4% 19.2%
HEICO 1,152 286 49.66 3,092 77.9% 1.0%
AAR 1,577 72 22.20 782 64.8% (3.4%)
Heroux-Dev tek 302 38 9.43 339 100.0% 22.5%
Rockwell Collins 5,262 1,195 82.52 10,874 83.0% 11.1%
Wesco Aircraft Holdings 1,536 195 12.15 1,186 66.5% (29.1%)
BBA Av iation 2,238 249 2.95 3,038 52.8% (41.4%)
Safran 18,956 3,454 76.91 32,023 92.8% 43.3%
Senior 1,344 195 4.05 1,697 72.4% 0.8%
Triumph Group 3,951 372 42.70 2,105 60.2% (30.2%)
Woodward 2,041 361 43.26 2,751 76.5% (5.8%)
Esterline Technologies 1,991 301 74.53 2,202 61.7% (29.2%)
LMI Aerospace 376 43 10.51 136 71.1% (18.8%)
Magellan Aerospace 701 103 13.31 775 85.4% 39.4%
Barnes Group 1,243 274 38.47 2,104 92.1% 22.1%
Astronics 680 124 37.84 869 48.9% (15.3%)
Kaman 1,823 151 37.22 1,012 85.6% (4.6%)
Moog 2,574 346 57.53 2,147 72.6% (16.5%)
Ducommun 724 62 19.98 221 59.7% (29.1%)
KLX Aerospace 1,696 372 38.54 2,033 81.6% N/A
Spirit AeroSystems 6,708 1,052 47.76 6,555 82.4% 36.2%
GKN 11,060 1,319 4.37 7,498 72.8% (3.1%)
Ametek $4,044 $1,051 $54.11 $13,103 93.8% 17.3%
Honeywell International 39,362 7,111 98.26 76,816 91.5% 14.0%
Curtiss-Wright 2,222 397 65.04 3,052 83.8% (1.6%)
Eaton 21,888 3,562 52.75 24,661 71.5% (10.7%)
Textron 13,846 1,606 40.08 11,079 85.4% 18.5%
Rolls Royce 21,791 2,647 10.79 19,833 65.8% (27.0%)
Crane 2,848 418 49.00 2,844 69.5% (13.4%)
United Technologies 64,038 12,358 92.17 82,086 74.1% (7.9%)
Parker-Hannifin 12,712 1,865 102.30 13,930 76.7% (1.8%)
General Electric 147,025 28,117 27.60 278,661 96.2% 14.5%
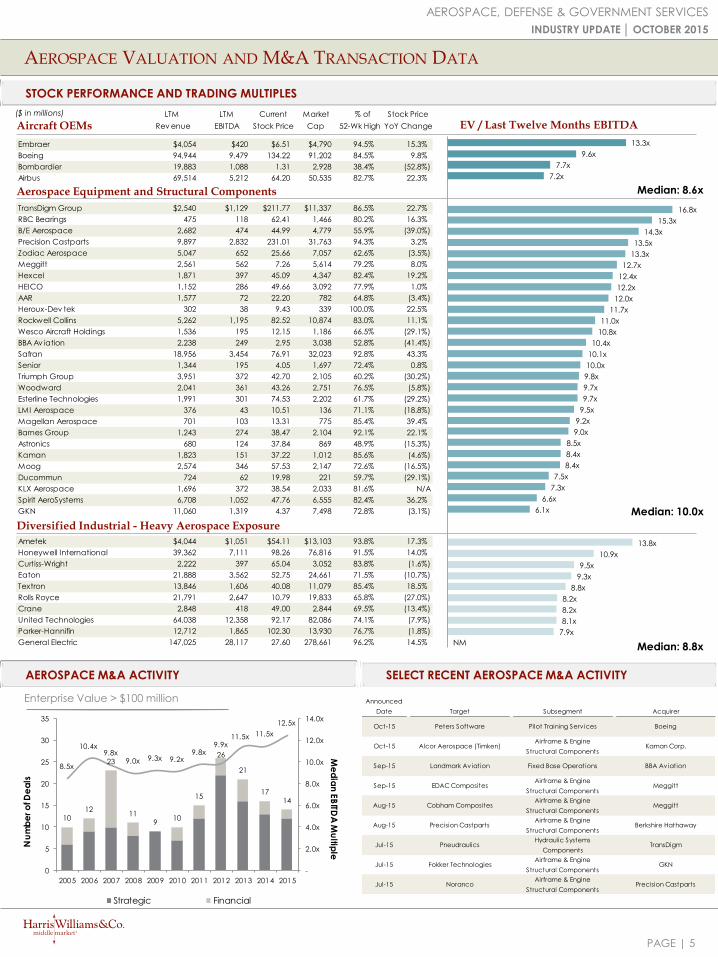
AEROSPACE VALUATION AND M&A TRANSACTION DATA
STOCK PERFORMANCE AND TRADING MULTIPLES
AEROSPACE M&A ACTIVITY
AEROSPACE, DEFENSE & GOVERNMENT SERVICES
INDUSTRY UPDATE │ OCTOBER 2015
Enterprise Value > $100 million
Aircraft OEMs
Aerospace Equipment and Structural Components
Diversified Industrial - Heavy Aerospace Exposure
SELECT RECENT AEROSPACE M&A ACTIVITY
EV / Last Twelve Months EBITDA
5
Median: 8.6x
Median: 10.0x
Median: 8.8x
($ in millions)
NM
1012
23
119
10
15
26
21
1714
8.5x
10.4x9.8x
9.0x 9.3x 9.2x9.8x
9.9x11.5x 11.5x
12.5x
-
2.0x
4.0x
6.0x
8.0x
10.0x
12.0x
14.0x
0
5
10
15
20
25
30
35
2005 2006 2007 2008 2009 2010 2011 2012 2013 2014 2015
Me
dia
n E
BITD
A M
ultip
le
Nu
mb
er o
f De
als
Strategic Financial
Announced
Date Target Subsegment Acquirer
Oct-15 Peters Software Pilot Training Serv ices Boeing
Oct-15 Alcor Aerospace (Timken)Airframe & Engine
Structural ComponentsKaman Corp.
Sep-15 Landmark Aviation Fixed Base Operations BBA Aviation
Sep-15 EDAC CompositesAirframe & Engine
Structural ComponentsMeggitt
Aug-15 Cobham CompositesAirframe & Engine
Structural ComponentsMeggitt
Aug-15 Precision CastpartsAirframe & Engine
Structural ComponentsBerkshire Hathaway
Jul-15 PneudraulicsHydraulic Systems
ComponentsTransDigm
Jul-15 Fokker TechnologiesAirframe & Engine
Structural ComponentsGKN
Jul-15 NorancoAirframe & Engine
Structural ComponentsPrecision Castparts

PAGE |
11.0x
10.9x
10.1x
9.8x
9.7x
9.6x
9.6x
7.4x
7.2x
5.5x
16.8x
13.5x
13.3x
12.7x
12.4x
11.8x
10.8x
10.4x
10.1x
9.7x
9.0x
RTN
LMT
NOC
BA.
GD
HO
BA
FNC
AIR
HII
AVAV
CHG
MRCY
COB
HRS
OA
ULE
FLIR
LLL
ESLT
TDY
CUB
CMTL
KTOS
DEFENSE VALUATION AND M&A TRANSACTION DATA
STOCK PERFORMANCE AND TRADING MULTIPLES
AEROSPACE, DEFENSE & GOVERNMENT SERVICES
INDUSTRY UPDATE │ OCTOBER 2015
Defense Prime
Contractors
Defense Technologies
DEFENSE M&A ACTIVITY SELECT RECENT DEFENSE M&A ACTIVITY
Enterprise Value > $50 million
EV / Last Twelve Months EBITDA
6
Median: 9.6x
Median: 12.1x
38.0x
($ in millions)
30
27
30
2019
29
25
16
18
11
13
12.4x
11.9x
13.4x
12.0x
10.5x 10.5x
8.6x 8.4x
9.9x
8.5x 8.1x
-
2.0x
4.0x
6.0x
8.0x
10.0x
12.0x
14.0x
16.0x
0
5
10
15
20
25
30
35
2005 2006 2007 2008 2009 2010 2011 2012 2013 2014 2015
Me
dia
n E
BITD
A M
ultip
le
Nu
mb
er o
f De
als
Strategic Financial
Announced
Date Target Subsegment Acquirer
Sep-15 GE Embedded Systems Defense Electronics Veritas Capital
Jul-15 Sikorsky Helicopter OEM Lockheed Martin
Jun-15 VievuTactical and Protection
Equipment The Safariland Group
Jun-15 Point Blank EnterprisesTactical and Protection
Equipment JLL Partners
Jun-15Kratos Electronic
Products Div ision (Herley)Defense Electronics Ultra Electronics
Apr-15 Kutta Technologies Unmanned Systems Sierra Nevada Corp.
Apr-15Inmet and Weinschel
Assets (Cobham)Defense Electronics API
Apr-15Semtech Corp (Defense
and Microwave Business)Defense Electronics Jariet Technologies
Apr-15Hunter Technology
CorporationDefense Electronics Sparton Corp.
LTM LTM Current Market % of Stock Price
Rev enue EBITDA Stock Price Cap 52-Wk High YoY Change
Raytheon $22,753 $3,336 $112.89 $34,268 99.3% 15.8%
Lockheed Martin 45,398 6,146 210.64 65,411 97.4% 19.5%
Northrop Grumman 23,945 3,585 174.58 32,715 98.1% 40.3%
BAE Systems 25,647 2,493 6.98 22,080 82.1% (2.2%)
General Dynamics 31,779 4,632 141.25 45,585 91.9% 16.9%
Thales 15,177 1,553 70.52 14,685 95.5% 43.9%
Boeing 94,944 9,479 138.42 94,056 87.1% 12.3%
Finmeccanica 16,784 1,692 13.44 7,770 87.0% 54.3%
Airbus 69,514 5,212 62.74 49,387 81.6% 12.0%
Huntington Ingalls 6,959 1,067 104.63 5,003 72.7% 10.9%
AeroVironment $255 $7 $21.50 $505 69.4% (23.8%)
Mercury Systems 547 54 3.51 679 91.5% (4.1%)
Cobham 235 35 16.59 571 94.3% 39.2%
Harris Corporation 3,249 556 4.50 5,090 83.2% 3.2%
Orbital ATK 5,083 1,102 75.33 9,313 88.9% N/A
Ultra Electronics Holdings 3,590 492 77.65 4,589 95.8% 0.0%
FLIR Systems 1,108 183 27.56 1,925 93.0% 0.2%
L-3 Communications Holdings 1,547 351 27.65 3,878 80.2% (4.8%)
Elbit Systems 11,654 1,188 109.93 8,831 82.7% (0.6%)
Teledyne Technologies 3,029 360 76.31 3,260 90.0% 24.7%
Cubic 2,366 389 83.47 2,954 74.7% (10.6%)
Comtech Telecommunications 1,401 121 43.62 1,173 78.3% (5.1%)
Chemring Group 307 47 23.49 379 57.7% (32.8%)
Kratos 807 48 4.11 243 57.7% (35.7%) NM
NM

PAGE |
14.4x
10.7x
10.3x
9.8x
9.4x
8.5x
7.8x
7.8x
7.7x
11.7x
9.4x
9.4x
9.1x
9.0x
6.1x
4.3x
LTM LTM Current Market % of Stock Price
Rev enue EBITDA Stock Price Cap 52-Wk High YoY Change
Engility $1,643 $151 $27.58 $1,015 56.3% (21.0%)
Booz Allen Hamilton 5,304 507 26.93 3,945 86.0% 8.0%
SAIC 4,064 320 42.22 1,943 75.4% (8.3%)
CACI International 3,313 299 80.87 1,960 87.7% 15.1%
Leidos 5,063 418 44.36 3,197 94.0% 27.8%
ManTech International 1,613 122 27.04 1,015 76.7% 1.5%
NCI, Inc 317 25 13.19 172 78.7% 54.6%
VSE Corporation 449 63 42.96 231 51.1% (16.0%)
Vectrus 1,157 43 22.60 239 66.9% N/A
KEYW 303 1 7.08 273 56.2% (27.6%)
Babcock International $5,938 $752 $15.03 $7,578 80.6% (7.9%)
CGI 8,163 1,404 36.82 11,315 82.9% 25.0%
AECOM 15,829 856 29.21 4,410 82.5% 3.9%
ICF 1,104 105 30.73 595 70.3% (6.0%)
CSC 11,697 1,015 64.33 8,899 87.8% 14.3%
Jacobs 12,216 840 40.65 5,032 81.5% (13.0%)
Fluor 20,254 1,348 46.72 6,772 67.0% (24.1%)
Serco 5,847 (990) 1.62 1,762 32.7% (62.9%)
KBR 5,891 (133) 18.88 2,725 90.9% 7.5%
GOVERNMENT SERVICES VALUATION AND M&A TRANSACTION DATA
STOCK PERFORMANCE AND TRADING MULTIPLES
AEROSPACE, DEFENSE & GOVERNMENT SERVICES
INDUSTRY UPDATE │ OCTOBER 2015
Government Services
Providers
GOVERNMENT SERVICES M&A ACTIVITY SELECT RECENT GOVERNMENT SERVICES M&A ACTIVITY
Enterprise Value > $50 million
Median: 9.4x
EV / Last Twelve Months EBITDA
7
Diversified Services – Heavy Government Exposure
Median: 9.1x
($ in millions)
NM
14
18
2223
15
2624
18
7
19
13
15.3x
9.9x
12.2x 11.9x
10.5x10.0x 11.1x
7.6x9.4x
10.0x
11.0x
-
2.0x
4.0x
6.0x
8.0x
10.0x
12.0x
14.0x
16.0x
18.0x
0
5
10
15
20
25
30
35
2005 2006 2007 2008 2009 2010 2011 2012 2013 2014 2015
Me
dia
n E
BITD
A M
ultip
le
Nu
mb
er o
f De
als
Strategic Financial
Announced
Date Target Subsegment Acquirer
Oct-15 AxiosIntelligence and Cyber
Security Serv icesLGS Innovations
Aug-15 SRA InternationalTechnology and Professional
Serv icesCSC
Aug-15 Novetta SoltutionsIntelligence and Cyber
Security Serv icesThe Carlyle Group
Aug-15 Salient Federal SolutionsTechnology and Professional
Serv icesCRGT
1
Jul-15 AlionTechnology and Professional
Serv icesVeritas Capital
Jul-15ManTech Cyber
Solutions International
Intelligence and Cyber
Security Serv icesCounterTack
Jun-15 Knowledge Consulting GroupIntelligence and Cyber
Security Serv icesManTech
Jun-15 STG GroupTechnology and Professional
Serv ices
Global Defense and National
Security Systems
May-15 Creative Computing SolutionsSoftware Information and
Serv ices
Triple-I
(DFW Capital Partners)
(1) Merger
NM
NM

Aerospace, Defense & Government
Services
PAGE |
HARRIS WILLIAMS & CO. OFFICE LOCATIONS
UNITED STATES EUROPE
BostonTwo International Place24th FloorBoston, Massachusetts 02110Phone: +1 (617) 482-7501
Cleveland1900 East 9th Street20th FloorCleveland, Ohio 44114Phone: +1 (216) 689-2400
Minneapolis222 South 9th StreetSuite 3350Minneapolis, Minnesota 55402Phone: +1 (612) 359-2700
Richmond (Headquarters)1001 Haxall Point9th FloorRichmond, Virginia 23219Phone: +1 (804) 648-0072
San Francisco575 Market Street31st FloorSan Francisco, California 94105Phone: +1 (415) 288-4260
FrankfurtBockenheimer Landstrasse 33-3560325 FrankfurtGermanyPhone: +49 069 3650638 00
London63 Brook StreetLondon W1K 4HS, EnglandPhone: +44 (0) 20 7518 8900
NETWORK OFFICES
Beijing
Hong Kong
Mumbai
New Delhi
Shanghai
Energy, Power & Infrastructure
IndustrialsHealthcare & Life Sciences
Transportation & Logistics
Business Services
Building Products & Materials
Technology, Media & Telecom
Specialty Distribution
ConsumerAerospace, Defense & Government
Services
Harris Williams & Co. has a broad range of industry expertise, which creates powerful opportunities.Our clients benefit from our deep-sector experience, integrated industry intelligence andcollaboration across the firm, and our commitment to learning what makes them unique. For moreinformation, visit our website.
OUR FIRM
AEROSPACE, DEFENSE & GOVERNMENT SERVICES
INDUSTRY UPDATE │ OCTOBER 2015
8
PAGE |
HARRIS WILLIAMS & CO.
AEROSPACE, DEFENSE & GOVERNMENT SERVICES
INDUSTRY UPDATE │ OCTOBER 2015
DISCLOSURES
9
Harris Williams & Co. (www.harriswilliams.com and www.harriswilliams.de) is a preeminent middle market investment bank focused on the advisoryneeds of clients worldwide. The firm has deep industry knowledge, global transaction expertise, and an unwavering commitment to excellence. HarrisWilliams & Co. provides sell-side and acquisition advisory, restructuring advisory, board advisory, private placements, and capital markets advisoryservices.
Harris Williams & Co. Ltd is a private limited company incorporated under English law having its registered office at 5th Floor, 6 St. Andrew Street,London EC4A 3AE, UK, registered with the Registrar of Companies for England and Wales under company number 7078852. Directors: Mr. ChristopherWilliams, Mr. Ned Valentine, Mr. Paul Poggi and Mr. Thierry Monjauze, authorised and regulated by the Financial Conduct Authority.
Harris Williams & Co. Ltd Niederlassung Frankfurt (German branch) is registered in the Commercial Register (Handelsregister) of the Local Court(Amtsgericht) of Frankfurt am Main, Germany, under registration number HRB 96687, having its business address at Bockenheimer Landstrasse 33-35,60325 Frankfurt am Main, Germany. Permanent Representative (Ständiger Vertreter) of the Branch Niederlassung: Mr. Jeffery H. Perkins.
The information and views contained in this report were prepared by Harris Williams & Co. (“Harris Williams”). It is not a research report, as such term isdefined by applicable law and regulations, and is provided for informational purposes only. It is not to be construed as an offer to buy or sell or asolicitation of an offer to buy or sell any financial instruments or to participate in any particular trading strategy. The information contained herein isbelieved by Harris Williams to be reliable, but Harris Williams makes no representation as to the accuracy or completeness of such information. HarrisWilliams and/or its affiliates may be market makers or specialists in, act as advisers or lenders to, have positions in and effect transactions in securitiesof companies mentioned herein and also may provide, may have provided, or may seek to provide investment banking services for thosecompanies. In addition, Harris Williams and/or its affiliates or their respective officers, directors and employees may hold long or short positions in thesecurities, options thereon or other related financial products of companies discussed herein. Opinions, estimates and projections in this reportconstitute Harris Williams’ judgment and are subject to change without notice. The financial instruments discussed in this report may not be suitable forall investors, and investors must make their own investment decisions using their own independent advisors as they believe necessary and based upontheir specific financial situations and investment objectives. Also, past performance is not necessarily indicative of future results. No part of this materialmay be copied or duplicated in any form or by any means, or redistributed, without Harris Williams’ prior written consent.
Copyright© 2015 Harris Williams & Co., all rights reserved.