Embed Size (px)
Citation preview

Aesthetically Designed Maps: Development and Perception
A Senior Project
Presented to
The Faculty of the Graphic Communication Department
California Polytechnic State University, San Luis Obispo
In partial fulfillment of the requirements for the degree
Bachelor of Science
By Catherine Wang
March 2014
© 2014 Catherine Wang

Table of Contents
Abstract ��������������������������������������������������������������������������������������������������������������������������������������������3
Chapter 1: Introduction ��������������������������������������������������������������������������������������������������������������������4
Problem Proposed ������������������������������������������������������������������������������������������������������������������4
Problem Significance �������������������������������������������������������������������������������������������������������������5
Continued interest in the problem �������������������������������������������� ��������������������������������������������5
Chapter 2: Research �������������������������������������������������������������������������������������������������������������������������7
Introduction ����������������������������� ���������������������������������������������������������������������������������������������7
Spatial Representation �����������������������������������������������������������������������������������������������������������8
Map Visualization ������������������������������������������������������������������������������������������������������������������9
Design Elements ������������������������������������������������������������������������������������������������������������������10
Clear Communication ����������������������������������������������������������������������������������������������������������11
Representation of Spatial Relationships ����������������������������������� ������������������������������������������13
How to Communicate with Maps ��������������������������������������������� ������������������������������������������14
Continuous Problem Solving �����������������������������������������������������������������������������������������������21
Chapter 3: Methodology ����������������������������������������������������������������������������������������������������������������22
Collecting Data ��������������������������������������������������������������������������������������������������������������������22
Analyzing the Data ��������������������������������������������������������������������������������������������������������������23
Chapter 4: Results ��������������������������������������������������������������������������������������������������������������������������24
General Background ������������������������������������������������������������������������������������������������������������24
Global Subway Patronage ���������������������������������������������������������������������������������������������������25
Value of Subway Maps ��������������������������������������������������������������������������������������������������������26
Research Ambiguities ����������������������������������������������������������������������������������������������������������29
Future Exploration ���������������������������������������������������������������������������������������������������������������30
Chapter 5: Conclusion ��������������������������������������������������������������������������������������������������������������������31
Reference List ��������������������������������������������������������������������������������������������������������������������������������33

Wang 3
Abstract
This research explored the creative element of subway map creation in light of its effectiveness�
Printed subway maps, used often for metropolitan cities and areas, are limited in physical
dimension and scale, carrying minimal information� The New York, San Francisco Bay Area,
Tokyo, Paris, London and Moscow subway maps highlight similar design and abstraction that
fulfill the basic necessary elements for subway patrons.
Over the years since the first metro map for each city was created, maps have become
more simplified by removing physical land features and reference points to make way for
expanding and new subway lines, stations, and transfer points� Thus, subway maps are more
aligned with diagrams that are more wayshowing than wayfinding as a response to network
expansion and a growing urban population� From inception to print, modern subway map
development has reduced spatial representation of reality, possibly affecting subway patron
map readability� Through focus on how design elements of subway maps have altered effective
perception of map comprehension, future designers will alter how to effectively communicate
visually to create a user-oriented experience�

Wang 4
Chapter 1: Introduction
Problem Proposed
Public transit maps present informational content in a visually understandable way� Transit
systems are not limited to just buses, taxis, trains, ferries, and rail services, but to subways as
well. Subways, also colloquially known as metros, in particular are a part of an extensive transit
network commonly found in areas or cities with a high population density� Oftentimes, subways
are found only in the metropolitan areas of major cities while others cover the central hub and the
extensive network beyond the city center, heading towards suburbs and less dense areas, farther
away from downtown� Generally, transit systems are a network that includes entry, travel, and
exit. Subways have developed the same system to quickly move from one location to another.
The appeal of subway maps caters to seasoned commuters, infrequent travelers, and
limited use or first-time patrons. Subway map design informs riders the direction of travel, where
the carriage is traveling, the stops it makes, and the overall relation of subway lines to stations
throughout the city� Population density and the number of subway lines and stations on the line
heavily influence the design of these maps. Maps are drawn with predefined dimensions and are
therefore subject to some level of distortion� This may not be necessary for digital devices that
transpose a literal map onto a screen� However, this paper focuses on the features and effects of
printed subway maps�
Lately, the design and look of contemporary subway maps are similarly designed to
compensate for the growth of the subway network in a dense urban city� Initially, many subway
maps involved hand-drawn illustrations to realistically represent location and distance as best
as possible� The movement towards a more organized approach began with the transformative
designs, set forth by Henry Beck and Massimo Vignelli, who designed the London Tube and
New York subway maps, respectively� Standardization of subway maps has been the focus of
many more modern maps� As cities continue to grow in population numbers and density, the
subway transit network has expanded and elongated in proportion to meet the needs of the city�
Wang 5
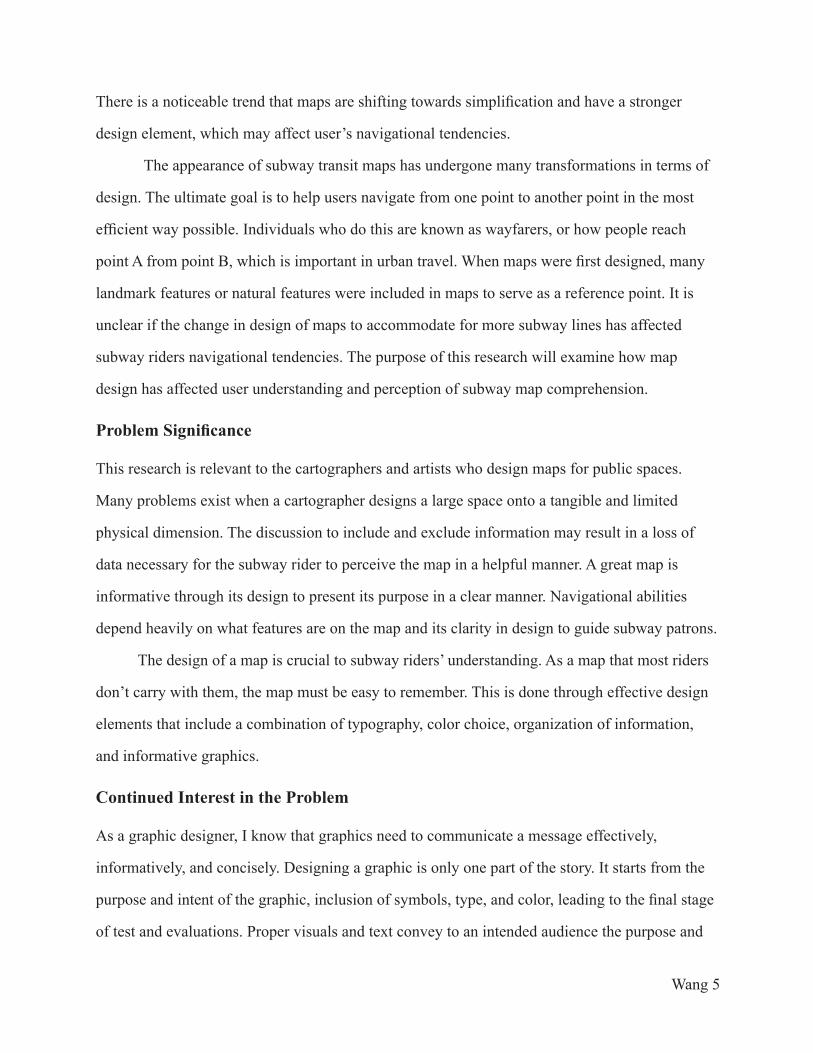
There is a noticeable trend that maps are shifting towards simplification and have a stronger
design element, which may affect user’s navigational tendencies�
The appearance of subway transit maps has undergone many transformations in terms of
design� The ultimate goal is to help users navigate from one point to another point in the most
efficient way possible. Individuals who do this are known as wayfarers, or how people reach
point A from point B, which is important in urban travel. When maps were first designed, many
landmark features or natural features were included in maps to serve as a reference point� It is
unclear if the change in design of maps to accommodate for more subway lines has affected
subway riders navigational tendencies� The purpose of this research will examine how map
design has affected user understanding and perception of subway map comprehension�
Problem Significance
This research is relevant to the cartographers and artists who design maps for public spaces�
Many problems exist when a cartographer designs a large space onto a tangible and limited
physical dimension� The discussion to include and exclude information may result in a loss of
data necessary for the subway rider to perceive the map in a helpful manner� A great map is
informative through its design to present its purpose in a clear manner� Navigational abilities
depend heavily on what features are on the map and its clarity in design to guide subway patrons�
The design of a map is crucial to subway riders’ understanding� As a map that most riders
don’t carry with them, the map must be easy to remember� This is done through effective design
elements that include a combination of typography, color choice, organization of information,
and informative graphics�
Continued Interest in the Problem
As a graphic designer, I know that graphics need to communicate a message effectively,
informatively, and concisely� Designing a graphic is only one part of the story� It starts from the
purpose and intent of the graphic, inclusion of symbols, type, and color, leading to the final stage
of test and evaluations� Proper visuals and text convey to an intended audience the purpose and

Wang 6
direction of the graphic� Before releasing a map to the public, cartographers consider what the
subway patrons are looking at and what kind of information they’re attempting to gather from it�
While I studied abroad in Shanghai, China for a school term, I took the metro frequently.
The maps were well organized and simple, deriving from the contemporary trend and acceptance
of eliminating as much as possible for simplification purposes. I was curious to see how other
subway maps have been designed� One enormous downside was the distortion of the map� In one
instance, I took a subway line because I thought it was close to a specific attraction and thought
it was within walking distance of the subway stop� In reality, there was a river blocking direct
passage� However, the attraction was much closer to a different line than the one I took� The
theory and development of a subway map is designed and how other people perceive subway
maps has intrigued me since�

Wang 7
Chapter 2: Research
Introduction
The creation and use of printed maps continues to be important for navigational use, especially
in an urban transportation network� Generally, metropolitan cities offer many modes of public
transportation, including trains, buses, and subways� Subway maps are the collaboration and
consensus of designers, geographers, city planners, and map publishers, who translate the three-
dimensional reality onto a two-dimensional planar representation of the network below ground�
Subway map design depends on the content and information to help navigate users and on how
the visual pleasure and sensibility to properly interpret the map as a graphic element� Whether
riders are seasoned commuters or are riding the subway for the first time, all of them at one point
used the subway map as a reference�
Although many subway users carry digital devices that have applications that aid them
in finding their way around or directing them to their next destination, subway maps are still
a necessary visual graphic. The investigation of proper and efficient and effective design of
subway maps continues to be developed� Contemporary subway map development stemmed
from Henry Beck’s London Tube map, further transformed by Massimo Vignelli’s New York
City subway map. With the simplification of maps to fit the growing network of subway lines in
a metropolitan city, the general design of maps is in its transformative process to find the best
formula for what has been referred to as a directional diagram�
Subway maps exist both as an art piece and as a cartographic piece� As an art piece, it
bridges the geography of the place with land forms like seas, rivers, and parks, whose features
are integrated into maps to aid the user to better understand the perspective and relative distance
of subway lines from other landmarks� Art is a “human interpretation of senses, feelings,
emotions, and understanding of phenomena, view of reality, and other experiential elements”
(Fairbairn, 2009, p� 24)� The artistic element accentuates the visual draw and appeal of a
map� Most designers consider subway maps as diagrams because maps represent geography�

Wang 8
Diagrams are a structural element that focuses less on topographical features (Mollerup, 2005,
p� 153)� Users of a subway are not just drawn to its functionality, but to view the map as a visual
interpretation and perspective of something tangible�
Maps have functionality, but the beauty draws people in to absorb the context of the
purpose of the map� Ortag (2009) suggests that a map carries a utilitarian function, but when
maps take aesthetics into account, the map’s visual appearance and meaning are much more
significant (p. 123). The space becomes more appealing and engages users in a new level.
When maps have beauty and appeal, people inspect the map more closely� This design does not
guarantee that a map is correct or functional; it promotes a closer inspection of its beauty to
attract people to see and use the map�
Additionally, maps use data objectively to represent space� The scope of a map and the
medium of the map limits how close to reality the map will be� Cartography was never intended
to represent reality as an illusion or to reflect reality, though (Fairbairn, 209, p. 24).
Although art and cartography are two wholly different and exclusive terms, they both
bring the scope of maps together� Both perspectives are dependent on the visual interpretation of
the person who is viewing the map�
Spatial Representation
Maps are designed to be a spatial representation of reality� The visual information is collected
and sent through the optic nerves into the primary visual cortex for visual input processing
in the brain� Cartography is a representation of structure and assumes basic cognition and
understanding when attempting to understand information communication (Kriz, 2009, p� 59)�
The influx of stimuli comes not only from the environment surrounding the subway map, but
the focus on the map specifically, provokes more relationships and connections in the brain to
understand the map� A map’s interpretation is dependent on whether the map communicates
effectively or not�
Cartographers and designers conceptualize the final product based on the content. Subway
patrons exist in three stages: entering the station, traveling to the next, and exiting the station�

Wang 9
Distinguishing which stage the rider is at informs the map designers what elements are necessary
to include in the map� Map developers must also consider how the end-user will understand
a visual interpretation of space. This can be explained as wayfinding, or using the map as a
solution to solve a problem� Mollerup suggests that subway maps should be wayshowing, or
“facilitating wayfinding.” Wayshowing is the means; wayfinding is the end” (Mollerup, 2005, p.
11)� It is a direct communication between the senders (map designers) and the receivers (subway
riders)� Drawing a map while incorporating how a user will interact and experience the map
reveals the importance of focusing on the user, who will be viewing the map�
Map Visualization
Cartographers and designers draw up maps to depict important information and the visual
interpretation must make sense to people beyond the development team� Jobst (2009) stated
that “graphical coding… leads to the abstraction process in the brain, which is relevant for
the interpretation and visual reproduction of space (p� 44)� Maps serve to transmit physical
landforms onto a flat dimension. To understand subway maps, key qualities of effective maps
must take into account colors chosen, a legend or key to explain the symbol’s meaning and how a
user can identify their current position and figure out where to go next.
The New York City subway map, for example, has gone through several transformations
to increase effective interpretation along with the addition of new lines and contemporary colors
Left. 1939 Version of the New York Subway (Transportation). Right. Vignelli’s 1972 subway design (Transportation).

Wang 10
and design� The 1939 version included many geographical elements that served as a reference
point even though the subway was built underground, in addition to the subway lines� The
placement of subway lines below ground were an information overload of the above ground
map, complains Massimo Vignelli, designer of the iconic 1972 New York City subway map
(Transportation 2012)� He observes that the other maps are fragmented and have unnecessary
elements that do not contribute to the overall ease of reading maps� His subway diagram is often
praised for its bold colors and strong typefaces�
Design Elements
The design of subway maps relies heavily on typography and color� Mollerup (2005) describes
that the typeface has functional demands, where it must be instantly readable to the numerous
people who ride the subway� The typeface needs familiarity, and must carry a strong distinction
between letters and numbers (129)�
Color is also an essential element to distinguish between the numerous subway lines�
The San Francisco Bay Area Rapid Transit (BART) has five distinct colors to differentiate the
lines� BART uses a has pattern to show that the Milbrae to San Francisco International Airport
section has a different time schedule than the rest of the lines� In contrast, the Tokyo subway has
thirteen colored lines with an additional five lines to represent rail lines and private railways.
Left. San Francisco BART map (San Francisco)� Bottom. Tokyo Metro map (Tokyo)�

Wang 11
The color contrast helps subway patrons to differentiate between the different lines� The Natural
Color System “allows designers to define three distinct types of color contrast, a contrast in
hue, a contrast in chromaticness, and a contrast in brightness” (2005, p� 165)� For subways that
have numerous lines, offering visibly distinctly different colors and patterns are essential for
understanding maps. Those who are color-blind also benefit from the color contrast.
With many facets to consider, subway map development can be daunting� Many creators
struggle with how much information to present and how to modify the graphics to conform to
understandable features that will not be lost in translation� Fairbairn (2009) adds that “real-world
features are generalized and symbolized, and there is no attempt to give a feeling of immersion,
and the viewer’s perception is challenged by the symbolized representation which results from
the cartographer’s creativity.” (p. 25). The simplification of maps has possibly resulted in
individual speculation of what the map means to each user�
Clear Communication
Indeed, it is inevitable that maps are reduced and simplified. Maps “to some degree are
generalizations, as it is impossible to represent on a map all features from the real world, no
matter what the scale” (“Thematic Cartography,” 2009, p. 17). The question is to which extent
a map is simplified. The general abstraction is required to present the necessary information
without distraction from other unneeded elements� Inclusion of everything detracts from
the focus and point of a map and is a poor way to use the space provided to create a clear
understandable map�
Subway maps must undergo some simplification in order to help users visualize and
understand what they are looking at. The simplification of subway maps makes it practical
and easier to understand and visually translate. When Vignelli’s map was first released, many
New York citizens and subway users were enraged that it didn’t realistically represent the New
York space above ground. Instead, Vignelli “sacrificed geographical accuracy for clarity by
reinterpreting New York’s tangled labyrinth of subway lines as a neat diagram” (Rawsthorn,
2012)� This form of geo-communication is crucial to understand how to travel from point A to

Wang 12
point B. This form of geo-communication supported the argument for simplified maps. The most
defining measure and success of map design is successfully determining how to travel from point
A to point B
As with most maps, cartographers are not available to explain a map’s meaning to
whoever is looking at it� The physical map must be able to visually communicate the designer’s
intentions and choices in features and design to produce an understandable map. Kriz defines
visual communication by the “ability to understand and use symbols, graphics, maps, and plans”
as graphicacy (2009, p� 60)� Inclusion of thematic information to represent stations, subway
lines, and subway interchanges without omitting other information is vital to map development
and serves as an important guideline for cartographers� The visual symbols must make sense to
the user whether they are locals or not, preventing patrons from going in the wrong direction or
reaching the destination because the map was misleading�
Maps are a representation of culture and of the designer’s signature of the era that it was
created in� The design represents what the designers valued and considered important� Each
era has distinguishable characteristics that are representative of that moment. The first official
subway transit map of Paris was black and white with solid dots for stations� The dual colors
represent the lack of printed color presses at the time� Instead, the map displayed different line
patterns� The city of Paris approved the map in 1899� In 1914, Au Bon Marché, a department
Left. 1898 Paris Metro Map (Sandmarg)� Right. 1913 Paris Metro Map (Sandmarg)�

Wang 13
store, issued a colorful version of the subway map� This represents the printing technology where
the color was achieved by “running the same piece of paper through at least five rollers — a
labor-intensive process” that the store though was worth paying for (Ovenden, 2009, p� 41)� This
version also showed the shading of suburbs outside the city walls, which sent a precedent for
future map designs� In 1940, the map showed lines as one solid color� Many of the lines were
shut down during German occupation in World War II, turning some of the stations into factories
and air-raid shelters� On the back of the map was a list of stations for these shelters� What may
have once been visually appealing in a map changes over time� Not all beauty will transcend
through the ages, though its best aspects will be included in future designs�
Representation of Spatial Relationships
To fully utilize a map, its functionality and design are combined to form a visual that is engaging
and captivating all while providing navigational uses� A well designed map has the
Evidently, many aspects and characteristics of design are necessary to develop a map
that appeals to the public as much as possible� A map’s essential parts can be reduced down to a
well-organized composition of points, lines, and space� In the subway transit system, it is up to
the designer and cartographer to utilize the space to incorporate all the subway lines and stops�
If several cartographers were given the same guidelines and information to design a map, they
would all develop and design different maps� Taking into account a transit rider’s journey from
entering the station, heading to the train, and leaving the station affects the overall design of the
map� Focusing on the patrons who use the map are a key factor in map organization�
Map interpretation, left to the user, introduces different backgrounds and notions and
comprehension. The subway rider has the flexibility and freedom to view the map individually
“highest possible accuracy in respect to map scale, good geometric significance, good
characterization of shapes, highest possible clearness and good readability, simplicity and
clearness of graphic expression and finally, as sum of all these qualities, a special kind of
beauty which is inherent to a map” (Ortag, 2009, p� 123)�

Wang 14
as they see best (Kriz, 2009, p� 62)� The visual input is the same, but the connections derived
from previous map viewing experience and connecting the visual information may vary� Some
users may be stronger in visual interpretation and spatially making relationships between subway
stops and lines. Others may view the maps based on efficiency in time. Variable factors of
alternate route, elapsed time, price, stations stopped at, and neighborhood crossings all affect
route determination� This depends on the map for wayshowing purposes� A rider undergoes three
phases: “search, decision, and motion” (Mollerup, 2005, p� 27)� Their journey is complete when
they have succesfully solved a navigational isue� Subway patrons relied on their afferent and
efferent sensory channels that translate the input to locomotion to head in the right direction� Not
everyone viewing the graphic derives the same information� Either from experience or judgment,
users look at maps differently for their own reasons and purpose�
How to Communicate with Maps
Maps, when designed with function, purpose, and beauty in mind, vary in interpretation� Map
communication, can be summarized in several steps:
1� Consider what the real-world distribution will look like
2� Determine the purpose of the map and who the intended audience is
3� Collect data appropriate for the map’s purpose
4� Design and construct the map
5� Determine whether users found the map useful and informative
6� Repeat steps 4-5 as necessary (“Thematic Cartography”, 2009, p� 5)
Step one begins with the end result in mind� Subway maps are generally printed on large
poster formats to be easily readable from afar and from up close� Maps are also printed on fold-
out pamphlets and inside subway carriages� A successful map “design begins with knowing
why the map is being made” (Brewer, 2005, p� 4)� Knowing how the design will be presented is
essential in any project� Developments for web and mobile vary drastically with map projects
developed for print� Maps are generally designed every several years to account for new lines, so
each new design must incorporate existing lines, stops, and an update in artwork, if appropriate�

Wang 15
Step two discusses what users should take away after looking at the map� Map design
affects wayshowing abilities� Involving the audience and incorporating the purpose of the map
influences how a rider finds a solution to their problem. Thus, a traveler’s capacities and map
graphicacy helps them reach their destination� The map must be enough for all sorts of patrons
and must be understood in a brief enough time so that they can move on to their destination
(Bender, 2005, p� 4)� The design is irrelevant if the user does not understand how to use the map
to continue their journey�
Collecting data is vital for map design� Evaluating the maps by looking for ways to
improve ensures that the subway map will be helpful� Actively involving “transit users in the
design process” (Bain, 2010, p� 5) develops a map that is more user-oriented and user-friendly�
Numerous people voiced their complaints when Vignelli revealed his redesign of the New York
City subway map; the public is heavily interested in subway transit systems and maps�
Most designers of transportation network subway maps have standardized station
indicators, station names, transfer points, subway lines, and subway line indications, establishing
these as the basic essentials for developing a functional subway map� Subway line sizes are
proportioned to show “line widths that represent differences in data values” (brewer, 20005, p�
153)� Elements that are important will be the guiding point for map interpretation and guidance�
Not all the details are included on the map; otherwise it would take up too much space and
detract from the focus of the map�
The development of maps is never accurate. The difficulty of map design lies in
the superimposition of the subway lines and stations� A lot of subway maps have removed
numerous features and extraneous details to accommodate for the subway lines and stops�
The simplification of the maps is not focused on objective reasoning. Instead, subjective
reasoning guides the map designer to interpret the information as they best see fit. It is their
responsibility to portray the values and data in a meaningful way that adds value to the viewing
experience for the subway rider. The two types of generalization fall under 1) simplification
and 2) amplification. Simplification removes information that detracts attention away from the

Wang 16
original purpose of the map, keeping only the essential parts� Removal of information keeps the
map simple and spacious� A map, when reduced to only its basic elements, is generally sparse
in detail. However, the details that have high value are amplified for map readability (Slocum,
2009, p� 98)� These decisions tend to result in a map’s unusual proportions, but, if designed well,
it should still make sense to any subway rider�
The London Underground map is a prime example of how the designer solved the
simplification problem. The map, as described by Garfield is “a circuit board of connections and
directions with no real-life obstacles in its way” (2013, p� 307)� Henry Beck, the designer of
the 1931 diagram, drew inspiration
from an electronic circuit board�
The map had a problem of trying
to superimpose the real track routes
onto paper while accommodating for
the scale of other routes� Seeing the
original, disorganized map resulted
in Beck’s decision to represent the
subway lines as circuits for map
design, which paved the way for
future designs in London and cities
throughout the world� The circuit
diagram was simple and it inspired
many future diagram developers�
Roberts, a psychology lecturer and
map aficionado, came up with some
terms that describe the best, most
effective communicating maps:
“simplicity, coherence, balance, Top. Henry Beck’s 1931 version of the London Underground� Bottom. The current London Tube map (London)�

Wang 17
harmony, and topography” (Garfield, 2013, p. 308). Not all maps incorporate the topographic
element, but if the map includes all the other facets, then the map design is more clearly
understood and well–presented�
Before public release, maps are tested on random individuals� A map’s success depends
on the subway patron’s wayfinding ability to understand the information for functional use. In
most cases, the visual impact of a map is instantaneous� In the moments of map viewing, several
neural processes come together to develop the understanding of the relationship on the map� Just
as graphics speak for themselves about their design and function, maps do the same, leaving the
viewer’s perception to be challenged by the representation from the cartographer’s creativity
(Fairbairn, 2009, p� 25)� By representing space, a map is a useful reference for people to spatially
think about their location to orient themselves to proceed to their next destination�
Despite an original intent to create the most effective map, no maps are created right on
the first try. Repeats of map construction and re-design and testing of subjects are necessary so
that people of varying backgrounds understand the map�
Similarly, the Moscow subway
map has undergone transformations to
accommodate for new subway lines and
stations. One of the first offical maps created
for the subway in 1947 included major roads
major transportation hubs, pictographic
representations of the major points of
interests in Moscow and a legend off to
the side. This generic map was uniquely
descriptive of Moscow�
Twenty years later in 1947, the new
map introduced color and a more abstract
demarcation of subway lines� New transfer Above� Moscow’s subway map in 1947 (Bigman)�

Wang 18
points were added to the growing number
of subway lines as stations were added� The
new map excluded famous points of interest
and a legend� To improve user experience
and for simplification, the cartographer
enhanced spatial distance from an aerial
perspective�
Just three years later, the scalability of
the map changed� Instead of an undulating
circle representing the turns in the line, map
illustrators replaced it with a perfect circle�
Moreover, the dots were replaced by x-spots,
signifying the location of transfer points�
The subway lines became straight and had
fewer waves, and the soft circle offsets the
hard, angled lines� Start and end point labels
were also added to the lines� This matches
with what Shaw proposed for the New York
City subway map: “It is that the locations of
some stations are geographically incorrect
and that of others misleading in relation to
their physical presence” (Challand 2010)�
Nine years later, the map retained
much of what was previously drawn� The
new map accommodated more station stops
and introduced a new form of symbolism�
Stations were labeled with a curved rectangle�
Top� Moscow subway map in 1967 (Bigman)�Center. Moscow subway map in 1970 (Bigman)� Bottom. Moscow subway map in 1979 (Bigman)�

Wang 19
Most notably in another new map, closed
circles were chosen to represent station stops
and interchanges for transfer points instead
of open circles�
Yet, eleven years later in 1990,
the entire scope of the map changed�
The map no longer looked like the 1947
rendition� Moscow’s population had risen
to approximately 9 million, accounting for
the large urban circle� Thus, the circle’s
diameter increased in size to accommodate
for the many more transfer points within the
central hub of Moscow� Massimo Vignelli
believes that most maps are more cluttered
“because [designers] want to put too much
information that doesn’t belong in the
diagram (Challand 2010)� Also, the Moscow
map seemed to represent a more simplified
version of the times� The 1947 showcased
the styles of that era, but the 1990 map
pushes that boundary by incorporating
distinct colors, print paper, and font
selection�
Just recently, Moscow unveiled yet
another version of the map� This current
map retains the perfect circle and the angles
of the subway lines� By pushing for design, Top� Moscow’s subway map in 1990 (Bigman)� Bottom. In 2013 (Bigman)�

Wang 20
this new map developed new symbols
for station and transfer lines, added more
vibrant colors, and even reincorporated the
river running through the city as seen in
the first map. “A map is — as any graphic
representation — a composition of points,
lines, and areas” (Ortag, 2005, p� 125)�
The new map adds subway line numbers
to reduce confusion� These transformations
have simplified the map so much that a lot
of the features have affected the scalability
and representation� When subway riders
travel from point A to point B, the distance
traveled may be skewed and the duration of
the ride is unknown� The goal of a map is
not to confuse readers, but to aid them in spatially understanding the subway network�
When looking at the urban layout of Moscow, it is easy to notice that there is a central
hub for the city� As Moscow grew and as artistic eras passed, the design of the map catured the
current mood and growth, highlighting the significance of the Soviet Union, bringing Soviet art
and strength to the attention of the public nationally and internationally, until its end in 1991�
Ulimately, graphic design is based on the “social dimension, which illustrates the influence
of culture, society, and mass-media” (Jobst, 2005, p� 47)� The circle represents not only the
centrality of the city, but also the dense location of government buildings and administrative
offices. This layout may have been placed strategically when the city experienced its greatest
growth, but having a central hub illustrates the importance to Moscow citizens and serves as a
reference point� When subway riders look at the subway map, they see the design focusing on the
social dimension, which illustrates the influence of culture and customs on the map.
Above� Latest proposed idea for a map update to the Moscow Metro (Bigman)�
Wang 21
Continuous Problem Solving
Evidently, maps have progressed and adapted to the design of the times over the years� Although
the digital era has arrived, the use of maps has not waned� Subway maps are of importance to the
metropolitan cities who have built a nearly endless network of lines to transport riders from one
place to another� Although it is a means of transportation, people riding the subway depend on
wdiagrammatic maps� It is important to focus on the overall intention of the map: its purpose and
design�
Visual communication will always remain a challenge to cartographers, no matter
what they design� They will have to decide whether to draw realistically or schematically in a
simplified, generalized form. It is essential to understand geo-communication because not every
map communicates effectively� The relationship between the map designer and the end-user is
useful in ascertaining that the subway map caters to people’s needs�

Wang 22
Chapter 3: Methodology
The progression in the design of subway maps has changed dramatically� The purpose of this
study was to determine if the simplification and design of contemporary subway maps found in
metropolitan cities affected user’s navigational preferences� The transformation and development
of subway maps has increased in complexity as cities increase in population density and expand,
calling for the addition of the development of a complex transportation network system� If this
development has created confusion, then the design and creation of subway maps requires further
investigation to pinpoint the source of subway riders’ misunderstanding� The objective of this
study determined people’s perception of the design of subway maps in relation to their individual
navigational skills�
Collecting Data
The design of metropolitan subway maps varies from city to city� A survey was conducted
to random individuals to best gather more information about people’s views of national and
international subway maps as guides and as a graphical design element� The survey was
shortened to increase response rate and was divided into four sections�
The first started with several introductory demographic questions to establish the basis
of the characteristics of the participants of the survey. The preliminary question of “Have you
used a subway before” established the survey respondent’s credibility in the process of viewing a
subway map as a tool to help them head towards their destination�
After establishing the overall general demographics of the participants, the second section
included fill-in-the-blank questions regarding where they’ve used the subway and why they took
the subway� Participants were also asked where they have used the subway to gather a basic
understanding of the different types of metropolitan areas and maps they have been exposed to�
The following section involved ranking several statements about the design of subway
maps and any related problems� The ranking system was based on agreeableness, ranging from
strongly disagree to strongly agree�

Wang 23
To end, the survey respondent was given the chance to explain what they thought of
subways and additional comments that they felt the survey did not address�
Analyzing the Data
After data collection, the results from the survey were graphed and noted� Personal determinants
like name, if given, were excluded from the results of the study� The survey data was used to
collect user’s opinions on the design of contemporary subway maps, to determine the influence
of subway map design, and to bring forth any issues that subway patrons may face�
Wang 24
Chapter 4: Results
General Background
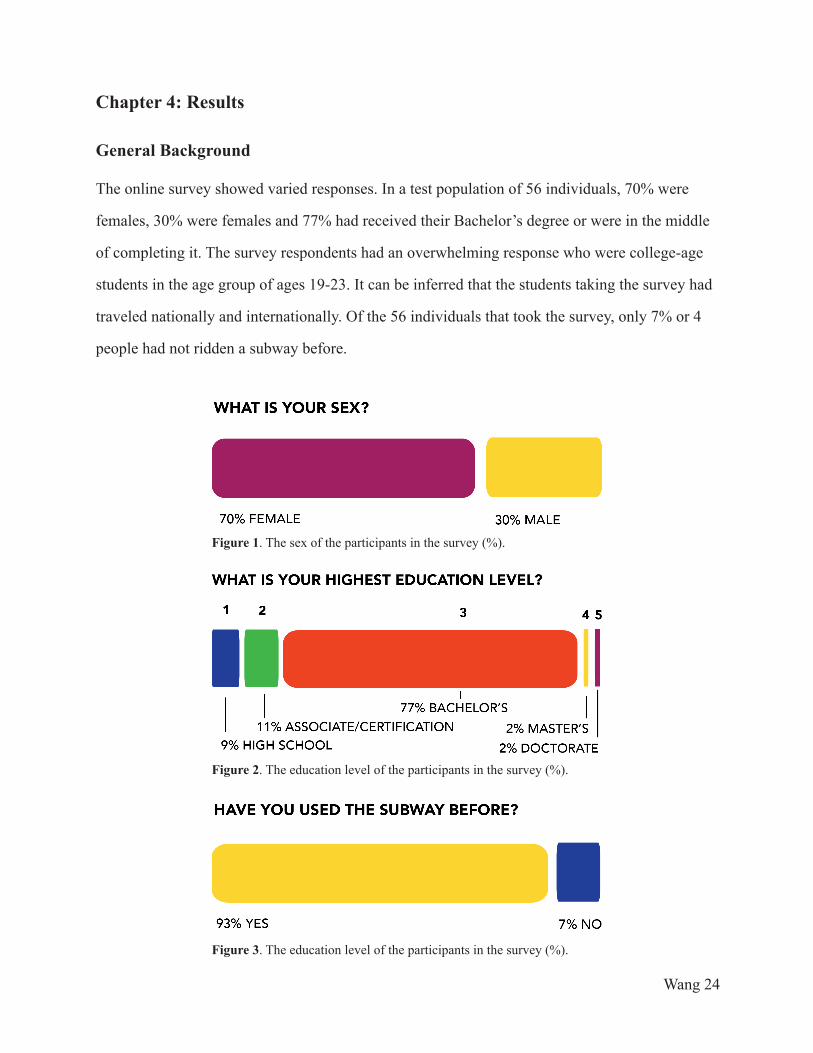
The online survey showed varied responses� In a test population of 56 individuals, 70% were
females, 30% were females and 77% had received their Bachelor’s degree or were in the middle
of completing it� The survey respondents had an overwhelming response who were college-age
students in the age group of ages 19-23� It can be inferred that the students taking the survey had
traveled nationally and internationally� Of the 56 individuals that took the survey, only 7% or 4
people had not ridden a subway before�
Figure 1� The sex of the participants in the survey (%)�
Figure 2� The education level of the participants in the survey (%)�
Figure 3� The education level of the participants in the survey (%)�

Wang 25
Global Subway Patronage
In the question that asked where the survey participants have ridden the subway, over 70% of
the participants have ridden the BART system in the San Francisco Bay Area, 38% have ridden
the New York Metro, 29% have ridden the London Tube, 13% have ridden the Paris Metro,
11% have ridden the Los Angeles Metro and 9% have ridden the metro in Washington D�C�
These were the top 5 highest numbers for metros ridden in the United States� A few notable
international cities made the top ten list as well� London rounded out at 30% and Paris was 13%�
The next most common subways with a noticeable ridership were the metro in Tokyo (7%),
Germany (5%), and Italy (5%)� It is important to consider that some people have ridden more
than one type of subway and their experience was counted more than once in the percentages�
The variable locations proved to be valuable when considering the nature of subways and map
designs represented in many parts of the world�
Figure 4� This Mercator projection of the world lists the locations that people have taken the subway in� Respondents have traveled around the world and have experienced an international view of different subway maps� The cities listed in each section are ranked by the number of people have ridden that subway�

Wang 26
Value of Subway Maps
The following section in the survey asked survey participants to rank several statements on a
ranking scale� 1 for strongly disagreed with 5 being the highest agreeableness value�
The first question asked participants to rank their ability to read maps. The term maps (in
general) was left vague and up to interpretation� Some may have interpreted it as a AAA map
for a road trip, an atlas, a map at a shopping mall, or even a map on a digital device� Many were
confident in their abilities, whether it was through assisted GPS or thinking spatially about maps.
There was no doubt that nearly all of the participants could read a map� It was interesting to note
that 4 of the 56 people had little to no ability to read maps�
Interestingly, their confidence in ability to read subway maps shifted towards a neutral
attitude� 6 people strongly agreed in their ease of use and 3 people strongly disagreed� There
is possible variation on this question based on people’s abilities to read maps. It is uncertain
whether certain subway city maps were easier to read than others, only that subway maps are
not completely easy to use and read. It is a possibility that at first glance, looking at a subway
map may be crowded to try to fit all of the subway lines on a physically limiting dimension.
A participant did note that the London Tube map was one of the easier to read, which hails to
Henry Beck’s design that simulates an electric circuit board�
Figure 5� The number of participants (%) who ranked their own ability to read maps of all kinds�

Wang 27
In contrast, though a lot of people believed that subway maps are not that easy to use, they
do not believe that they are misleading� 26 (46%) of the participants disagreed, saying that maps
are not misleading� The term misleading was used as an overall term describing any confusion in
interpreting the map, determining its scale, its proportion and relative understanding of different
subway lines, interchange points and other factors that affect map comprehension� Two people
were certain that subway maps are very misleading�
In consideration of the design of maps, an overwhelming response indicated that the
colors used to differentiate subway lines on subway map make it easy to read� A participant
noted that using solid colors was a lot more useful than using line patterns such as crosshatches,
dotted lines, etc� A singular solid colored line, used by nearly all subway transit maps around the
Figure 6� The number of participants (%) who believe that subway maps are easy to use�
Figure 7� The number of participants (%) who believe that subway maps are misleading�

Wang 28
world, proves to be effective in increasing map comprehension� The few that disagreed noted
that sometimes maps have too many colors and sometimes a light–colored version would not be
easy to differentiate between another line that also uses a light color� They did not propose any
alternatives for color use or indicate that some colors may clash on the map�
A similar amount of people who answered that subway maps are easy to use also answered
that subway maps are well designed� 11 disagreed, 25 agreed, and 20 people (36%) were divided
or had neutral feelings about the design of the map� It is possible that these subway patrons
remember the vivid use of colors in the maps but do not remember what the subway map looks
like� It is also understandable if they agree that maps are not misleading, but do know what
factors of a subway map may increase the overall acceptance of a design of a map� Nor do they
Figure 8� The number of participants (%) who believe that including colors in subway maps and lines are helpful when reading the map
Figure 9� The number of participants (%) who believe that maps, as they are, are well-designed

Wang 29
know that a lot of the information provided on the maps is required for people with handicaps
and to provide a general design for the general public, not just a certain demographic of the
population�
One of the caveats of the survey was that survey respondents were asked to rely on their
memory and experience from subway maps they have seen before and viewed� Participants were
not shown images of subway maps for the survey� It would take a lot of time to put together a
survey that included many of the popular subway maps� Even still, not all the participants have
been on the same transit system and do not have experience viewing the map and navigating
their way from the entrance to the train to the exit� Some may even be seeing the map for the
first time and will have biased arguments because they are unfamiliar with the map, relative
to someone who has been to the city before and used the subway before, giving them the full
immersive experience in understanding the subway map significantly better than someone who
has not seen the map before at all�
Research Ambiguities
There was a question regarding where they have taken the subway. Some responded with cities
while others responded with countries� If there was a city and a country listed, it was lumped
into the country� For example, if somebody was on the metro in Paris and another person listed
France as a place they took the subway, the vote for Paris would be counted only for France, not
Paris and France�
A question that was included in the study “Have you ever gotten lost on the subway
before” was omitted from the results� This was also a rank based on disagreement or agreement�
A better way to gather responses would be a simple response of Yes or No� When participants
ranked how lost they were, it was a matter of opinion. There was also no significance in any of
the answers, suggesting a poorly asked question.
Many of the responses relied on personal experience and how they used the subway�
With different perspectives on the function of the map, whether it played a large role or an
insignificant role, participants may not view the map as more than a utilitarian piece. A few

Wang 30
participants understood that the goal of the study was to determine the powerful impact of the
design of subway maps, noting that the London Underground was designed well�
Future Exploration
Further studies may include asking participants to rank subway maps based on color,
design, organization, and ease of use. The rank question, “Subway maps are well designed”
could be a branch for further investigation� Determining what factors increase the design of
subway could be useful for subway map artists� Also displaying a picture of a subway map, such
as the one used in Paris, would serve as a reference point for people to comment on what makes
the map user-friendly and helpful�

Wang 31
Chapter 5: Conclusion
The design and development of printed subway transit maps continues to transform through the
ages� Subways are generally found in largely populated dense cities� As these cities grow, more
subway lines are added, resulting in a change in the overall design of the map� As seen with the
maps in London, New York, and Moscow, the maps have increased in simplification and removal
of topographical features while retaining most of the strong elements that subway patrons are
familiar with�
In addition, colors play a strong role in the map navigational process to enhance and
promote faster, more efficient navigational comprehension. Both the BART system in the
San Francisco Bay Area and the Tokyo metro system, the use of colors and patterns increased
contrast and visibility for map reading� An overwhelming number of survey participants agreed
that the use of colors on subway maps promotes readability of the different subway lines, stating
that subway maps in general are not misleading�
There were some inconsistencies that warrant further research and explanation� Although
color was stated as beneficial to aid map reading, most of the participants are split on the design
of subway maps� This paper focused its research on color in relation to readability and the
transformation of maps for simplification purposes, not what contributes to a strong map. It is
possible that the participants of the survey do not know how to graphically make the maps more
appealing�
Many who have taken the London Underground praise its map design� Much of their
appreciation can be attributed to Henry Beck and the influence of Massimo Vignelli, both whom
developed what became known as a diagram�
Some people who are strong in map reading suggested that the “platform to be on is more
confusing than the actual map,” which concerns signage design and development issues, not
necessarily navigational issues�
Another commented that “subway maps are easy to use once you get to know the area,
[although] at initial glance, it may be overwhelming� However, once you get to know the area,

Wang 32
it is very simple to use and then it eventually becomes unnecessary.” By this point, frequent
subway patrons have developed a mental map of which lines meet at interchanges and the overall
unfamiliarity of the map disappears�
Another question tangentially relevant to the study of subway map use and design asked
why people would prefer using the subways� Most responded that subways were fast, reduced
commute time, was more environmentally friendly, and reliable�
Further more, the simplification of maps is also visible in airports that handle numerous
international travelers� Their maps are also limited to sign posts and physical dimensions� They
use graphics and are type-intensive that may affect readability� Although these maps do not have
as many crossing lines, like the Tokyo Metro, these maps use color, space, and typography to
promote readability�
Interestingly enough, electronic maps and guides are gaining visiblity in stations,
reducing the possible need for printed transit maps� People use smart phones to download the
maps or applications that inform them which route to take and also shows the schedule for the
system� Digital technology allows for more design, content input, and development, although
screen size may be an issue� Reliability on digital devices to do the thinking may alter people’s
hippocampus for developing a mental map and cognition in navigation�
The investigation of maps has been a rewarding experience� The topic was interesting
to explore because some people who are not able to read maps well have varying levels with
reading subway maps� I can read maps very well and have no trouble reading subway maps� I do
agree with some of the participants that at first, the map has too much information and has too
many colors to demarcate the different lines, but frequent use and a developing cognition of the
familiarity of different subway lines, stations, interchanges, and the overall layout of the subway
network, makes the subway even more pleasing to ride on�

Wang 33
Reference List
Bain, P� (2010)� Aspects of Transit Map Design� Parsons Journal for Information Mapping,
Volume 2 (Issue 3) �http://piim�newschool�edu/journal/issues/2010/03/
Berry, I� & Bender, S� (2001)� The world according to the newest and most exact observations:
mapping art + science� Saratoga Springs, New York�: Distributed Art Publishers
Bigman, A� (4 June 2013)� Massive impact design: the worlds’ subway maps� [Graphic]
Retrieved from http://99designs�com/designer-blog/2013/06/04/the-worlds-subway-maps/
Brewer, C� (2005)� Designing Better Maps: A guide for GIS users� Redlands, California: ESRI
Press� Challand, Skylar� (2 September 2010)� Designing a Better Subway Map� [Web log
comment]� Retrieved from http://idsgn�org/posts/designing-a-better-subway-map/
Fairbairn, D� (2009)� Rejecting Illusionism: Transforming Space into Maps and into Art� In W�
Cartwright, G� Gartner, & A� Lehn (Eds�), Cartography and Art: Lecture Notes in
Geoinformation and Cartography� (pp� 23-34)� Springer�
Friedmannová, Lucie� (2009)� What Can We Learn from the Masters? Color Schemas on
Paintings as the Source for Color Ranges Applicable in Cartography� In W� Cartwright,
G� Gartner, & A� Lehn (Eds�), Cartography and Art: Lecture Notes in Geoinformation
and Cartography� (pp� 23-34)� Springer�
Garfield, S. (2013). On the Map: A Mind-Expanding Exploration of the Way the World Looks.
New York, New York: Gotham Books�
Jobst, M� (2009)� Marriage and Divorce: Is the Evolution of Landscape Paintings Ending in the
fields of Topographic Cartography and Graphic Design? In W. Cartwright, G. Gartner, &
A� Lehn (Eds�), Cartography and Art: Lecture Notes in Geoinformation and Cartography
(pp� 43-56)� Springer�
Kriz, K� (2009)� Are we Living in a Cartographic Illiterate Society? In W� Cartwright, G�
Gartner, & A� Lehn (Eds�), Cartography and Art: Lecture Notes in Geoinformation and
Cartography� (pp� 59-68)� Springer�
Mollerup, P� (2005)� Wayshowing: A Guide to Environmental Signage Principles & Practices

Wang 34
Italy: Lars Müller Publishers�
Ortag, F� (2009)� Variables of Aesthetics in Maps� In W� Cartwright, G� Gartner, & A� Lehn
(Eds�), Cartography and Art: Lecture Notes in Geoinformation and Cartography� (pp�
59-68)� Springer�
Ovenden, M� (2009)� Paris Underground: The Maps, Stations, and Design of the Métro� New
York: Penguin Group�
Rawsthorn, A� (2012) The Subway Map That Rattled New Yorkers�” Retrieved from
http://www�nytimes�com
San Francisco Bay Area Rapid Transit District� (2014)� Station List | bart�gov� [Graphic]
Retrieved from http://www�bart�gov/stations
Sandmarg�Etsy (2012) img 474 | 1913 Map of Paris Metro� [Graphic]
Retrieved from https://www.flickr.com
Sandmarg�Etsy (2012) Paris Metro | 1898 Map of City of Paris� [Graphic]
Retrieved from https://www.flickr.com
Slocum, T�, McMaster, R�, Kessler, F�, & Howard, H� (Eds�)� (2009) Thematic Cartography and
Geovisualization� (3rd ed�) Upper Saddle River, New Jersey: Pearson Education�
Tokyo Metro Co� (n�d�) Tokyo Map | Subway Map� [Graphic] Retrieved from
http://www�tokyometro�jp/en/subwaymap/
Transport for London� (n�d�) Design Classics | Transport for London� [Graphic] Retrieved from
http://www.tfl.gov.uk/corporate/projectsandschemes/2443.aspx
Transport for London� (n�d�)� Maps | Transport for London� [Graphic] Retrieved from
http://www.tfl.gov.uk/gettingaround/1106.aspx
Transportation Nation� (2012)� Vignelli, Designer of Famous Subway Map, Defends His Version
Over These Others�” Retrieved from http://www�wnyc�org/