Embed Size (px)
Citation preview
Economics and Competitiveness A Comparison with Iowa / Minnesota
Exploring Economic
Advantages and
Disadvantages of
Finishing Hogs in
Alberta
Economics and Competitiveness Division November 2015
AF External Release
AF External Release
Economics and Competitiveness Division November 2015
Zoia Komirenko Livestock Economist Economics Branch Economics and Competitiveness Division 780-422-5027 [email protected]
The views and opinions expressed in this report article are those of the Economics and Competitiveness Division and do not necessarily
reflect the official policy or position of the Ministry of Agriculture and Forestry or the Government of Alberta. Analysis performed within this
report is based on limited and open source information. Assumptions made within the analysis are not reflective of the position of the
Ministry of Agriculture and Forestry or the Government of Alberta.
i
EXECUTIVE SUMMARY
This report explores and compares production practices and cost of production in hog finishing barns
of Alberta and Iowa/Minnesota. The report also discusses on a high level other important factors that
contribute to profitability of hog producers in Alberta and in the US, such as policy, labor, hog feed,
and pricing.
It is concluded that, compared to the US (Iowa/Minnesota) hog producers, Alberta hog producers have
advantages related to production practices and processes (such as days to market, biosecurity, land
base), but at an economic disadvantage of higher production costs and lower hog prices. The
message of this report is that in terms of production efficiencies and product quality, Alberta hogs are
at least as good as the US hogs (and some aspects of production practices may be even better). It is
a combination of relatively higher prices and lower cost of production in the US that makes the US hog
producers enjoy higher returns on average compared to Alberta hog producers.
ii
TABLE OF CONTENTS
BACKGROUND ................................................................................................................................... 1
DAYS TO MARKET AND COST COMPARISON ................................................................................. 1
WHERE IS OUR (DIS)ADVANTAGE? ................................................................................................. 3
Barley versus corn ............................................................................................................................ 3
Does the Farm Bill in the US subsidize primary grain producers? .................................................... 4
Are feed milling costs higher in Alberta? ........................................................................................... 5
Are barn construction costs higher in Alberta? ................................................................................. 7
Labour shortage (production and processing) .................................................................................. 7
Are hog prices lower in Alberta? ....................................................................................................... 8
Does the hog price discovery process in the US yield a “real” price? ................................................ 9
Alberta’s definite advantages .......................................................................................................... 10
CONCLUSIONS................................................................................................................................. 11
1
BACKGROUND
The cost of production (COP) study, commissioned by Alberta Pork and funded by Alberta Livestock
and Meat Agency (ALMA), is into its fifth year of solid benchmark information for Alberta hog
producers. Available for the years 2011-2014, it helps to monitor and manage the production factors
within producers’ control.
Murray Roeske, the cost of production project lead with Alberta Pork, compared 2012 cost of
production numbers generated by Alberta’s study with the numbers of the US based MetaFarms Inc.
database1. He found that Alberta hogs may be finished eight days faster than in the US on average.
The top cost-efficient Alberta hog producers may finish hogs 13 days faster than in the US. The
question is then why do Alberta hog producers send many of their hogs to the US to be finished while
their own production processes are more efficient? Is it all about how much it costs? What are the
economics advantages (or disadvantages) of finishing hogs in Alberta as compared to the US?
The purpose of this report is not to conduct a very detailed analysis, but to discuss (on a high level)
factors that impact or may impact profitability of finishing hog barns in Alberta. Not all the factors have
been covered. We hope that this report will spark further conversation among hog producers as to
what areas of their business they are already very good at, what areas may need improvement, and
what is not in their own control, but should be understood.
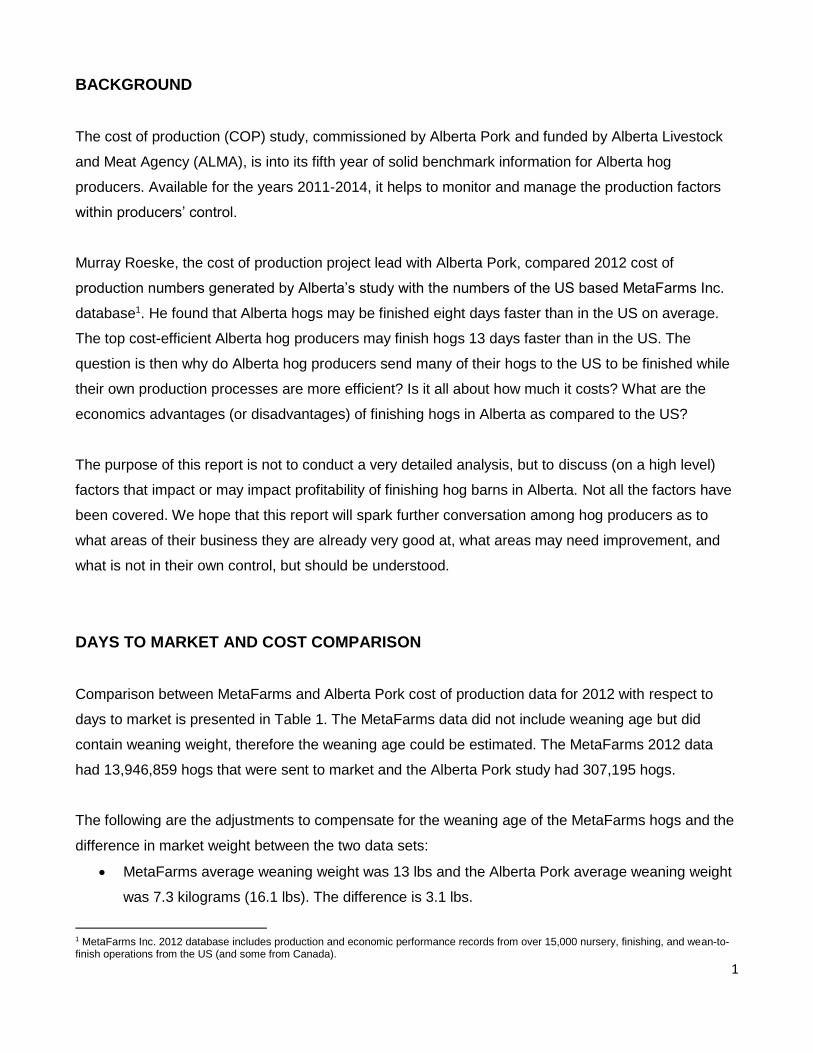
DAYS TO MARKET AND COST COMPARISON
Comparison between MetaFarms and Alberta Pork cost of production data for 2012 with respect to
days to market is presented in Table 1. The MetaFarms data did not include weaning age but did
contain weaning weight, therefore the weaning age could be estimated. The MetaFarms 2012 data
had 13,946,859 hogs that were sent to market and the Alberta Pork study had 307,195 hogs.
The following are the adjustments to compensate for the weaning age of the MetaFarms hogs and the
difference in market weight between the two data sets:
MetaFarms average weaning weight was 13 lbs and the Alberta Pork average weaning weight
was 7.3 kilograms (16.1 lbs). The difference is 3.1 lbs.
1 MetaFarms Inc. 2012 database includes production and economic performance records from over 15,000 nursery, finishing, and wean-to-finish operations from the US (and some from Canada).
2
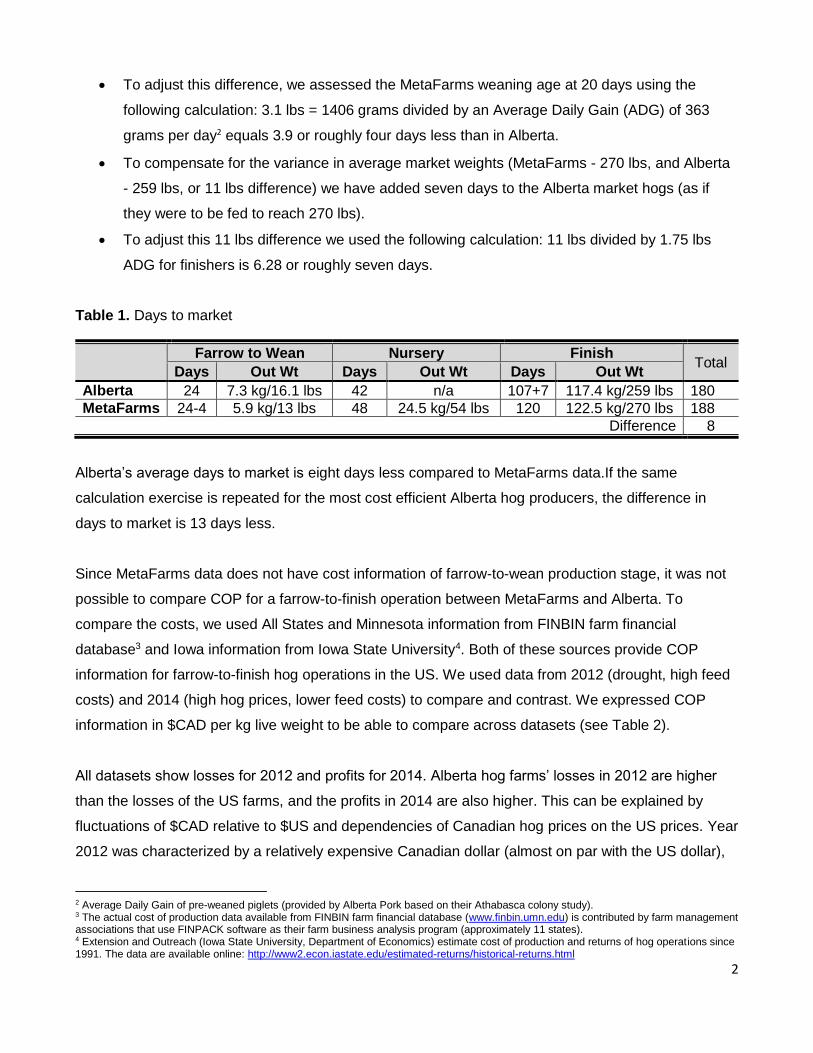
To adjust this difference, we assessed the MetaFarms weaning age at 20 days using the
following calculation: 3.1 lbs = 1406 grams divided by an Average Daily Gain (ADG) of 363
grams per day2 equals 3.9 or roughly four days less than in Alberta.
To compensate for the variance in average market weights (MetaFarms - 270 lbs, and Alberta
- 259 lbs, or 11 lbs difference) we have added seven days to the Alberta market hogs (as if
they were to be fed to reach 270 lbs).
To adjust this 11 lbs difference we used the following calculation: 11 lbs divided by 1.75 lbs
ADG for finishers is 6.28 or roughly seven days.
Table 1. Days to market
Farrow to Wean Nursery Finish Total
Days Out Wt Days Out Wt Days Out Wt
Alberta 24 7.3 kg/16.1 lbs 42 n/a 107+7 117.4 kg/259 lbs 180
MetaFarms 24-4 5.9 kg/13 lbs 48 24.5 kg/54 lbs 120 122.5 kg/270 lbs 188
Difference 8
Alberta’s average days to market is eight days less compared to MetaFarms data.If the same
calculation exercise is repeated for the most cost efficient Alberta hog producers, the difference in
days to market is 13 days less.
Since MetaFarms data does not have cost information of farrow-to-wean production stage, it was not
possible to compare COP for a farrow-to-finish operation between MetaFarms and Alberta. To
compare the costs, we used All States and Minnesota information from FINBIN farm financial
database3 and Iowa information from Iowa State University4. Both of these sources provide COP
information for farrow-to-finish hog operations in the US. We used data from 2012 (drought, high feed
costs) and 2014 (high hog prices, lower feed costs) to compare and contrast. We expressed COP
information in $CAD per kg live weight to be able to compare across datasets (see Table 2).
All datasets show losses for 2012 and profits for 2014. Alberta hog farms’ losses in 2012 are higher
than the losses of the US farms, and the profits in 2014 are also higher. This can be explained by
fluctuations of $CAD relative to $US and dependencies of Canadian hog prices on the US prices. Year
2012 was characterized by a relatively expensive Canadian dollar (almost on par with the US dollar),
2 Average Daily Gain of pre-weaned piglets (provided by Alberta Pork based on their Athabasca colony study). 3 The actual cost of production data available from FINBIN farm financial database (www.finbin.umn.edu) is contributed by farm management associations that use FINPACK software as their farm business analysis program (approximately 11 states). 4 Extension and Outreach (Iowa State University, Department of Economics) estimate cost of production and returns of hog operations since 1991. The data are available online: http://www2.econ.iastate.edu/estimated-returns/historical-returns.html
3
while in 2014 the Canadian dollar became almost 10 percent cheaper. A weaker Canadian dollar
supported hog prices that were already extremely high in 20145.
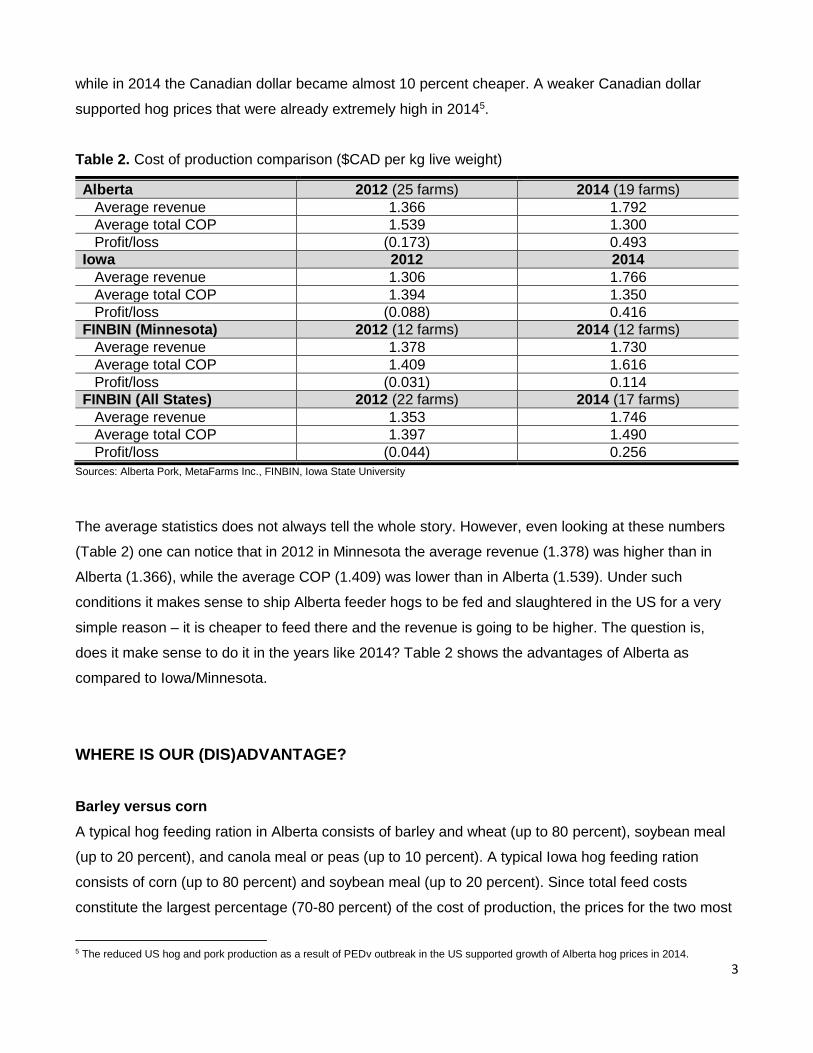
Table 2. Cost of production comparison ($CAD per kg live weight)
Alberta 2012 (25 farms) 2014 (19 farms)
Average revenue 1.366 1.792
Average total COP 1.539 1.300
Profit/loss (0.173) 0.493
Iowa 2012 2014
Average revenue 1.306 1.766
Average total COP 1.394 1.350
Profit/loss (0.088) 0.416
FINBIN (Minnesota) 2012 (12 farms) 2014 (12 farms)
Average revenue 1.378 1.730
Average total COP 1.409 1.616
Profit/loss (0.031) 0.114
FINBIN (All States) 2012 (22 farms) 2014 (17 farms)
Average revenue 1.353 1.746
Average total COP 1.397 1.490
Profit/loss (0.044) 0.256
Sources: Alberta Pork, MetaFarms Inc., FINBIN, Iowa State University
The average statistics does not always tell the whole story. However, even looking at these numbers
(Table 2) one can notice that in 2012 in Minnesota the average revenue (1.378) was higher than in
Alberta (1.366), while the average COP (1.409) was lower than in Alberta (1.539). Under such
conditions it makes sense to ship Alberta feeder hogs to be fed and slaughtered in the US for a very
simple reason – it is cheaper to feed there and the revenue is going to be higher. The question is,
does it make sense to do it in the years like 2014? Table 2 shows the advantages of Alberta as
compared to Iowa/Minnesota.
WHERE IS OUR (DIS)ADVANTAGE?
Barley versus corn
A typical hog feeding ration in Alberta consists of barley and wheat (up to 80 percent), soybean meal
(up to 20 percent), and canola meal or peas (up to 10 percent). A typical Iowa hog feeding ration
consists of corn (up to 80 percent) and soybean meal (up to 20 percent). Since total feed costs
constitute the largest percentage (70-80 percent) of the cost of production, the prices for the two most
5 The reduced US hog and pork production as a result of PEDv outbreak in the US supported growth of Alberta hog prices in 2014.
4
important (energy) feed ingredients – barley and corn – in Canada and the US, respectively, largely
define the cost of production. Ideally, in a more detailed analysis protein costs for the hog ration
should also be considered. Canola meal is significantly cheaper than soybean meal but has an inferior
nutritional profile for monogastric animals such as hogs. In practice, large quantities of soybean meal
are imported from the upper Midwest to Alberta for feeding hogs, which is a cost disadvantage
compared to Iowa producers. Protein costs are beyond the scope of this report.
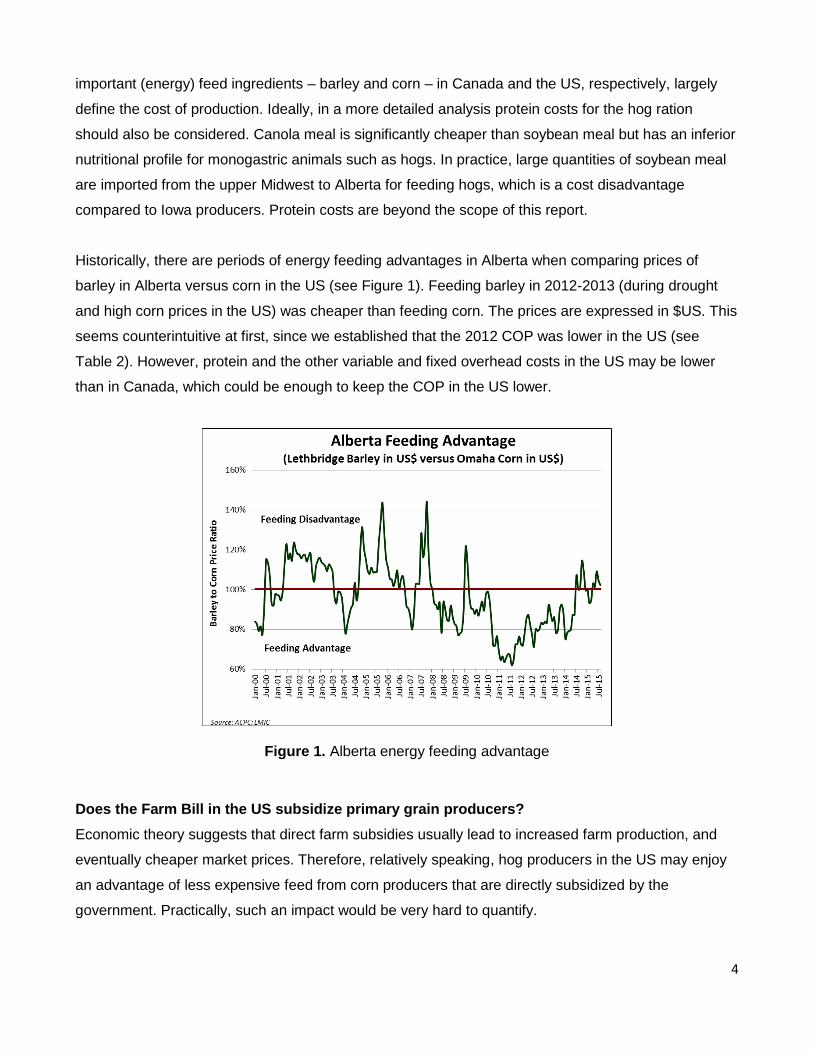
Historically, there are periods of energy feeding advantages in Alberta when comparing prices of
barley in Alberta versus corn in the US (see Figure 1). Feeding barley in 2012-2013 (during drought
and high corn prices in the US) was cheaper than feeding corn. The prices are expressed in $US. This
seems counterintuitive at first, since we established that the 2012 COP was lower in the US (see
Table 2). However, protein and the other variable and fixed overhead costs in the US may be lower
than in Canada, which could be enough to keep the COP in the US lower.
Figure 1. Alberta energy feeding advantage
Does the Farm Bill in the US subsidize primary grain producers?
Economic theory suggests that direct farm subsidies usually lead to increased farm production, and
eventually cheaper market prices. Therefore, relatively speaking, hog producers in the US may enjoy
an advantage of less expensive feed from corn producers that are directly subsidized by the
government. Practically, such an impact would be very hard to quantify.
5
The most recent US Farm Bill was passed in 2014 and is known as the “Agriculture Act of 2014”.
Unlike the 2008 Farm Bill that was very controversial due to an uneven distribution of subsidy money
among farmers, the 2014 Farm Bill eliminated direct payment subsidies that used to pay farmers
regardless of whether they were growing crops or not. This subsidy cost $5 billion a year. Some of this
money was redirected to the government-subsidized crop insurance. The government pays 62 percent
of premiums for the $9 billion-a-year insurance program6. Now the government will also spend an
additional $7 billion over the next 10 years covering the crop insurance deductibles to compensate
farmers for the loss of direct payment support7. The US farm policy is extremely complex and a
detailed discussion is beyond the scope of this paper.
Canada has a similar crop insurance program in place. Under the AgriInsurance program the federal
and provincial governments pay 60 percent of the total premium cost (36 percent by federal and 24
percent by provincial) while producers contribute the remaining 40 percent8. However, the Canadian
system does not cover insurance deductibles. While the US grain producers may have an advantage
of subsidized deductibles, this is not likely to impact feed grain prices to a large extent. Therefore,
there is no hard evidence to suggest that the US hog producers may have an advantage of cheaper
feed due to subsidization of corn production.
Are feed milling costs9 higher in Alberta?
Cost of feed milling at a commercial feed mill is significantly higher in Alberta compared to the hog
producing states in the US. In 2015, grind and mix charges for Alberta are around $15 to $17 per
metric tonne (MT) of feed for mash, and $21 to $23 for pellets. Delivery within 50 kms is about an
additional $11.00/MT. Total grind, mix, delivered (GMD) for mash is $26-$30/MT. In the US, when
expressed in $CAD, it is $7 to $8/MT for mash and another $7 to $8/MT for delivery. Total GMD is
$14.50-$17/MT, which is approximately half of what is paid in Alberta. There are few reasons why this
is the case, explained below.
Competitiveness. There are approximately 500 commercial feed mills in Canada, 22 percent of which
are located on the Prairies. Alberta has roughly 30-40 commercial feed mills. Alberta’s biggest feed
mills/feed companies are Masterfeeds, Hi-Pro Feeds, Landmark Feeds (Nutreco Canada), ADM,
6 Source: http://www.nytimes.com/2014/01/30/us/politics/house-approves-farm-bill-ending-2-year-impasse.html?_r=1 7 Source: http://www.washingtonpost.com/news/wonkblog/wp/2014/01/28/the-950-billion-farm-bill-in-one-chart/ 8 Source: http://www.agr.gc.ca/eng/about-us/offices-and-locations/office-of-audit-and-evaluation/audit-and-evaluation-reports/agriculture-and-agri-food-canada-evaluation-reports/evaluation-of-the-agriinsurance-private-sector-risk-management-partnerships-and-wildlife-compensation-programs/?id=1367338599421 9 Milling cost is cost of milling feed incurred by producers when done on-farm (or the price they pay at a commercial feed mill for milling grain). Not to be confused with the actual cost of milling by a commercial feed mill.
6
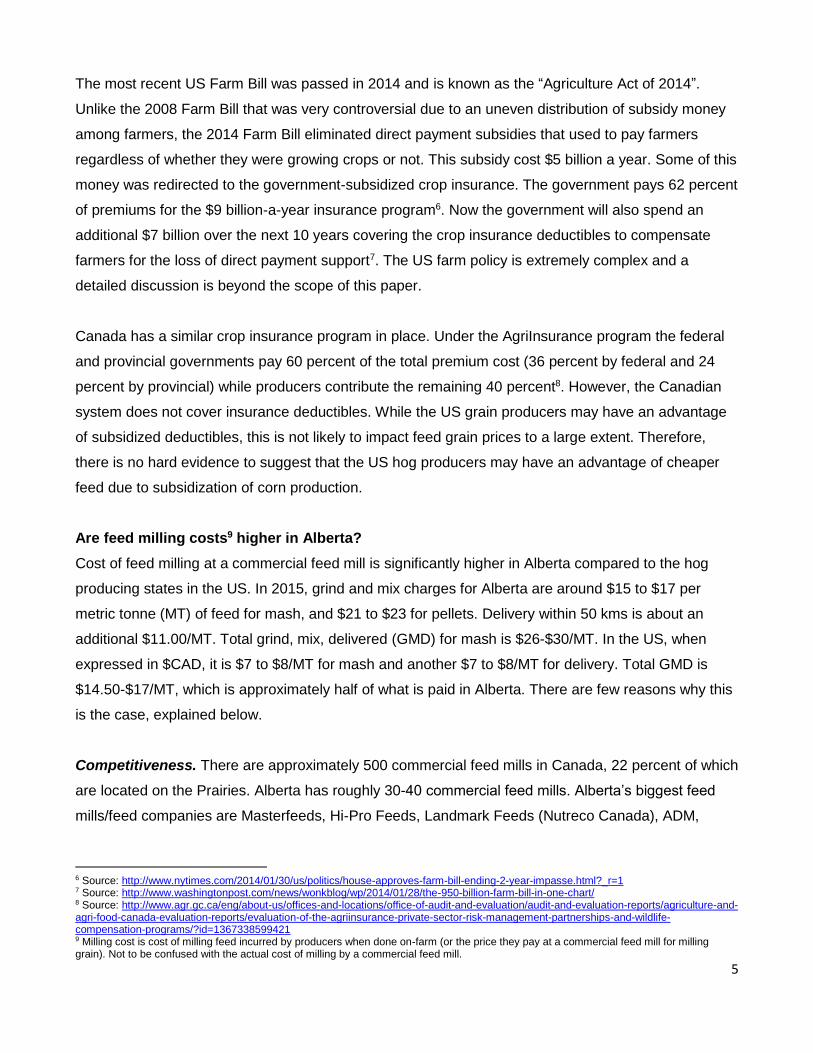
Champion Feed Services, and EMF Nutrition. In comparison, Figure 2 shows Iowa’s map of feed mills.
Note the wide distribution of mills across the state as well as the relatively short distances between
competing mills. A highly competitive feed milling business in the US causes prices to drop.
Figure 2. Locations of feed mills in Iowa10
Economies of scale. Canadian annual feed production amounts to 20 million tonnes at commercial
feed mills and 10 million tonnes on the farm. In comparison, one of the newest and largest commercial
feed mills in Ellsworth (Iowa) has a capacity to produce one million imperial tons of feed annually11.
This scale is possible because a feed mill in Iowa can source most of its primary ingredients from a
relatively short distance, due to the much higher average crop yields compared to western Canada.
Certainly, as with many processes, economies of scale play a significant role in determining cost of
milling.
Due to the lack of competition and high cost of milling in Alberta, even hog operations with 500 sows
will likely have a mill onsite. This requires additional capitalization of building mills, and eventually
raises cost of production.
10 Source: https://www.google.com/maps/d/viewer?mid=z-c61IOwXkd0.keYGtpQGVSpM&hl=en_US 11 Largest feed mill in the Midwest is in Iowa (opened in 2015): http://agfax.com/2014/12/29/iowa-largest-feed-mill-midwest-opens-ellsworth/
7
Are barn construction costs higher in Alberta?
Constructing new barn facilities is more expensive in Alberta as compared to the US. Cost of
construction is higher here due to colder climate. Barns have to have a more expensive solid
structure, better insulation and better ventilation (especially in winter). In Iowa, the average low
temperature in January is approximately -100C12, while in Alberta average low ranges anywhere from
- 10 to - 260C13. Very often, curtain barns rather than solid barns, are being used in the US to house
pigs, particularly for finishing. Cost of labour for construction workers is also higher in Alberta due to
competition with the oil industry. On the flip side, it is possible that the better built and ventilated barns
in Alberta contribute to the advantage in days to feed, by providing more uniform growing conditions
for pigs.
In Alberta, all finishing barns have a concrete floor with a pit for manure. A permit is required. Pits
have to be sealed to not contaminate ground water, and have to go out to a lagoon, the type of which
depends on the cost and impact on the environment. Therefore, the types of lagoons are very site
specific and construction can cost anywhere from $15,000 to $100,000.
Most hog manure in the US is handled as a liquid. Barns usually have a slotted floor into a deep pit,
where manure may be stored for 3-12 months. The lagoon system, such as in Alberta, is also used,
but is generally more expensive and larger in size compared to deep pits. Hence, the capital cost in
Alberta is relatively higher.
According to preliminary estimates of Alberta Agriculture and Forestry’s researchers, the current 2015
cost of a 1,600 head hog finishing barn is approximately $460/head or $51/sq ft. According to
Serecon, farrow barn costs in Alberta are approximately $40/sq ft, plus about $22/sq ft for equipment.
Finishing barns cost around $55/sq ft including equipment. The average cost in the US is
approximately 20 percent less than Alberta or $32/sq ft for building and $18/sq ft for equipment (farrow
barns) and $44 including equipment (finishing barns).
Labour shortage (production and processing)
Perhaps the biggest issue that affects both the primary industry as well as processing is the labour
shortage. When labour supply is short, one way to attract labour is to increase wages. Increased
wages eventually lead to increased cost of production. The agriculture industry has the second lowest
(after accommodation and food services) average wage in the province, which is $17.64/hour in 2014.
12 Source: http://www.usclimatedata.com/ 13 Source: http://www.currentresults.com/Weather/Canada/Alberta/average-alberta-weather.php
8
In the meantime, utilities and oil and gas industries pay the highest average wages of $40.09/hour and
$39.64/hour, respectively. Overall, Alberta had the highest average hourly wage across all industries
among the 10 provinces since 200614. This makes Alberta less labour cost competitive compared to
the US. The average hourly wage of farm and ranch agricultural workers in 2014 was $US 12.60 in
Iowa and $US 10.79 in Minnesota 15 (which is approximately $CAD 14 and $CAD 11, respectively).
The agricultural labour outlook for Alberta does not seem to be bright either. Employment in all
industries in Alberta grew by 2.2 percent in 2014 relative to 2013, while employment in agriculture
declined by 4.4 percent. It is estimated that for the period of 2013-2023 there is going to be a 96,000
worker shortage in labour supply in Alberta14.
Currently in Alberta, the packing industry (both beef and pork) is short about 1,000 workers. Changes
to the Temporary Foreign Worker (TFW) program had a negative impact on the packing industry. The
number of new TFWs in Alberta decreased from 40,000 in 2013 to less than 20,000 in 201416.While
the US packing industry finds workers for their double shifts (primarily from Mexico and Central
America), Alberta plants are running single shifts (i.e. under capacity) and are not able to do the value-
added cuts17. The consequence of running single shifts is increased overhead costs that leads to
increased cost of production for the packing industry. This has an impact on the maximum prices
packing plants are willing to pay for animals. Producers are currently concerned about pricing and
packers are concerned about supply of animals. This creates an uncertainty in the hog sector and
affects the outlook for the hog industry.
Are hog prices lower in Alberta?
Hog prices in Canada are calculated based on United States Department of Agriculture (USDA) daily
cash hog reports using a formula. Canadian hog prices are therefore dependent on what is happening
in the US hog market, adjusted for currency, imperial to metric conversion, difference in dressing
percentage, and grading premium. The formula is reviewed by Canadian packers and producers
periodically. Without USDA cash hog prices, there would be no Canadian hog prices under the current
system18.
14 Source: http://work.alberta.ca/documents/labour-market-highlights.pdf 15 Source: http://www.bls.gov/oes/current/map_changer.htm The average wage was calculated based on the annual average wage (provided on the map) divided by a “year-round, full time” 2,080 hours (a figure recommended by the US Department of Labor, Bureau of Labor and Statistics). 16 Source: https://work.alberta.ca/documents/annual-alberta-labour-market-review.pdf 17 Source: http://alma.alberta.ca/News/index.htm?contentId=AGUCMINT-505642&useSecondary=true 18 Source: http://www.gibsoncapital.ca/articles/price-discovery.html
9
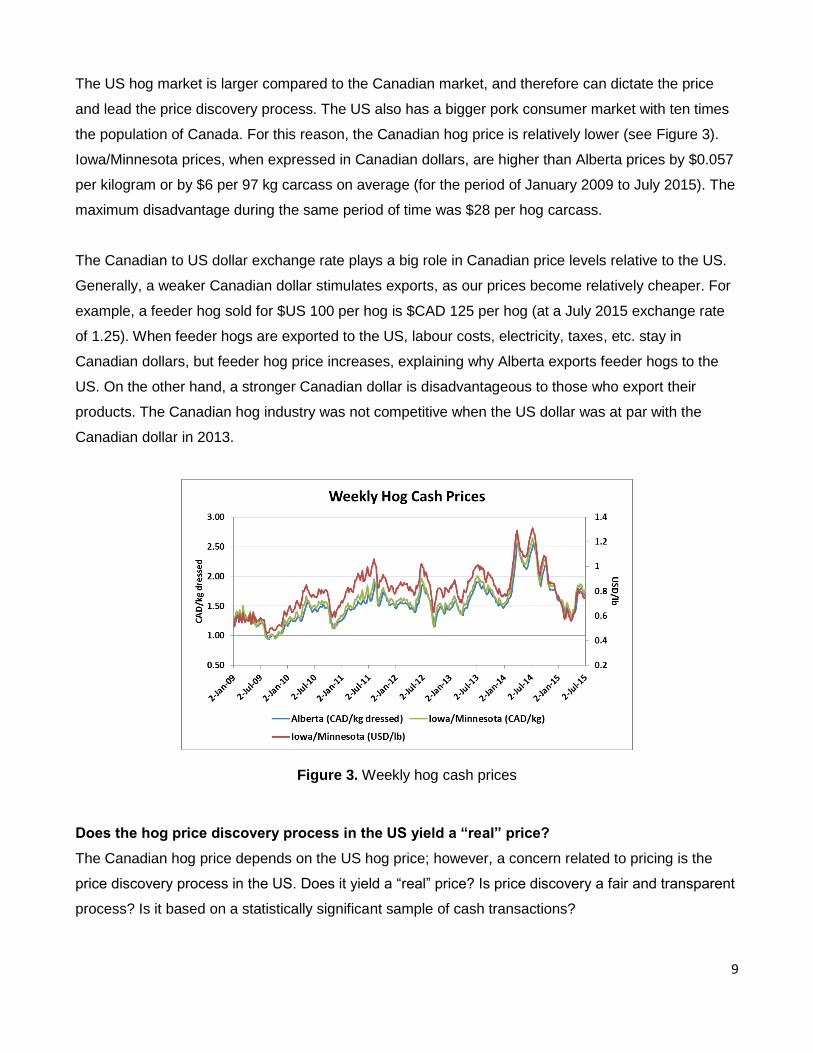
The US hog market is larger compared to the Canadian market, and therefore can dictate the price
and lead the price discovery process. The US also has a bigger pork consumer market with ten times
the population of Canada. For this reason, the Canadian hog price is relatively lower (see Figure 3).
Iowa/Minnesota prices, when expressed in Canadian dollars, are higher than Alberta prices by $0.057
per kilogram or by $6 per 97 kg carcass on average (for the period of January 2009 to July 2015). The
maximum disadvantage during the same period of time was $28 per hog carcass.
The Canadian to US dollar exchange rate plays a big role in Canadian price levels relative to the US.
Generally, a weaker Canadian dollar stimulates exports, as our prices become relatively cheaper. For
example, a feeder hog sold for $US 100 per hog is $CAD 125 per hog (at a July 2015 exchange rate
of 1.25). When feeder hogs are exported to the US, labour costs, electricity, taxes, etc. stay in
Canadian dollars, but feeder hog price increases, explaining why Alberta exports feeder hogs to the
US. On the other hand, a stronger Canadian dollar is disadvantageous to those who export their
products. The Canadian hog industry was not competitive when the US dollar was at par with the
Canadian dollar in 2013.
Figure 3. Weekly hog cash prices
Does the hog price discovery process in the US yield a “real” price?
The Canadian hog price depends on the US hog price; however, a concern related to pricing is the
price discovery process in the US. Does it yield a “real” price? Is price discovery a fair and transparent
process? Is it based on a statistically significant sample of cash transactions?
10
The problem with price discovery is that it is like any other public good – everybody wants it to exist
and function properly, but not many want to participate. Pricing that is done according to a specific
formula is still based on the outcomes of cash transactions, but nobody pays for this “service” of
making cash transaction information available. In past years the number of cash transactions have
declined not only on hog markets, but also on many other agricultural markets. Some of the reasons
are: increasing concentration and vertical integration (i.e. fewer players on the market), lack of
government funding, low priority for organizations, and the illusion that technology fixes it.
In 2000, 12 leading pork packers were surveyed in the US. They reported that 26 percent of hogs
were purchased on a cash market basis, and 74 percent were purchased using non-cash methods.
Interestingly, all formula transactions were based on a single market report (the Iowa-Southern
Minnesota spot market or closely related Western Cornbelt Lean market)19. When the same survey
was repeated in 2009, only 8 percent of hogs were purchased on (negotiated) cash market20.
Before April 2001, US hog prices were voluntarily reported, while subsequently price reporting was
mandatory for all packers above a certain minimum volume. In 2009, 92.7 percent of federal slaughter
was reported through the Mandatory Price Reporting (MPR) system of the USDA. MPR legislation
requires both base price and net price (includes credits for quality, transportation and time of delivery,
and percent lean and carcass weight) to be reported20.
The issue is not so much of a transparency of price discovery in the US, but of a price spread between
the US and Alberta. Alberta is the lowest-priced market in North America as it is quite distant from
central locations.
Alberta’s definite advantages
Primary production efficiency. According to a recent report by ALMA, Alberta has good hog
genetics, a very suitable climate21, availability of feed, knowledgeable managers and well-trained
workers, and excellent animal health services17.
Adaptability. Due to the struggles of Alberta’s hog industry in the last decade, many production
facilities ceased production (primarily due to issues with financing and not with management).
19 Source: http://ageconsearch.umn.edu/bitstream/36418/1/sp00sc01.pdf 20 Source: http://agebb.missouri.edu/mkt/vertstud09.pdf 21 Alberta’s climate is fairly cold in winter, but can be compensated by building well insulated barns. Colder climate also means fewer diseases. At the same time, Alberta’s summers are not very hot. Very hot weather causes dehydration in hogs and decreases weight gain due to decreased appetite.
11
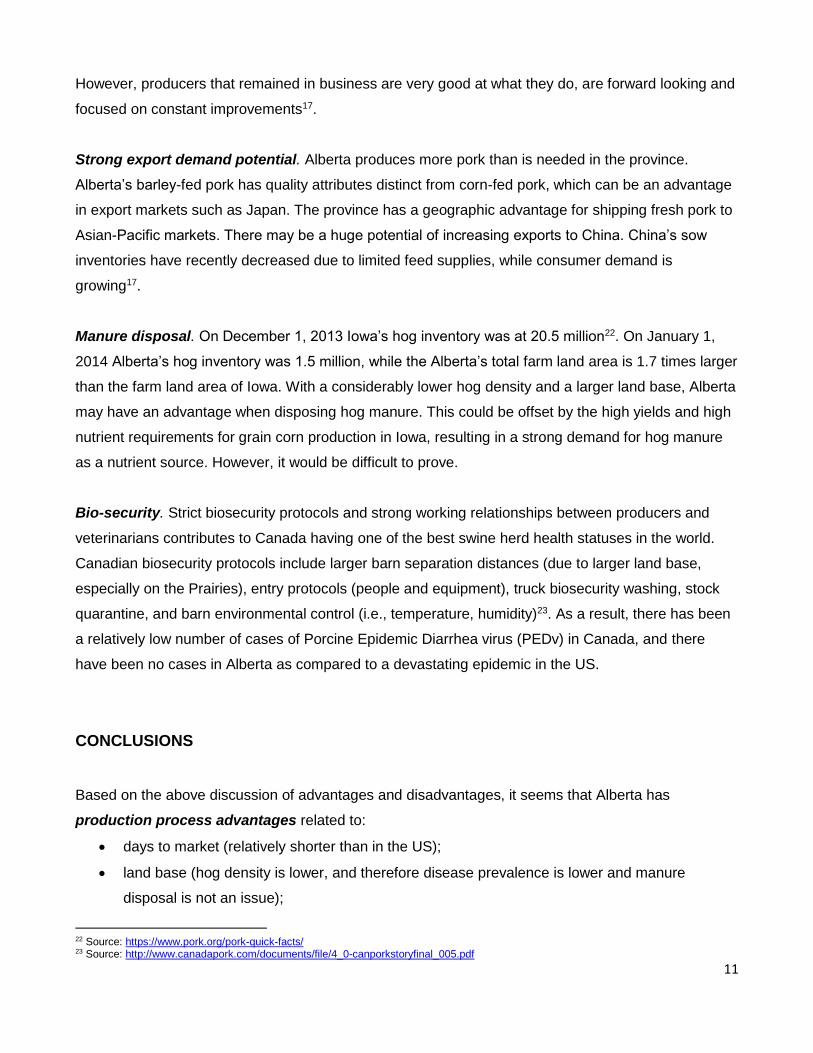
However, producers that remained in business are very good at what they do, are forward looking and
focused on constant improvements17.
Strong export demand potential. Alberta produces more pork than is needed in the province.
Alberta’s barley-fed pork has quality attributes distinct from corn-fed pork, which can be an advantage
in export markets such as Japan. The province has a geographic advantage for shipping fresh pork to
Asian-Pacific markets. There may be a huge potential of increasing exports to China. China’s sow
inventories have recently decreased due to limited feed supplies, while consumer demand is
growing17.
Manure disposal. On December 1, 2013 Iowa’s hog inventory was at 20.5 million22. On January 1,
2014 Alberta’s hog inventory was 1.5 million, while the Alberta’s total farm land area is 1.7 times larger
than the farm land area of Iowa. With a considerably lower hog density and a larger land base, Alberta
may have an advantage when disposing hog manure. This could be offset by the high yields and high
nutrient requirements for grain corn production in Iowa, resulting in a strong demand for hog manure
as a nutrient source. However, it would be difficult to prove.
Bio-security. Strict biosecurity protocols and strong working relationships between producers and
veterinarians contributes to Canada having one of the best swine herd health statuses in the world.
Canadian biosecurity protocols include larger barn separation distances (due to larger land base,
especially on the Prairies), entry protocols (people and equipment), truck biosecurity washing, stock
quarantine, and barn environmental control (i.e., temperature, humidity)23. As a result, there has been
a relatively low number of cases of Porcine Epidemic Diarrhea virus (PEDv) in Canada, and there
have been no cases in Alberta as compared to a devastating epidemic in the US.
CONCLUSIONS
Based on the above discussion of advantages and disadvantages, it seems that Alberta has
production process advantages related to:
days to market (relatively shorter than in the US);
land base (hog density is lower, and therefore disease prevalence is lower and manure
disposal is not an issue);
22 Source: https://www.pork.org/pork-quick-facts/ 23 Source: http://www.canadapork.com/documents/file/4_0-canporkstoryfinal_005.pdf
12
biosecurity (strict protocols contribute to excellent swine herd health);
closer proximity to export markets such as China and Japan.
Alberta is, however, at a purely economic disadvantage of higher production costs and lower hog
prices. Higher production costs are due to:
higher capital costs (e.g. barn construction);
periodically higher feed costs (according to Figure 1, Alberta has roughly a 50 percent chance
of an energy feed disadvantage);
higher feed milling costs;
higher farm labor costs.
Alberta’s hog prices depend on the US hog prices and are usually lower. The province
is a surplus producer and Alberta’s prices are discounted by the freight cost to the market. At the
same time the US pork processing industry is able to secure relatively cheaper labor to maintain
double-shifts.US pork processors can afford to offer higher bids for slaughter hogs compared to
Alberta’s hog processors, who have similar labor shortages as Alberta’s primary producers.
In terms of production efficiencies and product quality, Alberta’s hogs are at least as good as the US
hogs (and some aspects of production may be even better). It is a combination of relatively higher
prices and lower cost of production in the US that makes the US hog producers enjoy higher returns
on average compared to Alberta hog producers. This is not always the case. The analysis, presented
in this report, shows that in 2014 Alberta had an energy feeding advantage as well as record high hog
prices. However, these circumstances are rare. An average year looks the way it did in our analysis
for 2012. While relatively high costs can still be managed (and probably minimized), market prices are
not in individual producer’s control. In times, when hog prices are lower in Alberta, a percentage of
feeder hogs will continue to be shipped to the US.
13
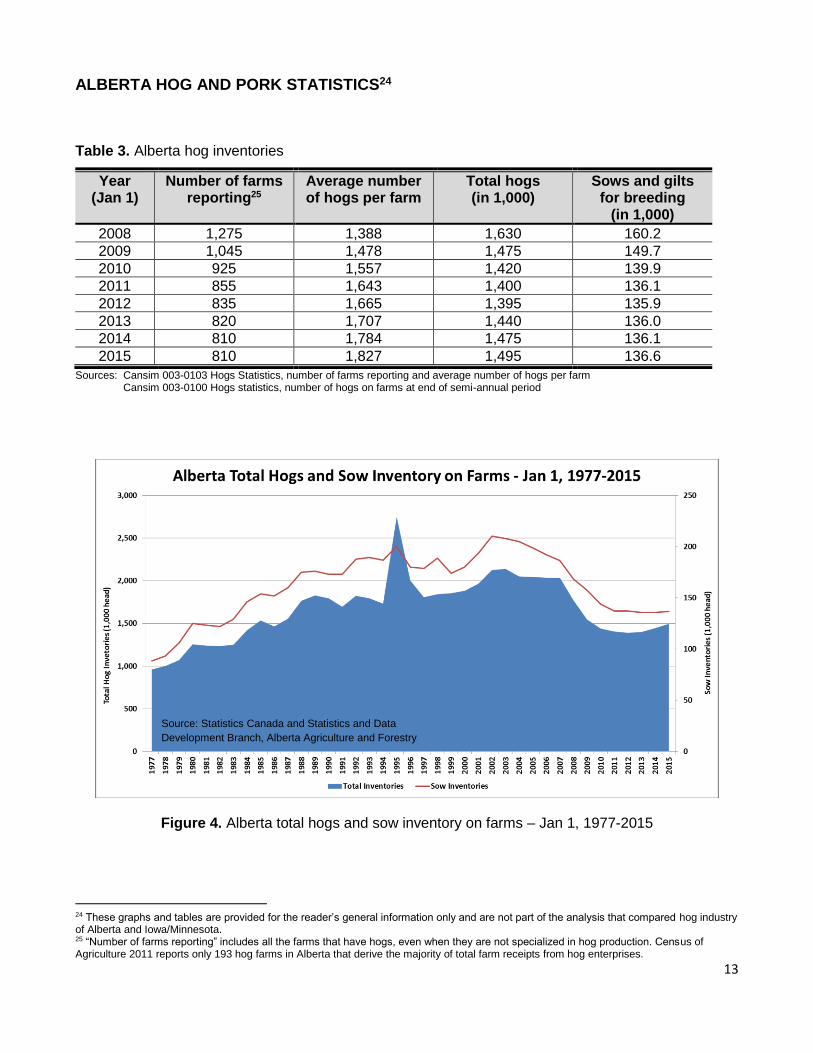
ALBERTA HOG AND PORK STATISTICS24
Table 3. Alberta hog inventories
Year (Jan 1)
Number of farms reporting25
Average number of hogs per farm
Total hogs (in 1,000)
Sows and gilts for breeding
(in 1,000)
2008 1,275 1,388 1,630 160.2
2009 1,045 1,478 1,475 149.7
2010 925 1,557 1,420 139.9
2011 855 1,643 1,400 136.1
2012 835 1,665 1,395 135.9
2013 820 1,707 1,440 136.0
2014 810 1,784 1,475 136.1
2015 810 1,827 1,495 136.6
Sources: Cansim 003-0103 Hogs Statistics, number of farms reporting and average number of hogs per farm Cansim 003-0100 Hogs statistics, number of hogs on farms at end of semi-annual period
Figure 4. Alberta total hogs and sow inventory on farms – Jan 1, 1977-2015
24 These graphs and tables are provided for the reader’s general information only and are not part of the analysis that compared hog industry of Alberta and Iowa/Minnesota. 25 “Number of farms reporting” includes all the farms that have hogs, even when they are not specialized in hog production. Census of Agriculture 2011 reports only 193 hog farms in Alberta that derive the majority of total farm receipts from hog enterprises.
Source: Statistics Canada and Statistics and Data
Development Branch, Alberta Agriculture and Forestry
14
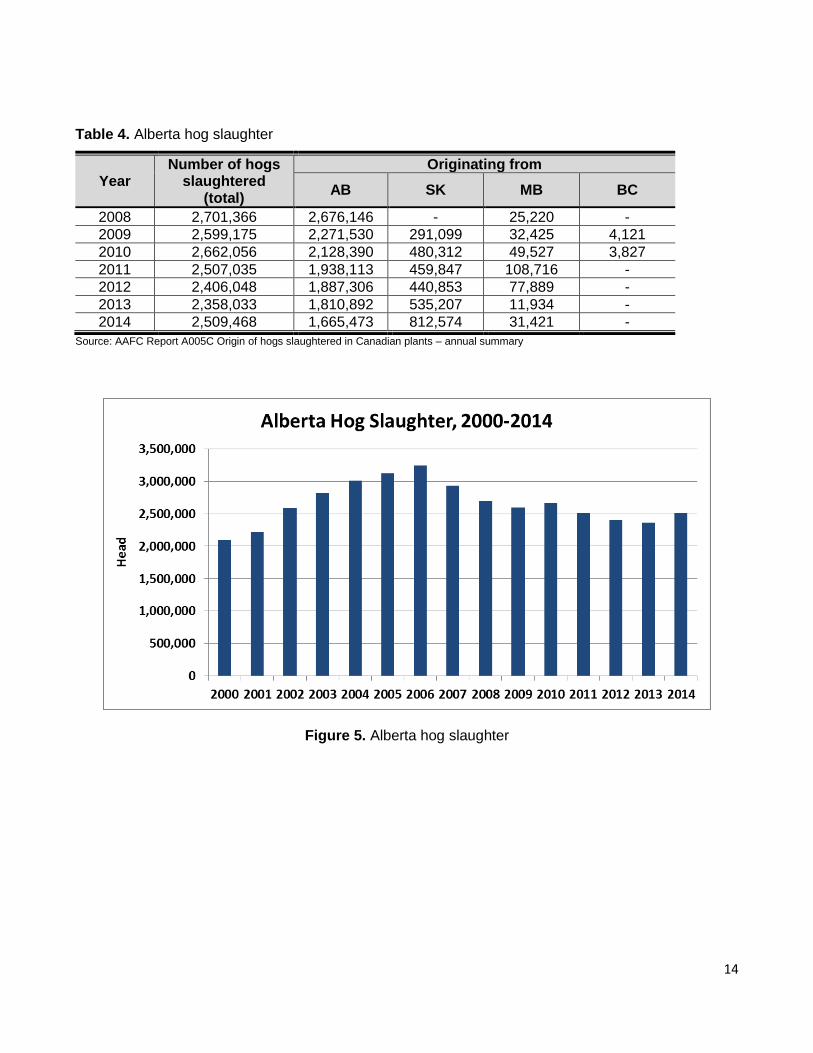
Table 4. Alberta hog slaughter
Year Number of hogs
slaughtered (total)
Originating from
AB SK MB BC
2008 2,701,366 2,676,146 - 25,220 -
2009 2,599,175 2,271,530 291,099 32,425 4,121
2010 2,662,056 2,128,390 480,312 49,527 3,827
2011 2,507,035 1,938,113 459,847 108,716 -
2012 2,406,048 1,887,306 440,853 77,889 -
2013 2,358,033 1,810,892 535,207 11,934 -
2014 2,509,468 1,665,473 812,574 31,421 -
Source: AAFC Report A005C Origin of hogs slaughtered in Canadian plants – annual summary
Figure 5. Alberta hog slaughter
15
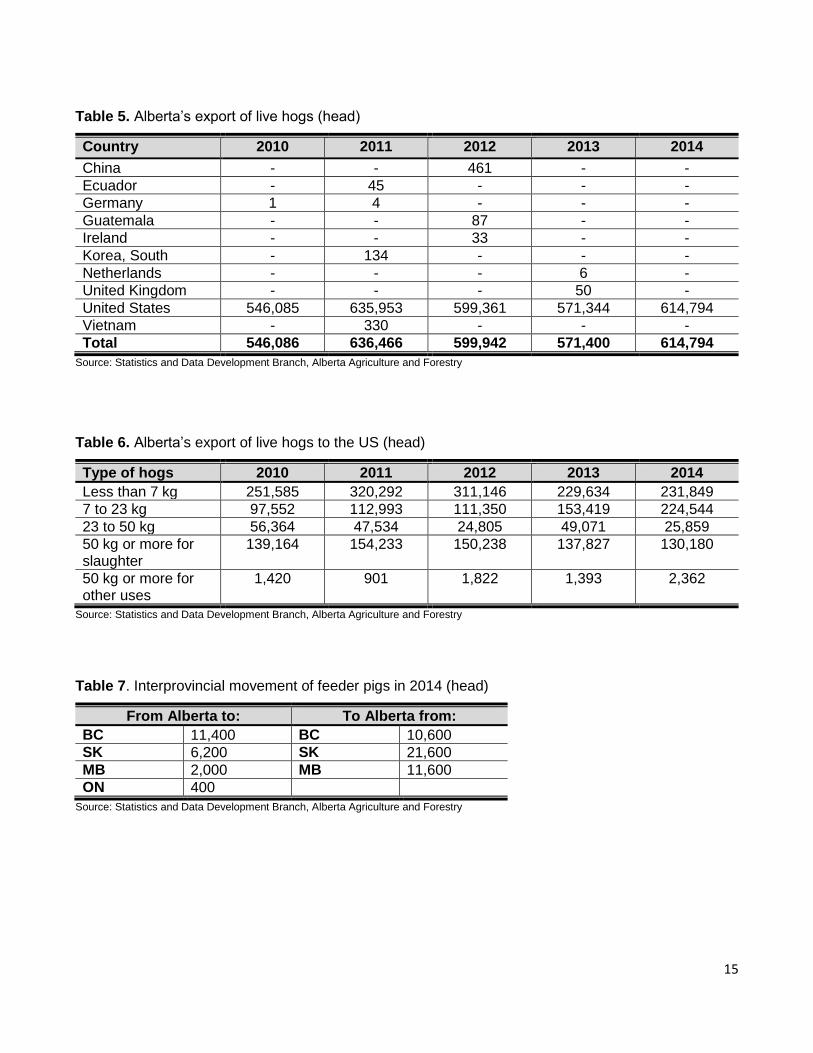
Table 5. Alberta’s export of live hogs (head)
Country 2010 2011 2012 2013 2014
China - - 461 - -
Ecuador - 45 - - -
Germany 1 4 - - -
Guatemala - - 87 - -
Ireland - - 33 - -
Korea, South - 134 - - -
Netherlands - - - 6 -
United Kingdom - - - 50 -
United States 546,085 635,953 599,361 571,344 614,794
Vietnam - 330 - - -
Total 546,086 636,466 599,942 571,400 614,794
Source: Statistics and Data Development Branch, Alberta Agriculture and Forestry
Table 6. Alberta’s export of live hogs to the US (head)
Type of hogs 2010 2011 2012 2013 2014
Less than 7 kg 251,585 320,292 311,146 229,634 231,849
7 to 23 kg 97,552 112,993 111,350 153,419 224,544
23 to 50 kg 56,364 47,534 24,805 49,071 25,859
50 kg or more for slaughter
139,164 154,233 150,238 137,827 130,180
50 kg or more for other uses
1,420 901 1,822 1,393 2,362
Source: Statistics and Data Development Branch, Alberta Agriculture and Forestry
Table 7. Interprovincial movement of feeder pigs in 2014 (head)
From Alberta to: To Alberta from:
BC 11,400 BC 10,600
SK 6,200 SK 21,600
MB 2,000 MB 11,600
ON 400
Source: Statistics and Data Development Branch, Alberta Agriculture and Forestry
16
AKNOWLEDGEMENTS
This report was produced with input, data, and expert opinion of Murray Roeske from Alberta Pork.
The following persons are gratefully acknowledged for their comments and input:
Javier Bahamon from Alberta Pork;
Trevor Birchall from Serecon;
Maryann Urbanowski from Alberta Turkey Producers;
Todd Bergen-Henengouwen, Don Brown, Ron Gietz, Lorraine Kohlman, Kelly Lund, Diane
McCann-Hiltz, Chris Ullmann, and Jason Wood from Alberta Agriculture and Forestry.