Embed Size (px)
Citation preview
Affiliated Mutual Funds and Analyst Optimism
Simona Mola Arizona State University
PO Box 37100 Phoenix, AZ 85069
Massimo Guidolin Federal Reserve Bank of St. Louis
PO Box 442 St. Louis, MO 63166–0442
January 15, 2007
Abstract Prior studies have shown that the investment banking affiliation spawns pressure on analysts to produce optimistic recommendations on the investment bank’s stock-clients. Our analysis of a large sample of recommendations issued from 1995 through 2003 indicates that the mutual fund affiliation also affects analysts’ research. That is, analysts are not only likely to provide research but also to look favorably at stocks held by the affiliated mutual funds. Controlling for a variety of factors including the investment banking affiliation, we find that the greater the portfolio weight of a stock for the affiliated mutual fund family, the more optimistic the analyst rating becomes when compared to the consensus. All-star analysts report the most optimism when they recommend stocks in the portfolios of the affiliated mutual funds. However, the presence of other institutional investors as shareholders of the recommended stocks curbs analyst optimism. JEL Classification: G20, G24, G30 Keywords: analyst coverage; ratings; mutual funds We thank John Greenhut, Tim Loughran, Ronald Masulis, Christopher Muscarella, Raghavendra Rau, Jay Ritter, David Shrider, Shane Underwood, William Yost, and Donghang Zhang, participants and discussants at 2006 European Finance Association Meeting, 2006 Southern Finance Association Meeting and seminar participants at the Arizona State University for valuable comments. This paper won the “Best Paper” award in Institutional Finance at 2006 Southern Finance Association Meeting. We thank Elizabeth La Jeunesse for excellent research assistance. A prior version of this paper was entitled “Why Do Analysts Continue to Provide Favorable Coverage for Seasoned Stocks?”
1
Affiliated Mutual Funds and Analyst Optimism 1. Introduction
The dynamics between a full-service brokerage firm and its research analysts often bears some
scrutiny on behalf of investors because it may raise ethical issues. It is well known that sell-side analysts,
employed by a broker, generally provide favorable coverage on seasoned stocks. From 1995 through
2001, only 4% of analyst recommendations were rated “underperform” or “sell.” Most recommendations
issued during that period were favorable up to “strong buy.” Even after 2002, when new NASD and
NYSE rules required analysts to disclose at the end of each report the past year’s ratings assigned to a
stock, analyst tendency toward optimism has persisted, and stock recommendations are still upward
biased.
Prior studies propose several explanations for analyst optimism. The preference of currying favor
with management presses analysts to report when they can “talk up” firms (Francis and Philbrick, 1993).
Brokers’ objective of generating trading commissions also leads analysts to issue optimistic reports to
attract orders from investors who are subject to short-selling constraints (Hayes, 1998; Irvine, 2001;
Jackson, 2005). A great amount of attention among scholars and regulators focuses on the hypothesis that
investment banking affiliation acts as an influencing factor. That is, when analysts are affiliated with
investment banks, the fear of jeopardizing future underwriting business causes their recommendations to
be more favorable than they would be as unaffiliated analysts (Dugar and Nathan, 1995; Lin and
McNichols, 1998; Michaely and Womack, 1999).
This paper extends current literature by testing the hypothesis of mutual fund affiliation as
another explanation for analyst optimism about seasoned firms. As described in Nanda, Wang, and Zheng
(2004) and Gaspar, Massa, and Matos (2006), the U.S. asset-management industry is concentrated into a
number of mutual fund families. Each fund family is typically affiliated with a brokerage house that
provides trading services and sell-side research to investors. This paper conjectures that, when a mutual
fund family invests in a stock, the affiliated brokerage analysts may have an incentive to research that

2
stock and also to promote its purchase by issuing positive recommendations. The incentive may persist as
long as the fund family significantly weighs the stock investment in its portfolios. If so, such family
dynamics may have regulatory implications that the new analyst rules disregard.
Mutual fund managers value unbiased research to form their investment decisions. While buy-
side analysts employed by fund managers are not expected to be biased in their estimates, sell-side
analysts may be. In the late 1990s, some conflicts of interest involving highly reputable analysts surfaced
and raised some concerns about the impartiality of sell-side research. In particular, analysts were alleged
to have biased some reports in favor of their investment bank’s clients. Cheng, Liu, and Qian (2006) find
that fund managers do indeed rely mostly on buy-side research to make portfolio decisions. However,
research provided by the affiliated brokerage analysts can be exceptionally valuable to fund managers. As
shown by Irvine, Simko, and Nathan (2004), affiliated analysts’ earnings forecasts are significantly more
accurate than other analysts’ estimates.
To meet the demand for research, affiliated brokerage analysts are motivated to cover those
stocks within fund family. Even though this research is paid for by commissions from the analyst’s
trading department (Conrad, Johnson, and Wahal, 2001), it has a limited potential to generate added
trading business. Reuter (2005) finds that mutual funds usually pay a disproportionate share of
commissions to their affiliated brokerage firm and are less likely to trade outside of it. To generate the
most trading business out of the research provided to the affiliated fund managers, analysts make their
reports available to the public.1 We hypothesize that the family affiliation may provide analysts with the
incentive to issue reports with positive prospects for the stocks held by the affiliated mutual funds. The
fear of hurting or the preference for supporting the performance of the fund family would make analysts
optimistic on seasoned stocks.
Favoritism among divisions of full-service bank is not new in the literature. In Ritter and Zhang
(2005), the analysis of the ties between investment banks and their affiliated mutual funds during initial
1 Irvine, Lipson, and Puckett (2006) document abnormally high institutional trading volume beginning five days before “buy” recommendations are publicly released. Their evidence is consistent with institutional traders receiving tips about the contents of forthcoming analysts’ reports. The hypothesis of mutual fund affiliation does not exclude tipping prior to the issue of analyst reports.

3
public offerings (IPOs) indicates that the investment banking department supports the performance of the
asset management department. During the so-called Internet bubble period of 1999–2000, some evidence
arose that investment banks allocated hot IPOs to their affiliated funds to boost the fund performance and
attract more money inflows. As shown in Johnson and Marietta-Westberg (2005), benefits are reciprocal
within a full-service bank; and the allocations to affiliated mutual funds help earn more underwriting
business.2 More to the point, Chung and Cho (2005) analyze the ties between brokerage analysts and
market makers. They find that analysts cover the stocks that are handled by the affiliated dealers and issue
on them more numerous reports and optimistic, rather than negative, earnings forecasts to generate order
flow.
This paper thus examines the tie between brokerage analysts and their affiliated mutual funds as a
rationale explaining analyst optimism. While brokerage houses may benefit from the higher trading
business that optimistic research generates, mutual fund families may benefit from the unlikely release of
negative recommendations or from the likely issue of positive recommendations by the affiliated analysts.
Nevertheless, personal reputation is expected to curb analysts’ optimism. Ljungqvist, Marston, Starks,
Wei, and Yan (2005) find that analyst recommendations on stocks highly visible to institutional investors
are less likely to be influenced by family pressure. Consequently, we expect that analysts look favorably
at a stock while other investors’ ownership of that stock decreases and the fund family’s holdings
relatively increase. In addition, Stickel (1992) finds that the prestige resulting from being selected as all-
star analysts by Institutional Investor is well deserved. All-stars do outperform other analysts for
accuracy, frequency, and price impact of their forecasts, earning so their designation. Considering their
reputation at stake, we expect all-star analysts to report less optimism in covering stocks held by affiliated
mutual funds.
In this paper, we will define and measure an analyst’s optimism as the analyst’s tendency to issue
recommendations that are more favorable than the consensus. It is no surprise that a “strong buy”
recommendation often beats the consensus assessment of a seasoned stock. We will use a duration-
2 Other allocation practices, such as “spinning” and “laddering,” imply that investment banks act in the interests of the affiliated brokerage firms (Nimalendran, Ritter, and Zhang, 2005; Griffin, Harris, and Topaloglu, 2005).
4
analysis model to describe dynamically observable patterns in brokerage research along with concomitant
changes in the mutual fund investments. Rather than analyzing analyst optimism at a single point in time,
this approach has the advantage of capturing the persistence of analysts’ disposition toward seasoned
stocks over a long period, from 1995 through 2003, covering the Internet bubble and its subsequent burst.
The larger question—one that prior literature has not explained—is, then, do the stock holdings of
an analyst’s mutual funds affect analyst research and recommendations? The evidence we collected by
assessing a large sample of analyst recommendations says yes, in several respects. First, mutual fund
affiliation affects analysts’ decisions about providing research on seasoned stocks. We find that brokerage
analysts cover a stock more frequently when the affiliated mutual funds already hold it in their portfolios.
Also, we find that there is an extremely high likelihood that the analyst providing such regular research
will be an all-star. Second, analysts are significantly optimistic about seasoned stocks that are held by the
mutual fund family. That is, the affiliated analysts are 32% more likely to issue favorable
recommendations than are unaffiliated analysts. Robustness tests confirm then that the causal link moves
from affiliation with mutual funds to analyst optimism, and not vice versa. Third, the more the affiliated
mutual funds invest in a stock, the greater is the analysts’ optimism. That is, when a mutual fund family
increases the portfolio weight of a stock investment by 1%, the probability that the affiliated analysts will
issue a “strong buy” recommendation rises 16%, after statistical controls for stock characteristics and
performance are established.
Do reputation risk and career concerns restrain analysts’ optimism? As predicted by Ljungqvist et
al. (2005), we find that the large presence of institutional investors other than the affiliated mutual funds
curbs analyst optimism. However, the highly reputable all-stars are most optimistic in their reports when
they cover stocks held by the affiliated mutual funds. This result holds significantly in the multivariate
tests, after we control for several factors including the institutional presence. All-star analysts are more
likely to promote stocks that are less visible to other institutional investors in order to support the interests
of the fund family while retaining no chilling effect on their reputation. We argue that all-star analysts
build their reputation among institutional investors primarily on their neutral forecasting ability. We
5
recognize that career achievements also depend on optimism of their recommendations. Hong and Kubik
(2003) find that forecasters whose recommendations are accurate are likely to experience favorable career
outcomes. Then, controlling for accuracy, brokerage firms are likely to reward analysts who promote
stocks with ratings bolder than the consensus.3 Ljungqvist, Malloy, and Marston (2006) show that some
bold recommendations by all-stars have recently been “anonymized” from the 1993–2002 IBES tapes.
Consistent with our conjecture, these anonymizations concern some embarrassing recommendations
issued by analysts who have recently experienced positive career outcomes; whereas the anonymizations
affect no earnings estimate.
Do market participants recognize the bias from the mutual fund affiliation? In the short run, our
tests suggest that investors do not discount the quality of recommendations because of analyst incentives
to look favorably at stocks held by the fund family. On the contrary, investors seem to assign qualities of
superior information to the positive recommendations on the stocks in the affiliated fund portfolios.
Promoting these stocks with a rating of “strong buy” that beats the consensus yields a median three-day
abnormal return of 1.03% around the report day. If the issuing analyst is an all-star, a “strong buy” causes
a greater price impact for stocks held by the mutual fund family, 1.42% in median. As shown in
Malmendier and Shanthikumar (2005), we find only “strong buy” ratings produce a significantly positive
trade reaction. In the long run, value accrues to investors following the positive ratings on stocks held by
the affiliated mutual funds. “Strong buys” issued by affiliated analysts produce an annualized unadjusted
return of 14.64%, compared to 11.14% from “strong buys” by unaffiliated analysts (3.95% vs. 1.90% for
the Fama-French three-factor model returns). However, the affiliated analysts’ pessimism is less valuable
than their optimism. Following the “underperform” or “sell” ratings the affiliated analysts issue produces
an annualized unadjusted return of 5.81%. When the negative ratings are issued by unaffiliated analysts,
the return is equal to 8.31%. The evidence suggests that mutual fund affiliation may bias analysts’ 3Anecdotal news suggests that analysts’ bonuses are related to how they treat institutional investors. “Today analysts are hired not only to research companies and to select stocks. They are also expected to get out there and sell their research to big institutional clients, which then demand a great deal of their time and attention” (Fortune, October 1, 1990, p. 195). The Wall Street Journal (October 29, 1991, p. C1) reports the words of one research director: “Most of the guys know that they’ll be visiting for the Institutional Investor in the spring,” that is, making annual pilgrimages to see clients and implicitly lobbying for Institutional Investor votes. “I’m a lonely guy in March and April,” shortly before the balloting, he says, because all his analysts are out on the road.

6
promptness of releasing positive or negative stock reports.
This paper extends the literature on analyst optimism. Few authors have analyzed the important
relationships between brokerage analysts and mutual funds. The results show that the analyst’s connection
with the mutual fund family significantly affects his or her choice of continuing to cover and rate
positively the stocks in the fund portfolios. Irvine at al. (2004) is the study most pertinently related to this
idea. From analysis of earnings forecasts, the authors conclude that bundling sell-side research and asset
management services produces positive externalities for investors, such as more accurate analyst
estimates. Unlike their study, our analysis of analyst recommendations draws attention to some bundling
biases that are likely to generate negative externalities for investors.
Furthermore, this paper has relevant regulatory implications. The analysis of ties within a typical
full-service bank reveals that analysts are subject to different sources of pressure coming from different
directions. The analyst regulations of 2002 focus on the affiliation with the investment banking
department of a brokerage firm as a main source of biases for analyst research. Yet, the investment
banking affiliation partially explains analyst optimism in the long run. O’Brien, McNichols, and Lin
(2005) and James and Karceski (2006) find indeed that investment banking affiliation is likely to affect
research around the offering of new shares, but the related biases do not persist afterwards. Mutual fund
affiliation instead explains the persistence of analyst optimism. Comprehensive analysis of the pressure
analysts face to perform well would help develop an effective definition of independence criteria for sell-
side research.
The remainder of the paper is organized as follows. Section 2 contains the hypotheses of this
paper, while Section 3 describes sampling procedures and reports the frequency of analyst coverage for
our sample of seasoned stocks from 1995 to 2003. In Section 4, we present the univariate analysis of the
mutual fund affiliation as another explanation of analysts’ decisions to provide favorable stock coverage.
Section 5 shows the formal tests of our hypothesis using multivariate duration analysis as well as other
econometric methodologies to confirm the robustness of our results. Finally, in Section 6, we draw a
summary of our findings and their implications for future research.

7
2. Hypotheses and research design
Prior studies and recent anecdotal news have shown that the so-called Chinese walls between
investment banking and brokerage departments do not work well, since research is often used as a
marketing tool to support the underwriting business. As analysts can help the affiliated investment bank
by looking favorably at issuer-clients in their research reports, they may be encouraged to support the
affiliated asset-management business by positively recommending mutual fund investments. Following
the analogy about the investment banking affiliation, our first two hypotheses are as follows:
Hypothesis 1: Brokerage analysts are likely to provide coverage on stocks held by affiliated mutual funds. Hypothesis 2: Brokerage analysts are likely to provide an optimistic coverage on stocks held by affiliated mutual funds.
This paper explores the optimism of recommendations. Irvine at al. (2004) find that analyst
earnings forecasts for a stock become more accurate as the fund family’s ownership of that stock rises.
We argue that issuing optimistic recommendations on the stocks held by the affiliated mutual funds aligns
the incentives between brokerage firm and its mutual fund family. Favorable recommendations are likely
to attract order flows to the trading department (Jackson, 2005). Also, favorable recommendations are
likely to boost the short-term fund performance (Womack, 1996), especially, we argue, when they relate
to stocks with a significant weight in the family fund portfolios. So, our third hypothesis is as follows.
Hypothesis 3: The greater the weight of a stock investment in the mutual fund portfolios, the more optimistic the recommendations by affiliated analysts on that stock.
Testing these three hypotheses implies modeling analysts’ decisions about covering a stock over
time. In this study, a decision by analysts to report on a stock is structured as a time-to-event in a duration
model. To investigate the mutual fund pressure while controlling for the well-documented investment
banking pressure on analyst research for newly listed stocks, we focus on seasoned stocks. In particular,
we track all the seasoned stocks covered by brokerage analysts at the end of 1994 over a 36-quarter
sample period by taking into account several time-varying features of the “subject” and the “object” of
coverage, such as analysts’ recommendations on a stock and that stock’s weight in the family portfolios.
Data come from multiple databases, IBES, SDC, the 13f Institutional Holdings databases, the Center for

8
Research in Security Prices (CRSP), and CRSP/Compustat Merged.
Duration analysis has the methodological advantage of capturing causality links and also handling
censoring issues. First, the explanatory factors used to model the event of reporting on a stock may be
influenced by past occurrences of the event, duration analysis conditions on such past occurrences and
hence is well-suited to flesh out causal relationships.4 Second, duration models typically analyze the
occurrences of the event from time 0 when the event has occurred for all cross-sectional units, which are
left-censored by construction. While one may say that the cross-sectional structure of the sample is driven
by the arbitrary time selection, indeed, duration analysis explains the occurrences of the event exploiting
the time variation in the explanatory variables from the time origin. Also, in other techniques, such as
panel regressions that dummy the occurrence of the event, left-censoring and time selection may raise
statistical issues; this is not the case in duration models. Hazard regression models incorporate a positive
probability that the event may never occur for some of the cross-sectional units. This allows describing –
without dealing with complicated right-censoring issues– coverage stops over time.
3. Data and sampling procedures
Our data comprise all analysts who covered stocks by research reports during 1994, a year
characterized by an absence of particularly sensitive financial issues or market turbulence. The IBES
database identifies the names of analysts covering a given stock, the brokerage house the analyst works
for, and the report date. Clarke, Khorana, Patel, and Rau (2005) show that business relationships at the
brokerage firm level affect an individual analyst’s decision to cover a stock-issuing firm. Thus, we
explore the business relationships between stocks and the research departments of brokerage houses
(hereafter called research departments). The fact that listed companies report their analyst coverage
primarily by using the brokerage firm name, that is, not often by naming individual analysts, also supports
our approach at the research department level.
4 If Nt is the number of occurrences of the event up to time t and Xt is a set of variables which may at most depend on Nt-1, then the nature of the estimated relationship between Nt and Xt will be truly causal since duration analysis techniques explicitly stratify the process of Nt conditional on Nt-1.

9
Our sampling procedure lets us identify 16,824 observations as distinct relationships between
research department i and stock j (i = 1, 2, …, 154, and j = 1, 2, ..., 4,121). During 1994, 154 research
departments covered between one and 976 stocks; the average department covered 109.25 stocks. For
example, in 1994 Goldman Sachs issued research reports on 729 stocks, while Bear Stearns covered 478
stocks. Although some companies such as Intel Corp. are covered by both brokerage houses, the two
relationships, Goldman Sachs-Intel and Bear Stearns-Intel are distinct, and generate two separate
observations in our data set. It is the relationship between the research department and a covered stock
that is at issue.
Table 1 reports the main descriptive statistics for the sample of stocks. Twenty-nine percent of the
covered stocks are in the Standard & Poor’s 500 index. Only 10% are traded over-the-counter or on
regional exchanges, such as Boston, Chicago, Cincinnati, Pacific, and Philadelphia stock exchanges.
Stocks tend to be listed in the main U.S. markets, the NYSE, the Nasdaq, or the Amex, with NYSE-listed
companies being the most represented (59%). The sample includes utility stocks and tech stocks, in
roughly equal proportions (7% for both). Utility companies are identified as in the two-digit Standard
Industrial Classification (SIC) code of 49; tech companies are defined as in the four-digit SIC codes
reported in Loughran and Ritter (2004).
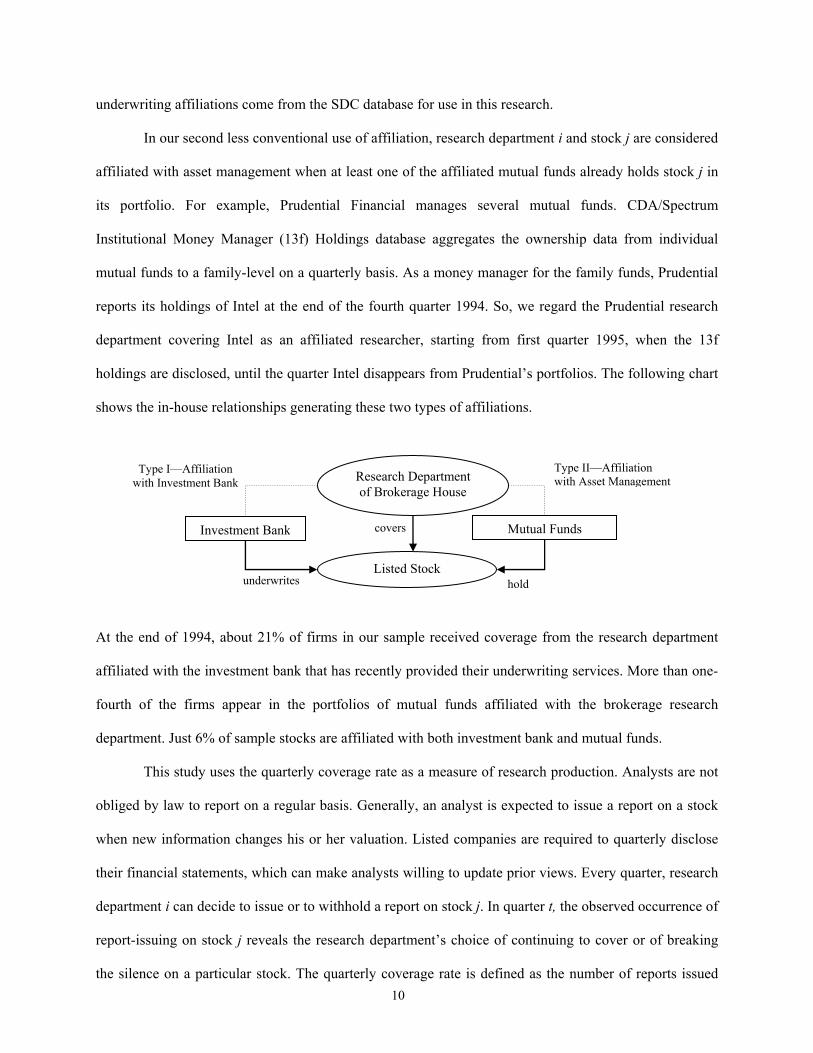
Two types of affiliation occur in the relationships between research department i and stock j.
While the first type of affiliation is commonly defined in the literature on analyst coverage, the definition
of the second type is less conventional. The first type of affiliation involves the research department’s
investment bank. Research department i and stock-issuing firm j are affiliated with an investment banking
if firm j’s securities were underwritten by the research department’s investment bank. In other words, an
affiliation exists when the in-house investment bank served as a lead or co-lead manager in the most
recent seasoned equity offering (SEO), debt issue, or if there is no SEO or debt issue then an affiliation
exists when the in-house investment bank was the lead or co-lead manager at the time of the IPO. A
business relationship between the issuer and non-managing syndicate is weak or it is not present
(Michaely and Womack, 1999; Ellis, Michaely, and O’Hara, 2000; Corwin and Schultz, 2005). Data on
10
underwriting affiliations come from the SDC database for use in this research.
In our second less conventional use of affiliation, research department i and stock j are considered
affiliated with asset management when at least one of the affiliated mutual funds already holds stock j in
its portfolio. For example, Prudential Financial manages several mutual funds. CDA/Spectrum
Institutional Money Manager (13f) Holdings database aggregates the ownership data from individual
mutual funds to a family-level on a quarterly basis. As a money manager for the family funds, Prudential
reports its holdings of Intel at the end of the fourth quarter 1994. So, we regard the Prudential research
department covering Intel as an affiliated researcher, starting from first quarter 1995, when the 13f
holdings are disclosed, until the quarter Intel disappears from Prudential’s portfolios. The following chart
shows the in-house relationships generating these two types of affiliations.
At the end of 1994, about 21% of firms in our sample received coverage from the research department
affiliated with the investment bank that has recently provided their underwriting services. More than one-
fourth of the firms appear in the portfolios of mutual funds affiliated with the brokerage research
department. Just 6% of sample stocks are affiliated with both investment bank and mutual funds.
This study uses the quarterly coverage rate as a measure of research production. Analysts are not
obliged by law to report on a regular basis. Generally, an analyst is expected to issue a report on a stock
when new information changes his or her valuation. Listed companies are required to quarterly disclose
their financial statements, which can make analysts willing to update prior views. Every quarter, research
department i can decide to issue or to withhold a report on stock j. In quarter t, the observed occurrence of
report-issuing on stock j reveals the research department’s choice of continuing to cover or of breaking
the silence on a particular stock. The quarterly coverage rate is defined as the number of reports issued
Investment Bank Mutual Funds
Research Department of Brokerage House
Listed Stock
Type I—Affiliation with Investment Bank
underwrites hold
covers
Type II—Affiliation with Asset Management
11
divided by the total number of possible coverage events. In the last quarter of 1994, research departments
in our sample released reports on less than a third of the stocks. The coverage rate was 27.87% (that is,
4,689 of 16,824 potential reports). The quarterly coverage rate thus defined is the initial productivity rate
of the research departments in our sample.
4. Univariate analysis
The last quarter of 1994 is taken as the baseline quarter 0. In this study we restrict analysis to the
set of 16,824 relationships between research departments and stocks over 36 consecutive quarters, from
the first quarter of 1995 through the fourth quarter of 2003. No other research departments and/or covered
stocks are added to our sample. As a result, the relationships are naturally subject to right-censoring
because of the concentration of brokerage firms in the securities industry and/or because of stock
delisting. Corwin and Schultz (2005) and Ljungqvist, Marston, and Wilhelm (2006) show that mergers
and acquisitions in the late 1990s significantly reduced the number of brokerage firms. We designate
research departments incorporated into an acquiring bank as inactive from the time of the acquisition,
since clienteles and analyst specialties may change after a merger. For example, we removed from our
design the Donaldson Lufkin & Jenrette research department in the last quarter of 2000 upon its
acquisition by Credit Suisse First Boston, even though individual analysts might have kept working for
the acquirer. As of the end of 2003, out of the initial 154, 86 research departments remained active.
Similarly, we eliminated stock-issuing firms that were delisted once they merged with other listed
companies. At the end of 2003, 1,941 stocks remained out of the initial 4,121. Over the nine-year period,
the combined censoring effects resulted in 5,920 of 16,824 relationships that were still active as of the end
of the 36th quarter.
Figure 1 plots the evolution of the coverage rate for the 1995-2003 period. Controlling for
censoring in the relationships between research departments and covered stocks, we find that the quarterly
coverage rate declines from about 20% to 10% throughout the first four years. During the three years
1999–2001, the production of reports on active stocks by active departments remains below 10%. This
12
low production may be explained by the uncertainty characterizing the 1999–2000 market bubble and its
subsequent burst in 2001. Limits in the research resources within brokerage firms may also explain the
reduced productivity. During that time, analysts’ attention might have been focused more on initiating
relationships with the newly listed bubble firms than on cultivating the established relationships with
seasoned firms. In 2002 market watchers witnessed a renewal in research productivity on the sample
stocks. In the third quarter of 2002, the coverage rate jumps to about 23%, even more than the
productivity rate recorded at the beginning of 1995. The major rise in September 2002 is temporary. In
2002–2003 the coverage rate again averages around 14%, to drop to 10% in the last quarter of 2003.
It is interesting to try to explain the spike in the number of reports released in third quarter 2002.
After the major stock indexes recovered from the lows reached in the direct aftermath of the September
11, 2001 attacks, they slid steadily starting in March 2002. The dollar declined against the euro, reaching
a one-to-one valuation not seen since the introduction of the European currency. Over the first half of
2002, the S&P 500 fell 14.6% for a variety of reasons: the burst of bubble conditions, a new recession
officially designated by NBER, and uncertainty attributed to the war in Afghanistan. In the third quarter
of 2002, the stock market recorded a further drop of 16.6%. The Dow Jones Industrial Average tumbled
to a four-year record low on September 24, 2002, while Nasdaq prices plummeted to a six-year low.
The first changes in analyst regulations were enacted during summer 2002 when the bear market
triggered concerns that investors might have been misled by biased analyst research. In July 2002,
following the provisions of the Sarbanes-Oxley Act, the NASD and NYSE set new rules (Rule NASD
2711, Rule NYSE 472) restricting communications between investment banking and research functions,
requiring analysts to disclose any financial interest in securities recommended and barring analysts from
doing personal trading around the time they issue research reports. Analysts since then have been required
to disclose the distribution of the ratings assigned to a given stock in the prior 12 months, along with the
percentage of buys, holds, and sells assigned to all covered stocks. On August 2, 2002, the Securities and
Exchange Commission (SEC) proposed the Analyst Certification Rule, which was released in April 2003.
It requires that any research report disseminated include both a certification that any assessments
13
expressed must accurately reflect the analyst’s personal views and an account of any compensation
received by the analyst to control the appearance, or any suggestion of, a conflict of interest.
Changing market conditions and changing regulations may have prompted analysts to write a
greater number of reports than normal to alter previous views on the sample stocks. Analysis of the
ratings provides some insights about this suggestion. On a five-point scale, where 1 is the best rating
(strong buy) and 5 the worst (sell), the ratings assigned by analysts during third quarter 2002 are, on
average, significantly worse than the ones in the preceding second quarter (2.60 compared to 2.27).
4.1. Hypothesis 1: Research coverage and mutual fund affiliation
In our sample, the average stock receives three reports over a nine-year period. Some stocks
receive quite consistent coverage. For example, HSBC James Capel released reports on Louis Vuitton
Moët Hennessy in 22 of the 36 quarters between 1995 and 2003. Other stocks see no coverage for long
periods, but then regain analysts’ attention (e.g., after seven years of silence, in November 2002 Bear
Stearns issued a report on May Department Stores). Another group of companies receives no coverage for
several years in a row so, at least ex post, we would reasonably infer termination of coverage.
Three main factors explain the production of research reports: stock characteristics, firm
performance, and research department characteristics.
1. Stock characteristics, such as size, listing exchange, and industry, may affect the probability
of a stock’s receiving research coverage. Prior studies have examined the stock features affecting the
number of analysts who follow a given stock, rather than the frequency of coverage. Chung (2000) states
that, in their duties of providing marketing aids to brokerage firms, analysts research high-quality stocks.
Large established companies included in benchmark industry indexes are likely to be regularly assessed
by more analysts. Bhushan (1989) finds that the number of analysts following a firm is positively
associated with the presence of institutional investors as firm’s shareholders. O’Brien and Bhushan (1990)
find that the number of analysts following a stock increases as that stock’s volatility declines. Analysts
are then more likely to cover regulated and less concentrated industries.
2. The operating performance of a stock-issuing firm is a likely determinant of coverage
14
decisions. The better the firm’s growth prospects, the higher the probability it will attract analyst
coverage. Also, Brennan and Hughes (1991) find that price performance is a significant determinant.
Their evidence shows that the number of analysts rises as the stock price falls, since brokers have
incentive to produce research on low price stocks to generate a greater quantity of trading commissions.
3. Research department characteristics include their size and affiliations. The size of research
departments may affect continuing release of reports. At the end of 1994, the median department
consisted of 38 analysts; interestingly, median department size more than doubled over our nine-year
sample period (with one possible cause that such a rise may be survival-biased). As research functions are
seen as increasingly important within an organization, research coverage is expected to be more frequent.
Affiliation with other banking departments is not supposed to affect decisions about whether a
research department will cover a stock. Even before the 2002 revised regulation to enforce the separation
between investment banks and their research departments, professional codes of conduct prescribed
independence as a necessary characteristic of analyst behavior. According to the independence principle,
affiliation with an investment bank is one characteristic of the research department that should cause
neither initiation of coverage nor its termination. Nor does the independence principle imply that a
research department’s affiliation with mutual funds should affect research productivity.
Table 2 assesses the relation between coverage rates and the major characteristics of stocks and
research departments. These characteristics and coverage rates are quarterly updated. That is, the
affiliation between research departments and investment banks is updated by checking the managing
syndicates of the 931 SEOs and the sample’s 28,280 convertible and nonconvertible debt issues during
the nine-year period. Similarly, a research department’s affiliation with mutual funds is updated by
analyzing the composition of portfolios quarter-by-quarter. The quarterly update of 13f institutional
holdings advises us to lag the affiliation assessment and designation by one quarter. When the
institutional investor reports the holding of stock j at the end of quarter t, the in-house research
department is considered affiliated starting from quarter t+1.
In the nine-year period, the average coverage rate of 11.93% for all active observations is taken as
15
a reference point. Not surprisingly, stocks in the S&P 500 index obtain research coverage at an above-
average rate; the same is true but to a lesser extent for stocks traded on the NYSE. Amex-listed stocks are
covered even less frequently than stocks traded over-the-counter or on regional exchanges. The average
utility stock also receives less attention than do tech stocks. More importantly, research department
affiliation matters. Despite what the analyst independence principle suggests, stocks underwritten by
affiliated investment banks receive above-average coverage (13.97%). Portfolio investments by mutual
funds also affect affiliated research departments’ selection of stocks covered (13.91%). Stocks benefiting
from both in-house affiliations receive the highest coverage of all (16.26%).
Over three subperiods, 1995–1998, 1999–2001, and 2002–2003, all stocks experienced a decline
in coverage in the middle period, 1999–2001. Yet, even in the bubble period, the two types of affiliation
are associated with above-average coverage rates. Interestingly, since 2002, utility stocks have received
more coverage than tech stocks, although a higher coverage rate does not necessarily imply optimism in
ratings. In fact, the increased coverage took place in the aftermath of the Enron scandal while major debt
issues were realized to finance projects in the newly deregulated energy markets.
Which performance indicator attracts analyst attention? To analyze the relation between analyst
coverage and firm operating performance, we use the market-book value ratio (MBV), actual earnings per
share (EPS), and revenues to measure, respectively, firm growth prospects, profitability, and efficiency.
MBV is defined as the sum of the market value of equity and the book value of long-term debt and
preferred stock, divided by the book value of total assets. Revenues are divided by total assets as a
measure of asset turnover. We include three more indicators: return on equity (ROE), dividend yield, and
leverage ratio. ROE is calculated as quarterly earnings divided by the book value of equity. The dividend
yield is defined as quarterly dividends per share divided by the closing price at the end of each quarter.
The leverage ratio is long-term debt divided by the book value of equity. All indicators are quarterly
updated. They are also one-quarter lagged.
We do not exclude the possibility that the choice of stocks that are reported may be also related to
technical analysis or price-momentum considerations. So, we look at the closing prices of stocks covered

16
during quarter t exceeding the 200-day moving average in the period. We use the 200-day moving
average for three reasons. First, a long period smoothes price trends and makes results less sensitive to
short-term volatility. Second, in a bull market, stock prices tend by construction to hover above their
shorter moving averages when the last closing price exceeds the 200-day moving average. This
phenomenon controls for the times the 200-day moving average is exceeded around the end of the quarter.
Third, technicians believe that the lower the percentage of listed stocks that are trading above their 200-
day moving average, the more bullish the market will be. In October 2002, NYSE-listed stocks dropped
below the 20% threshold. This plunge anticipated the beginning of a bull market in March 2003.
In Table 3, the analysis of the median economic and financial performance in quarter t-1 of firms
receiving reports in quarter t from 1995 through 2003 suggests that research departments generally pick
good stocks to present in quarterly reports. Stocks analyzed in analyst reports are those with higher
median MBV ratios or significantly higher quarterly earnings per share than stocks that have not been
covered. Growth prospects and profitability drive analysts’ decisions to produce reports, while efficiency
in the use of assets to generate revenues seems not to be a decisive factor in driving reporting. Stocks
receiving coverage have higher median revenues than the control firms until 1998, when a reversal in the
rankings occurs. By the end of the sample period, uncovered stocks report significantly higher revenues
than those covered. This evidence is consistent with the less optimistic analyst research, already
mentioned, in 2002.
Two-sample Wilcoxon rank-sum tests reported in Table 3 systematically confirm the significance
of the differences in median performance between stocks receiving coverage and stocks not in each
quarter. Subsample results indicate that stocks receiving quarterly coverage perform significantly better
by all indicators except for revenues and leverage ratios. In other words, less efficient and more indebted
firms receive preferential coverage, at least in the latter part of the sample period. All median indicators
report a decline over time, except for dividend yield.
4.2. Hypothesis 2: Optimistic research coverage and mutual fund affiliation
Figure 2 displays the distribution of ratings assigned by research departments on a five-point
17
scale (with 1 = strong buy, and 5 = sell). Bradley, Jordan, and Ritter (2003) note that analyst rating
schemes are not standardized, and can vary from one firm to another, so we use the standard IBES
recommendations. Analyst recommendations are mapped to one of the five standard values. If research
department i releases multiple reports on a given stock j in quarter t, we use the first rating. Rating
distributions are categorized by research department affiliations and subperiods.
Consistent with prior studies, we find research departments affiliated with investment banks that
had provided issuing companies with underwriting services tend to be favorable on issuer stocks. After
the Internet bubble burst, the favorable disposition toward the sample stocks weakens. In Panel A, the
distribution is highly right-skewed. In the first two subperiods, the buy recommendation is the mode and
the median point. When strong buys and buys are combined, they represent about 66% in the first
subperiod, 68% during 1999 to 2001, and 45% in the last two years. In this later period, although the
percentage of holds and underperforms rises considerably, there is no significant increase in the
proportion of sells. Kadan, Madureira, Wang, and Zach (2005) find that, after adoption of the new analyst
regulations, the likelihood of receiving an optimistic recommendation no longer depen ds on whether the
brokerage house had underwritten an equity offering. Yet analysts, especially affiliated analysts, remain
reluctant to release pessimistic recommendations. Panel B reports the rating distributions for research
departments that are unaffiliated with investment banks. The distribution of ratings assigned by research
departments affiliated with mutual funds in Panel C of Figure 2 looks the same as the distribution in Panel
A. Also, in Panel D, the rating distributions for analysts unaffiliated with mutual funds look similar to
those in Panel B. This similarity cannot be explained by overlaps between the two groups of affiliated
research departments; only 6% of stocks are affiliated with both investment banks and mutual funds as of
the end of 1994, and this proportion declines over years.
To examine analyst optimism in the recommendations, we divide each rating by the consensus,
defined as the average rating assigned by all analysts to stock j in quarter t, jt
j,it
ConsensusRating
. The quarterly
consensus is obtained from IBES as a partly exogenous variable, which considers all the ratings assigned
in the analyst industry, including those analysts who initiate coverage and those analysts who already

18
cover the sample stocks. As McNichols and O’Brien (1997) suggest, an initial bias in the selection of
stocks explains the optimism in the first rating as research coverage is initiated by analysts. Because our
sample includes only those research departments that are already covering stocks, the IBES consensus
results are on average more favorable than our sample ratings, 2.19 compared to 2.27. Scaling all ratings
by consensus helps comparing ratings for stocks being covered by different groups of research
departments. We distinguish between relative and absolute types of optimistic recommendations; that is,
affiliated research departments may rate more favorably the covered stocks than they would the
unaffiliated. We measure the relative optimism by a t-test of the difference between mean ratings sorted
by affiliation. Affiliated analysts may not only issue a greater number of favorable reports than do
unaffiliated analysts, but also more favorable reports than the rest of the industry. On a five-point scale
where five is the worst rating, a lower-than-one value of the rating indicates that the reporting analyst
absolutely agreed that stock j should have a more favorable rating than did the consensus. A value equal
to one indicates that the research department confirms the consensus with its recommendation.
Panel A of Table 4 reports the average rating divided by the consensus over the three subperiods.
Ratings are categorized by performance indicators. The market-book value ratio, earnings per share,
revenues, return on equity, dividend yield, and leverage ratio are one-quarter lagged. A performance
indicator is regarded as high when it exceeds the median quarterly value. Controlling for firm
performance, we find that an affiliation with a mutual fund significantly affects average research
department ratings. Over 1995–1998, stocks in affiliated fund portfolios unconditionally receive better
recommendations than those in unaffiliated funds; that is, research departments following seasoned stocks
that are held by the affiliated mutual funds are relatively favorable. In the 1999–2001 subperiod, the
affiliated analysts’ recommendations absolutely favored companies reporting less-than-brilliant
accounting performance. Firms with below-the-median market-book value, earnings per share, revenues,
and return on equity or firms that were highly leveraged are assigned better ratings, even more favorable
ones than are garnered by the consensus. Over the 2002–2003 period, the disposition of departments

19
affiliated with mutual funds becomes less favorable.5
Panel B of Table 4 tests whether all star-analysts issue favorable reports on stocks held by
affiliated institutional investors. The subsample covers only reports by all-stars, about 20% of the initial
sample. Throughout the nine-year period, all-star analysts report favorably on firms in which affiliated
mutual funds invest. Their relative optimism in the first subperiod becomes absolute in the second
subperiod. In 1999–2001, all-star analysts are absolutely more favorable than the consensus on stocks
held by affiliated institutional investors, whatever the performance indicators. Both good and poor
performers are absolutely favored. In the last subperiod, the favorable disposition is once more only
relative, and differences between the average ratings by affiliated and the average ratings by unaffiliated
analysts are generally not statistically significant. Finally, a comparison between two panels of Table 4
suggests that all-star analysts are the group giving the most positive ratings during 1999–2001, when they
cover stocks held by affiliated mutual funds (i.e., 0.97 compared to an overall mean of 1.00).
4.3. Hypothesis 3: Optimistic research coverage and affiliated fund holdings
What would motivate research departments to issue favorable ratings on stocks held by affiliated
institutional investors? We conjecture that brokerage firms may want to support the performance of
affiliated mutual funds. If so, we would expect that the more invested an institutional investor is in a
given stock, the more inflated the rating. Table 5 tests this hypothesis. Portfolio weight is the percent
weight of a stock investment in the affiliated fund portfolios at the end of the quarter. It is also lagged by
one quarter so that it is possible to see whether investment size affects the ratings subsequently assigned
by affiliated research departments, and not the reverse. From 1995 through 2003, the median stock
investment weighs 0.3% of the affiliated mutual funds (i.e., an investment of $3.8 million).
Panel A of Table 5 reports ratings (divided by the consensus) assigned by research departments
affiliated with mutual funds as portfolio weight rises. Throughout the nine-year period, research
departments are more favorably disposed toward stocks held in larger proportions by the affiliated mutual
5 We also run a nonparametric Wilcoxon rank-sum test and obtain similar results. Our concern is that the assumptions of t-test may not be met, since the ratio of two normal variables is generally non-normal (Marsaglia, 1965; Hinkley, 1969).
20
funds. From the first third (the small portfolio weight tercile) to the highest third (the large portfolio
weight tercile), stocks generally receive more optimistic ratings. The relation between weight size and
positive ratings is generally monotonic, although the t-tests for differences in means between the highest
and the lowest third are not statistically significant, except for the last subperiod. Panel B of Table 5
focuses on all-star analysts. From 1999 to 2001, they assign ratings more favorable than the consensus to
those stocks largely held by affiliated investors. This finding represents some evidence that analysts issue
optimistic recommendations on stocks that figure prominently in the portfolios of affiliated mutual funds.
In the following section we test our hypotheses while controlling for other factors.
5. Multivariate Analysis
In quarter t, each research department i decides either to release a report or to be silent on stock j.
This choice is not independent of choices that the research department made previously. Relative to the
previous quarter t-1, in quarter t research departments select one of four observable outcomes or
behaviors: issuing another research report, switching to silence (reflecting a pause in coverage),
continuing to be silent, or breaking the silence with a new report. We define the choice of covering a
stock with at least one report as a failure event that is sampled at a quarterly frequency. Our study of the
decision to continue research coverage is framed as a multiple failure-time analysis, also called
multivariate duration analysis.
5.1. Multivariate duration analysis
Recurrent event data are frequently encountered in biomedical and economics investigations and,
we assert, they are suitable though not traditional in financial analyses. Time-to-event studies arise when
two or more events may occur for each observation unit or subject. In our study, the subject is a unique
pair consisting of research department i and stock j, and the “failure” event consists of issuing a report in
quarter t. We treat the events according to a conditional-risk set model (Prentice, Williams, and Peterson,
1981): a subject is not at risk of precipitating a second event until the first event has occurred, and so on.
Thus, the conditional-risk set at time t for the event n concerns only all subjects under observation that

21
have already experienced event n-1. Formally, let Z(t) denote the vector of covariates at time t≥0, and
N(t) denote the number of failures prior to time t. The counting process for N(t) is described by a random
variable, assumed to be continuous. The hazard or intensity function λ(t) is defined as the instantaneous
rate of failure at time t, given the covariates and counting processes at time t:
( ){ } ( ){ } t )t(Z),t(N|ttTt Prlim tZ),t(N|t 1tn0t∆∆λ
∆+<≤= +→
.
Intuitively, the hazard function is similar to the instantaneous probability that a research department will
provide coverage, conditional on the history of decisions about whether to issue reports or not. In
practice, we estimate the following Cox proportional-hazard model: ( ){ } ] Z' exp[)t( tZ|t t0 βλλ = ,
where λ{⋅} is called the hazard function, and λ0{⋅} is the baseline hazard. We estimate the baseline hazard
non-parametrically and the vector β illustrating the explanatory variables Zt by maximum likelihood. The
nonparametric, data-driven estimate of λ0{⋅} makes results considerably robust.
Our sample consists of research departments covering stocks during 1994. The last quarter of
1994 marks date 0, and data are left-censored by construction. We count the initial failure that is common
to all stocks in our sample as a zero event. The counting process ranges, then, from zero to 22 failure
events over 36 quarters, with 22 being the maximum number of reports written across all stocks. Time-
varying covariates for the probability of providing coverage on seasoned stocks are:
λ{t/N(t), Z(MARKET RETURNt, S&P500 COMPONENTt dummy, NASDAQ-LISTEDt dummy, AMEX-LISTEDt dummy, OTHER EXCHANGESt dummy, UTILITYt dummy, TECHt dummy, LNASSETSt-1, MARKET-BOOK VALUE RATIOt-1, EPS/Pt-1, REVENUES/ASSETSt-1, ROEt-1, DIVIDEND YIELDt-1, LEVERAGE RATIOt-1, PRICE EXCEEDING 200-DAY MOVING AVERAGEt dummy, SEOt dummy, RESEARCH DEPARTMENT SIZEt, AFFILIATION WITH INVESTMENT BANKt dummy, SWITCH OF INVESTMENT BANKt dummy, AFFILIATION WITH MUTUAL FUNDSt-1 dummy)}.
The first seven covariates relate to market conditions and firm characteristics. MARKET RETURN is
determined by using the CRSP value-weighted NYSE/Amex/Nasdaq index. The S&P500 COMPONENT is
a dummy equal to one when the stock is in the Standard & Poor’s 500 index at the end of each quarter.
NASDAQ-LISTED, AMEX-LISTED, and OTHER EXCHANGES are dummies for the listing on the Nasdaq,
Amex, and other markets. UTILITY and TECH are dummies equal to one when companies operate,
respectively, in the two-digit SIC code of 49, and in the four-digit SIC codes specified in Loughran and

22
Ritter (2004).
To avoid a look-ahead bias, all accounting indicators refer only to the prior quarter t-1. LNASSETS
is the natural logarithm of total assets. MARKET-BOOK VALUE RATIO is defined as the sum of the market
value of equity and the book values of long-term debt and preferred stock, which are then divided by the
book value of total assets. EPS/P is defined as earnings per shares divided by price to adjust for stock
splits or reverse stock-splits. REVENUES/ASSETS are quarterly sales divided by total assets. ROE is
quarterly earnings divided by the book value of equity. DIVIDEND YIELD is quarterly dividends per share
divided by the closing price at the end of the quarter. LEVERAGE RATIO is long-term debt divided by the
book value of equity. PRICE EXCEEDING 200-DAY MOVING AVERAGE, equal to one when the daily price
happens to exceed the 200-day arithmetic moving average in quarter t, is intended to capture momentum
in the decision to research a firm. SEO is a dummy variable equal to one when the company makes a new
equity offering in quarter t.
To account for research department characteristics, RESEARCH DEPARTMENT SIZE is defined as
the IBES number of analysts working for a research department. AFFILIATION WITH INVESTMENT BANK
has a value of one when the research department is affiliated with an investment bank in the managing
syndicate for the stock covered. SWITCH OF INVESTMENT BANK is equal to one when the issuing firm
selects a new investment bank as a lead or co-lead manager for offering new securities. This dummy
variable marks the end to the firm’s relationship with an investment bank that was used during a prior
equity or debt issue. AFFILIATION WITH MUTUAL FUNDS has a value of one when the research department
is affiliated with mutual funds holding, in quarter t-1, the stock covered.
Table 6 reports the coefficients for the Cox regression model. Lin and Wei’s (1989)
heteroskedasticity-robust z-statistics are reported in parentheses. Regression 4 confirms the results of the
univariate analysis. Stocks reporting good accounting and financial performance are consistently covered.
Firm size calculated as book value of assets is inversely associated with the probability the stock will be
followed. A research department’s choice of covering a stock is also affected by an SEO and price

23
momentum.6 The last three regressors in specification 4 are directly useful in testing our relevant
hypothesis. All these estimated coefficients are statistically significant. The first variable, expressing
affiliation between research department and an investment bank, affects analysts’ decisions to continue
providing research on a stock. Although hazard ratios are not reported in Table 6, they support a clearer
interpretation than do the coefficients. When an issuer selects an investment bank that is a company other
than its former underwriter to manage an offering of new securities, the probability that the former
underwriter will continue reporting on the issuer’s stock declines by 30%. Krigman, Shaw, and Womack
(2001) suggest that one reason companies change to a new underwriter for managing an SEO is to get
higher-quality research coverage. The flip side of that coin seems to be that, once an investment bank is
no longer an underwriter, the affiliated research department has no incentive to maintain continuous
coverage on the stock. Mutual fund affiliation significantly drives the researchers’ decision to continue
covering a stock. When affiliated mutual funds have been investing in a stock in quarter t-1, the
probability that stock will be covered in quarter t rises by 21%. The last regression model in Table 6
includes in the model the dummy variable, ALL-STAR ANALYST, which is equal to one, when the analyst
assigning the rating belongs to the All-American Research Team, as selected by Institutional Investor
every October. An extremely high probability exists that the analyst providing coverage on the stocks in
the family portfolios will be an all-star.
We also estimate Cox regression models that define the “failure” event as the decision of a
research department to issue at time t a recommendation that is better than that given through the
quarterly consensus. The probability of being absolutely favorable toward a stock is explained by the
same covariates when related to market returns, firm characteristics, accounting and financial
performance, and research department features. In regression Table 7, the coefficient for market returns is
positive and significant. The larger the covered company, the less likely it is to receive a rating higher
than the consensus gives. The momentum indicator drives research optimism. In regression 1, both
6 When we replace the PRICE EXCEEDING 200-DAY MOVING AVERAGE dummy with the stock price at the end of quarter t-1, we still find the probability of covering a stock is positively associated with its price level. This result differs from the finding in Brennan and Hughes (1991).

24
affiliation dummies have positive and significant coefficients. When an investment bank underwrites the
stock, the affiliated analysts are 5% more likely than are unaffiliated analysts to continue looking
favorably on that stock-issuing firm in their reports. Yet, when mutual funds hold a stock, the affiliated
research department is 32% more likely than are unaffiliated departments to continue providing favorable
coverage on that stock. In regression 2, the model predicts the probability of beating the consensus with a
strong buy. The coefficient of DIVIDEND YIELD is not significant anymore, while MARKET-BOOK VALUE
RATIO as a proxy for a firm’s growth prospects becomes a significant determinant of analysts’ decisions
of strongly recommending a stock. The affiliated research department is now 20% more likely than are
unaffiliated departments to promote a stock with a strong buy.
The question then becomes: what drives (curbs) the optimism of the brokerage research affiliated
with mutual funds? Regression model 3 suggests some answers. This model focuses on the subsample of
relationships between research department i and stock j that are characterized by affiliation with
relationships between that same research department and mutual funds at time t-1. In particular, this
model replaces the AFFILIATION WITH MUTUAL FUNDS dummy with WEIGHT IN AFFILIATED MUTUAL
FUNDS and LNAMOUNT INVESTED BY AFFILIATED MUTUAL FUNDS. While WEIGHT IN AFFILIATED
MUTUAL FUNDS is the percentage of the dollar amount invested in stock j by affiliated money managers
divided by all 13f holdings in quarter t-1, LNAMOUNT INVESTED BY AFFILIATED MUTUAL FUNDS is the
logarithm of the dollar amount invested in stock j. We expect a positive coefficient for WEIGHT IN
AFFILIATED MUTUAL FUNDS, after we control for the investment amount.
Regression 3 includes three more variables for analysts’ reputation risk. As in Ljungqvist et al.
(2005), the first variable, HOLDINGS BY OTHER MUTUAL FUNDS, controls for the institutional presence in
a firm’s equity. All institutional investors with over $100 million in assets under management must
disclose their holdings quarterly. We use CDA/Spectrum to determine HOLDINGS BY OTHER MUTUAL
FUNDS as the percent ratio between shares that are held by all unaffiliated mutual funds at the end of
quarter t-1 and shares outstanding. NUMBER OF OTHER MUTUAL FUNDS, the second variable, is the
number of unaffiliated institutional investors in stock j. We expect the NUMBER OF OTHER MUTUAL

25
FUNDS, like HOLDINGS BY OTHER MUTUAL FUNDS, to moderate analyst optimism. The higher the
number of unaffiliated institutional investors in stock j, the higher the votes in the Institutional Investor
poll at stake. The third variable is the ALL-STAR ANALYST dummy.
Results in regression 3 suggest that the higher the weight of the stock in the affiliated fund
portfolios, the more optimistic the rating assigned. When a mutual fund family increases 1% the weight of
a stock investment, the probability that the affiliated analysts will issue a recommendation more favorable
than the consensus rises 16%. The presence of other institutional investors does moderate analyst
optimism. Yet, all-star analysts are associated with overly optimistic ratings. Regression 4 reports similar
results for the probability of surprising the consensus with a strong buy on a seasoned stock. The
affiliation with mutual funds significantly explains the continuing optimism in the analyst ratings.
Interestingly, for the subsample of research departments affiliated with mutual funds, the coefficient of
AFFILIATION WITH INVESTMENT BANK is now negative.
5.2. Robustness checks
This paper applies a number of robustness checks to our empirical results. We verify, first, that
our findings on the importance of the mutual fund affiliation do not depend entirely on the duration
analysis method. We start by applying standard-probit regression methods to the probability that research
departments will issue a report on a given stock. While duration analysis models the conditional
probability of failure, standard probit assumes independence over time. Untabulated results systematically
replicate the models estimated in Table 6 for Hypothesis 1. The correspondence between signs and
significance levels for most variables is striking. Focusing on model 4 in Table 6, we find that only two
coefficients out of 20 switch signs, NASDAQ-LISTED and DIVIDEND YIELD, but neither of them relate
directly to our hypothesis 1, which remains confirmed. Mutual fund affiliation significantly increases the
probability that a given stock will be covered. The same results are obtained either by bootstrapping the
standard errors of the probit or by estimating a logistic regression. We conclude that our results on the
determinants of coverage do not depend on modeling persistence in behavior by duration methods.
Second, we use probit and logit methods to test Hypothesis 2 about the probability that affiliated
26
research departments will assign a rating more favorable than does the consensus. Although a few of the
(robust) z-scores decline, judging from the results of Table 7, this situation does not occur for the relevant
variables. Research departments covering stocks that are highly represented in the portfolios of affiliated
institutional investors keep issuing recommendations that are more favorable than the consensus. The
associated estimated coefficients are significant.
Third, we expand the set of variables controlling for business-cycle conditions to include lagged
values of the growth rate of standard macroeconomic indicators, such as GDP, inflation (as measured by
the CPI), and the federal funds rate. The macro controls are significant, and they show the expected signs,
signaling that better general conditions foster optimistic recommendations. Although the quarterly market
return loses its significance, all other variables of interest maintain the same sign as in regression model 1
of Table 7, and most estimated coefficients hardly change value or significance level.
Fourth, one might ask how robust the results are under subperiod analysis. In the context of
duration analysis, this question is far from natural, because dividing a sample into subperiods would alter
the natural structure of the baseline period and the dynamics of the failure events over subsequent periods.
Thus we use probit techniques because they assume temporal independence of the failure events. Using
shorter samples generally implies lower z-scores throughout, as one would expect. The signs of a few
firm- or stock-specific control variables become unstable.7 Once more, our main insights of Table 7 turn
out to be robust over time. The positive estimated coefficient for the portfolio weight of a stock in the
affiliated fund portfolios is not time-sensitive. The tendency of analysts, especially all-stars, to issue
favorable ratings is higher during the bubble period, but remains significant and positive throughout.
Finally, we experiment with the random-effects generalized least squares (GLS) models that
Ljungqvist et al. (2005) use in a related application. Similarly, we model a continuous indicator of
research optimism—defined as the ratio between the rating and the consensus—as a function of
firm/stock characteristics and research department features specified in Table 7 (model 3). We obtain two 7 Some sign switches are illusory because the corresponding coefficients fail to be significant at standard size-levels across estimated models. The only statistically significant coefficient involves market returns, although the intuition is straightforward; during 2002–2003 when market prices generally declined, research departments—under the pressure of impending new regulations—paid considerable attention to increasing the coverage provided and to reducing the bias in their recommendations.

27
distinct sets of GLS coefficient estimates, depending on whether we model research department- or
firm/stock-level unobserved heterogeneity.8 A larger institutional presence in the firm’s equity makes
optimism less likely. Yet, all-star designation makes optimism more likely, whatever the econometric
framework.
5.3. Simultaneity issues
Univariate and multivariate models as well as a variety of econometric techniques show that the
affiliation with mutual funds is associated with a more continuing and favorable analyst coverage. But
these results formally establish no causal link between mutual fund affiliation and analyst research.
Researchers might be concerned that a simultaneous effect may be occurring: mutual funds invest in stock
j upon the analysts’ recommendations. If so, a behavioral claim about analyst incentives cannot be
established. To explore the issue, this study estimates random-effects GLS regressions where the change
(between quarter t-1 and quarter t) in the shares held by affiliated mutual funds is explained by a number
of variables, including optimism of the in-house analysts in quarter t-1.9 Under the null hypothesis of no
simultaneity (that is, that mutual fund affiliation causes analysts’ behaviors) and hence affiliation
generates a causal relationship, we expect that analyst optimism will fail to explain significantly the
subsequent portfolio rearrangements of in-house mutual funds.
As reported in columns 1 of Table 8, past optimism of affiliated analysts fails to explain changes
in mutual fund holdings. We obtain two sets of GLS coefficient estimates, depending on whether we
model research department- or firm/stock-level unobserved heterogeneity. At both levels, change in the
institutional presence is the main significant explanatory factor with a positive coefficient. We find no
evidence that favorable ratings are followed by any significant change in holdings by the in-house mutual
funds. The evidence is at odds with a two-way simultaneous feedback system and supports instead the 8 Formally, Opti,j
t is a variable measuring the optimism (relative to the consensus) of research department i on stock j at time t. Random-effects panel analysis decomposes the general random error term εi,j
t into the sum υi + ηj + ωt. Each error term represents unobserved heterogeneity of optimism across research departments, stocks, and over time. Following Ljungqvist et al. (2005), we simplify the estimation problem by experimenting with either research department or time heterogeneity or firm and time heterogeneity. Provided the two sets of coefficients are similar, as it turns out to be the case in our results, choosing one or the other assumption will make little difference. 9 When more reports are issued by research department i on stock j in one quarter, we examine alternatively the analyst ratings in the first report and those in the last report for the quarter. In the second alternative, the mutual funds have a longer time to adjust their portfolios. We find the results are insensitive to this choice.

28
idea that affiliation causes analysts to be favorable toward stocks in the family portfolios.10
In columns 2 of Table 8, we replicate the analysis using variables reflecting the contemporaneous
optimism (in quarter t) of in-house analysts, and here we find identical results. This version of the model
reflects the possibility that information may efficiently flow within full-service banks so that analyst
optimism may be reflected in the contemporaneous portfolio behavior of the affiliated funds. Random-
effects regressions fail again to highlight any significant impact of analyst optimism on mutual fund
behavior. Also, when all-star analysts release a rating more favorable than the consensus offers, the
affiliated mutual funds will not significantly change their holdings in the covered stock.
5.4. Value of analyst optimism
What is the value of analysts’ optimism? Does their favorable disposition affect stock prices?
Table 9 suggests answers to these questions in the short run. We use Eventus® for Cross-Sectional
Analysis to determine the three-day abnormal returns for each stock that receives coverage. Day 0 marks
the report date. Market-adjusted returns are determined using the CRSP equally weighted
NYSE/Amex/Nasdaq index. To control for dependence of returns, we choose a 255-trading day
estimation period starting 46 days before the event date. We categorize the median three-day abnormal
returns as an effect of the rating assigned. As reported in Figure 2, underperform and sell ratings represent
such low percentages that it would not be informative to report them separately. To control for market
expectations, we also categorize by rating position relative to the consensus. In fact, Michaely and
Womack (1999) suggest that investors expect affiliated analysts to look favorably on the issuing firms,
and market participants discount lead underwriter analysts’ buy recommendations. Lin and McNichols
(1998) report that, in the SEO market, the three-day returns on lead underwriter analysts’ hold
recommendations are significantly more negative than the three-day returns on unaffiliated analysts’ hold
recommendations. Investors expect that lead underwriter analysts are more likely to recommend a hold
10 We collect some evidence of a negative association between favorable analyst ratings and change in portfolio weight. In other words, asset managers are likely to sell stocks in the wake of favorable recommendations. The most important explanatory variables are the changes in market-book value, revenues/assets, and stock price. Overall, evidence shows that mutual funds prefer companies with stronger fundamentals, consistent with the findings in Field and Lowry (2005). Detailed results are available on request.
29
when they mean sell.
Surprising the market with extreme ratings, whether positive or negative, is an informative move
when research departments are affiliated with mutual funds. However, markets react significantly to
strong buys reported by these analysts. The median price impact of a strong buy assigned by analysts
affiliated with mutual funds is 1.03% (the mean is 1.70%). This abnormal return is significantly higher
0.68% in median (1.29% on average) than the change reported by stocks receiving strong buys from
unaffiliated research departments. A hold recommendation is generally considered bad news. When
research departments affiliated with mutual funds issue such a negative rating that is less favorable than
the consensus, stocks display a slightly more negative abnormal return than stocks rated that way by
unaffiliated analysts (the difference is significant at the 3% level). In a result different from that for
research departments affiliated with investment banks, a rating of “hold” here does not suggest that
market participants should sell, but that the stock is underperforming.
In the long run, value accrues to investors following the positive ratings on stocks held by the
affiliated mutual funds. Following Barber, Lehavy, McNichols, and Trueman (2001), we form portfolios
based on analyst recommendations and examine their long-run performance. In particular, on the day a
recommendation is issued on a given stock, we systematically act upon that recommendation, by buying
stocks that receive “strong buy” or “buy” ratings, and by selling short stocks that receive “underperform”
or “sell” ratings. As in Barber et al. (2001), the portfolios built are value-weighted, that is, each stock is
purchased or sold in a proportion equal to its relative weight on the total market portfolio. We report the
raw (unadjusted) returns along with abnormal (adjusted) returns, which are returns in excess of
compensation for risk would justify. Measures of abnormal returns correspond to two standard asset
pricing models: the market model and the three-factor Fama and French model.
As reported in Panel A of Table 10, systematically investing in the “strong buys” issued by
affiliated analysts produces an annualized unadjusted return of 14.64%, compared to 11.14% from
investing in the “strong buys” by unaffiliated analysts (3.95% vs. 1.90% for the Fama-French three-factor
model returns). However, the affiliated analysts’ pessimism is less valuable than their optimism.
30
Following the “underperform” or “sell” ratings the affiliated analysts issue produces an annualized
unadjusted return of 5.81%. When the negative ratings are issued by unaffiliated analysts, this return is
equal to 8.31%. These results suggest that the mutual fund affiliation biases analysts’ promptness of
releasing negative stock reports. Panels B and C report the rating values categorized by affiliation and all-
star status. Interestingly, for investors, returns following strong buys by affiliated non-all stars are higher
than the ones by affiliated all-stars.
6. Conclusions
What makes an analyst’s research on seasoned stocks optimistic? After studying a large sample of
recommendations provided by sell-side analysts on seasoned stocks for over 36 quarters from 1995 to
2003, we find that analysts’ decisions to provide a favorable coverage on seasoned stocks are influenced
by their affiliation with mutual funds. Analysts, especially all-stars, are significantly optimistic about
stocks that are held by affiliated mutual funds. In the 1999–2001 subperiod, firms with low growth
prospects or modest accounting performance received favorable ratings, and ratings that are even more
favorable than the consensus offered them.
Controlling for several factors including the investment banking affiliation, our results show,
first, that the more the affiliated mutual funds weigh a stock in their portfolios, the higher the analyst
optimism. Second, promoting stocks with a strong buy that beats the consensus produces a median three-
day abnormal return of 1.03% around the report day (1.42% when the promoting analyst is an all-star).
We conjecture that analyst optimism aligns the incentives between a mutual fund family and its affiliated
brokerage firm. While the short-term performance of the affiliated fund family benefits from the issue of
favorable research on a stock that has a significant portfolio weight, the analyst’s brokerage firm may
attract a higher order flow (Jackson, 2005).
This study provides some insight into the competing pressures analysts face when their jobs are
within full-service banks and the related problems in developing an effective regulatory framework.
While the new NASD, NYSE, and SEC rules restrict communications between research departments and

31
affiliated investment banks, our results highlight the significance of the relationship between research
departments and affiliated portfolio managers. Indeed, the significance of this second linkage is meant to
enhance. As a result of the new analyst rules, brokerage firms will be likely to replace the objective of
generating underwriting business with the objective of generating trading business. Recent news of
mutual-fund trading abuses that engage large brokerage houses and their favored institutional clients
provide insight into this redirection of goals. That is, as The Wall Street Journal affirmed in this regard in
2003, “Stock analysts still put their clients first.”
32
References
Barber, B., Lehavy, R., McNichols, M., Trueman, B., 2001. Can investors profit from the prophets? Security analyst recommendations and stock returns. Journal of Finance 56, 531–563.
Bhushan, R., 1989. Firm characteristics and analyst following. Journal of Accounting and Economics 11, 255–274.
Bradley, D., Jordan, B., Ritter, J., 2003. The quiet period goes out with a bang. Journal of Finance 56, 1–36.
Brennan, M., Hughes, P., 1991. Stock prices and the supply of information. Journal of Finance 46, 1665–1691.
Cheng, Y., Liu, M., Qian, J., 2006. Buy-side analysts, sell-side analysts, and investment decisions of money managers. Journal of Financial and Quantitative Analysis 41, 51–83.
Chung, K., Cho, S.-Y., 2005. Security analysis and market making. Journal of Intermediation 14, 114–141.
Chung, Kee H., 2000. Marketing of stocks by brokerage firms: the role of financial analysts. Financial Management 29, 35–54.
Clarke, J., Khorana, A., Patel, A., Rau, R., 2005. The impact of all-star analyst job changes on their coverage choices and investment banking deal flow. Journal of Financial Economics, forthcoming.
Conrad, J., Johnson, K., Wahal, S., 2001. Institutional trading and soft dollars. Journal of Finance 56, 397–416.
Corwin, S., Schultz, P., 2005. The role of IPO underwriting syndicates: pricing, information production, and underwriter competition. Journal of Finance 60, 443–486.
Dorfman, J., 1991. Analysts devote more time to selling as firms keep scorecard on performance. Wall Street Journal, October 29, C1.
Dugar, A., Nathan, S., 1995. The effects of investment banking relationships on financial analysts’ earnings investment recommendations. Contemporary Accounting Research 12, 131–160.
Ellis, K., Michaely, R., O’Hara, M., 2000. When the underwriter is the market maker: an examination of trading in the IPO aftermarket. Journal of Finance 55, 1039–1074.
Field Casares, L., Lowry, M., 2005. Institutional vs. individual investment in IPOs: the importance of firm fundamentals. Unpublished working paper, Pennsylvania State University.
Fisher, A., 1990. Can you trust analysts’ reports? Fortune, October 1, 195.
Francis, J., Philbrick, D., 1993. Analysts’ decisions as products of a multi-task environment. Journal of Accounting Research 31, 216–230.
Gaspar, J.-M., Massa, M., Matos, P., 2006. Favoritism in mutual fund families? Evidence on strategic cross-fund subsidization. Journal of Finance 61, 73–104.
Griffin, J., Harris, J., Topaloglu, S., 2005. Why are IPO investors net buyers through lead underwriters? Journal of Financial Economics, forthcoming.
Hayes, R., 1998. The impact of trading commission incentives on analysts’ stock coverage decisions and earnings forecasts. Journal of Accounting Research 36, 299–320.
Hinkley, D., 1969. On the ratio of two correlated normal random variables. Biometrika 56, 635–639.
33
Hong, H., Kubik, J., 2003. Analyzing the analysts: career concerns and biased earnings forecasts. Journal of Finance 58, 313–351.
Irvine, P., 2001. Do analysts generate trade for their firms? Evidence from Toronto stock exchange. Journal of Accounting and Economics 30, 209–226.
Irvine, P., Lipson, M., Puckett, A., 2006. Tipping. Review of Financial Studies, forthcoming.
Irvine, P., Nathan, S., Simko, P., 2004. Asset management and affiliated analysts’ forecasts. Financial Analysts Journal 60, 67–78.
Jackson., A., 2005. Trade generation, reputation, and sell-side analysts. Journal of Finance 55, 673–717.
James, C., Karceski, J., 2006. Strength of analyst coverage following IPOs. Journal of Financial Economics 82, 1–34.
Johnson, W., Marietta-Westberg, J., 2005. Universal banking, asset management, and stock underwriting. Unpublished working paper, Michigan State University.
Kadan, O., Madureira, L., Wang, R., Zach, T., 2005. Conflicts of interest and stock recommendations. The effects of the global settlement and related regulations. Unpublished working paper, Washington University at St. Louis.
Krigman, L., Shaw, W., Womack, K., 2001. Why do firms switch underwriters? Journal of Financial Economics 60, 245–284.
Lin, D. Y., Wei, L. J., 1989. Robust inference for the Cox proportional hazards model. Journal of the American Statistical Association 84, 1074–1078.
Lin, H.-W., McNichols, M., 1998. Underwriting relationships, analysts’ earnings forecasts and investment recommendations. Journal of Accounting and Economics 25, 101–127.
Ljungqvist, A., Malloy, C., Marston, F., 2006. Rewriting history. Unpublished working paper, New York University.
Ljungqvist, A., Marston, F., Starks, L., Wei, K., Yan, H., 2005. Conflicts of interest in sell-side research and the moderating role of institutional investors. Journal of Financial Economics, forthcoming.
Ljungqvist, A., Marston, F., Wilhelm, W., 2006. Competing for securities underwriting mandates: banking relationships and analyst recommendations. Journal of Finance 61, 301–340.
Loughran, T., Ritter, J., 2004. Why has IPO underpricing changed over time? Financial Management 33, 5–37.
Malmendier, U., Shanthikumar, D., 2006. Are small investors naïve about incentive? Unpublished working paper, Stanford University.
Marsaglia, G., 1965. Ratios of normal variables and ratios of sums of uniform variables. Journal of the American Statistical Association 60, 193–204.
McNichols, M., O’Brien, P., 1997. Self-selection and analyst coverage. Journal of Accounting Research 35, 167–199.
Michaely, R., Womack, K., 1999. Conflict of interest and the credibility of underwriter analyst recommendations. Review of Financial Studies 12, 653–686.
Nanda, V., Wang, J., Zheng, L., 2004. Family values and the star phenomenon: strategies of mutual fund families. Review of Financial Studies 17, 667–698.
Nimalendran, M., Ritter, J., Zhang, D., 2006. Do today’s trades affect tomorrow’s IPO allocations? Journal of Financial Economics, forthcoming.

34
O’Brien, P., Bushan, R., 1990. Analyst following and institutional ownership. Journal of Accounting Research 28, 55–76.
O’Brien, P., McNichols, M., Lin, H.-W., 2005. Analyst impartiality and investment banking relationships. Journal of Accounting Research 43, 623–650.
Prentice, R., Williams, B., Peterson, A., 1981. On the regression analysis of multivariate failure time data. Biometrika 68, 373–379.
Reuter, J., 2005. Are IPO allocations for sale? Evidence from mutual funds. Journal of Finance, forthcoming.
Ritter, J., Zhang, D., 2005. Affiliated mutual funds and the allocation of initial public offerings. Journal of Financial Economics, forthcoming.
Smith, R., 2003. Stock analysts still put their clients first. Wall Street Journal April 7, C1.
Stickel, S., 1992. Reputation and performance among security analysts. Journal of Finance 47, 1811–1836.
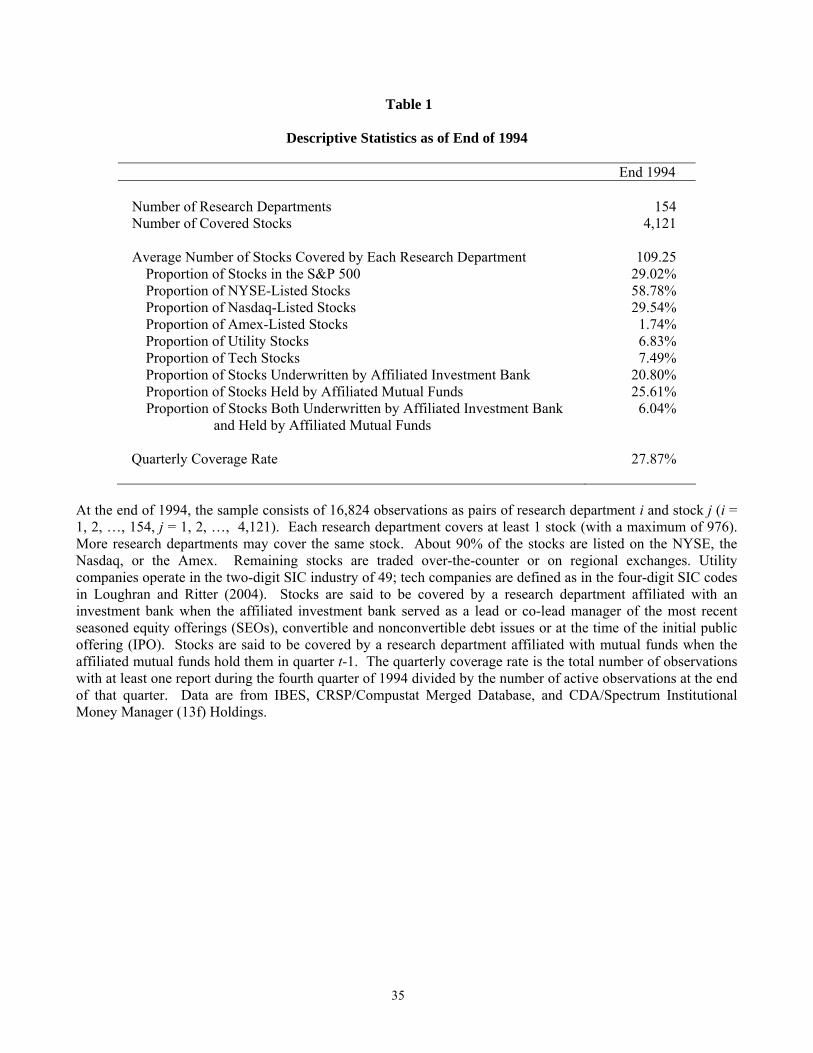
35
Table 1
Descriptive Statistics as of End of 1994
End 1994 Number of Research Departments 154 Number of Covered Stocks 4,121 Average Number of Stocks Covered by Each Research Department 109.25
Proportion of Stocks in the S&P 500 29.02% Proportion of NYSE-Listed Stocks 58.78% Proportion of Nasdaq-Listed Stocks 29.54% Proportion of Amex-Listed Stocks 1.74% Proportion of Utility Stocks 6.83% Proportion of Tech Stocks 7.49% Proportion of Stocks Underwritten by Affiliated Investment Bank 20.80% Proportion of Stocks Held by Affiliated Mutual Funds 25.61% Proportion of Stocks Both Underwritten by Affiliated Investment Bank
and Held by Affiliated Mutual Funds 6.04%
Quarterly Coverage Rate 27.87%
At the end of 1994, the sample consists of 16,824 observations as pairs of research department i and stock j (i = 1, 2, …, 154, j = 1, 2, …, 4,121). Each research department covers at least 1 stock (with a maximum of 976). More research departments may cover the same stock. About 90% of the stocks are listed on the NYSE, the Nasdaq, or the Amex. Remaining stocks are traded over-the-counter or on regional exchanges. Utility companies operate in the two-digit SIC industry of 49; tech companies are defined as in the four-digit SIC codes in Loughran and Ritter (2004). Stocks are said to be covered by a research department affiliated with an investment bank when the affiliated investment bank served as a lead or co-lead manager of the most recent seasoned equity offerings (SEOs), convertible and nonconvertible debt issues or at the time of the initial public offering (IPO). Stocks are said to be covered by a research department affiliated with mutual funds when the affiliated mutual funds hold them in quarter t-1. The quarterly coverage rate is the total number of observations with at least one report during the fourth quarter of 1994 divided by the number of active observations at the end of that quarter. Data are from IBES, CRSP/Compustat Merged Database, and CDA/Spectrum Institutional Money Manager (13f) Holdings.
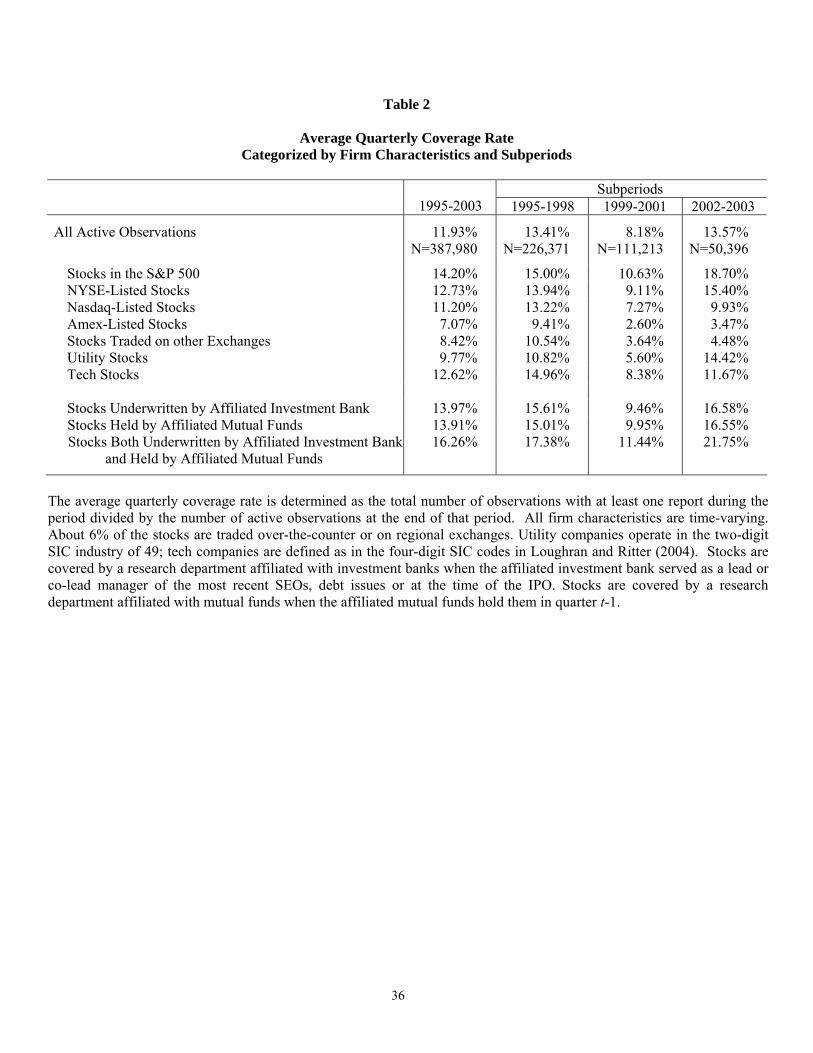
36
Table 2
Average Quarterly Coverage Rate Categorized by Firm Characteristics and Subperiods
Subperiods
1995-2003 1995-1998 1999-2001 2002-2003
All Active Observations 11.93% N=387,980
13.41% N=226,371
8.18% N=111,213
13.57% N=50,396
Stocks in the S&P 500 14.20% 15.00% 10.63% 18.70% NYSE-Listed Stocks 12.73% 13.94% 9.11% 15.40% Nasdaq-Listed Stocks 11.20% 13.22% 7.27% 9.93% Amex-Listed Stocks 7.07% 9.41% 2.60% 3.47% Stocks Traded on other Exchanges 8.42% 10.54% 3.64% 4.48% Utility Stocks 9.77% 10.82% 5.60% 14.42% Tech Stocks 12.62% 14.96% 8.38% 11.67% Stocks Underwritten by Affiliated Investment Bank 13.97% 15.61% 9.46% 16.58% Stocks Held by Affiliated Mutual Funds 13.91% 15.01% 9.95% 16.55% Stocks Both Underwritten by Affiliated Investment Bank
and Held by Affiliated Mutual Funds 16.26% 17.38% 11.44% 21.75%
The average quarterly coverage rate is determined as the total number of observations with at least one report during the period divided by the number of active observations at the end of that period. All firm characteristics are time-varying. About 6% of the stocks are traded over-the-counter or on regional exchanges. Utility companies operate in the two-digit SIC industry of 49; tech companies are defined as in the four-digit SIC codes in Loughran and Ritter (2004). Stocks are covered by a research department affiliated with investment banks when the affiliated investment bank served as a lead or co-lead manager of the most recent SEOs, debt issues or at the time of the IPO. Stocks are covered by a research department affiliated with mutual funds when the affiliated mutual funds hold them in quarter t-1.
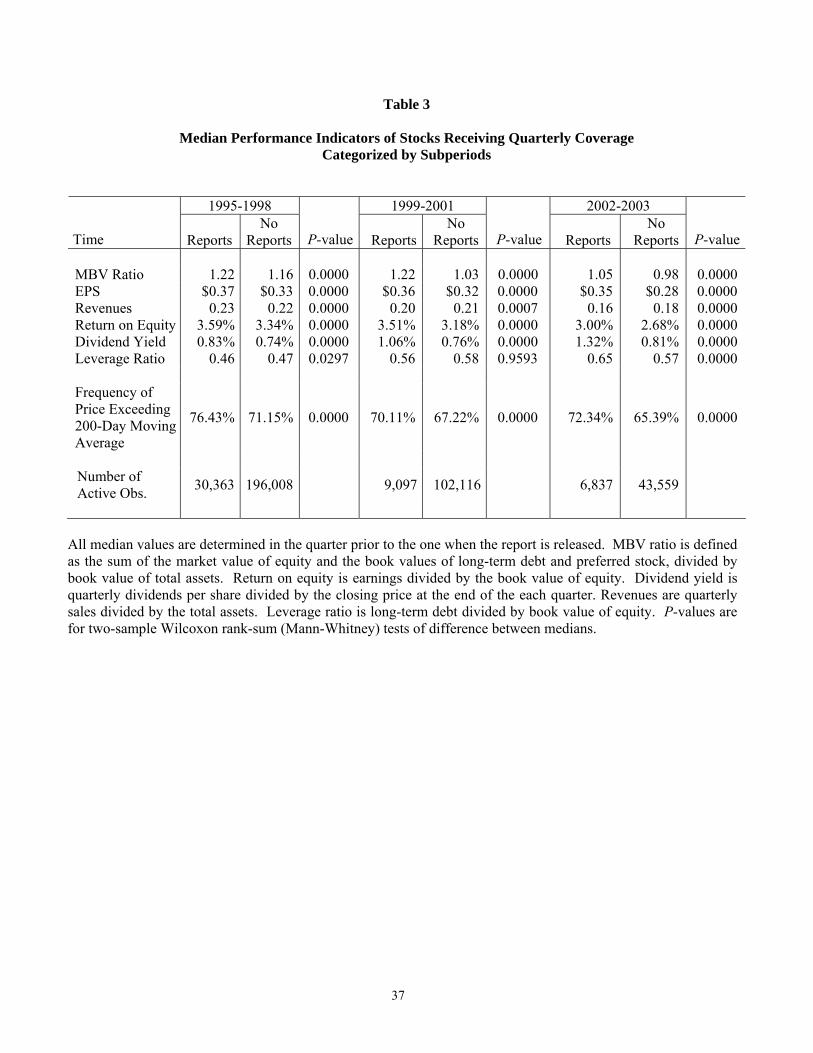
37
Table 3
Median Performance Indicators of Stocks Receiving Quarterly Coverage Categorized by Subperiods
1995-1998 1999-2001 2002-2003
Time Reports No
Reports P-value ReportsNo
Reports P-value Reports No
Reports P-value
MBV Ratio 1.22 1.16 0.0000 1.22 1.03 0.0000 1.05 0.98 0.0000 EPS $0.37 $0.33 0.0000 $0.36 $0.32 0.0000 $0.35 $0.28 0.0000 Revenues 0.23 0.22 0.0000 0.20 0.21 0.0007 0.16 0.18 0.0000 Return on Equity 3.59% 3.34% 0.0000 3.51% 3.18% 0.0000 3.00% 2.68% 0.0000 Dividend Yield 0.83% 0.74% 0.0000 1.06% 0.76% 0.0000 1.32% 0.81% 0.0000 Leverage Ratio 0.46 0.47 0.0297 0.56 0.58 0.9593 0.65 0.57 0.0000 Frequency of Price Exceeding 200-Day Moving Average
76.43% 71.15% 0.0000 70.11% 67.22% 0.0000 72.34% 65.39% 0.0000
Number of Active Obs. 30,363 196,008 9,097 102,116 6,837 43,559
All median values are determined in the quarter prior to the one when the report is released. MBV ratio is defined as the sum of the market value of equity and the book values of long-term debt and preferred stock, divided by book value of total assets. Return on equity is earnings divided by the book value of equity. Dividend yield is quarterly dividends per share divided by the closing price at the end of the each quarter. Revenues are quarterly sales divided by the total assets. Leverage ratio is long-term debt divided by book value of equity. P-values are for two-sample Wilcoxon rank-sum (Mann-Whitney) tests of difference between medians.
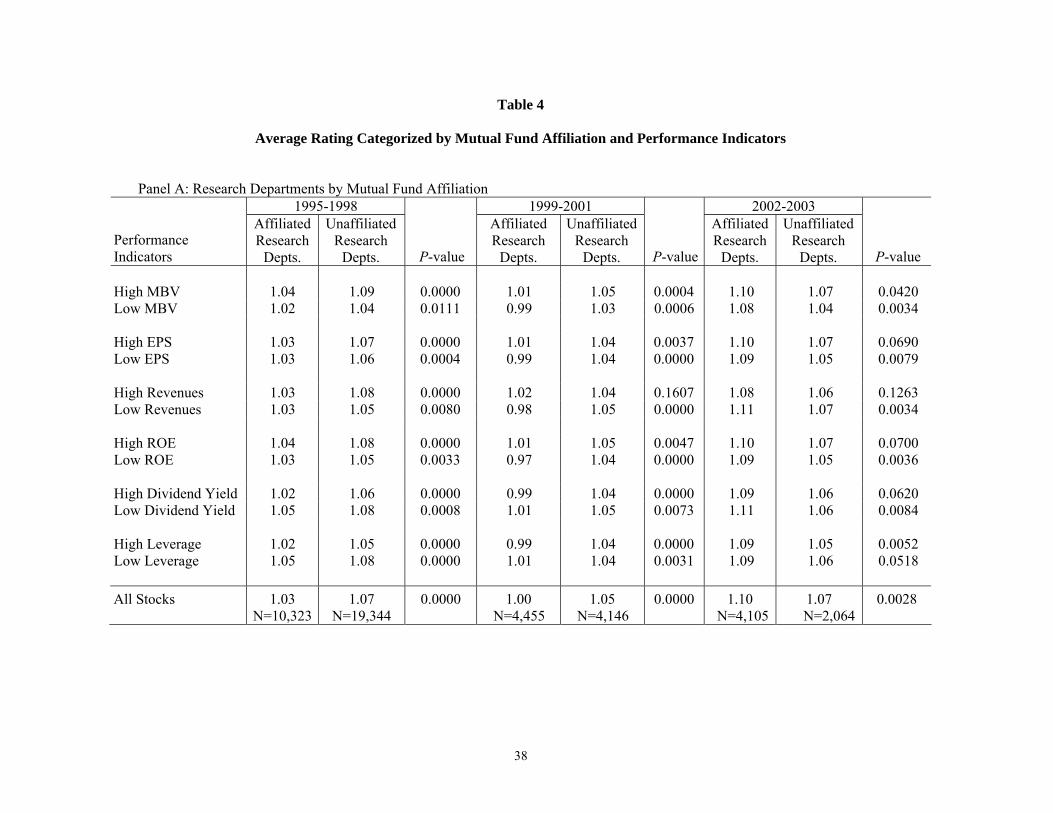
38
Table 4
Average Rating Categorized by Mutual Fund Affiliation and Performance Indicators Panel A: Research Departments by Mutual Fund Affiliation
1995-1998 1999-2001 2002-2003
Performance Indicators
Affiliated Research
Depts.
Unaffiliated Research
Depts. P-value
Affiliated Research
Depts.
Unaffiliated Research
Depts. P-value
Affiliated Research
Depts.
Unaffiliated Research
Depts. P-value High MBV 1.04 1.09 0.0000 1.01 1.05 0.0004 1.10 1.07 0.0420 Low MBV 1.02 1.04 0.0111 0.99 1.03 0.0006 1.08 1.04 0.0034 High EPS 1.03 1.07 0.0000 1.01 1.04 0.0037 1.10 1.07 0.0690 Low EPS 1.03 1.06 0.0004 0.99 1.04 0.0000 1.09 1.05 0.0079 High Revenues 1.03 1.08 0.0000 1.02 1.04 0.1607 1.08 1.06 0.1263 Low Revenues 1.03 1.05 0.0080 0.98 1.05 0.0000 1.11 1.07 0.0034 High ROE 1.04 1.08 0.0000 1.01 1.05 0.0047 1.10 1.07 0.0700 Low ROE 1.03 1.05 0.0033 0.97 1.04 0.0000 1.09 1.05 0.0036 High Dividend Yield 1.02 1.06 0.0000 0.99 1.04 0.0000 1.09 1.06 0.0620 Low Dividend Yield 1.05 1.08 0.0008 1.01 1.05 0.0073 1.11 1.06 0.0084 High Leverage 1.02 1.05 0.0000 0.99 1.04 0.0000 1.09 1.05 0.0052 Low Leverage 1.05 1.08 0.0000 1.01 1.04 0.0031 1.09 1.06 0.0518 All Stocks 1.03
N=10,323 1.07
N=19,344 0.0000 1.00
N=4,455 1.05
N=4,146 0.0000 1.10
N=4,1051.07 N=2,064
0.0028
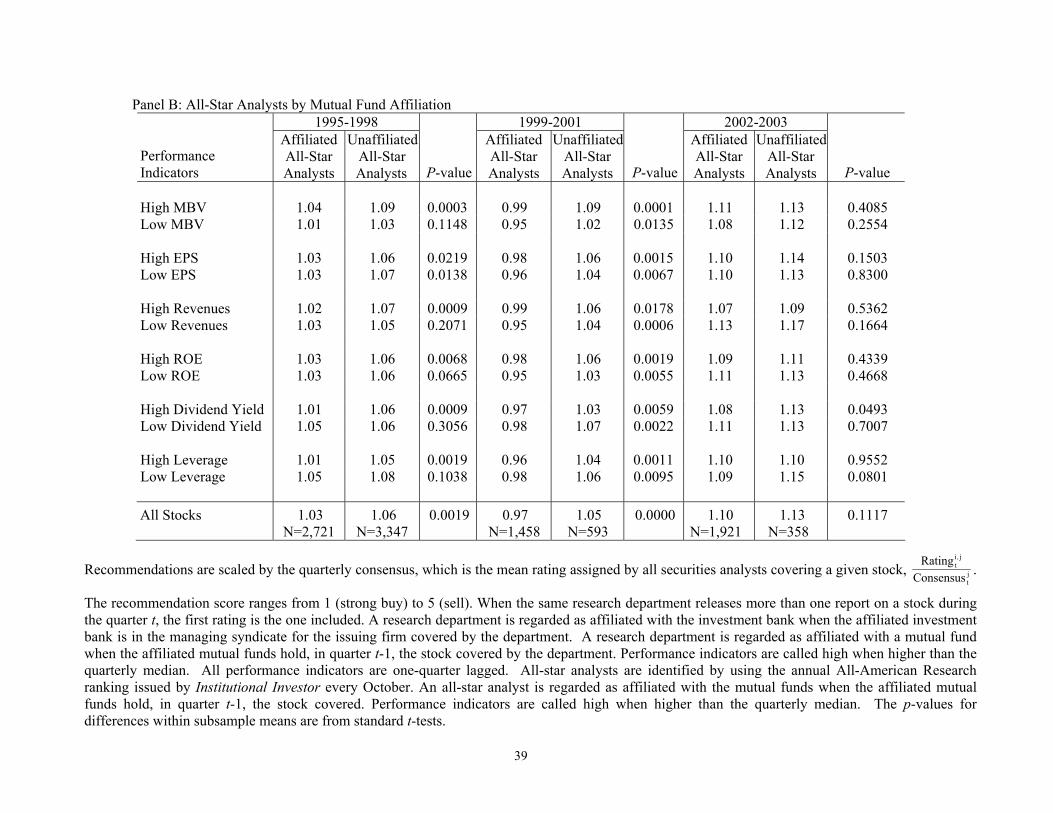
39
Panel B: All-Star Analysts by Mutual Fund Affiliation 1995-1998 1999-2001 2002-2003
Performance Indicators
Affiliated All-Star Analysts
UnaffiliatedAll-Star Analysts P-value
Affiliated All-Star Analysts
Unaffiliated All-Star Analysts P-value
Affiliated All-Star Analysts
UnaffiliatedAll-Star Analysts P-value
High MBV 1.04 1.09 0.0003 0.99 1.09 0.0001 1.11 1.13 0.4085 Low MBV 1.01 1.03 0.1148 0.95 1.02 0.0135 1.08 1.12 0.2554 High EPS 1.03 1.06 0.0219 0.98 1.06 0.0015 1.10 1.14 0.1503 Low EPS 1.03 1.07 0.0138 0.96 1.04 0.0067 1.10 1.13 0.8300 High Revenues 1.02 1.07 0.0009 0.99 1.06 0.0178 1.07 1.09 0.5362 Low Revenues 1.03 1.05 0.2071 0.95 1.04 0.0006 1.13 1.17 0.1664 High ROE 1.03 1.06 0.0068 0.98 1.06 0.0019 1.09 1.11 0.4339 Low ROE 1.03 1.06 0.0665 0.95 1.03 0.0055 1.11 1.13 0.4668 High Dividend Yield 1.01 1.06 0.0009 0.97 1.03 0.0059 1.08 1.13 0.0493 Low Dividend Yield 1.05 1.06 0.3056 0.98 1.07 0.0022 1.11 1.13 0.7007 High Leverage 1.01 1.05 0.0019 0.96 1.04 0.0011 1.10 1.10 0.9552 Low Leverage 1.05 1.08 0.1038 0.98 1.06 0.0095 1.09 1.15 0.0801 All Stocks 1.03
N=2,721 1.06
N=3,347 0.0019 0.97
N=1,458 1.05
N=593 0.0000 1.10
N=1,921 1.13
N=358 0.1117
Recommendations are scaled by the quarterly consensus, which is the mean rating assigned by all securities analysts covering a given stock, j
t
jit
ConsensusRating ,
.
The recommendation score ranges from 1 (strong buy) to 5 (sell). When the same research department releases more than one report on a stock during the quarter t, the first rating is the one included. A research department is regarded as affiliated with the investment bank when the affiliated investment bank is in the managing syndicate for the issuing firm covered by the department. A research department is regarded as affiliated with a mutual fund when the affiliated mutual funds hold, in quarter t-1, the stock covered by the department. Performance indicators are called high when higher than the quarterly median. All performance indicators are one-quarter lagged. All-star analysts are identified by using the annual All-American Research ranking issued by Institutional Investor every October. An all-star analyst is regarded as affiliated with the mutual funds when the affiliated mutual funds hold, in quarter t-1, the stock covered. Performance indicators are called high when higher than the quarterly median. The p-values for differences within subsample means are from standard t-tests.
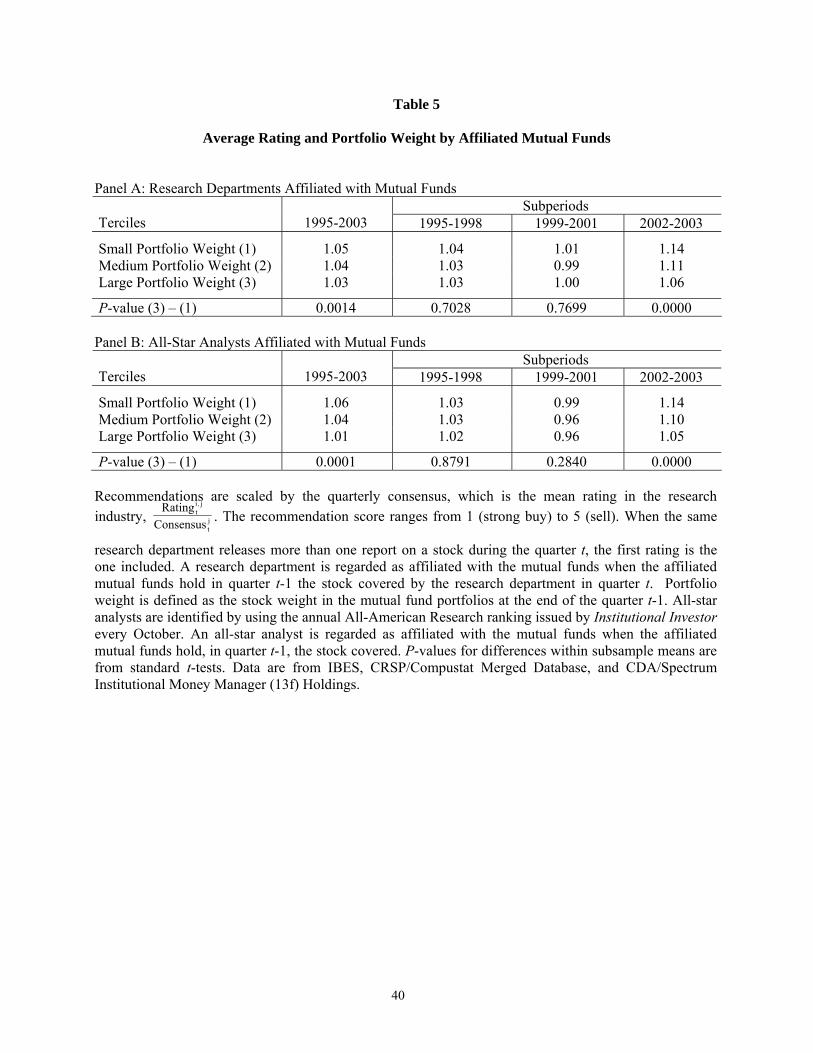
40
Table 5
Average Rating and Portfolio Weight by Affiliated Mutual Funds
Panel A: Research Departments Affiliated with Mutual Funds Subperiods
Terciles 1995-2003 1995-1998 1999-2001 2002-2003
Small Portfolio Weight (1) 1.05 1.04 1.01 1.14 Medium Portfolio Weight (2) 1.04 1.03 0.99 1.11 Large Portfolio Weight (3) 1.03 1.03 1.00 1.06
P-value (3) – (1) 0.0014 0.7028 0.7699 0.0000 Panel B: All-Star Analysts Affiliated with Mutual Funds
Subperiods Terciles 1995-2003 1995-1998 1999-2001 2002-2003
Small Portfolio Weight (1) 1.06 1.03 0.99 1.14 Medium Portfolio Weight (2) 1.04 1.03 0.96 1.10 Large Portfolio Weight (3) 1.01 1.02 0.96 1.05
P-value (3) – (1) 0.0001 0.8791 0.2840 0.0000
Recommendations are scaled by the quarterly consensus, which is the mean rating in the research industry, j
t
jit
ConsensusRating ,
. The recommendation score ranges from 1 (strong buy) to 5 (sell). When the same
research department releases more than one report on a stock during the quarter t, the first rating is the one included. A research department is regarded as affiliated with the mutual funds when the affiliated mutual funds hold in quarter t-1 the stock covered by the research department in quarter t. Portfolio weight is defined as the stock weight in the mutual fund portfolios at the end of the quarter t-1. All-star analysts are identified by using the annual All-American Research ranking issued by Institutional Investor every October. An all-star analyst is regarded as affiliated with the mutual funds when the affiliated mutual funds hold, in quarter t-1, the stock covered. P-values for differences within subsample means are from standard t-tests. Data are from IBES, CRSP/Compustat Merged Database, and CDA/Spectrum Institutional Money Manager (13f) Holdings.
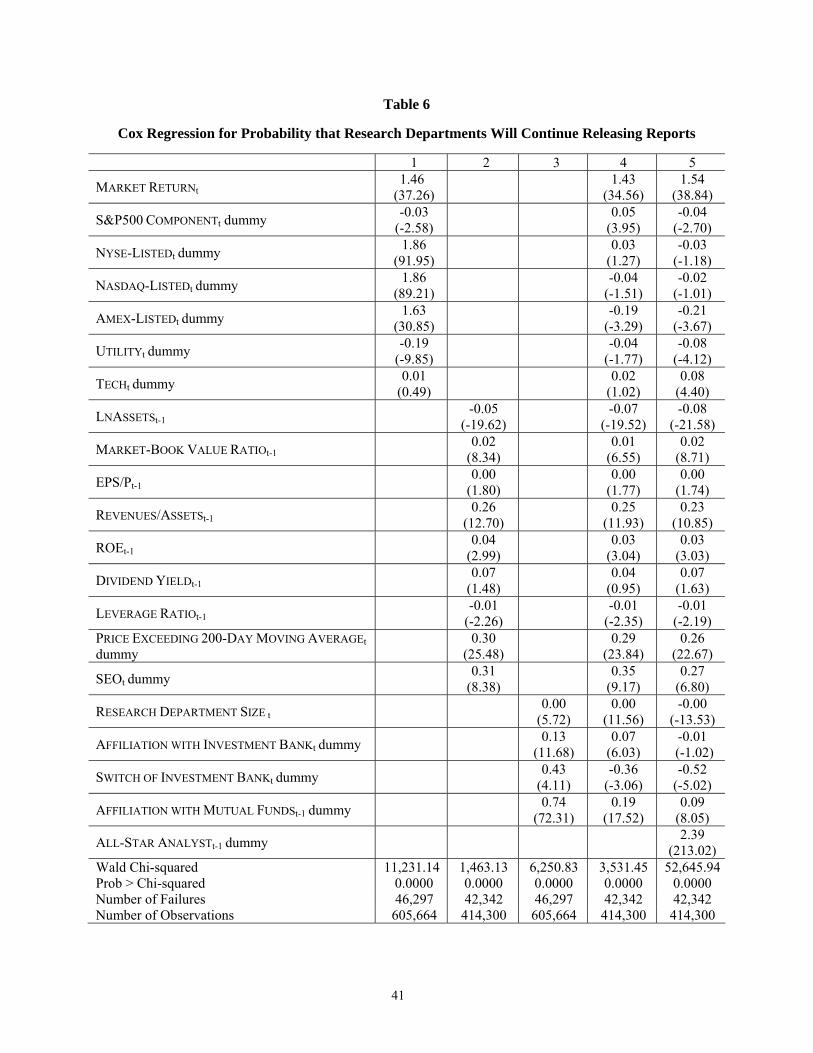
41
Table 6
Cox Regression for Probability that Research Departments Will Continue Releasing Reports
1 2 3 4 5
MARKET RETURNt 1.46
(37.26) 1.43
(34.56) 1.54
(38.84)
S&P500 COMPONENTt dummy -0.03 (-2.58)
0.05 (3.95)
-0.04 (-2.70)
NYSE-LISTEDt dummy 1.86 (91.95)
0.03 (1.27)
-0.03 (-1.18)
NASDAQ-LISTEDt dummy 1.86 (89.21)
-0.04 (-1.51)
-0.02 (-1.01)
AMEX-LISTEDt dummy 1.63 (30.85)
-0.19 (-3.29)
-0.21 (-3.67)
UTILITYt dummy -0.19 (-9.85)
-0.04 (-1.77)
-0.08 (-4.12)
TECHt dummy 0.01 (0.49)
0.02 (1.02)
0.08 (4.40)
LNASSETSt-1 -0.05
(-19.62) -0.07
(-19.52) -0.08
(-21.58)
MARKET-BOOK VALUE RATIOt-1 0.02
(8.34) 0.01
(6.55) 0.02
(8.71)
EPS/Pt-1 0.00
(1.80) 0.00
(1.77) 0.00
(1.74)
REVENUES/ASSETSt-1 0.26
(12.70) 0.25
(11.93) 0.23
(10.85)
ROEt-1 0.04
(2.99) 0.03
(3.04) 0.03
(3.03)
DIVIDEND YIELDt-1 0.07
(1.48) 0.04
(0.95) 0.07
(1.63)
LEVERAGE RATIOt-1 -0.01
(-2.26) -0.01
(-2.35) -0.01
(-2.19) PRICE EXCEEDING 200-DAY MOVING AVERAGEt dummy
0.30 (25.48)
0.29 (23.84)
0.26 (22.67)
SEOt dummy 0.31 (8.38)
0.35 (9.17)
0.27 (6.80)
RESEARCH DEPARTMENT SIZE t 0.00
(5.72) 0.00
(11.56) -0.00
(-13.53)
AFFILIATION WITH INVESTMENT BANKt dummy 0.13 (11.68)
0.07 (6.03)
-0.01 (-1.02)
SWITCH OF INVESTMENT BANKt dummy 0.43 (4.11)
-0.36 (-3.06)
-0.52 (-5.02)
AFFILIATION WITH MUTUAL FUNDSt-1 dummy 0.74 (72.31)
0.19 (17.52)
0.09 (8.05)
ALL-STAR ANALYSTt-1 dummy 2.39 (213.02)
Wald Chi-squared 11,231.14 1,463.13 6,250.83 3,531.45 52,645.94Prob > Chi-squared 0.0000 0.0000 0.0000 0.0000 0.0000 Number of Failures 46,297 42,342 46,297 42,342 42,342 Number of Observations 605,664 414,300 605,664 414,300 414,300
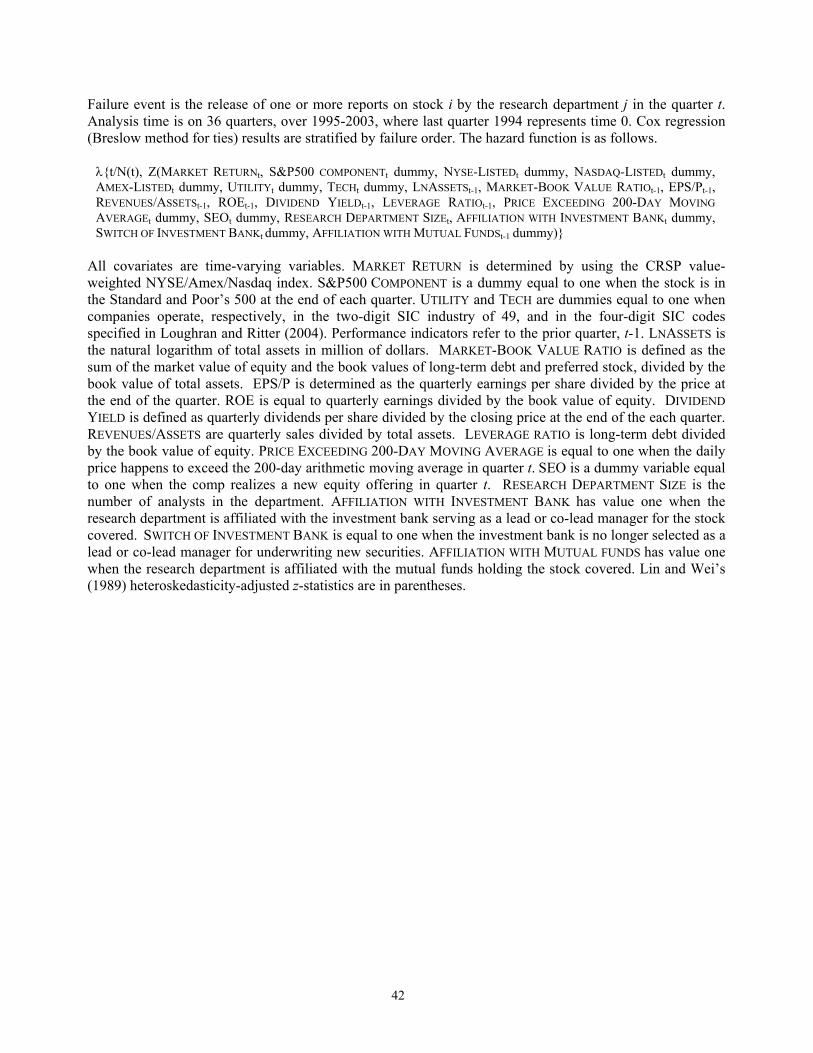
42
Failure event is the release of one or more reports on stock i by the research department j in the quarter t. Analysis time is on 36 quarters, over 1995-2003, where last quarter 1994 represents time 0. Cox regression (Breslow method for ties) results are stratified by failure order. The hazard function is as follows. λ{t/N(t), Z(MARKET RETURNt, S&P500 COMPONENTt dummy, NYSE-LISTEDt dummy, NASDAQ-LISTEDt dummy, AMEX-LISTEDt dummy, UTILITYt dummy, TECHt dummy, LNASSETSt-1, MARKET-BOOK VALUE RATIOt-1, EPS/Pt-1, REVENUES/ASSETSt-1, ROEt-1, DIVIDEND YIELDt-1, LEVERAGE RATIOt-1, PRICE EXCEEDING 200-DAY MOVING AVERAGEt dummy, SEOt dummy, RESEARCH DEPARTMENT SIZEt, AFFILIATION WITH INVESTMENT BANKt dummy, SWITCH OF INVESTMENT BANKt dummy, AFFILIATION WITH MUTUAL FUNDSt-1 dummy)}
All covariates are time-varying variables. MARKET RETURN is determined by using the CRSP value-weighted NYSE/Amex/Nasdaq index. S&P500 COMPONENT is a dummy equal to one when the stock is in the Standard and Poor’s 500 at the end of each quarter. UTILITY and TECH are dummies equal to one when companies operate, respectively, in the two-digit SIC industry of 49, and in the four-digit SIC codes specified in Loughran and Ritter (2004). Performance indicators refer to the prior quarter, t-1. LNASSETS is the natural logarithm of total assets in million of dollars. MARKET-BOOK VALUE RATIO is defined as the sum of the market value of equity and the book values of long-term debt and preferred stock, divided by the book value of total assets. EPS/P is determined as the quarterly earnings per share divided by the price at the end of the quarter. ROE is equal to quarterly earnings divided by the book value of equity. DIVIDEND YIELD is defined as quarterly dividends per share divided by the closing price at the end of the each quarter. REVENUES/ASSETS are quarterly sales divided by total assets. LEVERAGE RATIO is long-term debt divided by the book value of equity. PRICE EXCEEDING 200-DAY MOVING AVERAGE is equal to one when the daily price happens to exceed the 200-day arithmetic moving average in quarter t. SEO is a dummy variable equal to one when the comp realizes a new equity offering in quarter t. RESEARCH DEPARTMENT SIZE is the number of analysts in the department. AFFILIATION WITH INVESTMENT BANK has value one when the research department is affiliated with the investment bank serving as a lead or co-lead manager for the stock covered. SWITCH OF INVESTMENT BANK is equal to one when the investment bank is no longer selected as a lead or co-lead manager for underwriting new securities. AFFILIATION WITH MUTUAL FUNDS has value one when the research department is affiliated with the mutual funds holding the stock covered. Lin and Wei’s (1989) heteroskedasticity-adjusted z-statistics are in parentheses.
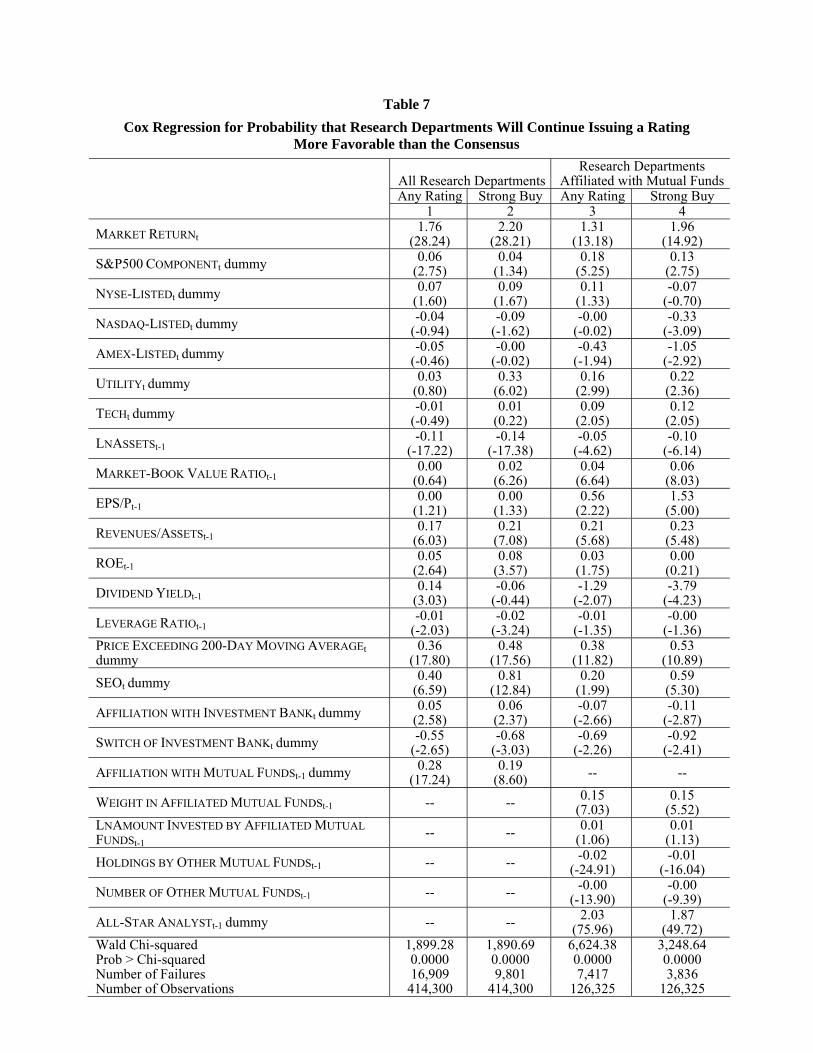
Table 7
Cox Regression for Probability that Research Departments Will Continue Issuing a Rating More Favorable than the Consensus
All Research DepartmentsResearch Departments
Affiliated with Mutual FundsAny Rating Strong Buy Any Rating Strong Buy
1 2 3 4 MARKET RETURNt
1.76 (28.24)
2.20 (28.21)
1.31 (13.18)
1.96 (14.92)
S&P500 COMPONENTt dummy 0.06 (2.75)
0.04 (1.34)
0.18 (5.25)
0.13 (2.75)
NYSE-LISTEDt dummy 0.07 (1.60)
0.09 (1.67)
0.11 (1.33)
-0.07 (-0.70)
NASDAQ-LISTEDt dummy -0.04 (-0.94)
-0.09 (-1.62)
-0.00 (-0.02)
-0.33 (-3.09)
AMEX-LISTEDt dummy -0.05 (-0.46)
-0.00 (-0.02)
-0.43 (-1.94)
-1.05 (-2.92)
UTILITYt dummy 0.03 (0.80)
0.33 (6.02)
0.16 (2.99)
0.22 (2.36)
TECHt dummy -0.01 (-0.49)
0.01 (0.22)
0.09 (2.05)
0.12 (2.05)
LNASSETSt-1 -0.11
(-17.22) -0.14
(-17.38) -0.05
(-4.62) -0.10
(-6.14) MARKET-BOOK VALUE RATIOt-1
0.00 (0.64)
0.02 (6.26)
0.04 (6.64)
0.06 (8.03)
EPS/Pt-1 0.00
(1.21) 0.00
(1.33) 0.56
(2.22) 1.53
(5.00) REVENUES/ASSETSt-1
0.17 (6.03)
0.21 (7.08)
0.21 (5.68)
0.23 (5.48)
ROEt-1 0.05
(2.64) 0.08
(3.57) 0.03
(1.75) 0.00
(0.21) DIVIDEND YIELDt-1
0.14 (3.03)
-0.06 (-0.44)
-1.29 (-2.07)
-3.79 (-4.23)
LEVERAGE RATIOt-1 -0.01
(-2.03) -0.02
(-3.24) -0.01
(-1.35) -0.00
(-1.36) PRICE EXCEEDING 200-DAY MOVING AVERAGEt dummy
0.36 (17.80)
0.48 (17.56)
0.38 (11.82)
0.53 (10.89)
SEOt dummy 0.40 (6.59)
0.81 (12.84)
0.20 (1.99)
0.59 (5.30)
AFFILIATION WITH INVESTMENT BANKt dummy 0.05 (2.58)
0.06 (2.37)
-0.07 (-2.66)
-0.11 (-2.87)
SWITCH OF INVESTMENT BANKt dummy -0.55 (-2.65)
-0.68 (-3.03)
-0.69 (-2.26)
-0.92 (-2.41)
AFFILIATION WITH MUTUAL FUNDSt-1 dummy 0.28 (17.24)
0.19 (8.60) -- --
WEIGHT IN AFFILIATED MUTUAL FUNDSt-1 -- -- 0.15 (7.03)
0.15 (5.52)
LNAMOUNT INVESTED BY AFFILIATED MUTUAL FUNDSt-1
-- -- 0.01 (1.06)
0.01 (1.13)
HOLDINGS BY OTHER MUTUAL FUNDSt-1 -- -- -0.02 (-24.91)
-0.01 (-16.04)
NUMBER OF OTHER MUTUAL FUNDSt-1 -- -- -0.00 (-13.90)
-0.00 (-9.39)
ALL-STAR ANALYSTt-1 dummy -- -- 2.03 (75.96)
1.87 (49.72)
Wald Chi-squared 1,899.28 1,890.69 6,624.38 3,248.64 Prob > Chi-squared 0.0000 0.0000 0.0000 0.0000 Number of Failures 16,909 9,801 7,417 3,836 Number of Observations 414,300 414,300 126,325 126,325

44
Failure event is the release of a recommendation by the research department j better than the consensus on stocks i in quarter t so that 1
ConsensusRating
jt
j,it < . Analysis time is on 36 quarters, from 1995 through 2003, where
the last quarter 1994 represents time 0. Cox regression (Breslow method for ties) results are stratified by failure order. λ{t/N(t), Z(MARKET RETURNt, S&P500 COMPONENTt dummy, NYSE-LISTEDt dummy, NASDAQ-LISTEDt dummy, AMEX-LISTEDt dummy, UTILITYt dummy, TECHt dummy, LNASSETSt-1, MARKET-BOOK VALUE RATIOt-1, EPS/Pt-1, REVENUES/ASSETSt-1, ROEt-1, DIVIDEND YIELDt-1, LEVERAGE RATIOt-1, PRICE EXCEEDING 200-DAY MOVING AVERAGEt dummy, SEOt dummy, AFFILIATION WITH INVESTMENT BANKt dummy, SWITCH OF INVESTMENT BANKt dummy, AFFILIATION WITH MUTUAL FUNDS t-1 dummy)} All covariates are time-varying variables. WEIGHT IN AFFILIATED MUTUAL FUNDS is the percentage of the dollar amount invested in stock j by the affiliated money manager divided by all 13f holdings in quarter t-1. LNAMOUNT INVESTED BY AFFILIATED MUTUAL FUNDS is the logarithm of the dollar amount invested by affiliated mutual funds in stock j at the end of quarter t-1. HOLDINGS BY OTHER MUTUAL FUNDS are defined as the percent ratio between the shares held by unaffiliated mutual funds at the end of quarter t-1 and shares outstanding. NUMBER OF OTHER MUTUAL FUNDS is the number of unaffiliated mutual funds investing in stock j at the end of quarter t-1. ALL-STAR ANALYST is a dummy equal to one when the analyst issuing the report belongs to the All-American Research Team as selected by Institutional Investor magazine every October. Lin and Wei’s (1989) heteroskedasticity-adjusted z-statistics are in parentheses.
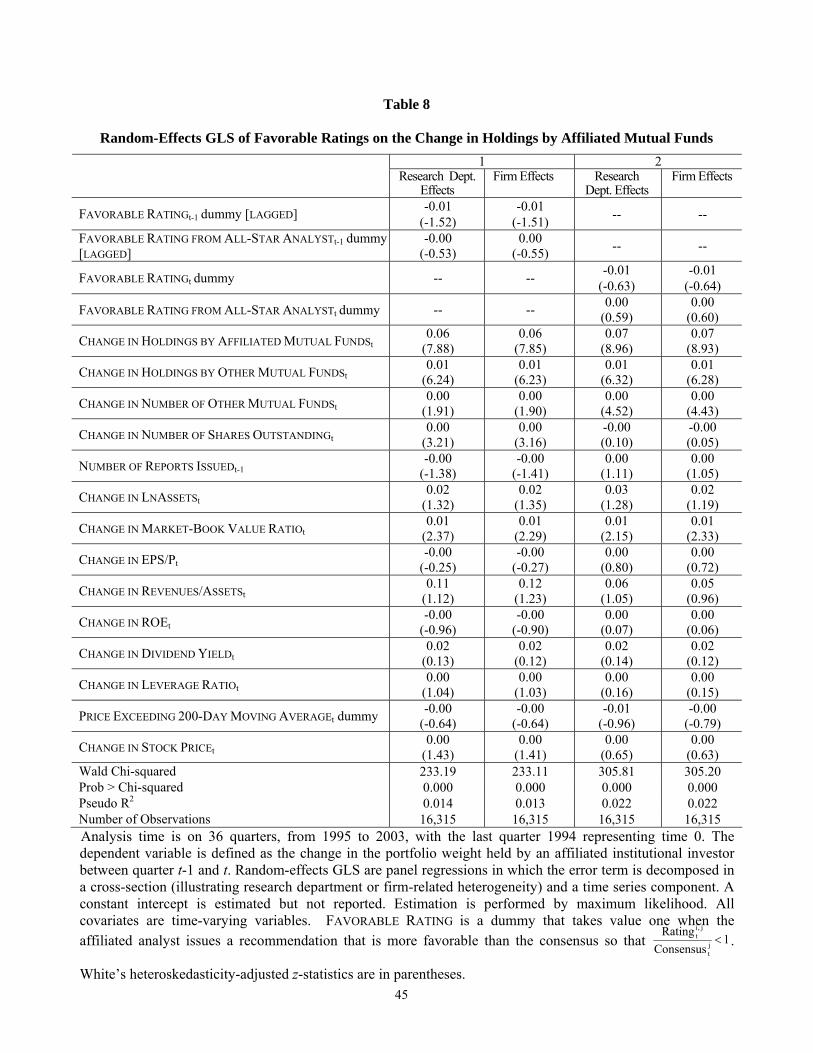
45
Table 8
Random-Effects GLS of Favorable Ratings on the Change in Holdings by Affiliated Mutual Funds 1 2
Research Dept. Effects
Firm Effects Research Dept. Effects
Firm Effects
FAVORABLE RATINGt-1 dummy [LAGGED] -0.01 (-1.52)
-0.01 (-1.51) -- --
FAVORABLE RATING FROM ALL-STAR ANALYSTt-1 dummy[LAGGED]
-0.00 (-0.53)
0.00 (-0.55) -- --
FAVORABLE RATINGt dummy -- -- -0.01 (-0.63)
-0.01 (-0.64)
FAVORABLE RATING FROM ALL-STAR ANALYSTt dummy -- -- 0.00 (0.59)
0.00 (0.60)
CHANGE IN HOLDINGS BY AFFILIATED MUTUAL FUNDSt 0.06
(7.88) 0.06
(7.85) 0.07
(8.96) 0.07
(8.93)
CHANGE IN HOLDINGS BY OTHER MUTUAL FUNDSt 0.01
(6.24) 0.01
(6.23) 0.01
(6.32) 0.01
(6.28)
CHANGE IN NUMBER OF OTHER MUTUAL FUNDSt 0.00
(1.91) 0.00
(1.90) 0.00
(4.52) 0.00
(4.43)
CHANGE IN NUMBER OF SHARES OUTSTANDINGt 0.00
(3.21) 0.00
(3.16) -0.00 (0.10)
-0.00 (0.05)
NUMBER OF REPORTS ISSUEDt-1 -0.00
(-1.38) -0.00
(-1.41) 0.00
(1.11) 0.00
(1.05)
CHANGE IN LNASSETSt 0.02
(1.32) 0.02
(1.35) 0.03
(1.28) 0.02
(1.19)
CHANGE IN MARKET-BOOK VALUE RATIOt 0.01
(2.37) 0.01
(2.29) 0.01
(2.15) 0.01
(2.33)
CHANGE IN EPS/Pt -0.00
(-0.25) -0.00
(-0.27) 0.00
(0.80) 0.00
(0.72)
CHANGE IN REVENUES/ASSETSt 0.11
(1.12) 0.12
(1.23) 0.06
(1.05) 0.05
(0.96)
CHANGE IN ROEt -0.00
(-0.96) -0.00
(-0.90) 0.00
(0.07) 0.00
(0.06)
CHANGE IN DIVIDEND YIELDt 0.02
(0.13) 0.02
(0.12) 0.02
(0.14) 0.02
(0.12)
CHANGE IN LEVERAGE RATIOt 0.00
(1.04) 0.00
(1.03) 0.00
(0.16) 0.00
(0.15)
PRICE EXCEEDING 200-DAY MOVING AVERAGEt dummy -0.00 (-0.64)
-0.00 (-0.64)
-0.01 (-0.96)
-0.00 (-0.79)
CHANGE IN STOCK PRICEt 0.00
(1.43) 0.00
(1.41) 0.00
(0.65) 0.00
(0.63) Wald Chi-squared 233.19 233.11 305.81 305.20 Prob > Chi-squared 0.000 0.000 0.000 0.000 Pseudo R2 0.014 0.013 0.022 0.022 Number of Observations 16,315 16,315 16,315 16,315 Analysis time is on 36 quarters, from 1995 to 2003, with the last quarter 1994 representing time 0. The dependent variable is defined as the change in the portfolio weight held by an affiliated institutional investor between quarter t-1 and t. Random-effects GLS are panel regressions in which the error term is decomposed in a cross-section (illustrating research department or firm-related heterogeneity) and a time series component. A constant intercept is estimated but not reported. Estimation is performed by maximum likelihood. All covariates are time-varying variables. FAVORABLE RATING is a dummy that takes value one when the affiliated analyst issues a recommendation that is more favorable than the consensus so that 1
ConsensusRating
jt
j,it < .
White’s heteroskedasticity-adjusted z-statistics are in parentheses.
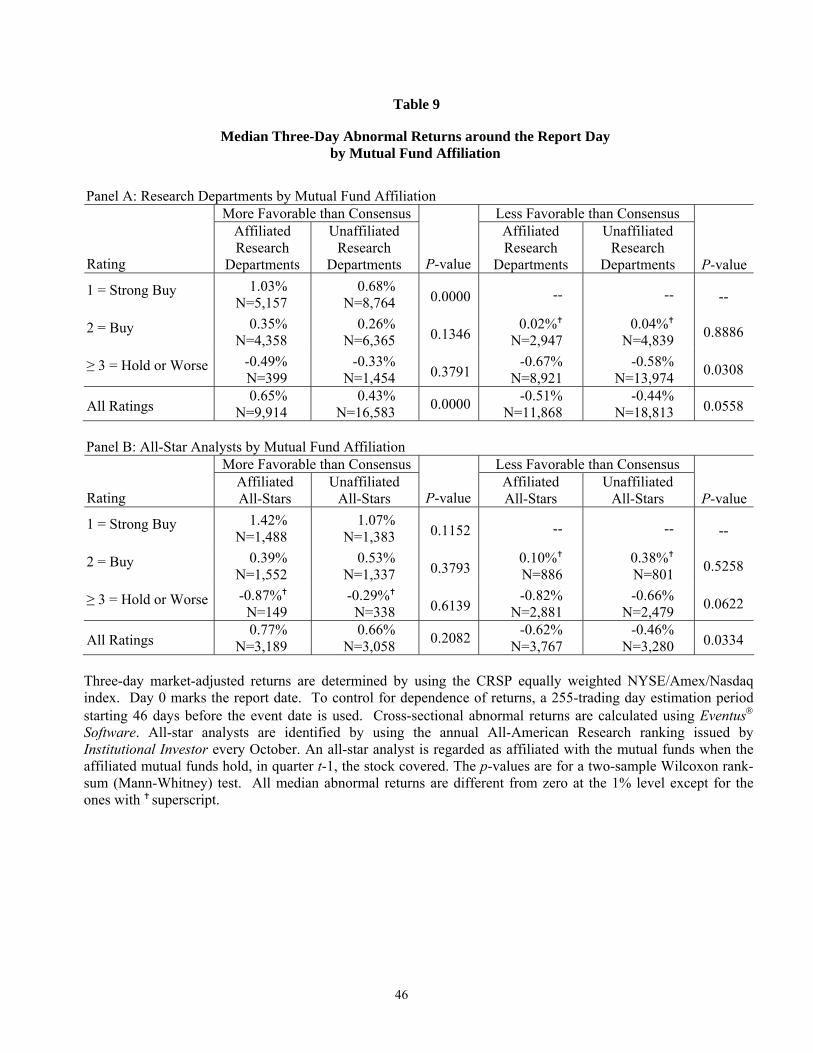
46
Table 9
Median Three-Day Abnormal Returns around the Report Day by Mutual Fund Affiliation
Panel A: Research Departments by Mutual Fund Affiliation
More Favorable than Consensus Less Favorable than Consensus
Rating
Affiliated Research
Departments
Unaffiliated Research
Departments P-value
Affiliated Research
Departments
Unaffiliated Research
Departments P-value
1 = Strong Buy 1.03% N=5,157
0.68% N=8,764 0.0000 -- -- --
2 = Buy 0.35% N=4,358
0.26% N=6,365 0.1346
0.02% N=2,947
0.04% N=4,839 0.8886
≥ 3 = Hold or Worse -0.49% N=399
-0.33% N=1,454 0.3791
-0.67% N=8,921
-0.58% N=13,974 0.0308
All Ratings 0.65%
N=9,914 0.43%
N=16,583 0.0000 -0.51% N=11,868
-0.44% N=18,813 0.0558
Panel B: All-Star Analysts by Mutual Fund Affiliation
More Favorable than Consensus Less Favorable than Consensus
Rating Affiliated All-Stars
Unaffiliated All-Stars P-value
Affiliated All-Stars
Unaffiliated All-Stars P-value
1 = Strong Buy 1.42% N=1,488
1.07% N=1,383 0.1152 -- -- --
2 = Buy 0.39% N=1,552
0.53% N=1,337 0.3793
0.10% N=886
0.38% N=801 0.5258
≥ 3 = Hold or Worse -0.87% N=149
-0.29% N=338 0.6139
-0.82% N=2,881
-0.66% N=2,479 0.0622
All Ratings 0.77%
N=3,189 0.66%
N=3,058 0.2082 -0.62% N=3,767
-0.46% N=3,280 0.0334
Three-day market-adjusted returns are determined by using the CRSP equally weighted NYSE/Amex/Nasdaq index. Day 0 marks the report date. To control for dependence of returns, a 255-trading day estimation period starting 46 days before the event date is used. Cross-sectional abnormal returns are calculated using Eventus® Software. All-star analysts are identified by using the annual All-American Research ranking issued by Institutional Investor every October. An all-star analyst is regarded as affiliated with the mutual funds when the affiliated mutual funds hold, in quarter t-1, the stock covered. The p-values are for a two-sample Wilcoxon rank-sum (Mann-Whitney) test. All median abnormal returns are different from zero at the 1% level except for the ones with superscript.
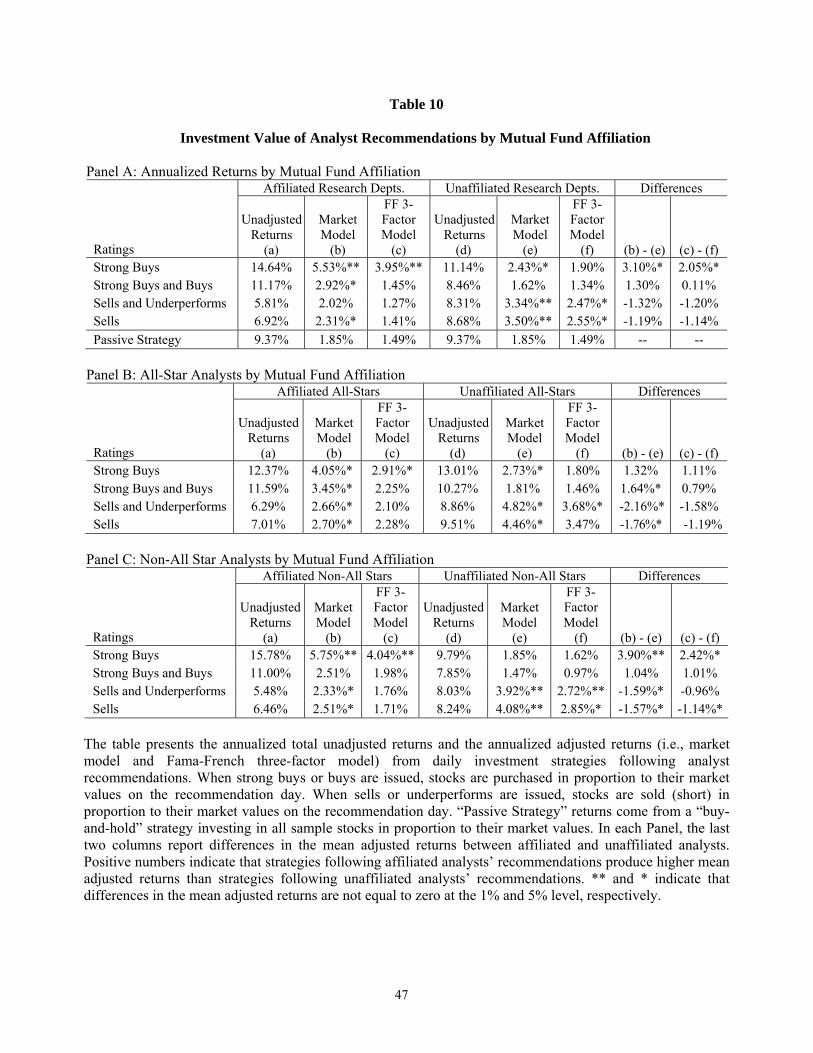
47
Table 10
Investment Value of Analyst Recommendations by Mutual Fund Affiliation
Panel A: Annualized Returns by Mutual Fund Affiliation Affiliated Research Depts. Unaffiliated Research Depts. Differences
Ratings
Unadjusted Returns
(a)
Market Model
(b)
FF 3-Factor Model
(c)
Unadjusted Returns
(d)
Market Model
(e)
FF 3-Factor Model
(f) (b) - (e) (c) - (f) Strong Buys 14.64% 5.53%** 3.95%** 11.14% 2.43%* 1.90% 3.10%* 2.05%* Strong Buys and Buys 11.17% 2.92%* 1.45% 8.46% 1.62% 1.34% 1.30% 0.11% Sells and Underperforms 5.81% 2.02% 1.27% 8.31% 3.34%** 2.47%* -1.32% -1.20% Sells 6.92% 2.31%* 1.41% 8.68% 3.50%** 2.55%* -1.19% -1.14% Passive Strategy 9.37% 1.85% 1.49% 9.37% 1.85% 1.49% -- --
Panel B: All-Star Analysts by Mutual Fund Affiliation Affiliated All-Stars Unaffiliated All-Stars Differences
Ratings
Unadjusted Returns
(a)
Market Model
(b)
FF 3-Factor Model
(c)
Unadjusted Returns
(d)
Market Model
(e)
FF 3-Factor Model
(f) (b) - (e) (c) - (f) Strong Buys 12.37% 4.05%* 2.91%* 13.01% 2.73%* 1.80% 1.32% 1.11% Strong Buys and Buys 11.59% 3.45%* 2.25% 10.27% 1.81% 1.46% 1.64%* 0.79% Sells and Underperforms 6.29% 2.66%* 2.10% 8.86% 4.82%* 3.68%* -2.16%* -1.58% Sells 7.01% 2.70%* 2.28% 9.51% 4.46%* 3.47% -1.76%* -1.19%
Panel C: Non-All Star Analysts by Mutual Fund Affiliation Affiliated Non-All Stars Unaffiliated Non-All Stars Differences
Ratings
Unadjusted Returns
(a)
Market Model
(b)
FF 3-Factor Model
(c)
Unadjusted Returns
(d)
Market Model
(e)
FF 3-Factor Model
(f) (b) - (e) (c) - (f) Strong Buys 15.78% 5.75%** 4.04%** 9.79% 1.85% 1.62% 3.90%** 2.42%* Strong Buys and Buys 11.00% 2.51% 1.98% 7.85% 1.47% 0.97% 1.04% 1.01% Sells and Underperforms 5.48% 2.33%* 1.76% 8.03% 3.92%** 2.72%** -1.59%* -0.96% Sells 6.46% 2.51%* 1.71% 8.24% 4.08%** 2.85%* -1.57%* -1.14%*
The table presents the annualized total unadjusted returns and the annualized adjusted returns (i.e., market model and Fama-French three-factor model) from daily investment strategies following analyst recommendations. When strong buys or buys are issued, stocks are purchased in proportion to their market values on the recommendation day. When sells or underperforms are issued, stocks are sold (short) in proportion to their market values on the recommendation day. “Passive Strategy” returns come from a “buy-and-hold” strategy investing in all sample stocks in proportion to their market values. In each Panel, the last two columns report differences in the mean adjusted returns between affiliated and unaffiliated analysts. Positive numbers indicate that strategies following affiliated analysts’ recommendations produce higher mean adjusted returns than strategies following unaffiliated analysts’ recommendations. ** and * indicate that differences in the mean adjusted returns are not equal to zero at the 1% and 5% level, respectively.
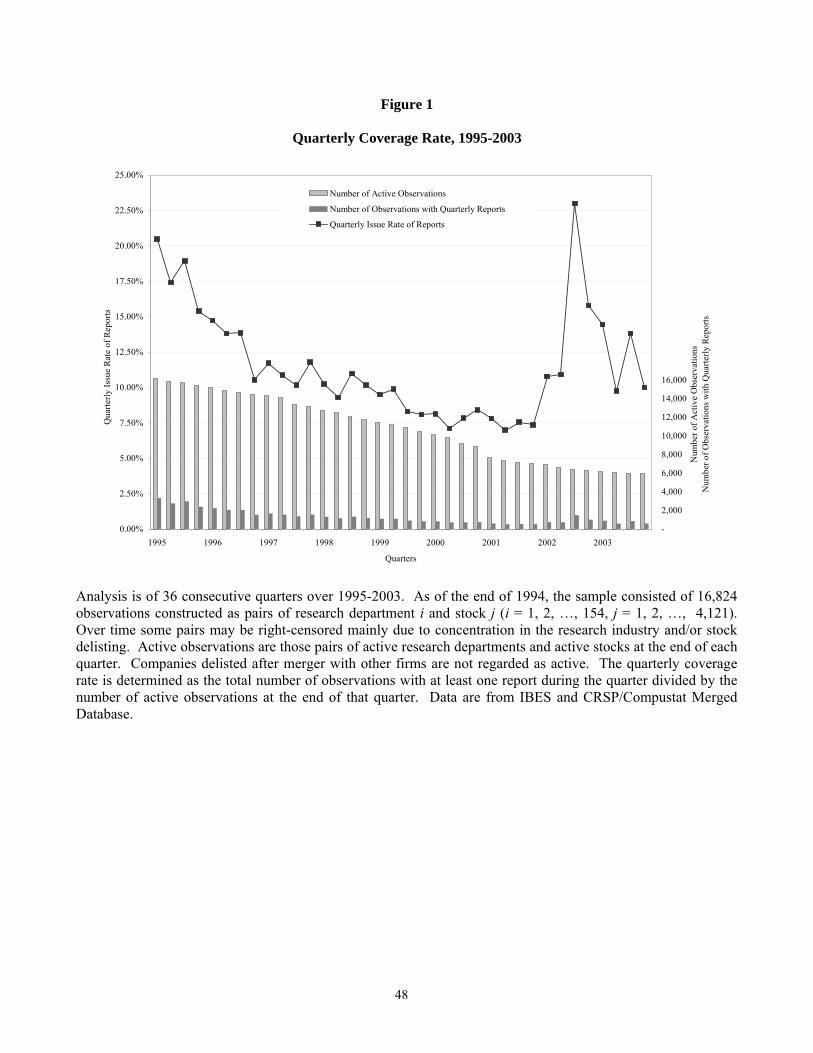
48
Figure 1
Quarterly Coverage Rate, 1995-2003
0.00%
2.50%
5.00%
7.50%
10.00%
12.50%
15.00%
17.50%
20.00%
22.50%
25.00%
1995 1996 1997 1998 1999 2000 2001 2002 2003
Quarters
Qua
rterly
Issu
e R
ate
of R
epor
ts
-
2,000
4,000
6,000
8,000
10,000
12,000
14,000
16,000
18,000
20,000
22,000
24,000
26,000
28,000
30,000
32,000
34,000
36,000
38,000
Num
ber o
f Act
ive
Obs
erva
tions
Num
ber o
f Obs
erva
tions
with
Qua
rterly
Rep
orts
Number of Active Observations
Number of Observations with Quarterly Reports
Quarterly Issue Rate of Reports
Analysis is of 36 consecutive quarters over 1995-2003. As of the end of 1994, the sample consisted of 16,824 observations constructed as pairs of research department i and stock j (i = 1, 2, …, 154, j = 1, 2, …, 4,121). Over time some pairs may be right-censored mainly due to concentration in the research industry and/or stock delisting. Active observations are those pairs of active research departments and active stocks at the end of each quarter. Companies delisted after merger with other firms are not regarded as active. The quarterly coverage rate is determined as the total number of observations with at least one report during the quarter divided by the number of active observations at the end of that quarter. Data are from IBES and CRSP/Compustat Merged Database.
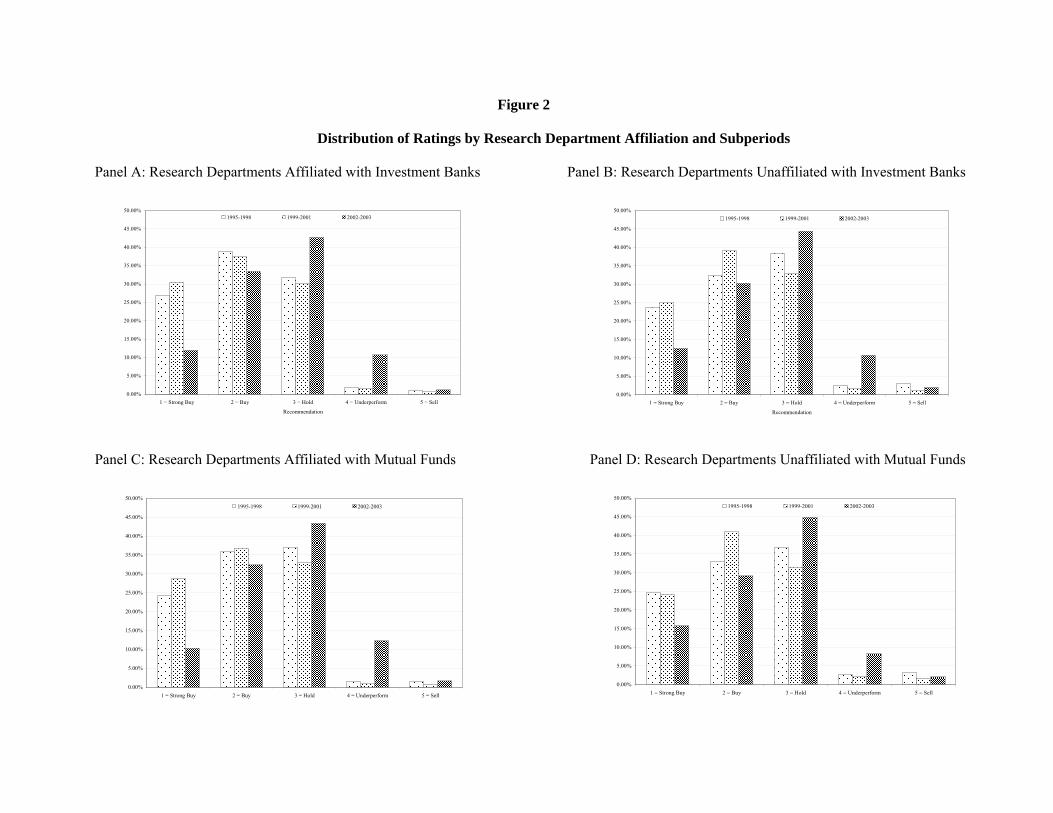
Figure 2
Distribution of Ratings by Research Department Affiliation and Subperiods
Panel A: Research Departments Affiliated with Investment Banks Panel B: Research Departments Unaffiliated with Investment Banks
Panel C: Research Departments Affiliated with Mutual Funds Panel D: Research Departments Unaffiliated with Mutual Funds
0.00%
5.00%
10.00%
15.00%
20.00%
25.00%
30.00%
35.00%
40.00%
45.00%
50.00%
1 = Strong Buy 2 = Buy 3 = Hold 4 = Underperform 5 = Sell
Recommendation
1995-1998 1999-2001 2002-2003
0.00%
5.00%
10.00%
15.00%
20.00%
25.00%
30.00%
35.00%
40.00%
45.00%
50.00%
1 = Strong Buy 2 = Buy 3 = Hold 4 = Underperform 5 = Sell
Recommendation
1995-1998 1999-2001 2002-2003
0.00%
5.00%
10.00%
15.00%
20.00%
25.00%
30.00%
35.00%
40.00%
45.00%
50.00%
1 = Strong Buy 2 = Buy 3 = Hold 4 = Underperform 5 = Sell
1995-1998 1999-2001 2002-2003
0.00%
5.00%
10.00%
15.00%
20.00%
25.00%
30.00%
35.00%
40.00%
45.00%
50.00%
1 = Strong Buy 2 = Buy 3 = Hold 4 = Underperform 5 = Sell
1995-1998 1999-2001 2002-2003