Embed Size (px)
Citation preview
1
Affirmative Action Bans and the “Chilling Effect”
Kate Antonovics (UCSD) and Richard Sander (UCLA)
March 24, 2010
PRELIMINARY DRAFT PLEASE DO NOT CITE WITHOUT AUTHORS’ CONSENT
Abstract: This paper examines whether California’s Proposition 209, which led to the 1998 ban
on the use racial preferences in admissions at the University of California (UC) system, had a
chilling effect on underrepresented minorities, lowering enrollment rates for these students by
reducing the intrinsic appeal of the UC system. Using a new data set containing individual-level
data on every freshman applicant to the UC system from 1995 to 2000, we find little evidence of
chilling effects in enrollment rates. Instead, our analysis provides consistent evidence of a modest
“warming effect.”
I. Introduction
Starting with the entering class of 1998, state law prohibited the University of
California system from using racial preferences in admissions. Although the origins of
this policy were complex, its proximate cause was the passage of Proposition 209 (Prop
209) in 1996, which prohibited public institutions from giving preferential treatment on
the basis of race, sex or ethnicity. In the mid-1990s, when Californians debated this ban
on the use of racial preferences at the University of California, one of the most fiercely
contested questions concerned the “chilling effect” of the bans.1 Almost everyone agreed
1 To give a few examples: Robin Isenberg, General Counsel for Mills College in Oakland, California,
commented just after Proposition 209, “I’ve heard that educators are worried that qualified minority
students are not applying to the UC system because they feel they will be rejected or don’t like the
environment.” So it may well “be the role of independent institutions like Mills to encourage qualified
minority students to think about higher education and not have their dreams and aspirations cut off by what they see in the news.” San Francisco Chronicle, Nov. 7, 1996, p. A21. UC Berkeley Chancellor Chang-
Lin Tien, a strong opponent of Prop 209, observed in October 1996, “I’ve visited urban inner-city
schools….many students feel, ‘Why should I work anymore? I’m a second-class citizen.’ I think 209 will
have that kind of impact.” Los Angeles Times, October 21, 1996, p. A3. Jerome Cohen, president of the
Association of American Medical Colleges, observed, “It’s our strong belief that what we see in California
2
that a preference ban would directly reduce the proportion of underrepresented minorities
(URMs) admitted to the UC system, especially at the more elite campuses like Berkeley
and UCLA, but for many the more pressing question was whether the bans would cause
fewer URMs to apply to UC schools, and fewer to accept offers extended, because of
perceptions that the bans would change the college campuses in ways that would make
them less attractive to URMs.2 The answer to this question was crucial, because even the
most ardent opponent of racial preferences would presumably take pause if a ban would
lead qualified minority applicants to eschew the affected schools.
Over a decade later, this question remains largely unanswered, even as bans on
the use of racial preferences in college admissions have spread to other states (well over a
fifth of college-age Americans now live in states whose public universities are covered
by some type of ban on the use of racial preferences). While some recent research has
begun to investigate the prevalence of chilling effects, there are still very few empirical
studies on this issue.
To assess whether URM interest in the UC system was chilled by Prop 209, we
examine how enrollment rates (the probability of enrolling conditional on being
admitted) changed for URMs relative to non-URMs between the three-year period before
(1995-1997) and after (1998-2000) Prop 209. To do this, we obtained a rich and
underutilized dataset from the University of California, containing data on all freshmen
applicants to all undergraduate UC campuses from 1995 through 2000. To our
knowledge, our study is the first to use detailed individual-level data to look for evidence
[declining minority enrollments in UC medical schools] is in part the result of an atmosphere of
unwelcomeness about the California system.” 2 In the UC system, URMs include African Americans, Mexican Americans, Latinos and Native
Americans.
3
that bans on the use of racial preferences lead to chilling effects in enrollment rates.
These individual-level data allow us to control for differences in the composition of the
applicant pool before and after Prop 209. In addition, because our data reveal every UC-
school to which students were accepted, we can examine enrollment decisions controlling
for students’ choice sets within the UC-system. This is crucial because if Proposition 209
changed the size and quality of UC schools to which URMs were admitted, then alone
this is likely to affect enrollment decisions, even if there is no change in the intrinsic
value URMs place on UC-schools
Interestingly, we find evidence of a modest increase in the propensity of URMs to
enroll in UC-schools after Prop 209 took effect. In fact, rather than the significant drop
in enrollment rates predicted by the chilling effect hypothesis, we find a modest but
consistent warming effect.
II. Background and Definitions
The Effect of Prop 209 on the Admissions Process
Although Prop 209 prohibited UC schools from using race as an explicit criterion
in admission, it did not prevent them from changing their admissions process in ways that
might continue to promote racial diversity (for example, by giving a preference to
students from single-parent families, a large fraction of who are either Hispanic or
African-American). In fact, there is overwhelming evidence that the UC system and the
individual campus have made changes to the admissions process to accomplish exactly
this. Changes to a campus’s admission process, however, take time to implement since
4
they require system-wide approval, and it is not clear how much (if at all) the overall
admissions process at the difference campuses changed in the few years immediately
following Prop 209. At UCSD, for example, other than the fact that URMs and non-
URMs were held to identical standards after Prop 209, there was no change from 1998-
2000 in the way in which points were allocated to the various dimensions of a student’s
record.3 In 2001, however, partly as way to increase racial diversity, the UC system
introduced a number of widespread changes to the admissions process, including what
was termed “eligibility in a local context”, whereby students in the top four percent of
their high school were guaranteed admission to a UC school as long as they completed
specified academic coursework by the end of their junior year. Partly for this reason, our
post Prop 209 period only extends from 1998-2000.
Defining Chilling Effects
In the heavily political atmosphere of affirmative action, nearly all terms –
including “affirmative action” itself – have contested meanings. “Chilling effect” has
been used to characterize a wide variety of feared consequences from a ban on the use of
racial preferences, ranging from the dousing of “affirmative” efforts to heal race
relations, to the pall that a ban could cast over race relations or the hypothesized greater
reluctance of minorities to participate in college classrooms with shrinking numbers of
minority peers. In this paper, we examine a very specific question: did California’s
adoption of bans on racial preferences lower the value that minority students placed on
attending the University of California?
3 We are in the process of gathering detailed information on how the other campuses responded to Prop
209.
5
There are two ways that chilling effects, as we have defined them, are usually
thought to operate. First, an affirmative action ban might be taken to connote
institutional hostility to URMs. If the University of California has renounced policies of
inclusion that most universities embrace, doesn’t this cause it to stand out as an
institution with a markedly less favorable attitude towards minorities?4 Might that not be
taken as a signal of other “minority-unfriendly” university policies that are important but
harder to observe? Second, a ban on preferences would reduce minority enrollments, at
least on some campuses, and on those campuses entering minority students would be part
of smaller URM cohorts. This could make prospective students more concerned about
isolation on campus, the absence of peer groups, and the absence of the “critical mass” of
URMs often invoked by affirmative action proponents as a key rationale for preferences.5
As an empirical matter, both stories are a little complicated in the UC context. At
the institutional level, UC administrators went to considerable lengths to avow their
opposition to Prop 209 and to emphasize the university’s commitment to diversity.
Several campuses launched outreach programs aimed, in part, at reassuring minority
4 See footnote 1 for a couple of examples, and the following: Victoria Valle, the head of admissions at Spellman College and a former recruiter for UC San Diego, observed as Prop 209 was implemented that
her students considering graduate work are less likely to be looking towards California. ‘They can go just
about anywhere….They’re going to want to go to places where they can feel valued.” “Diversity at UC
California,” California Journal, November 1, 1997. Judy Baca, vice-chair of UCLA’s Chavez Center for
Chicana and Chicano Studies, commented in June 1998, “Essentially, we are privileging the privileged and
putting out a chilling effect to the minority population….People are beginning to feel that they are
unwelcome at educational institutions like UCLA.” Neal Narahara, “Proposition 209 Damages Diversity,”
The Daily Bruin, June 29, 1998. 5 For example: Nile Taylor, a fourth-year student at Berkeley in 2004 observed: “It’s hard to be one of the
only Black students in a class of 700. It’s an added weight to an already difficult situation. It’s getting
harder to look (at high school students) in the eye and tell them that Cal’s the best school to go to.” Carl
Williams, a junior at Berkeley in 2004, observed, “The situation is not conducive to Black students coming here…It’s difficult as students here to reach out to [prospective minority students] and tell them they’ll be
welcome with open arms. It’s pretty obvious that they won’t have as good a social experience.” Both
quotes are from Pamela Burdman, “Shut Out of the System; As Competition Increases for Slots at UC
Berkeley, Admission Offers to Minority Students Continue to Decline,” 21 Black Issues in Higher
Education 30-31 (2004).
6
applicants that they were still very much sought after by the university. On the other
hand, UC was more directly implicated in the preferences ban than were the state
university systems of Florida, Michigan and Washington, where similar bans were
introduced, because the UC Regents had adopted resolutions committing the university to
an eventual ban on racial classifications in 1995, more than a year before Prop 209
passed.
The critical mass story is complex, too. While black and Hispanic enrollments
fell at the more elite UC campuses after Prop 209, minority enrollments increased at
other campuses. It is hard to assess how prospective freshmen expected the racial
composition of the different UC campuses to change after Prop 209, but we might at least
expect any chilling effect to have varied from one campus to another. Partly for this
reason, our analysis separately examines each individual campus as well as the UC
system as a whole.
As we have noted, arguments for chilling effects played a prominent role in the
debate over Prop 209. The idea that Prop 209 could have had an opposite “warming
effect” was never advanced in the debate, to our knowledge. (Proponents of Prop 209
emphasized arguments about the intrinsic unfairness of racial classifications.) There are,
however, plausible theoretical grounds for warming effects. According to standard
signaling models, students attend elite schools partly as a way of signaling to future
employers their underlying motivation and ability. A university’s use of racial
preferences could muddy or decrease the value of this signal, if employers assume that
URMs were offered admission as much because of their race as because of their
academic credentials.
7
In light of this, a ban on racial preferences, such as UC faced in the wake of Prop
209, could plausibly increase in the signaling value of a UC degree for URMs after Prop
209. A black candidate deciding between Berkeley and Stanford, for example, might
conclude after Prop 209 that the signaling value of a degree from Berkeley, where there is
little or no suspicion of racial preferences in admission, is greater than the signaling value
of a degree from Stanford, where the suspicion of racial preferences in admissions is
substantially higher.
For related reasons, URMs may feel more comfortable and be more successful at
a school if, ceteris paribus, their professors and fellow students believe that they were
admitted solely on the basis of academic credentials. Thus, while the policy debate has
focused on the chilling effects of affirmative action bans, warming effects are plausible as
well.
III. Past Research
To date, there has been relatively little research on whether bans on the use of
racial preferences in college admissions negatively impact minority enrollments, but a
small number of papers have examined the effect of Prop 209 on application behavior.
This is relevant because if Prop 209 had a chilling effect on enrollments, we might expect
it to have a chilling effect on applications as well. Long (2004), examines the impact of
Prop 209 on application behavior using data from the College Board on the schools to
which high school students send their SAT scores. Long sees Prop 209 as creating a way
to examine how students’ application decisions are affected by their probability of
admission. He makes no attempt, however, to determine whether changes in SAT
8
sending behavior after Prop 209 arose because minorities find the UC system less
appealing after Prop 209 (the chilling effect hypothesis) or because students are less
likely to apply to schools when they believe they have little chance of being accepted. In
fact, Long's methodology implicitly assumes away chilling effects as we have defined
them.
Like Long, Card and Krueger (2005) also use data from the College Board to
examine how Prop 209 affected high school student’s SAT sending behavior. Unlike
Long, however, Card and Krueger focus on identifying the effect of Prop 209 on minority
enrollment. Card and Krueger find a small but statistically significant decrease in the
probability that URMs send their SAT scores to UC schools after Prop 209. When they
focus on students with high academic credentials, however, this trend is reversed and
they find a small increase in the propensity of minority students to send their scores to
the UC system, and this pattern is particularly pronounced for the most selective UC
campuses (Berkeley, UCLA and UC San Diego).6
To our knowledge, the only other paper that focuses on the effect of Prop 209
enrollment is Barrios (2006). Barrios examines whether students admitted to the elite UC
campuses (Berkeley, UCLA, and San Diego) were more or less likely after Prop 209 to
enroll, given an offer of admission, using statistics aggregated by race, year and campus.
He finds evidence that minorities were less likely to enroll post-209. Since Barrios is
unable to control for individual-level characteristics, however, it is difficult to interpret
6 Card and Krueger also examine a similar ban on the use of racial preferences in Texas and find the
opposite pattern: a very slight increase in the propensity of all minority SAT-takers to send their scores to
selective in-state public schools, and a very slight decrease in the propensity of high-credential minority
students to send their scores to these schools.
9
the patterns he observes in the data since the characteristics of admitted students
(particularly URMs) changed considerably after Prop 209.
IV. Empirical Strategy
To assess whether Prop 209 increased or decreased the value URMs place on
attending UC schools, our analysis focuses on changes in enrollments for URMs relative
to non-URMs after Prop 209. There are, however, a number of ways in which Prop 209
may have affected minority enrollments for reasons unrelated to chilling or warming
effects. In this section, we identify these complicating factors and explain how we
account for them with our empirical strategy.
First, the likelihood of accepting an offer of admission from any particular UC
campus depends on what other offers a student receives. A student admitted to UCLA,
for example, is far more likely to accept the offer if she has been turned down by
Berkeley. Since URMs’ probability of admission (particularly at the more elite
campuses) plummeted after Prop 209, it is important to control for each applicant’s UC
choice set in measuring enrollment rates. Fortunately, our data allow us to do so, and in
our empirical specification, we include indicator variables for whether a student was
admitted to each of the UC schools.
Enrollment rates at particular schools also vary with the academic strength of the
admitted student. As we demonstrate below, students with relatively higher credentials
generally have lower enrollment rates, presumably because they have a wider set of
attractive alternatives. In addition, since Prop 209 led to a higher average level of
academic credentials among admitted URMs (the improvement is particularly noticeable
10
at the more elite campuses), we would expect, all else equal, the enrollment rates of
URMs to be lower after Prop 209. Here again, the richness of our data enables us to
control for changes in student characteristics before and after Prop 209 by including a
broad set of controls for academic achievement and family background.
With this discussion in mind, we estimate the following equation using OLS:
(1) Yij= 0+ 1URMi+ 2posti+ 3URMi*posti+ Xi+ Aij+uij,
where Yij is an indicator for whether student i enrolled in school j conditional on being
accepted to school j, URMi is an indicator for whether student i is an underrepresented
minority, posti is an indicator for whether the student was making their enrollment
decision before or after Prop 209 went into effect, Xi is a vector of student and family
background characteristics, and Aij is a vector of indictor variables describing the set of
other UC schools to which student i was admitted. The parameter of interest is 3, which
captures the change in the probability of enrollment for URMs before and after Prop 209
relative to the change in the probability of enrollment for non-URMs. We conduct this
analysis separately for each of the eight schools in the UC system and for the UC system
as a whole.
V. Data: Strengths and Limitations
The Office of the President at the University of California (UCOP) has, for many
years, gathered systematic data from the various UC campuses and has integrated this
individual-level data into a master database of UC students. Covering every applicant for
freshman admission to UC, and every enrolled UC freshman, from 1992 through 2006,
the dataset includes over thirty variables on nearly one million applicants and students at
11
the eight UC undergraduate campuses, including each person’s application
characteristics, each campus applied to, the outcome of each application, the campus (if
any) the applicant eventually enrolled in, the student’s intended and eventual major, the
student’s academic performance in college and his or her eventual graduation outcomes.
Although the database is occasionally used by UCOP analysts for research, the data have
been primarily used for administrative and reporting purposes, and thus have been, from
a research standpoint, a greatly underutilized resource.
In the summer of 2007, a consortium of labor economists approached UCOP with
a request to use the data for a coordinated series of studies on the effects of Prop 209.
The group initially asked that the data be made available intact under a confidentiality
agreement. When UCOP rejected this proposal, the consortium submitted a formal
request for the data under California’s Public Records Act. Of course, any publicly
released database that contains direct or indirect identifying information about individuals
must be processed to protect student confidentiality, and UCOP attorneys initially
contended that confidentiality issues precluded any data release at all. After many
months of negotiation, UCOP offered to release a version of the dataset that included
most of the relevant variables, but collapsed many classification categories to protect
student confidentiality.7 This led to the release of a public dataset (“the UCOP dataset”)
in August 2008.
This background is helpful in understanding the strengths and limitations of the
UCOP dataset. Its strengths include the vast number of students included, the breadth of
variables included, and the use of consistent data-collection methods over a fifteen-year
7 In the field of education research, confidentiality of student information in databases is generally
protected by making sure that no combination of indirect identifiers produces a “cell size” with less than
some minimum number of people.
12
period. Since the eight undergraduate UC campuses span a wide breadth of academic
prestige, and the period covered by the database (1992 through 2006) covers significant
periods both before and after Prop 209’s passage and implementation, the dataset is a
unique resource for studying the effects of Prop 209.8
A key weakness of the UCOP dataset is the combination of important analytic
categories, which, as mentioned above, was done to make the number of people in unique
cells larger, thereby assuring that individual students could not be identified through any
combination of publicly-known characteristics.9
Two of these combinations are particularly relevant here. Race was condensed
from nine to four categories: White, Asian, URM and Other/Unknown. In the UCOP
data, the category “URM” includes American Indians, Blacks, Chicanos and Latinos.
This is a sensible grouping since these are the races and ethnicities which received
preferential admission consideration before Prop 209. It does, however, mean that we
cannot separately examine outcomes for blacks, Hispanics and American Indians, but
instead must use “URM” as the race variable of interest. The category “White” includes
non-Hispanic whites; “Asian” includes students who identify as Asian, Indian/Pakistani
or Filipino. Finally, the “Other/Unknown” category includes both students who indicate
their race is “Other” and students who chose not to reveal their race ( “Unknown”).
It is important to assess the likely race of students in the “Other/Unknown”
category because, while the overall number of applicants to the UC system was
8 Although the complete data set spans 15 years, the analysis in this paper, however, focuses on the three-
year period immediately before and immediately after Prop 209. 9 Government agencies that disclose data regularly generally have “minimum cell size” standards of five
(and sometimes less); that is, they insure that no cross-tabulation of publicly-known characteristics about
individuals in the database produces cells with fewer than five observations. The UCOP insisted on
keeping minimum cell sizes of many dozen, which in turn led to broader categories than were really
necessary for privacy purposes.
13
approximately 20 percent higher in the post-Prop 209 period (1998-2000) than in the pre-
Prop 209 period (1995-1997), the number of students in the “Other/Unknown” group
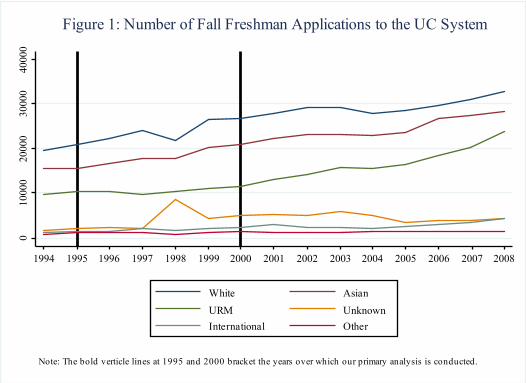
increased by over 120 percent, rising from 6 percent to 11 percent of the total. Using
aggregate application numbers from the UC-System’s StatFinder web page10, Figure 1
traces out application numbers for more detailed year and race categories than are
available in the UCOP data. As the figure reveals, the large jump in the number of
applicants in the “Other/Unknown” category after Prop 209 that we see in the UCOP data
appears to be driven by a sharp jump in the number of applicants who chose not to report
their race (the “Unknown” category) rather than by an increase in the number of students
who report their race as “Other”. In addition, this 1998 jump in the “Unknown” category
corresponds to a fall in applications from Whites and a downward break in the trend for
Asians, suggesting that students who do not report their race in 1998 (those in the
“Unknown” category) are primarily White and Asian. In addition, the average
characteristics of students in the “Other/Unknown” category more closely match the
average characteristics of Whites and Asians than those of URMs. For example, in our
sample, the average Math SAT score for students applying before Prop 209 is 608.3 for
students in the “Other/Unknown” group, 608.4 for Whites, 626.2 for Asians, and 527.9
for URMs. For the purposes of this analysis, therefore, we combine the categories White,
Asian and “Other/Unknown”, into the category “non-URMs.”
UCOP’s other relevant change in the original data was its consolidation of
matriculation years into three-year cohorts (1992-1994, 1995-1997, 1998-2000, 2001-
2003, and 2004-2006). This means that we cannot break down results by individual
years. This is only a minor problem in our analysis since Prop 209 went into effect in
10 http://statfinder.ucop.edu/

14
undergraduate admissions beginning with the Fall 1998 cohort, and we thus can cleanly
compare the three years before Prop 209 (1995-1997) with the three years after
implementation (1998-2000).
The UCOP dataset also groups SAT scores into 50-point intervals and high school
GPA (“HSGPA”) into 0.25-point intervals, but these modifications have little effect upon
our analysis, particularly since UCOP calculated for us, and included in the dataset, an
indexed combination of SAT I scores and HSGPA that uses the original, exact values.11
These limitations are offset by the strengths of the UCOP data. First, all data
about specific individuals is unified in the dataset. That means that we know, for a given
individual, all of the UC campuses to which that person applied, the outcome of all those
applications, and the campus (if any) at which the individual eventually matriculated.
We also have strong indicators of the applicant’s academic credentials at the time of
application including SAT math scores, SAT verbal scores, UC-adjusted high school
GPA and some SAT II scores.12 Additionally, students report their family income and
the education level of their parent with the most schooling.
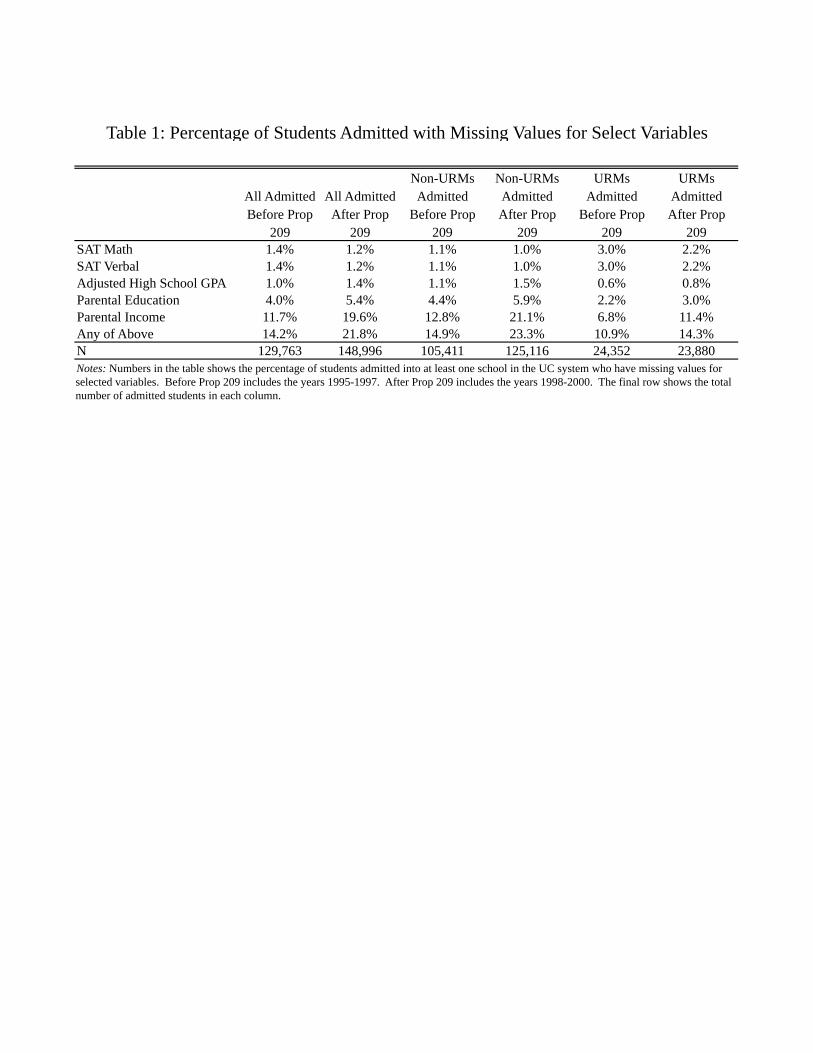
Unfortunately, there are a significant number of missing values for some of these
important variables, especially parental income. Table 1 shows the percentage of missing
values for students who are admitted to the UC system for the key demographic and
family background characteristics used in our analysis. As the table shows, in the years
prior to Prop 209 going into effect (1995-1997), approximately 11.7 percent of all
11 Some other variables are inexact because of UCOP’s original data collection methods. For example,
income data was only gathered in $10k increments, with “>$100k” the top category; “parental education” was gathered only for the parent with the highest educational attainment. 12 Other measures of academic qualifications, such as a measure of the academic strength of the applicant’s
high school (if they attended a California public school), are available for some of the years in our data, but
if the measure is not available for both our “pre-Prop 209” (1995-97) and “post-Prop 209” (1998-2000)
cohorts, we do not use it in our analysis.
15
students who were admitted to the UC system had missing values for parental income,
and after Prop 209, this number jumps to approximately 19.6 percent.
In the UCOP data, missing values arise because students sometimes choose to not
fill out certain pieces of information when they complete their applications. 13 A possible
explanation for why students choose not to report parental income is that the UC system
gives preferential treatment to students from disadvantaged backgrounds, and as a result,
students from relatively advantaged backgrounds may be reluctant to reveal information
they feel will hurt their chances of admission.14
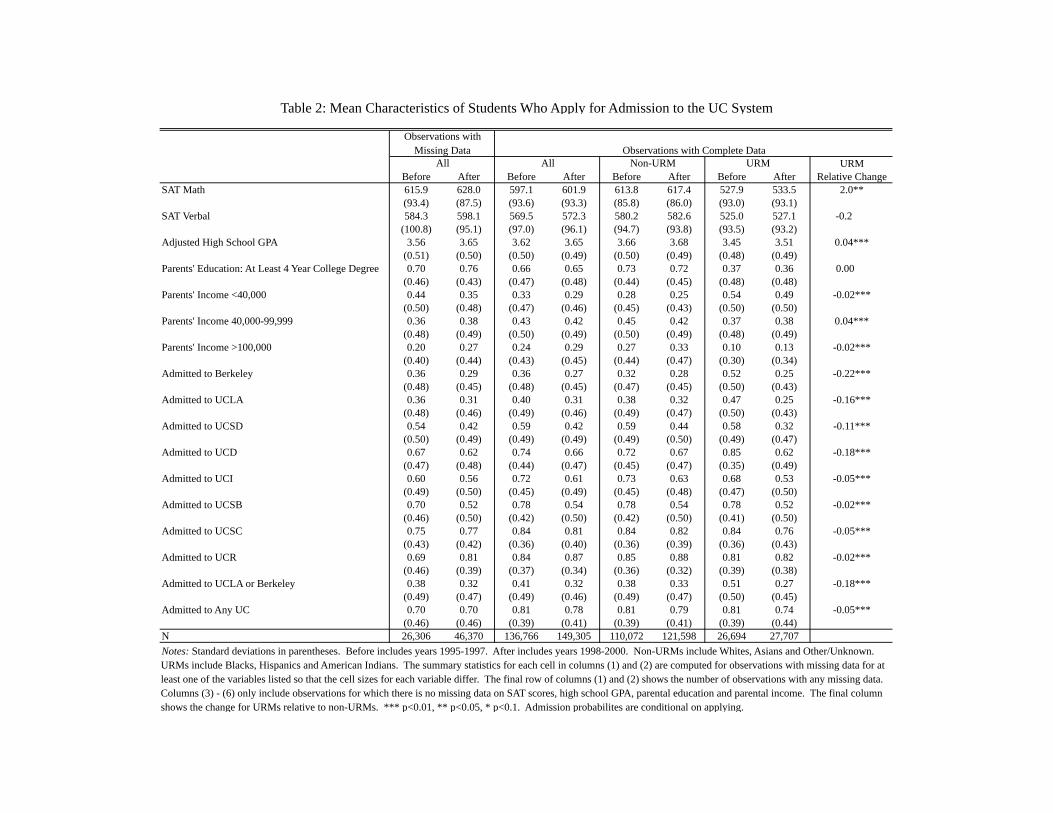
The first two columns of Table 2 show the mean characteristics of students
admitted to the UC system before and after Prop 209 for students with missing data for at
least one of the background characteristics listed in the table. Comparing these numbers
to those in the next two columns, which show the mean characteristics of students with
no missing values, we see that students with missing values for at least one of the
variables listed tend to have higher SAT scores, higher high school GPAs and have
parents with higher levels of education, suggesting that these students are not from
disadvantaged backgrounds. In addition, as Table 1 indicates, a larger fraction of non-
URMs than URMs fail to report parental income. Since there was a perception that
schools in the UC system would place a heavier weight on family background
characteristics after Prop 209 went into effect, this also may help explain why the
percentage of students who chose to not reveal parental income jumped after Prop 209.
13 Missing values, especially for parental income, are a problem in most student databases relying on self-reports. For example, the College Board asks SAT applicants to report family income, but a large
proportion decline to do so (and, as in the UCOP dataset, the proportion of non-reporters has grown over
time). In recent College Board cohorts, over 30% of students do not report parental income. 14 Staff in the admissions office at UCSD also believe that this is the most plausible explanation for the
missing values.
16
In our initial analysis, we drop observations with missing values for parental
income as well as the other demographic and family background variables we use in our
analysis. As the second to last row of Table 1 indicates, this implies that we lose 14.2 of
all observations in the years before Prop 209 and 21.8 of all observations in the period
after Prop 209. We then investigate whether our results are sensitive to the exclusion of
observations with missing values.15
Table 2 provides summary statistics for our data for all applicants to the UC
system. Not surprisingly, the table shows that URM applicants tend to have weaker
average academic credentials and come from more disadvantaged family backgrounds
than do non-URMs. In addition, the final column shows a small but statistically
significant increase in the academic credentials (as measured by math SAT scores and
adjusted high school GPA) of URM applicants relative to non-URM applicants after Prop
209 went into effect. This pattern of increasing relative academic credentials also holds
at each of the eight campuses we examine.16 That the relative academic ability of URM
applicants increases after Prop 209 is not surprising since URMs with low academic
credentials may have become reluctant to apply in the post Prop 209 era. With respect to
family background, there is no change in the parental education of URMs relative to non-
URMs, but interesting patterns immerge with respect to family income. There is a
relative decrease in the proportion of URM applicants from high-income and low-income
families, but a relative increase in the proportion from middle-income families. It is not
immediately obvious what is driving these changes, and they may at least partly be due to
15 The presence of missing values is correlated with the interaction between post and URM, raising concern
that some of our findings may be driven by changes in the composition of our sample before and after Prop
209. 16 One exception is UCSB where the SAT verbal score of URM applicants falls relative to that of non-
URM applicants. Averages for each campus are available from the authors upon request.

17
economy-wide changes in the relative income of URMs and non-URMs over this time
period. The final column of Table 2 also shows the dramatic effect of Prop 209 on the
probability of admission for URMs relative to non-URMs, and that the drop in the
probability of admission was much larger at the more elite campuses.
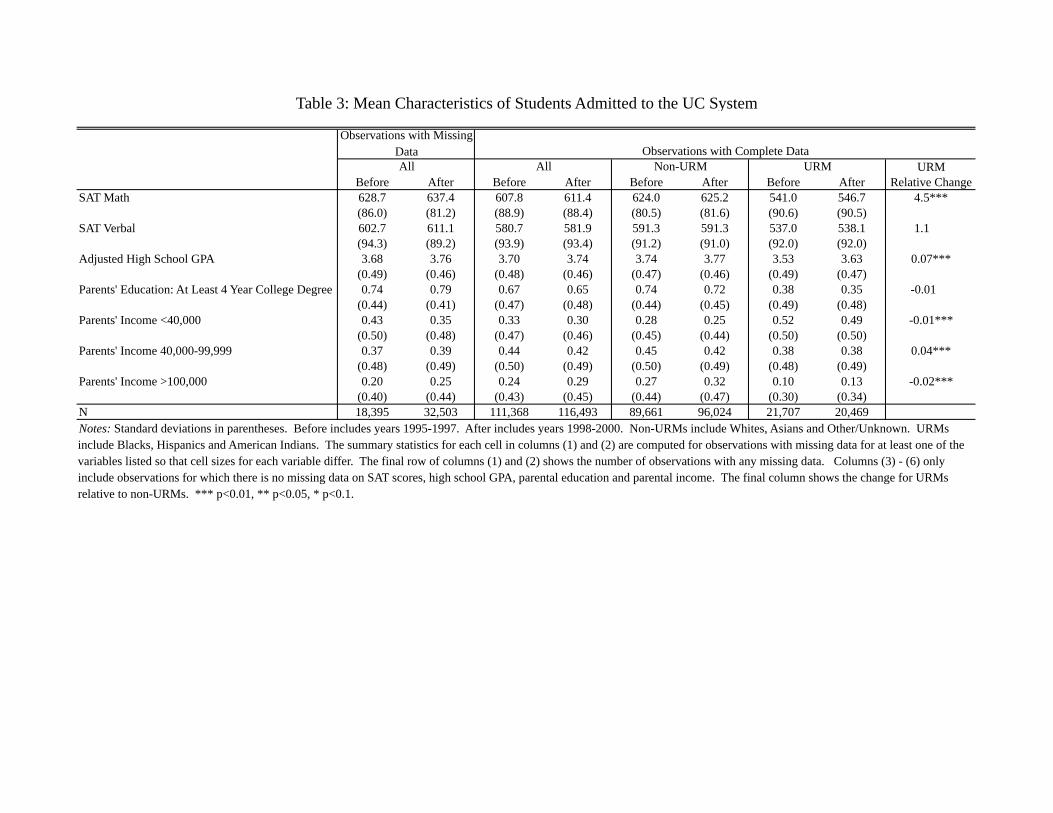
Whereas Table 2 focuses on students who apply to the UC system, Table 3 shows
the average characteristics of students admitted to the UC system. The final column
indicates a small but statistically significant increase in the academic credentials of
admitted URMs relative to admitted non-URMs (as measured by math SAT scores and
adjusted high school GPA) after Prop 209. This relative increase in academic credentials
is to be expected given that URMs were subject to higher admission standards after Prop
209; accordingly, this relative increase is greater among students admitted to the more
selective UC schools.17 As we saw for applicants, there is no change in the parental
education of admitted URMs relative to admitted non-URMs. In addition, we again see a
small but statistically significant relative decrease in the proportion of URM applicants
from high-income and low-income families, and small but statistically significant
increase in the proportion from middle-income families. Looking at each individual
campus, it appears that parental income and parental education fell for URMs relative to
non-URMs at the more elite campuses (like Berkeley, UCLA and UCSD) but increased at
the less elite campuses (like UCSC and UCR).
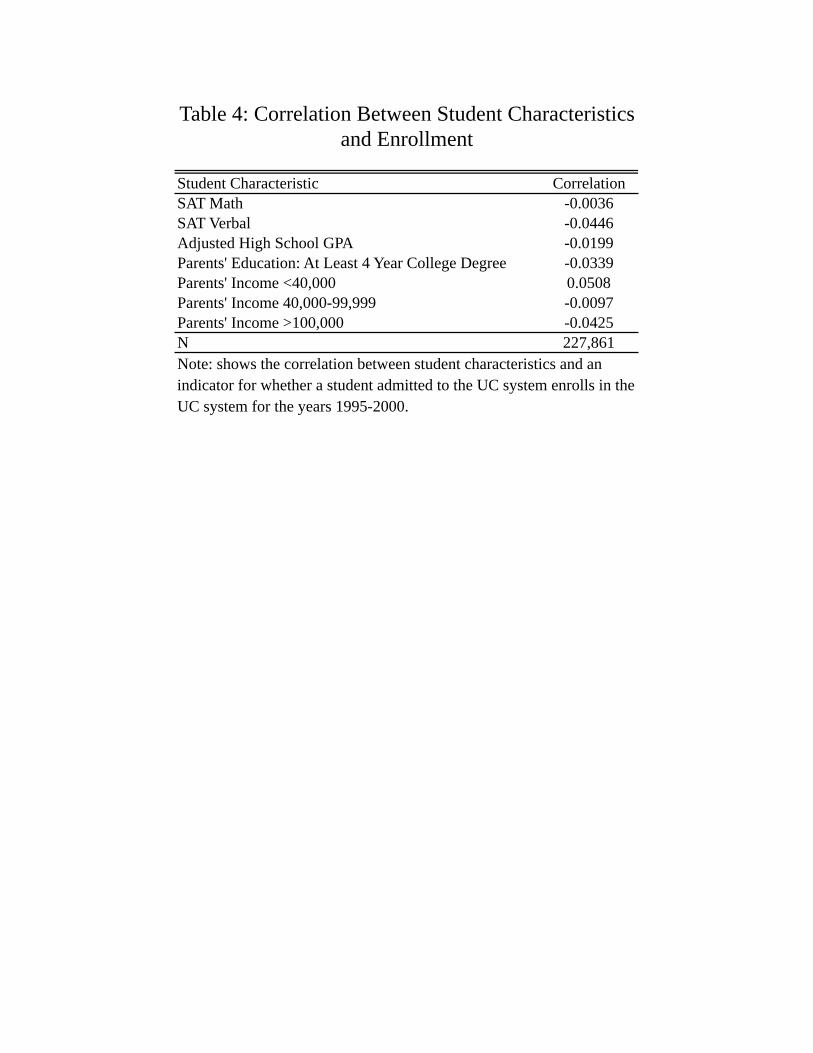
In order to gauge how the changing demographics of URMs relative to non-
URMs may have affected enrollment probabilities, Table 4 shows the correlation between
student characteristics and whether an admitted student enrolls in a UC school during the
time period we examine. As the table shows, students with stronger academic credentials
17 Averages for each campus are available from the authors upon request.
18
and who are from wealthier and more educated families are less likely to enroll in the UC
system, though the magnitudes are quite small. These correlations also hold at the
individual campuses we examine.18
VI. Results
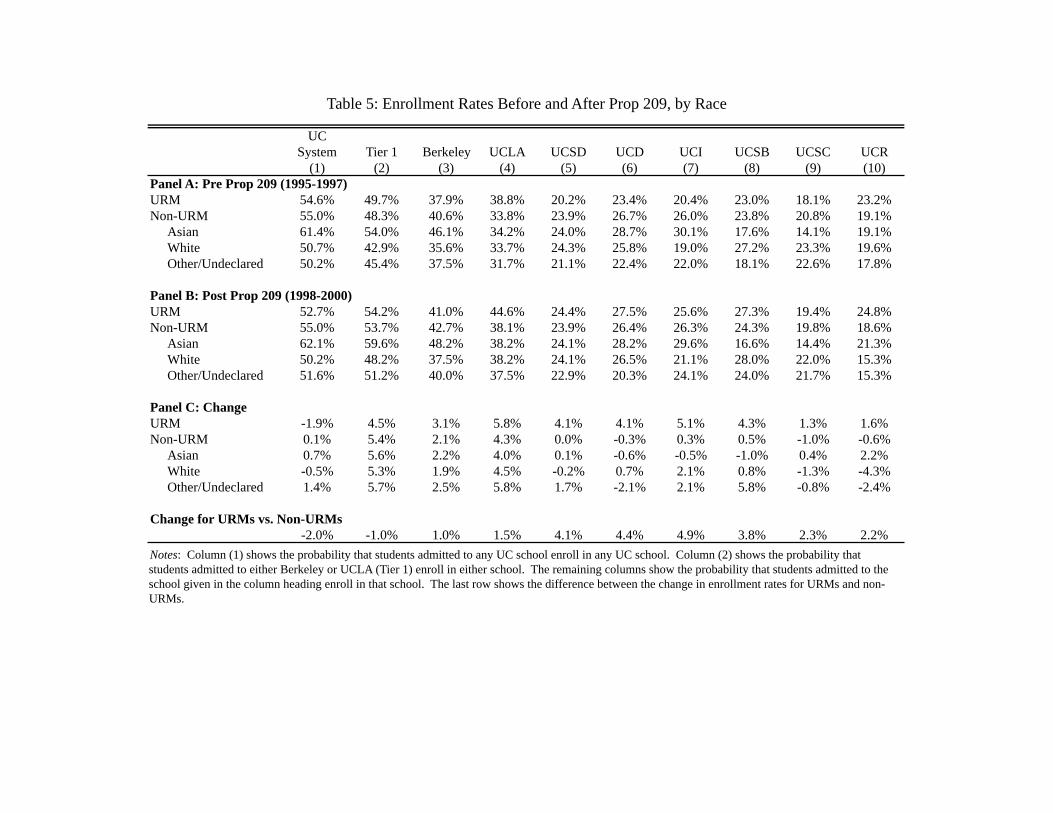
As a first cut at understanding how enrollment rates changed over time, Table 5
shows enrollment rates for each racial group in our data before and after Prop 209 took
effect. The individual campuses are listed in order of the average math SAT score of
admitted students, so that the campuses become less selective as you move from left to
right. Focusing on Panel C, which shows the changes in enrollments rates by racial
group, we see that enrollment rates for URMs increased at each of the eight campuses,
but decreased for the UC system as a whole. This apparent paradox is easily explained.
If URMs are admitted to a smaller number of UC schools after Prop 209, they may be
less likely to attend a UC school, but more likely to attend any given school to which they
are accepted. For Non-URMs, enrollment rates tended to increase at the more selective
schools and decrease at the less selective schools. The bottom row of Table 6 presents
the difference in the change in enrollment rates between URMs and non-URMs. Relative
to non-URMs, we see that enrollment rates for URMs dropped for the UC system and for
Tier 1 schools, but increased at each of the eight campuses.
To get a sense of the year-by-year changes in enrollment rates and to make sure
that the increase in the relative enrollment rate of URMs that we found in Table 6 is not
simply part of a long-term trend, we examine annual aggregate-level data from the UC’s
18 Two exceptions are UCSB, where the correlation between family income and enrollment is positive, and
UCSC, where the correlation between parental education and enrollment is positive.
19
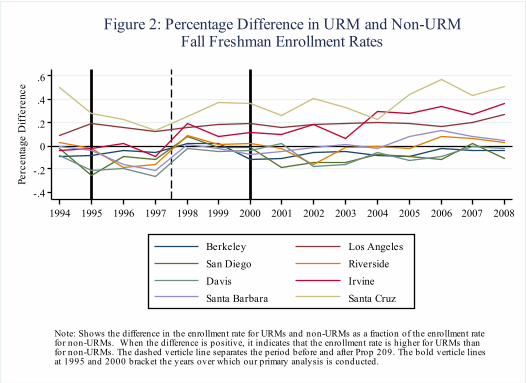
StatFinder web page.19 Figure 2 plots the difference between the URM and non-URM
enrollment rate as a fraction of the non-URM enrollment rate over time for each of the
eight UC campuses we study. As Figure 2 shows, there is a marked increase in the
enrollment rate of URMs relative to non-URMs in the year Prop 209 takes effect. In
addition, there is no evidence that the relative enrollment rate of URMs was increasing
prior to Prop 209.
Although these broad patterns are suggestive, drawing definitive conclusions
about chilling effects from these aggregate numbers would be overhasty for the reasons
discussed earlier; the relative academic credentials of URMs went up after Prop 209, and
their choice sets within the UC system shrank.
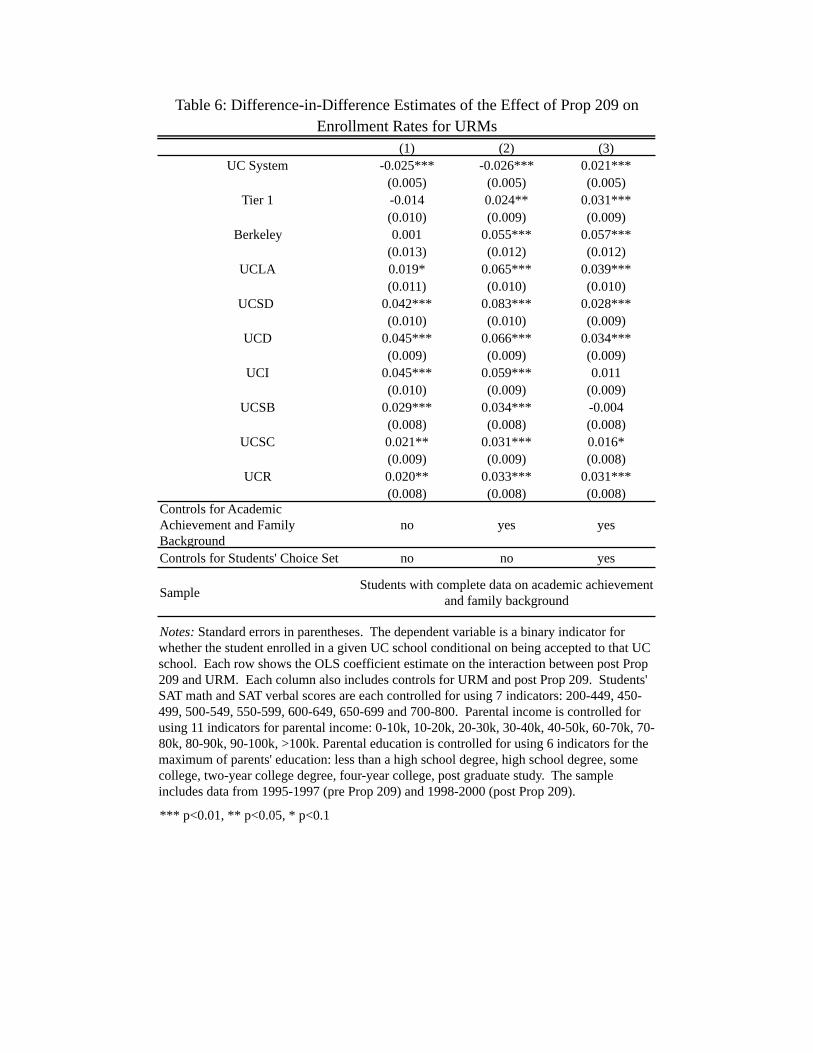
To control for these factors, Table 6 presents the coefficient estimates on the
interaction between URM and post from Equation (1). We conducted a separate analysis
for the UC system as a whole, tier 1 schools (UC-Los Angeles and Berkeley) and each of
the eight UC campuses: UC-Berkeley, UC-Los Angeles, UC-San Diego, UC-Davis, UC-
Irvine, UC-Santa Barbara, UC-Santa Cruz and UC-Riverside.20
The first column presents the simple difference-in-difference estimates without
any controls for academic achievement, family background or the set of other UC schools
to which students were admitted. Column (1) indicates a statistically significant drop in
enrollment rates for URMs relative to non-URMs after Prop 209 for the UC system, but a
statistically significant relative increase in enrollment rates at all of the UC campuses
except Berkeley.
19 http://statfinder.ucop.edu/ 20 UC-Merced did not begin accepting students until Fall 2005 and is thus irrelevant to this analysis
20
In column (2), we add controls for SAT scores, high school GPA, parental income
and parental education. At each of the eight campuses, the addition of these controls
tends to increase the coefficient estimate on the interaction between post and URM. This
is to be expected since, as we saw in Table 4, the academic credentials of admitted
students increased for URMs relative to non-URMs after Prop 209, and students with
higher academic credentials are likely to have a greater number of attractive alternatives
outside the UC system.
In column (3), our preferred specification – and the full estimation of Equation (1)
– we also add controls for the set of other UC schools to which students were admitted.
For the UC system, adding indicators for the other schools to which a student was
admitted causes the coefficient estimate on the interaction term between post and URM
to go from negative and statistically significant to positive and statistically significant.
This marked change in coefficients from column (2) to column (3) is not surprising, since
URMs faced distinctly smaller choice sets after Prop 209 and column (3) controls for that
important relative change.
Looking down column (3), we now see small, but statistically significant increase
in the probability of enrollment for the UC system as a whole and for 6 of the 8 UC
campuses (Berkeley, UCLA, UCSD, UCD, UCSD and UCR). For UC-Irvine the point
estimate is also positive but is not statistically different from zero, and for UC-Santa
Barbara the point estimate is negative but statistically insignificant. The largest estimated
warming effect is at Berkeley, where enrollment rates for URMs increased by 5.7
percentage points relative to non-URMs. Given that the enrollment rate for URMs was
21
37.9 percent before Prop 209, this implies a 15 percent increase the enrollment rate for
URMs after Prop 209.
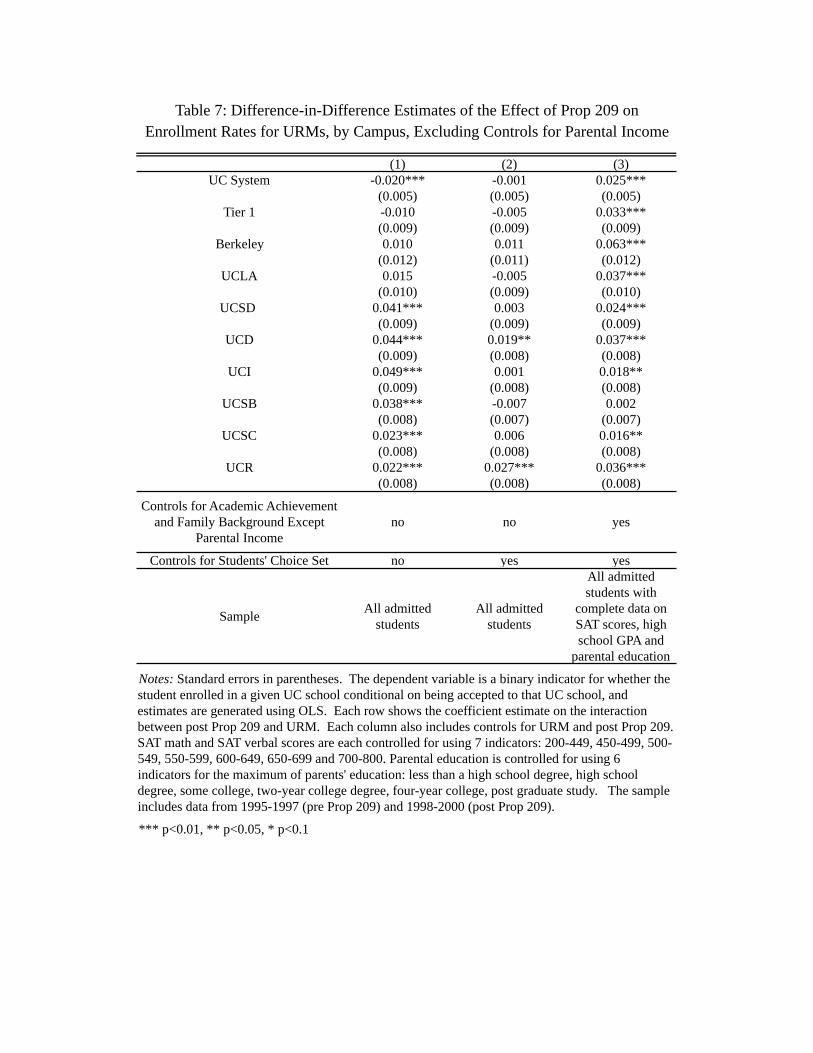
As mentioned above, approximately 14.2 percent of students admitted into the UC
system from 1995 to 1997 and 21.8 percent of students admitted from 1998 to 2000 have
missing information on various measures of academic achievement and family
background. Table 7 explores the sensitivity of our analysis to dropping students with
missing data. To do so, the first column of Table 7 repeats the analysis in the first
column of Table 6, but includes students who have missing data for our key variables. By
construction, the coefficient estimates on the interaction between post and URM in
column (1) of Table 7 should (and do) equal the numbers presented in the last row of
Table 5. More importantly, however, the coefficient estimates in the first columns of
Table 6 and Table 7 are very similar, suggesting that the results are not greatly driven by
dropping observations with missing values or by changes in the composition of our
sample over time.
As noted previously, the variable missing most frequently is parental income.
Thus, column (3) of Table 7 repeats the analysis in column (3) of Table 6, but excludes
controls for parental income and only drops observations with missing data on SAT
scores, high school GPA and parental education. This significantly increases our sample
sizes, and means that we are generally dropping less than a tenth of all observations. If
anything, the estimates in column (4) of Table 7 make the warming effect appear even
larger. For UC Irvine, the coefficient estimate on the interaction between post and URM
is now positive and statistically different from zero and for UC Santa Barbara the
22
coefficient estimate moves from negative to positive (though still statistically
insignificant).
VII. Discussion
Our results consistently show a modest but statistically significant increase in the
probability of enrollment for URMs relative to non-URMs after Prop 209. These results
are inconsistent with the chilling effect hypothesis. In this section, we discuss several
possible explanations for the relative increase URM enrollment rates.
One possibility is that observe increase in relative enrollment rates for URMs is
due to selection; if only URMs particularly interested in UC bothered to apply after Prop
209, then we would expect enrollment rates to rise. As Card and Krueger found, however,
there was no significant absolute or relative decline in URM application rates after Prop
209. This suggests that the applicant pool did not shift towards being comprised only of
URMs with a special interest in the UCs.
A second possible confounding effect is that the pool of admitted students may
have shifted in ways that we cannot control for using our data and that it is these
unobservable changes that account for the increase in the enrollment rate. In terms of
academic credentials, however, Table 3 indicates that the URMs admitted post-209 were
an academically stronger group and Table 4 suggests that students with strong academic
credentials are less likely to enroll. Thus, to the extent that we are missing relevant
information on academic credentials, this will tend to bias us towards finding a negative
impact of Prop 209 on URM enrollment.21
21 Footnote, we are also exploring whether we can use data from the College Board to gain additional
information on how the non-academic credentials of URMs changed after Prop 209.

23
Finally, changes in enrollment rates could be affected by changes in recruiting
and financial aid. Prop 209 prohibited university administrators from engaging in
racially targeted recruiting and from using racial preferences in the award of scholarships
and financial aid. Thus, although we do not yet have direct data on this point, we
suspect that changes in recruiting, scholarships and financial aid will also bias us against
finding an increase in enrollment rates for URMs. On the other hand, there is some
evidence that UC increased recruiting and need-based aid overall after Prop 209, and this
may have disproportionately benefited URMs. In addition, there is also evidence that
non-University affiliated groups (who were not directly affected by Prop 209) may have
stepped up efforts to recruit URMs to the UC system. The UCLA Black Student Alumni
Association, for example, is reported to have held a gala event for all URMs admitted to
UCLA in the year Prop 209 took effect. We are currently investigating the extent to
which recruitment and financial aid may have increased for URMs relative to non-URMs
after Prop 209.
A Signaling Explanation for the Warming Effect
A final explanation for the observed increase in the relative enrollment rate of
URMs after Prop 209 is that Prop 209 might have increased the value URMs place on
attending UC schools by increasing the signaling value of a UC degree. In this section,
we develop a simple signaling model and show if the signaling value of a UC degree did
increase after Prop 209, this effect should be larger for students with weak academic
credentials. We then test this prediction with our data.
24
Consider a simple environment in which individuals are endowed with two types
of ability: academic ability, denoted AA and non-academic ability, denoted AN, where AA
and AN are assumed to be independent. We assume that individuals are admitted to a
given college or university if a weighted average of their academic and non-academic
ability exceeds some threshold, S. That is, when
1AA+ 2AN S.
Perspective employers care about both dimensions of ability because output upon
graduation, Y, is assumed to depend on both AA and AN. That is,
Y= 1AA + 2AN.
Perspective employers can infer academic ability from an individual’s college
performance22, but they cannot perfectly observe non-academic ability. Instead,
employers make inferences about a person’s non-academic ability based the college
admissions process. In particular, employers calculate
E[AN | AN (S- 1AA)/ 2],
where, for simplicity, it is assumed that 1, 2 and S are common knowledge. Further,
labor markets are assumed to be perfectly competitive so that workers are paid their
expected productivity. Given this, employers pay workers a wage, w, where
w = 1AA + 2E[AN | AN (S- 1AA)/ 2],
and students enroll in a school if their expected wages from attending that school exceed
their total costs of attendance, C, where C includes both out-of-pocket expenses and the
value of the student’s next best alternative. That is, students enroll if
1AA + 2E[AN | AN (S- 1AA)/ 2] – C 0.
22 This assumption is trivial if one defines academic ability to be the part of total ability that can be inferred
from college performance.
25
Given this very simple model, the key to understanding how Prop 209 might
affect enrollment decisions is understanding how an increase in the threshold for
admission, S, affects E[AN|AN (S- 1AA)/ 2 ]. If we assume that AN~N(μ, ), then it can be
shown that E[AN|AN (S- 1AA)/ 2 ] is increasing and S and that these increases are larger
when 1AA is small. The intuition is that when academic ability is very high, being
admitted into college says very little about a person’s non-academic ability, and small
increases in the threshold for college admission do not greatly increase expectations
about non-academic ability. On the other hand, when academic ability is low, this
suggests that non-academic ability must be quite high, and as the threshold for college
admission increases, this translates into directly into increases in the expected value of
non-academic ability.
This yields two testable predictions. First, Prop 209 (which had the effect of
increasing S for URMs) should increase the relative enrollment rate of URMs. Second,
the increases in enrollment rate should be larger for URMs with low academic ability.
We have already seen that the first prediction is supported by our findings. To
examine whether this second prediction holds in our data, we summarize a student’s
academic ability using their predicted admission probability. In particular, for white
students who applied before Prop 209 (1995-1997), we use OLS to regress a binary
indicator for whether the student was admitted on math and verbal SAT scores, the
square of math and verbal SAT scores, adjusted high school GPA, the square of adjusted
high school GPA and controls for parental income and education. We do this separately
for the UC System as a whole, the two tier 1 schools (UCLA and Berkeley) and each of
the eight UC campuses. We then use the point estimates from these regressions to predict
26
the probability that each applicant to a given school (or set of schools) would have been
admitted if they were white and had applied for admission to a UC school before Prop
209. This predicted admission probability can be thought of as a one-dimensional
measure of student quality with different weights on the different measures of academic
achievement and family background. We then interact this predicted admission
probability with our indicator for URM, with our indicator for post Prop 209 and with the
interaction between post and URM, and add these interaction terms to Equation (1).
Results are presented in Table 8. The interaction between post and URM remains
positive and is statistically different from zero at 4 of the eight UC campuses and for the
UC system as a whole. For the remaining campuses, the interaction between post and
URM is not statistically different from zero. In addition, the triple interaction between
post, URM and predicted admission probability is negative and statistically different from
zero at 4 of the 8 campuses, is not statistically different from zero at three UC campuses
and is positive and statistical significant at only one campus, UCSC. The coefficient on
the triple interaction is also negative and statistically different from zero for the UC
system and for tier 1 schools. Thus, consistent with a signaling story, these results
broadly suggest that the warming effect we found in Tables 6 is driven primarily by
students with a low probability of admission, and that the warming effects are small (and
in some cases negative) for students with a high probability of admission.
VIII. Conclusion
The number of URMs enrolled at the most elite UC campuses fell by as much as
50 percent after Prop 209. This paper suggests that this dramatic drop arose not because
27
URMs were no longer interested in attending UC schools, but rather because they simply
were not admitted. In particular, we find little evidence that Prop 209 chilled URMs’
interest in attending in the UC system. Rather, we find small but consistent warming
effects in enrollment even after controlling for academic credentials and students’ choice
set within the UC system. One possible explanation for the warming effects in enrollment
is that Prop 209 may have increased the signaling value of attending UC schools.
Consistent with this explanation, we find that the warming effects in enrollment tend to
be much larger for students with low relative to high academic credentials.
28
References
Barrios, Thomas. “Effects of Ending Affirmative Action in California Universities.” UC
Berkeley, Department of Economics Senior Thesis, , December 2006.
Card, David and Krueger, Alan B. “Would the Elimination of Affirmative Action Affect
Highly Qualified Minority Applicants? Evidence from California and Texas.”
Industrial and Labor Relations Review, April 2005, 58(3), pp. 416-434.
Long, Mark C. “College Applications and the Effect of Affirmative Action.” Journal of
Econometrics, July-August 2004, 121(1-2), pp. 319-342.
Orfield, Gary and Miller, Edward, eds., Chilling Admissions: The Affirmative Action
Crisis and the Search for Alternatives, Cambridge, MA: Harvard Education
Publishing Group, 1998.
010
000
2000
030
000
4000
0
1994 1995 1996 1997 1998 1999 2000 2001 2002 2003 2004 2005 2006 2007 2008
White AsianURM UnknownInternational Other
Note: The bold verticle lines at 1995 and 2000 bracket the years over which our primary analysis is conducted.
Figure 1: Number of Fall Freshman Applications to the UC System
-.4
-.2
0
.2
.4
.6
Perc
enta
ge D
iffer
ence
1994 1995 1996 1997 1998 1999 2000 2001 2002 2003 2004 2005 2006 2007 2008
Berkeley Los AngelesSan Diego RiversideDavis IrvineSanta Barbara Santa Cruz
Note: Shows the difference in the enrollment rate for URMs and non-URMs as a fraction of the enrollment ratefor non-URMs. When the difference is positive, it indicates that the enrollment rate is higher for URMs thanfor non-URMs. The dashed verticle line separates the period before and after Prop 209. The bold verticle linesat 1995 and 2000 bracket the years over which our primary analysis is conducted.
Figure 2: Percentage Difference in URM and Non-URMFall Freshman Enrollment Rates
All Admitted
Before Prop
209
All Admitted
After Prop
209
Non-URMs
Admitted
Before Prop
209
Non-URMs
Admitted
After Prop
209
URMs
Admitted
Before Prop
209
URMs
Admitted
After Prop
209
SAT Math 1.4% 1.2% 1.1% 1.0% 3.0% 2.2%
SAT Verbal 1.4% 1.2% 1.1% 1.0% 3.0% 2.2%
Adjusted High School GPA 1.0% 1.4% 1.1% 1.5% 0.6% 0.8%
Parental Education 4.0% 5.4% 4.4% 5.9% 2.2% 3.0%
Parental Income 11.7% 19.6% 12.8% 21.1% 6.8% 11.4%
Any of Above 14.2% 21.8% 14.9% 23.3% 10.9% 14.3%
N 129,763 148,996 105,411 125,116 24,352 23,880
Table 1: Percentage of Students Admitted with Missing Values for Select Variables
Notes: Numbers in the table shows the percentage of students admitted into at least one school in the UC system who have missing values for
selected variables. Before Prop 209 includes the years 1995-1997. After Prop 209 includes the years 1998-2000. The final row shows the total
number of admitted students in each column.
URM
Before After Before After Before After Before After Relative Change
SAT Math 615.9 628.0 597.1 601.9 613.8 617.4 527.9 533.5 2.0**
(93.4) (87.5) (93.6) (93.3) (85.8) (86.0) (93.0) (93.1)
SAT Verbal 584.3 598.1 569.5 572.3 580.2 582.6 525.0 527.1 -0.2
(100.8) (95.1) (97.0) (96.1) (94.7) (93.8) (93.5) (93.2)
Adjusted High School GPA 3.56 3.65 3.62 3.65 3.66 3.68 3.45 3.51 0.04***
(0.51) (0.50) (0.50) (0.49) (0.50) (0.49) (0.48) (0.49)
Parents' Education: At Least 4 Year College Degree 0.70 0.76 0.66 0.65 0.73 0.72 0.37 0.36 0.00
(0.46) (0.43) (0.47) (0.48) (0.44) (0.45) (0.48) (0.48)
Parents' Income <40,000 0.44 0.35 0.33 0.29 0.28 0.25 0.54 0.49 -0.02***
(0.50) (0.48) (0.47) (0.46) (0.45) (0.43) (0.50) (0.50)
Parents' Income 40,000-99,999 0.36 0.38 0.43 0.42 0.45 0.42 0.37 0.38 0.04***
(0.48) (0.49) (0.50) (0.49) (0.50) (0.49) (0.48) (0.49)
Parents' Income >100,000 0.20 0.27 0.24 0.29 0.27 0.33 0.10 0.13 -0.02***
(0.40) (0.44) (0.43) (0.45) (0.44) (0.47) (0.30) (0.34)
Admitted to Berkeley 0.36 0.29 0.36 0.27 0.32 0.28 0.52 0.25 -0.22***
(0.48) (0.45) (0.48) (0.45) (0.47) (0.45) (0.50) (0.43)
Admitted to UCLA 0.36 0.31 0.40 0.31 0.38 0.32 0.47 0.25 -0.16***
(0.48) (0.46) (0.49) (0.46) (0.49) (0.47) (0.50) (0.43)
Admitted to UCSD 0.54 0.42 0.59 0.42 0.59 0.44 0.58 0.32 -0.11***
(0.50) (0.49) (0.49) (0.49) (0.49) (0.50) (0.49) (0.47)
Admitted to UCD 0.67 0.62 0.74 0.66 0.72 0.67 0.85 0.62 -0.18***
(0.47) (0.48) (0.44) (0.47) (0.45) (0.47) (0.35) (0.49)
Admitted to UCI 0.60 0.56 0.72 0.61 0.73 0.63 0.68 0.53 -0.05***
(0.49) (0.50) (0.45) (0.49) (0.45) (0.48) (0.47) (0.50)
Admitted to UCSB 0.70 0.52 0.78 0.54 0.78 0.54 0.78 0.52 -0.02***
(0.46) (0.50) (0.42) (0.50) (0.42) (0.50) (0.41) (0.50)
Admitted to UCSC 0.75 0.77 0.84 0.81 0.84 0.82 0.84 0.76 -0.05***
(0.43) (0.42) (0.36) (0.40) (0.36) (0.39) (0.36) (0.43)
Admitted to UCR 0.69 0.81 0.84 0.87 0.85 0.88 0.81 0.82 -0.02***
(0.46) (0.39) (0.37) (0.34) (0.36) (0.32) (0.39) (0.38)
Admitted to UCLA or Berkeley 0.38 0.32 0.41 0.32 0.38 0.33 0.51 0.27 -0.18***
(0.49) (0.47) (0.49) (0.46) (0.49) (0.47) (0.50) (0.45)
Admitted to Any UC 0.70 0.70 0.81 0.78 0.81 0.79 0.81 0.74 -0.05***
(0.46) (0.46) (0.39) (0.41) (0.39) (0.41) (0.39) (0.44)
N 26,306 46,370 136,766 149,305 110,072 121,598 26,694 27,707
Table 2: Mean Characteristics of Students Who Apply for Admission to the UC System
Notes: Standard deviations in parentheses. Before includes years 1995-1997. After includes years 1998-2000. Non-URMs include Whites, Asians and Other/Unknown.
URMs include Blacks, Hispanics and American Indians. The summary statistics for each cell in columns (1) and (2) are computed for observations with missing data for at
least one of the variables listed so that the cell sizes for each variable differ. The final row of columns (1) and (2) shows the number of observations with any missing data.
Columns (3) - (6) only include observations for which there is no missing data on SAT scores, high school GPA, parental education and parental income. The final column
shows the change for URMs relative to non-URMs. *** p<0.01, ** p<0.05, * p<0.1. Admission probabilites are conditional on applying.
Observations with
Missing Data
Non-URM URMAllAll
Observations with Complete Data
URM
Before After Before After Before After Before After Relative Change
SAT Math 628.7 637.4 607.8 611.4 624.0 625.2 541.0 546.7 4.5***
(86.0) (81.2) (88.9) (88.4) (80.5) (81.6) (90.6) (90.5)
SAT Verbal 602.7 611.1 580.7 581.9 591.3 591.3 537.0 538.1 1.1
(94.3) (89.2) (93.9) (93.4) (91.2) (91.0) (92.0) (92.0)
Adjusted High School GPA 3.68 3.76 3.70 3.74 3.74 3.77 3.53 3.63 0.07***
(0.49) (0.46) (0.48) (0.46) (0.47) (0.46) (0.49) (0.47)
Parents' Education: At Least 4 Year College Degree 0.74 0.79 0.67 0.65 0.74 0.72 0.38 0.35 -0.01
(0.44) (0.41) (0.47) (0.48) (0.44) (0.45) (0.49) (0.48)
Parents' Income <40,000 0.43 0.35 0.33 0.30 0.28 0.25 0.52 0.49 -0.01***
(0.50) (0.48) (0.47) (0.46) (0.45) (0.44) (0.50) (0.50)
Parents' Income 40,000-99,999 0.37 0.39 0.44 0.42 0.45 0.42 0.38 0.38 0.04***
(0.48) (0.49) (0.50) (0.49) (0.50) (0.49) (0.48) (0.49)
Parents' Income >100,000 0.20 0.25 0.24 0.29 0.27 0.32 0.10 0.13 -0.02***
(0.40) (0.44) (0.43) (0.45) (0.44) (0.47) (0.30) (0.34)
N 18,395 32,503 111,368 116,493 89,661 96,024 21,707 20,469
Notes: Standard deviations in parentheses. Before includes years 1995-1997. After includes years 1998-2000. Non-URMs include Whites, Asians and Other/Unknown. URMs
include Blacks, Hispanics and American Indians. The summary statistics for each cell in columns (1) and (2) are computed for observations with missing data for at least one of the
variables listed so that cell sizes for each variable differ. The final row of columns (1) and (2) shows the number of observations with any missing data. Columns (3) - (6) only
include observations for which there is no missing data on SAT scores, high school GPA, parental education and parental income. The final column shows the change for URMs
relative to non-URMs. *** p<0.01, ** p<0.05, * p<0.1.
Table 3: Mean Characteristics of Students Admitted to the UC System
Observations with Complete Data
Observations with Missing
Data
Non-URM URMAllAll
Student Characteristic Correlation
SAT Math -0.0036
SAT Verbal -0.0446
Adjusted High School GPA -0.0199
Parents' Education: At Least 4 Year College Degree -0.0339
Parents' Income <40,000 0.0508
Parents' Income 40,000-99,999 -0.0097
Parents' Income >100,000 -0.0425
N 227,861
Note: shows the correlation between student characteristics and an
indicator for whether a student admitted to the UC system enrolls in the
UC system for the years 1995-2000.
Table 4: Correlation Between Student Characteristics
and Enrollment
UC
System Tier 1 Berkeley UCLA UCSD UCD UCI UCSB UCSC UCR
(1) (2) (3) (4) (5) (6) (7) (8) (9) (10)
Panel A: Pre Prop 209 (1995-1997)
URM 54.6% 49.7% 37.9% 38.8% 20.2% 23.4% 20.4% 23.0% 18.1% 23.2%
Non-URM 55.0% 48.3% 40.6% 33.8% 23.9% 26.7% 26.0% 23.8% 20.8% 19.1%
Asian 61.4% 54.0% 46.1% 34.2% 24.0% 28.7% 30.1% 17.6% 14.1% 19.1%
White 50.7% 42.9% 35.6% 33.7% 24.3% 25.8% 19.0% 27.2% 23.3% 19.6%
Other/Undeclared 50.2% 45.4% 37.5% 31.7% 21.1% 22.4% 22.0% 18.1% 22.6% 17.8%
Panel B: Post Prop 209 (1998-2000)
URM 52.7% 54.2% 41.0% 44.6% 24.4% 27.5% 25.6% 27.3% 19.4% 24.8%
Non-URM 55.0% 53.7% 42.7% 38.1% 23.9% 26.4% 26.3% 24.3% 19.8% 18.6%
Asian 62.1% 59.6% 48.2% 38.2% 24.1% 28.2% 29.6% 16.6% 14.4% 21.3%
White 50.2% 48.2% 37.5% 38.2% 24.1% 26.5% 21.1% 28.0% 22.0% 15.3%
Other/Undeclared 51.6% 51.2% 40.0% 37.5% 22.9% 20.3% 24.1% 24.0% 21.7% 15.3%
Panel C: Change
URM -1.9% 4.5% 3.1% 5.8% 4.1% 4.1% 5.1% 4.3% 1.3% 1.6%
Non-URM 0.1% 5.4% 2.1% 4.3% 0.0% -0.3% 0.3% 0.5% -1.0% -0.6%
Asian 0.7% 5.6% 2.2% 4.0% 0.1% -0.6% -0.5% -1.0% 0.4% 2.2%
White -0.5% 5.3% 1.9% 4.5% -0.2% 0.7% 2.1% 0.8% -1.3% -4.3%
Other/Undeclared 1.4% 5.7% 2.5% 5.8% 1.7% -2.1% 2.1% 5.8% -0.8% -2.4%
Change for URMs vs. Non-URMs
-2.0% -1.0% 1.0% 1.5% 4.1% 4.4% 4.9% 3.8% 2.3% 2.2%
Table 5: Enrollment Rates Before and After Prop 209, by Race
Notes: Column (1) shows the probability that students admitted to any UC school enroll in any UC school. Column (2) shows the probability that
students admitted to either Berkeley or UCLA (Tier 1) enroll in either school. The remaining columns show the probability that students admitted to the
school given in the column heading enroll in that school. The last row shows the difference between the change in enrollment rates for URMs and non-
URMs.
(1) (2) (3)
UC System -0.025*** -0.026*** 0.021***
(0.005) (0.005) (0.005)
Tier 1 -0.014 0.024** 0.031***
(0.010) (0.009) (0.009)
Berkeley 0.001 0.055*** 0.057***
(0.013) (0.012) (0.012)
UCLA 0.019* 0.065*** 0.039***
(0.011) (0.010) (0.010)
UCSD 0.042*** 0.083*** 0.028***
(0.010) (0.010) (0.009)
UCD 0.045*** 0.066*** 0.034***
(0.009) (0.009) (0.009)
UCI 0.045*** 0.059*** 0.011
(0.010) (0.009) (0.009)
UCSB 0.029*** 0.034*** -0.004
(0.008) (0.008) (0.008)
UCSC 0.021** 0.031*** 0.016*
(0.009) (0.009) (0.008)
UCR 0.020** 0.033*** 0.031***
(0.008) (0.008) (0.008)Controls for Academic
Achievement and Family
Background
no yes yes
Controls for Students' Choice Set no no yes
Sample
*** p<0.01, ** p<0.05, * p<0.1
Students with complete data on academic achievement
and family background
Table 6: Difference-in-Difference Estimates of the Effect of Prop 209 on
Enrollment Rates for URMs
Notes: Standard errors in parentheses. The dependent variable is a binary indicator for
whether the student enrolled in a given UC school conditional on being accepted to that UC
school. Each row shows the OLS coefficient estimate on the interaction between post Prop
209 and URM. Each column also includes controls for URM and post Prop 209. Students'
SAT math and SAT verbal scores are each controlled for using 7 indicators: 200-449, 450-
499, 500-549, 550-599, 600-649, 650-699 and 700-800. Parental income is controlled for
using 11 indicators for parental income: 0-10k, 10-20k, 20-30k, 30-40k, 40-50k, 60-70k, 70-
80k, 80-90k, 90-100k, >100k. Parental education is controlled for using 6 indicators for the
maximum of parents' education: less than a high school degree, high school degree, some
college, two-year college degree, four-year college, post graduate study. The sample
includes data from 1995-1997 (pre Prop 209) and 1998-2000 (post Prop 209).
(1) (2) (3)
UC System -0.020*** -0.001 0.025***
(0.005) (0.005) (0.005)
Tier 1 -0.010 -0.005 0.033***
(0.009) (0.009) (0.009)
Berkeley 0.010 0.011 0.063***
(0.012) (0.011) (0.012)
UCLA 0.015 -0.005 0.037***
(0.010) (0.009) (0.010)
UCSD 0.041*** 0.003 0.024***
(0.009) (0.009) (0.009)
UCD 0.044*** 0.019** 0.037***
(0.009) (0.008) (0.008)
UCI 0.049*** 0.001 0.018**
(0.009) (0.008) (0.008)
UCSB 0.038*** -0.007 0.002
(0.008) (0.007) (0.007)
UCSC 0.023*** 0.006 0.016**
(0.008) (0.008) (0.008)
UCR 0.022*** 0.027*** 0.036***
(0.008) (0.008) (0.008)
Controls for Academic Achievement
and Family Background Except
Parental Income
no no yes
Controls for Students' Choice Set no yes yes
SampleAll admitted
students
All admitted
students
All admitted
students with
complete data on
SAT scores, high
school GPA and
parental education
*** p<0.01, ** p<0.05, * p<0.1
Notes: Standard errors in parentheses. The dependent variable is a binary indicator for whether the
student enrolled in a given UC school conditional on being accepted to that UC school, and
estimates are generated using OLS. Each row shows the coefficient estimate on the interaction
between post Prop 209 and URM. Each column also includes controls for URM and post Prop 209.
SAT math and SAT verbal scores are each controlled for using 7 indicators: 200-449, 450-499, 500-
549, 550-599, 600-649, 650-699 and 700-800. Parental education is controlled for using 6
indicators for the maximum of parents' education: less than a high school degree, high school
degree, some college, two-year college degree, four-year college, post graduate study. The sample
includes data from 1995-1997 (pre Prop 209) and 1998-2000 (post Prop 209).
Table 7: Difference-in-Difference Estimates of the Effect of Prop 209 on
Enrollment Rates for URMs, by Campus, Excluding Controls for Parental Income

UC Tier 1 Berkeley UCLA UCSD UCD UCI UCSB UCSC UCR
(1) (2) (3) (4) (5) (6) (7) (8) (9) (10)
URM -0.029* -0.120*** -0.255*** -0.108*** -0.140*** -0.240*** -0.244*** -0.034** 0.011 -0.102***
(0.016) (0.012) (0.015) (0.012) (0.014) (0.016) (0.019) (0.017) (0.026) (0.031)
Post Prop 209 -0.028** 0.098*** 0.057*** 0.092*** 0.093*** 0.009 0.002 0.162*** 0.076*** 0.040
(0.013) (0.011) (0.014) (0.013) (0.014) (0.014) (0.017) (0.019) (0.023) (0.024)
Post*URM 0.076*** 0.087*** 0.108*** 0.073*** -0.026 0.059** 0.098*** -0.032 -0.055 0.065
(0.022) (0.018) (0.022) (0.019) (0.024) (0.023) (0.030) (0.031) (0.037) (0.041)
Predicted Admission Prob. 0.732*** 0.417*** 0.239*** 0.037 -0.062** -0.186*** -0.216*** -0.092*** 0.146*** -0.088**
(0.049) (0.060) (0.075) (0.042) (0.025) (0.027) (0.036) (0.020) (0.035) (0.036)
Post*Predicted Admission Prob. 0.060*** -0.050*** -0.036* -0.044*** -0.077*** -0.012 0.019 -0.116*** -0.089*** -0.071***
(0.016) (0.017) (0.021) (0.017) (0.017) (0.016) (0.019) (0.021) (0.025) (0.027)
URM*Predicted Admission Prob. -0.084*** 0.006 0.167*** 0.086*** 0.132*** 0.192*** 0.212*** 0.035* -0.057* 0.102***
(0.020) (0.024) (0.032) (0.023) (0.020) (0.021) (0.024) (0.020) (0.031) (0.036)
Post*URM*Predicted Admission Prob. -0.063** -0.185*** -0.223*** -0.136*** 0.026 -0.054* -0.126*** 0.017 0.078* -0.050
(0.028) (0.036) (0.049) (0.035) (0.032) (0.030) (0.036) (0.035) (0.043) (0.047)
Observations 227,861 71344 41448 52627 63968 69640 63627 72394 54264 53530
R-squared 0.097 0.070 0.076 0.161 0.132 0.133 0.173 0.107 0.100 0.104
*** p<0.01, ** p<0.05, * p<0.1
Table 8: Difference-in-Difference Estimtates of the Differential Effect of Prop 209 on Enrollment Rates by Student Quality (White Pre-Prop 209 Predicted
Admission Probability)
Notes: Standard errors in parentheses. The dependent variable is a binary indicator for whether a student enrolled in a given school conditional on being accepted to that school, and
coefficient estimates are generated using OLS. For each school, predicted admission probabilities are calculated from the coefficient estimates from an OLS regression for the sample of
whites who applied prior to Prop 209 (1995-1997) of a binary indicator for whether the student was admitted on that student's math and verbal SAT scores, adjusted high school GPA, parental
income and parental education. Each column includes controls for SAT scores, high school GPA, parental education, parental income and indicators for the other UC schools to which the
applicant was admitted. Students' SAT math and SAT verbal scores are each controlled for using 7 indicators: 200-449, 450-499, 500-549, 550-599, 600-649, 650-699 and 700-800. Parental
income is controlled for using 11 indicators for parental income: 0-10k, 10-20k, 20-30k, 30-40k, 40-50k, 60-70k, 70-80k, 80-90k, 90-100k, >100k. Parental education is controlled for using 6
indicators for the maximum of parents' education: less than a high school degree, high school degree, some college, two-year college degree, four-year college, post graduate study. The
sample includes data from 1995-1997 (pre Prop 209) and 1998-2000 (post Prop 209).