Embed Size (px)
Citation preview
AFFORDABILITY
Underground Cable costs 2-3 times more economical than overhead lines and pylons
EirGrid is misleading the public on statements to the media regarding cost comparisons of underground cable and overhead lines
EirGrid currently quoting from various reports that underground cables construction costs will be 3.5 times that of overhead transmission lines and pylons
But EirGrid possess the actual costs of both technologies:Many overhead line projects already completedMajor underground and undersea project recently completed
East-West interconnector HVDC cable
Construction costs for both are very similar, based on EirGrid figures:Average Overhead line construction costs published by EirGrid for Grid Link, Grid West and the North-South interconnector = €2.1Million per kilometre
Average underground and undersea cable cost for the East-West interconnector is €2.2 Million per kilometre
EirGrid refuses to factor in devaluation costs, delay costs, tourism and landscape costs and health related costs and concerns
NEPPC has carried out a detailed analysis of property and land devaluationCombined devaluation costs for North-South interconnector = €310 Million
EirGrid agree delay costs of €30M per year, currently running at 7 year delay = €210 Million
Total overhead line costs = €798 Million= 3 times higher than underground cable costs
SUMMARY - KEY FACTS
Underground makes sense
Briefing Doc. 101

Affordability – Main Components
Affordability – Cost Inputs
Construction Costs
Operational Costs
Property Devaluation
Farm devaluation
Delays
Tourism/Other
Construction costs are the main focus of most reports.
Operational costs are sometimes examined.
But impact costs, such as farm and property devaluation and project
delays also carry real costs to affected parties.
Transmission Costs PerspectiveElectricity Bill Breakdown
PSO levy imposed is 5% of billTransmission costs represent only 6% of bill

Eirgrid Statements & Claims on Underground Construction Cost Ratios
25
97
3 1.50
5
10
15
20
25
30
2007 2009 2010 2012 2015
2007: Undergrounding is 25X more than Overhead Lines2012: Undergrounding is 3X more than Overhead Lines2015: Undergrounding is 1.5X more than Overhead LinesWhich way is this going?
PROJECT LENGTH KM
CONSTRUCTION COST €M
CONSTRUCTION COST €M per KM
North-South 140 286 2.1
Grid Link 250 500 2.0
Grid West 100 240 2.4
Average 2.1
PROJECT LENGTH KM
CONSTRUCTION COST €M
CONSTRUCTION COST €M per KM
East-West 256 570 2.2
Average 2.2
EirGrid Published Project Costs
Overhead Lines
Underground Cables
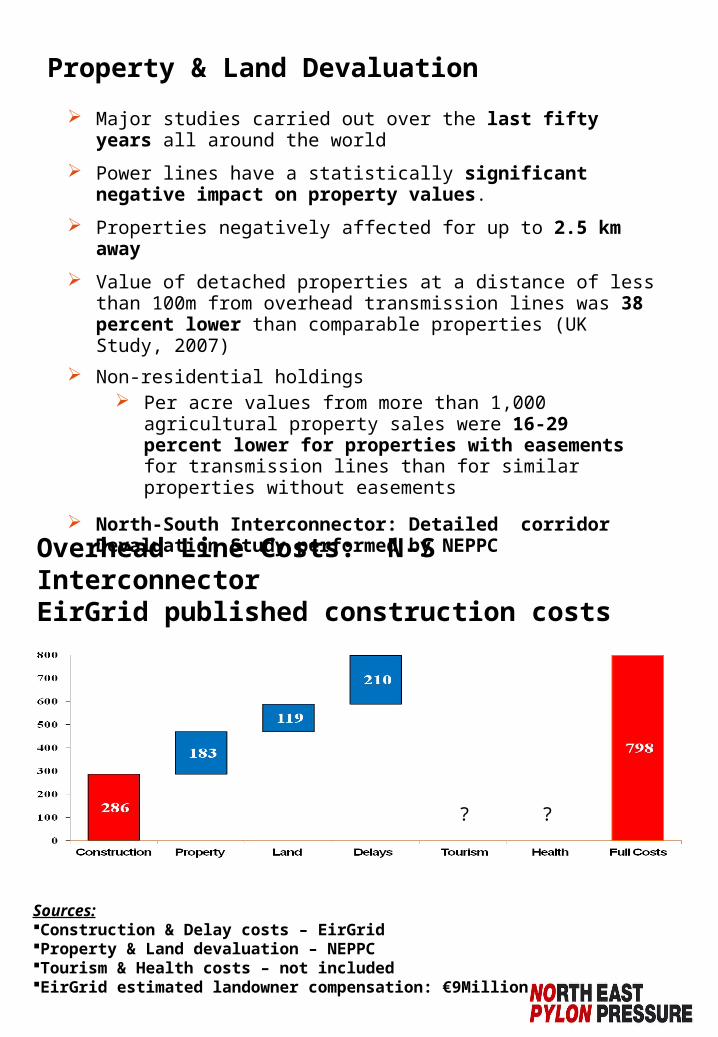
Property & Land Devaluation
Major studies carried out over the last fifty years all around the world
Power lines have a statistically significant negative impact on property values.
Properties negatively affected for up to 2.5 km away
Value of detached properties at a distance of less than 100m from overhead transmission lines was 38 percent lower than comparable properties (UK Study, 2007)
Non-residential holdings Per acre values from more than 1,000 agricultural property
sales were 16-29 percent lower for properties with easements for transmission lines than for similar properties without easements
North-South Interconnector: Detailed corridor Devaluation Study performed by NEPPC
Overhead Line Costs: N-S InterconnectorEirGrid published construction costs
Sources:Construction & Delay costs – EirGridProperty & Land devaluation – NEPPCTourism & Health costs – not includedEirGrid estimated landowner compensation: €9Million
? ?

256 Km long
34 km undergrounded along roadside from Rush in Dublin to Woodland in Meath
Underground N-S InterconnectorSame Technology as E-W Interconnector:
Construction Costs
East-West Interconnector256 km length
€570M cost
= €2.22M per kilometre
North-South Interconnector140 km length
@ €2.22M per kilometre
= €310M cost*
*Overestimate, as 70% of E-W line is subsea cable (extra lead sheathing)

Underground Cable Costs: N-S InterconnectorEirGrid E-W Interconnector Reference
310
46 - - -
-
264
0
100
200
300
400
500
600
700
800
Construction Subsea Element Property Land Delays Tourism Health Full Costs
€M
0 00 0 0
Underground cable vs. Overhead lines full costsN-S Interconnector
* Does not include tourism or health impacts
798 *
Data Sources:Construction & delay figures: EirGridDevaluation figures: NEPPC