Embed Size (px)
Citation preview

1
AflaSTOP On-Farm Hermetic Storage Testing;
Change in Smallholder Attitudes & Behaviors
September 2016

2

3
Written by Bryn Davies & Sophie Walker
Contributors include Sarah Sahlaney, & Caroline Kipkorir.
Special thanks to the field team of Victor Kagot and Lizbancy Maundu and the support of
the Department of Agriculture Makueni and in particular Eunice Muema
The AflaSTOP: Storage and Drying for Aflatoxin Prevention (AflaSTOP) project is
identifying the most promising storage options to arrest the growth of aflatoxin and
designing viable drying options that will allow smallholder farmers to dry their grain to safe
storage levels. The project works to ensure that businesses operating in Africa are able to
provide these devices to smallholder farmers. It is jointly implemented by ACDI/VOCA and
its affiliate Agribusiness Systems International (ASI) under the direction of Meridian
Institute. For more information on AflaSTOP and other key reports and resources, visit:
www.acdivoca.org/aflastop-publications

4
TABLE OF CONTENTS
I. Introduction ................................................................................................... 5
II. Executive Summary ...................................................................................... 8
III. Recommendations & Next Steps ............................................................... 10 A. Encouraging Adoption of New Technology ............................................................. 10 B. Marketing Improved Devices .................................................................................. 11 C. Reducing Public Exposure to Aflatoxin .................................................................. 12
IV. Conclusion ................................................................................................... 13
V. Summarized Findings ................................................................................. 14 A. Round 1 (Baseline Survey) .................................................................................... 14 B. Round 2 (Post-Storage Test Survey) ..................................................................... 15 C. Round 3 (Aflatoxin Survey) .................................................................................... 16 D. Consumption Habits & Trends ............................................................................... 20 E. Purchase of Devices .............................................................................................. 21 F. Barrier Analysis Survey (Round 3) ......................................................................... 23
VI. Additional Detailed Findings ...................................................................... 26 A. Round 1 (Baseline Survey) .................................................................................... 26 B. Round 2 (Post-Test Survey) ................................................................................... 30 C. Round 3 (Aflatoxin Survey) .................................................................................... 32 D. Willingness to pay .................................................................................................. 34 E. Changes in Willingness to Pay for an Improved Storage Device ............................ 35 F. Purchase of Devices .............................................................................................. 38 G. Barrier Analysis ..................................................................................................... 40
1. Perceived Positive Consequences...................................................................... 41 2. Perceived Negative Consequences .................................................................... 41 3. Perceived Social Norms ..................................................................................... 42 4. Perceived Self Efficacy ....................................................................................... 42 5. Perceptions and Outlook of Farmers .................................................................. 43
VII. Specific Analysis ......................................................................................... 45 A. Consumption Habits ............................................................................................... 45 B. Willingness to Pay for Aflatoxin Testing in Meru & Makueni ................................... 46 C. Prevalence of Aflatoxin at the Smallholder Level in Makueni and Meru (2014 to 2016) ............................................................................................................................. 47
VIII. Annex A: Visuals of Devices Tested .................................................... 49
IX. Annex B: Effective Device Performance Criteria Used ............................ 50
X. Annex C: Farmer Participation by Survey ................................................. 51
XI. Annex D: Barrier Analysis Methodology & Analysis ................................ 52
XII. Annex E: Willingness to Pay for Aflatoxin Testing in Meru & Makueni (2017) ................................................................................................................. 54
XIII. Annex F: Willingness to Pay for Aflatoxin Testing in Meru & Makueni (2016) 56

5
I. Introduction
Aflatoxin is a naturally occurring, highly toxic residue from strains of the
aspergillus fungus found in the soil. Aflatoxin has many serious long-term health
implications and is a significant concern in the maize and groundnut industries.
The invisible toxin is linked to liver disease and cancer and is associated with
immune-system suppression, growth retardation, and death in both humans and
domestic animals. Maize in Kenya and many other parts of Africa is already
contaminated when it is harvested, and the fungus continues to grow despite
farmers’ attempts to dry their maize.
Linking scientifically rigorous research with human-centric design and grounded
in marketplace realities, the AflaSTOP project consists of three core components:
Storage: scientific testing of storage devices in controlled conditions and
field-testing with smallholder farmers.
Drying: research, design, testing, fabrication, and adaptation of potential
drying solutions.
Commercialization strategy development: tailored investigation and
validation of the commercial viability of each storage and drying product.
The analysis in this report deals with assessing how smallholder farmers’
attitudes and behaviors have changed between the Round 1 (baseline) survey,
and the surveys in Round 2 and Round 3. These surveys took place from March
2015 through June 2016, and cover the following:
Round 1 – Explored the baseline attitudes and practices of smallholder
farmers.
Round 2 – Gauged their attitudes after using one of three devices.
Round 3 – Sought to discover if the attitudes and practices of smallholder
farmers in our intervention group had changed once they were told the
aflatoxin status of their maize (i.e. the level of contamination).
More specifically, after the Round 1 (baseline) survey, AflaSTOP distributed one of three devices – PICS 90kg bags; 180 – 720kg artisan made metal silo(s); or a 1,000kg GrainPro GrainSafe Bag(s) to approximately 132 farmers based on their expected storage requirements for the March 2015 harvest. Pictures of these devices can be found in

6
Annex A: Visuals of Devices Tested. AflaSTOP also divided farmers into two
groups – farmers who were trained on how to optimally use their device and
farmers who were purposely given no training whatsoever on how to setup their
device, i.e. untrained farmers.1
Once the devices had been distributed, AflaSTOP staff visited farmers on a
monthly basis to collect data on how the device was performing (including
collecting a maize sample to test quality including aflatoxin levels, recording how
much maize they were removing on a monthly basis and why they were
removing it, whether or not the device was setup any better or worse than the
previous month, and whether the farmers had any concerns). The criteria used to
gauge effective device performance can be found in Annex B: Effective
Device Performance Criteria Used. An approximate timeline of events is
shown in the below diagram and the number of farmers participating in each
survey can be found in Annex C: Farmer Participation by Survey.
Figure 1: Timing of Surveys & Interventions
The storage period from April/May 2015 – March 2016 spanned two harvests and
about 70% of farmers added more maize to their devices during the second
harvest. Farmers completed removing their maize stored in different months.
After each farmer had removed all their stored maize from the device - after the
second harvest - they were then given the Post-Test Survey (Round 2) to
evaluate what they thought of their device and asked whether or not they would
be interested in purchasing it and at what price. In March 2016 when all farmers
had finished their maize (or had it removed), AflaSTOP was able to test the
maize for aflatoxin levels. Once set up aflatoxin levels were available AflaSTOP
arranged 10 meetings at the beginning of April 2016 to discuss the implications of
1 All AflaSTOP publications, including the analysis of the Round 1 (Baseline)/Willingness to Pay data can be found at http://acdivoca.org/aflastop-publications
Monthly Surveys
Round 1
Baseline Survey
Mar - Apr 2015
Devices Tested On-Farm
Round 2
Post-Test Survey
Dec 15 - Mar 2016
SMS sent
Round 3
Aflatoxin Survey
Barrier Analysis Survey
May 2016

7
varying aflatoxin levels and what mitigating actions they could take as farmers.
After the meetings AflaSTOP SMS’d each farmer their individual result, AflaSTOP
then surveyed farmers again (Round 3) to see if receiving information on their
contamination level had further influenced their post harvest behaviors and
willingness to invest in an improved storage device.
Finally, AflaSTOP conducted a Barrier Analysis Survey using 36 “Non-Doers” from
the intervention group, i.e. farmers who declined to purchase the PICS bag they
had been using at the very subsidized rate of US$0.50 per bag, as compared to a
group of 44 farmers outside the AflaSTOP intervention who independently elected
to purchase the PICS bag at the market price of US$2.50 per bag.2
Thus, the information given in the rest of this report analyzes how farmers’
attitudes, behaviors, and storage practices have changed throughout the
progression of AflaSTOP’s survey work, as compared to what was reported in
Round 1. It is divided into the Executive Summary; Recommendations &
Next Steps; Conclusion; Summarized Findings; Additional Detailed
Findings. We believe that this information will be useful to a variety of
stakeholders in the agricultural sector - those interested in selling their products
to smallholder farmers; those trying to support market interventions that benefit
smallholder farmers; and those trying to improve the food security and nutritional
quality of the food that smallholder farmers grow for themselves and their
families, thereby improving their health and well-being.
2 PICS bags were chosen for the Barrier Analysis as it was the only device where there were enough “Doers” to enable a meaningful examination of the causal factors behind purchase and/or Non-purchase. Values in local currency (Kshs) have been converted to USD at a rate of $1 USD to Kshs 100.

8
II. Executive Summary
During the pre-test survey, AflaSTOP began its work by verifying that the
intervention farmers were not statistically different from general smallholder
farmers in the area in terms of their characteristics, behavior, or opinions with the
general farming population. Throughout the course of AflaSTOP’s subsequent
survey work in Rounds 2 and 3, valuable insights about Kenyan smallholder
farmers and changes in their behavior have been tracked from the beginning of
our intervention in 2014 through the conclusion of testing in 2016.
First and foremost, our surveys have shown that most farmers’ have a much
lower willingness to pay for improved storage than they first reported. The
average price a farmer reported being willing to pay for an improve device
doubled once they were aware of how it worked (for the majority of farmers the
price increased from $0.50 to $1/bag), however the price they are willing to pay is
still below the retail price of the bag at $2.50. While a proportion of farmers were
willing to pay $5/bag for a device which would last over 10 years, this was still
less than 25% of its actual sales value. That said, farmers with some disposable
income at harvest are investing in PICS bags and see value (financial and
health) in not needing to use insecticide.
Secondly, supporting a finding from Round 1, it is clear that encouraging farmers
to invest in better storage will not necessarily motivate them to keep their maize
longer, even in times of good harvests, which was the case of AflaSTOP’s survey
period. Many farmers continued to sell the maize they stored in their device and
indicated that they would simply buy maize from the market when they ran out or
borrow from a neighbor, giving more weight to the need and priority of cash
liquidity versus storage for future consumption. Conversations with female
farmers also indicated that households had diversified their diet and that they
were not as dependent on maize for solely consumption purposes and at least 4
meals a week used alternative carbohydrates (predominately rice and wheat
products).
Third, in terms of product marketing, although many farmers have adopted low-
risk, low growth strategies overall when it comes to maize cultivation and
production they to purchase hybrid seed and over 90% purchase insecticides at
harvest for the maize they are going to store. They want to purchase products as
close to home as possible, prefer a salesperson who comes to their home and to
be sold at a price point that takes into consideration their cash flow and liquidity

9
constraints. Timing is everything, and farmers’ peak ability to purchase new
inputs/technology is when they sell the commodity they are growing.
Finally, there is need to better articulate the different segments of smallholder
farmers in order to highlight the proportion who are willing to buy new technology
from the private sector. Until this happens, the private sector will not likely invest
in marketing and distributing technology to rural areas since they do know whom
to target as their potential customer. Governments and NGOs also need to do a
better job at promoting a proportion of smallholder farmers as viable
entrepreneurs willing to invest in farming solutions.
For this reason, in many ways smallholder farmers need a new image. For so
long, NGO’s and governments have talked about the ‘poor’ smallholder farmer,
and all of their challenges that many private sector companies based in urban
centers do not see these poor farmers as potential consumers for their products.
If NGOs and government talked more informatively about the segmentation of
smallholder farmers, and clearly articulated the proportion of smallholder farmers
willing to engage in new technology and new practices, and at what price point
they can afford, then more companies would be able to evaluate what size of
market there might be out there in rural locations. If 90% of smallholder farmers
are buying insecticide from local stores – then insecticide suppliers have worked
out how to sell to smallholder farmers. Other companies should look to follow
with new ideas.
Other points:
Farmers having been told they must dry their maize before putting it in a
hermetic device on average dried their maize in the sun for an additional 4
days;
~37% of farmers bought the devices they used, the maximum outlay there
were prepared to pay was $30, equivalent to $5 / 90 bag capacity
20% more farmers used tarpaulins once they knew their maize had
aflatoxin (even at levels below 10ppb);
18% of farmers with aflatoxin levels more than 10ppb started drying their
maize longer;
71% of farmers estimated that their nearest agrodealer was 1.7km away,
86% of farmers would not walk this far to buy hermetic bags;
Farmers preferred sales people who came to their farmers, and
appreciated a small explanation on how to use the bag;
Not buying insecticide may save smallholder farmers $1/bag.

10
III. Recommendations & Next Steps
A. Encouraging Adoption of New Technology
Technological change and improvement are paramount to increasing agricultural
productivity in Sub-Saharan Africa (SSA) otherwise many countries will face food
deficits and increasing poverty and insecurity. As urbanization increases rural
land will be required to support more people’s consumption needs. To date,
agricultural growth in SSA has been dominated by expanding the land under
cultivation, as opposed to East Asia where technological change (irrigation,
fertilizer, machinery, hybrid seeds) has led to a yield gap of only 10%, as
opposed to nearly 75% in countries like Kenya.3 Encouraging the adoption of
new technology with regard to post-harvest handling, storage and processing is a
key part of improving agricultural output and total nutritious and safe food
available for consumption.
In areas of low productivity, smallholder farmers have proven difficult to access,
in terms of their location and in terms of how they perceive their agricultural
production. Many of the AflaSTOP farmers do not seem to view their maize
production from a business perspective with a drive to maximize yields per acre;
the land produces what it produces from year to year and farmers make minimal
investment to improve productivity. This behavior is characteristic of risk adverse
households who seemingly trade income growth for income security by choosing
low-risk, low-yield livelihood strategies. Given that AflaSTOP’s farmers are
located in a low yield, high climatic risk area, this is not unexpected.
As a result, encouraging this segment of farmers to adopt new technology is not
without its challenges however AflaSTOP is encouraged by;
31% of farmers who purchased PICS bags at a subsidized price;
29% of farmers who paid twice the price of a PICS bag to buy their metal
silo (though still only 30% of the actual cost) and could be seen as people
willing to buy PICS bags if they had not had the alternative;
Even the segment of farmers who did not return their device or fully pay
for it, shows that there is appreciation for the improved storage devices
that the On-Farm Testing introduced, despite the lack of payment;
70% of farmers who were willing to pay for the aflatoxin testing of their
maize flour (50% paying about $1/test and the rest about $.50 per test).
3 The ‘yield gap’ = ration of crop yield to economic potential yield.

11
It is clear that not all smallholder farmers are the same, there are innovative
farmers willing to experiment, those with more income, and then the more
conservative smallholder farmer, waiting to see if the technology will work, and
then there are farmers who just want handouts. Strategies involving the purchase
of technology should focus on those farmers who will adopt new technology
faster than others. If the technology works, other farmers will follow. NGOs can
play an important role, supporting the process of awareness building; supporting
demonstrations, and training where needed alongside the private sector ensuring
availability of the technology where its being demonstrated.
NGO and government extension officers play key roles in spreading knowledge
about more serious issues facing farmers. There is no doubt that AflaSTOP
farmers are more aware of the perils of aflatoxin, how some of their farming
practices may influence fungi growth, what strategies can be employed to reduce
fungal growth, and the actual aflatoxin contamination levels of their maize. As
shown above, a change in behavior was stimulated when they learnt their own
maize had even low levels of aflatoxin; more farmers now use tarpaulins and dry
for longer; adopting messages which extension officers have been discussing for
years but many farmers had not adopted believing that they did not have a
problem.
However, the presence of NGOs in the agriculture sector as a supplier of
technology can also be a problem. Particularly in these more challenging areas,
farmers will first wait to see if they can get something for free rather than having
to pay for it. Although a very rational tactic when you have a limited resource
base, this creates more challenges for the creation of a sustainable supply chain
driven by market demand. For this reason, private sector firms will need to lead
the charge in regard to providing relevant technology to farmers, and they will
only do so once they know there are enough customers to interested in buying.
Active, engaged farmers are looking for solutions to address key problems and
these first adopters provide word-of-mouth recommendations to their neighours;
a powerful tool in locations like rural Kenya.
B. Marketing Improved Devices
Most farmers have at some point invested in their on-farm storage, by building
infrastructure such as granaries and cribs, or an additional room set aside for
storage in the house.18% of AflaSTOP farmers were willing to invest $5/bag to
buy a device, which should last over 10 years. However, $5 is less than 25% of
the actual cost. PICS bags are much more financially accessible with 31% of

12
AflaSTOP farmers buying them second hand at a subsidized price, and even
more numbers of neighbours buying them at the full price of $2.50.
In terms of private sector strategies to market hermetic bags, it will be important
to do the following:
Support demonstrations showing how to set up the bags, and how they
work over time (NGO and government extension services can help here);
Emphasis the benefits of hermetic storage – no insecticide, no insects,
good quality maize, and it prevents aflatoxin from increasing;
Target advertising campaigns, which promote the value of the bag;
Time the advertising campaigns to match pre-harvest awareness and then
harvest availability (farmers can only buy when they have cash and in
order to make purchases they need to plan for these purchases);
Manage the supply chain so that agro dealers, retail outlets, etc. close to
the smallholder farmers have sufficient stock to match demand;
Target both year round retail outlets, who carry everything everyone
needs all year around, and ‘on foot’ agents who go do the homestead to
make sales.
C. Reducing Public Exposure to Aflatoxin
Aflatoxin is a hidden menace; it cannot be seen, smelt or tasted. The maize of
every farmer AflaSTOP tested over a 4-year period had aflatoxin present, with
the percentage of maize tested above 10ppb ranging from 21 to 75% in different
years. Parents, whether farmers or not, want safe food for their families. Once
you show the farmers that their food has a problem they will try, within their
economic means, to mitigate this problem. The government, NGOs, and private
sector can all work together providing viable solutions at the same time as
demonstrating there is a problem. Farmers who can afford to change their
practices will do so. Farmers who cannot afford to change may need additional
support.

13
IV. Conclusion
The On-Farm Testing of improved storage devices was a formidable task from
the start with every possible issue that could happen, happening, requiring
constant problem solving and recalibration. Consequently, working with
smallholder farmers proved complex and unpredictable, which is perhaps
indicative of why this segment of the agriculture sector has been neglected and
not been fully marketed to at this point in time.
Nevertheless, through the repetitive and continuous nature of the survey
process, the AflaSTOP team slowly began to better understand the incentives
and rationale of intervention farmers, forcing the team to rethink its previous
perceptions about this segment of farmers. AflaSTOP’s testing of the
performance of devices also proved successful and more importantly, generated
convincing data as to the effectiveness of the three devices chosen over
traditional PP bags in terms of arresting the growth of aflatoxin levels over time.
While the On-Farm Testing was designed to test the efficacy of the storage
devices, it also tried to investigate behavior change as related to aflatoxin
awareness and the actual use of improved storage devices. The level of
technological adoption among our farmers combined with their willingness to pay,
was thought provoking. Clearly, you cannot talk about smallholder farmers as if
they are one homogenous group behaving the same way. Different economic
situations result in different behaviors. Before seeing the devices the average
price farmers claimed they would pay for improved storage was between $0.50
and $1.00. Later, 29% of the farmers who tried out the larger devices then paid
$5/bag to keep them, 31% of the PICS farmers paid 50% of the second year
value of the bag ($0.50). Approximately 70% of farmers did not pay for their
devices even though nearly all agreed it stored maize better. For these farmers
the multiple, powerful factors at play, including the dire need for cash to pay
expenses such as school fees and health related costs, were not overcome by
awareness and first-hand experience, at least within the short-length of our
intervention.
Meanwhile, the actions of farmers outside our intervention group provided more
positive and actionable marketing insights as related to the commercialization of
improved storage devices and aflatoxin testing in the maize growing areas of
rural Kenya.

14
V. Summarized Findings
A. Round 1 (Baseline Survey)
Round 1 Survey carried out between December 2014 through March 2015
served as the baseline for analysis with data confirming that intervention farmers
were not statistically different in terms of their characteristics, behaviors, or
opinions from the general farming population. Therefore, any changes in
attitudes toward maize storage practices in subsequent rounds of the survey can
be attributed to the containers and their interactions with the AflaSTOP project
team.
In Round 1, AflaSTOP’s farmers were found to be fairly well educated with over
45% having either completed secondary. In addition, 100% of the respondents
reported that they could make decisions in their households, and that farming
was the main occupation and therefore the main source of income for those in
the study group. Most of the land (85.7%) belonged to individuals, with acreage
ranging from 0.25 to 30 acres. However, the majority of landowners (80.0%)
owned 5 acres or less, growing maize mainly for household consumption with the
balance being sold to address cash needs. The proportion of farmers who
purchase hybrid seed is high, reported yields were low with farmers producing
3.3 bags per acre on average as compared to farmers with yield ranges from 15
to 25 bags per acre in high potential maize areas of Kenya. Farmers tended to
use more than one variety of hybrid seed on their land, and often used save seed
as well (up to 5 different maize seed used).
Other important findings from Round 1 relate to the reasons for sale at harvest,
which AflaSTOP found are not necessarily related to limited storage, insect, or
rat concerns, but to farmers' cash needs, which can only be resolved by selling
harvested produce.
Finally, in Round 1 a very high number of farmers (90.9%) used some form of
bought insecticide on their maize prior to storage with insects (weevils)
considered the most important reason warranting the purchase and use of
insecticides. Consequently, a sizeable portion of farmers (71%) said they were
willing to pay for storage devices that would eradicate their insect-related, maize
storage problems, and they were willing to pay more for a device that will control
multiple storage challenges - 60% of farmers initially claimed that they would
consider paying between USD$0.50 to USD$2.00 per bag stored for a device
which would stop insects, with USD$1.00 per bag being the price most often
indicated.

15
B. Round 2 (Post-Storage Test Survey)
In comparison to Round 1, where farmers were surveyed before they had
received a device or been trained, Round 2 queried the 106 farmers of the 122
farmers who tested a device by storing all or part of their harvest in it4 for 2 – 12
months. Table 1 outlines the distribution of farmers by device surveyed in Round
2, as well as those trained to setup and use their device.
With this background in mind, several key differences were found when
comparing answers in Round 1 versus Round 2. Prior to using the devices all
farmers were told the importance of putting dry grain in the device. First, with
regard to the amount of time spent drying their maize, on average farmers
reported drying their maize for longer in Round 2 – 13 days versus 9.65
days on average in Round 1.
In terms of where they store their maize, 55% of Round 1 farmers reported
using a granary or crib to store their shelled maize while 30% used a room in
their house. However, in Round 2, farmers with larger devices (silo and
GrainSafe) kept their device with their maize, in their house - 48% of PICS
farmers; 83% of GrainSafe farmers; 60% of silo farmers. (All of the granary/cribs
in this area are above ground level, therefore often the larger devices could not
get in, or be put up inside particularly in the case of the GrainSafe.)
As regarding farmers’ concerns when storing their maize, in Round 1 farmers
overwhelmingly felt that they were most susceptible to weevils (38%), followed by
rats (18%), mold (7%), and then aflatoxin.
Prior to being provided an improved storage device all farmers storing maize
used insecticide, and based on Round 1 information used about 70% more
insecticide than the manufacturer recommended and spent about $1 per bag
4 See Annex C: Farmer Participation by Survey for more details on farmer
numbers by survey.
Table 1: Farmers by Device in Round 2
PICS Bag GrainSafe Metal Silo
Trained 21 20 20
Untrained 18 12 15
TOTAL 39 32 35
*Devices were allocated to 132 farmers. 10 never used their device. 2
additional farmers did not participate in Round 2 & 14 records had to be
removed for data inconsistencies.

16
stored. Only 4% of farmers using supplied devices used insecticide on the maize
prior to placing it in the improved storage the rest trusted the information that the
device did not need insecticide and would kill the insects through lack of air. The
ability to forego insecticide translates to a $1 saving per bag stored.
When the devices were given out some farmers mentioned they had wanted the
metal silo because it was rat proof. However, after using their improved
storage device, only 8 farmers in Round 2 reported rat problems, and in all
but one case the rat problem occurred once the device was empty and left
open (most often times, the GrainSafe). This can be compared to 35 stating
that they had trouble with them before, a decrease of 77%.
64% of farmers felt that the storage device provided had helped them solve their
weevil and moth problems. Moreover, 91% were surprised at how well their
device worked at preventing insects because they were air tight and 93%
thought the device stored maize better than normally PP bags,
overwhelmingly due to the lack of insect infestation and damage by weevils,
moths, larger grain borer (LGB) etc. However, 6 metal silo farmers did report that
if they were to buy the device and use it again, they would add insecticide.
Interestingly, 5 of these 6 were untrained on how to setup their device, most
likely increasing their infestation levels. Nevertheless, 83% (70 farmers) also
claimed to have stored their maize for longer in their improved storage
device since it protected the maize from damage by insects.
C. Round 3 (Aflatoxin Survey)
Prior to conducting Round 3, AflaSTOP held 10 village level meetings at the
beginning of April 2016 to ensure that the farmers had the best understanding
possible of the SMS to be sent to them with their contamination level at the start of
storage in April 2015, and to discuss the implications of varying aflatoxin levels and
what mitigating actions they could take as farmers. Of the 122 farmers with
aflatoxin scores, 21% were storing maize with an aflatoxin level over 10ppb.5
While aflatoxin levels ranged from a minimum of 1ppb to 393ppb, farmers with a
score over 10ppb recorded a median contamination level of 36.7ppb. The local
Ministry of Agriculture extension officers and Chiefs participated but out of 122
farmers, only 75 turned up to the meetings.
5 10 parts per billion (ppb) is the maximum amount of aflatoxin contamination allowable by the Kenyan Bureau of Standards.
17
After receiving their results, 23 farmers (20%) contacted the AflaSTOP team to
get an explanation of what their aflatoxin level meant – 78% of those who called
did not attend a village meeting. Five farmers with scores from 22.3ppb to
393ppb sought additional guidance due to fear about their high levels of
contamination. Guidance given by AflaSTOP staff included suggestions
regarding crop rotation, using hermetic storage devices, and to enquire about
Aflasafe, which treats the source of the fungal growth in the soil and should be
available 2016/17.
Knowing the contamination level of their maize, farmers were then given
the Round 3 Survey to gauge how their aflatoxin level may have effected
their current and future post-harvest storage practices and willingness to
invest in improved storage devices. Overall, 86% of farmers now felt that their
device had helped them to solve other issues, namely weevil and moth
infestation, up from 64% (22% increase) response at the end of the storage
period.
With regard to aflatoxin, in Round 3 only 18% said they would dry their maize for
longer than in Round 2 in order to minimize fungi growth, which can perhaps be
attributed to their higher aflatoxin scores (21% had contamination over 10ppb).
Nevertheless, farmer awareness about the dangers of aflatoxin and knowing that
that they did have aflatoxin producing fungi in their current grain, even if a lower
amount, may have contributed to 94% of farmers stating that they would want
to store their maize in an improved device after receiving their aflatoxin
results. Only 27% of farmers opted to purchase their devices from AflaSTOP,
however this decision was taken before they knew their aflatoxin level. More
discussion on this topic can be found in Changes in Willingness to Pay for an
Improved Storage Device
In Round 3, 49% of farmers also believed that their land should be treated and or
cleaned from the fungi that cause aflatoxin, even though only 21% had scores
above 10ppb. When asked specifically if they would be willing to purchase a
treatment that cleans the lands, 80% answered positively, while the balance of
farmers were more suspicious and either did not believe aflatoxin was an issue
for them, thought the treatment could damage the fertility of their soil, and or
might not be effective and there was no way for them to tell this. In terms of
expressed willingness to pay to treat their land, 50% of farmers were willing to
pay $3/acre or more, with the average amount they were willing to pay being
approximately $3.45 per acre.

18
In terms of drying practices, farmers’ practices were compared before and
after receiving their aflatoxin results. Whereas on average only 31.1% of the
farmers (33) dried their maize on tarpaulin in Round 2 (before they had received
their aflatoxin results), 51.8% of the farmers (56) in Round 3 indicated that they
had started drying their maize on a tarpaulin. This finding is shown in Table 9 on
page 32; Detailed Findings, Round 3 (Aflatoxin Survey). In addition, results
show that 100% (n=23) of the farmers with aflatoxin results of greater than 10ppb
will dry their maize for longer periods of time to ensure that it is completely dry,
while 87.5% (n=21) of farmers with results greater than 5ppb but less than 10
ppb will do same, as compared to 75.5% (n=40) of farmers with aflatoxin result
that is less than 5ppb. This analysis can be found in Figure 2 in Detailed
Findings, Round 3 (Aflatoxin Survey), page 27.
With regard to changes in their willingness to pay, in Round 1 farmers’
expressed a willingness to pay approximately USD$1/bag for a device before
they had come in contact with any of the three being tested. In Round 2,
approximately a third of farmers indicated they would like to buy an improved
device and37% paid the subsidized price. Farmers indicated an even split
regarding which device they would like to purchase – 32% wanted a metal silo;
28% a GrainSafe; and 38% a PICS bag.6
The farmers had been told their devices had been provided on loan and they
would have to pay for them. Farmers with PICS bags were asked to pay Kshs 50
per bag (just under 50% of the second years’ value), farmers with the metal silos
were asked to pay Kshs 500 per bag the device held (i.e. the same as 2 new
PICS bag per bag of storage capacity), and Grain Safe farmers were asked to
pay Ksh3000. Just over a third of the farmers paid the full subsided price, a
further 3% paid some proportion of it – but it was impossible to collect the full
amount. (They would have probably paid the full amount eventually). 11% of
farmers bought PICS bags at 25% of the cost of a PICS bag. 18% of farmers
bought their metal silo and GrainSafe at 2 times the cost of a PICS bag – i.e. $5
per bag – however no one would pay more than Kshs 3,000 ($30) in total for the
device. More farmers bought devices in March when AflaSTOP paid them for the
remaining maize in their devices, perhaps indicating how cash flow is an
important factor into purchasing decisions.
6 It is important to note that by Round 2, farmers knew the market value of their device from the loan agreement that they signed (more details available in Table 5, Page 17) and had used the device on their farm and seen results first-hand, whether positive or negative.

19
Surprisingly given its
protection from rats the
metal silo was the least
favored device in terms of
farmers actually paying for
them; farmers often
reported in the last month
when they emptied the
maize that the last
kilograms were mouldy, or
insect infested.
Meanwhile, in Round 3
those who wanted to
purchase PICS bags grew
to 62%, indicating an
important change in
preference, and when
asked one last time on
average farmers stated
they could afford to buy 4
PICS bags to store all of their maize at a price of Kshs 100 per bag. In fact, after
being given the Round 3 Survey, 3 additional farmers from the intervention group
purchased 11 PICS bags from the survey enumerator. This will be discussed
further in Summarized Findings, Barrier Analysis Survey (Round 3).
Nevertheless, AflaSTOP found no significant difference among farmers in terms
of their willingness to buy PICS bag after receiving their aflatoxin contamination
results, i.e. whether they had a high or low score, farmers did not show any more
or less inclination to purchase. Data was also compared between the trained and
untrained group with no statistically significant difference between the two
groups. These findings are shown in Table 10 in Detailed Findings, Round 3
(Aflatoxin Survey) on page 28.
However, data analysis did find that there is a statistically significance difference
within the groups with regards to what farmers think their aflatoxin results
said about their land. 100% of farmers with aflatoxin levels above 10ppb all
thought their land needed treating, this response was significantly different
from farmers whose results were below 10ppb. 61% of farmers between 5 –
10ppb thought their land was affected by the fungus, and only 44% below 5ppb.
Table 2: Proportion of devices paid for in each category (by percentage of the number of
farmers in that category)
Paid for device in
full
Partially paid for device
Refused to return device
PICS 49 6 17
Metal Silo
25 29 33
Grain Safe
36 65 50
Table 3: Percentage of farmers who paid,
partially paid, returned or refused to return
their devices
Paid for device in full
Partially paid for device
Refused to return device
Returned device
% farmers
27 13 5 55

20
The difference between these responses was not statistically different. These
findings are shown in Table 10 in Detailed Findings, Round 3 (Aflatoxin Survey)
on page 32.
D. Consumption Habits & Trends
Through AflaSTOP’s survey data, the project attempted to decipher how much
an average family eats when they have maize and what coping strategies they
employ when they do not have maize, such as dropping a meal or reducing
portion sizes. In this regard, in Round 1 it was clear that while a large portion of
farmers sell maize at some point and or give away maize, almost all farmers keep
some of the maize they harvest for household consumption. That said, almost half
of respondents seemed to have a very poor idea about their consumption needs
and or had trouble quantifying it accurately.
In Round 2, a majority of farmers (72%) stated that they removed maize on a
weekly basis to cater for approximately 10 meals of maize a week and even
though they had finished their previous maize stocks at the time of the survey,
99% indicated that they were still consuming maize. 65% of farmers stated that
they were eating the same amount of maize as when they had their own stocks,
but 35% had reduced their consumption and replaced it with other food sources,
and were mostly purchasing foodstuffs from the market while they waited for their
next harvest.
While a large portion of Round 2 farmers (72) answered that their stored maize
met their needs and that once they put maize into store they did not sell any or
purchase from the market, for those who it did not, 30% sold maize to cater for
cash needs such as paying school fees, or farm and household inputs and
improvements. (This response did not match reality given only 20% of farmers
still had maize just prior to the next harvest.) Of the 35 farmers (33%) from the
overall survey who were eating less maize, 95% were eating rice instead,
followed by wheat flour/chapatti and cooked bananas, the first two are all more
expensive than maize, demonstrating that when intervention farmers went to the
market, they choose to spend their limited cash on alternative and more
expensive products.
A smaller portion of female farmers (19) who were queried in two focus group
discussions on the topic of household consumption found that on average a
household with two adult males, two adult females, one male child and one
female child will consume a total of thirteen, 90KG bags of maize per year in

21
form of posho.7 In addition, 2.3 bags of maize were used to cook other foods
(githeri and muthokoi). Thus, a household of six members would need 15.3 bags
of maize per year for household consumption. As a point of comparison,
AflaSTOP’s Monthly Survey data (shown in the table below) lists the amounts
stored and sold by device, which lines up fairly well with the 13 bag estimate
needed for household consumption for a family of 6 with an average of 4.26
acres of land.
Moreover, farmers indicated that they no longer reduce intake and/or drop a meal
when they run out of maize. Instead, farmers purchase from the market, borrow
from a neighbor, or cook other foods like rice or cassava instead of reducing
intake.
E. Purchase of Devices
The terms of the device loan agreement, which all farmers signed, made clear
that the device was being loaned to the farmer and that they would need to return
it to AflaSTOP on completion of the on-farm testing, or purchase it from the
project. Silent bids were taken from all farmers who were interested in
purchasing their device, and the devices were offered to farmers based on the
median price that farmers had indicated they were able to pay.
Table 5: Market Price of Devices vs. AflaSTOP subsidized price
PICS Bag GrainSafe + Frame Metal Silo
Market Price USD$2.50 USD$268.20 USD$64.00*
7 The average amount of posho consumed yearly by male and female children between 1 and 17 years was used in the calculations.
Table 4: How AflaSTOP Farmers Used Their Maize
Median Bags Stored in
AflaSTOP
device*
Bags eaten Bags sold Bags
potentially
stored
elsewhere
PICS 5 bags 1.6 bags 2.4 bags 2 bags
GrainSafe 9.3 bags 2.2 bags 2.4 bags 4.5 bags
Metal Silo 4 bags 2.01 bags 1.4 bags 4 bags
~1 bag = 90 kg
*Some farmers had more maize to store, but chose to store in it PP bags in case the device
they were testing with AflaSTOP did not work/damaged their harvest.

22
AflaSTOP Price USD$0.50 USD$30.00 USD$10.00*
*Cost depends on bag capacity. This costing is based on a metal silo that can hold 2 bags.
In total, 46 farmers (40%) were interested in purchasing their device with 36
paying in full by August 2016. The below table examines which devices were
returned, purchased, or stolen. Coincidentally, the most expensive device, the
GrainSafe, was the most common device not returned and not paid for as
agreed, perhaps indicating that farmers appreciated its quality and usefulness,
but were not willing to pay even the subsidized rate shown above. 96% of PICS
farmers and 84% of metal silo farmers returned and/or bought their devices, but
only 65% of GrainSafe farmers did the same.
Table 6: Number of farmers who…
Received
a device
Used
it
Did not
use it
Paid in FULL
for their
device(s)
Returned
device to
AflaSTOP
Made a
partial
payment
Did
not
return
PICS 48 45 3 14 32 1 1
GrainSafe 40 38 2 13 13 11 3
Metal Silo 44 39 5 9 28 5 2
132 122 10 36 73 17 6
As of August 2016, 73 farmers returned their devices, 61% of who were
untrained; 17 have made a partial payment; and 6 farmers have not been found
and or refused to return their device. Interestingly, a total of 46 farmers outside
the intervention trained group purchased a total of 158 PICS bags, or
approximately 3.4 bags each with 2 being the most commonly purchased
quantity.
In terms of farmer perceptions, while only 27% of farmers purchased their device
and paid for it in full, in Round 3 another third indicated that they either did not
understand the terms of agreement they signed at the beginning of the
intervention (that they would have the option to buy or return the device) or were
hoping that they would be given their device since they did not have the money
to purchase. Another 10% stated that they could not afford such an expensive
device and 19% declined to purchase given that they believed that the device did
not work effectively (i.e. they still had trouble with rats, mould, and weevils).

23
Additionally, in the Round 3, only 39% of farmers indicated a willingness to go to
their local agro-dealer to purchase PICS bags, but their willingness to purchase
the bag increased to 67% if someone came to their farm to sell them with a
willingness to pay of Kshs 200. This was echoed by actual Doers in the Barrier
Analysis Survey, which will be discussed further in Section G: Barrier Analysis,
with only 14% of Doers being willing to purchase a PICS bag from their local
agrodealer - 86% whose agro dealer was located on average 1.74 km away from
them, would not have travelled that distance to buy the bags (71% of all farmers
surveyed estimated that their nearest agro dealer is 40mins or 1.7km or more
away).
F. Barrier Analysis Survey (Round 3)
In order to better understand why certain farmers were more likely to adopt and
invest in PICS bags, the project conducted a Barrier Analysis, which identified
key beliefs and constraints that either encourage or discourage farmers to invest
in the bags. AflaSTOP surveyed the 44
“Doers” from outside the intervention
group who purchased PICS at a cost of
Kshs 250 per bag, as well as 36 “Non-
Doers” from the intervention (i.e.
Farmers who were given PICS to use
but elected not to purchase at a
subsidized price of Kshs 50 per bag).
More details on the Barrier Analysis
Methodology & Analysis can be found
in Annex D: Barrier Analysis
Methodology & Analysis and in
Detailed Findings, Barrier Analysis.
To begin, one of the biggest barriers to
investment in PICS bags was found to
be perceived positive consequences.
Overall, Non-Doers did not value the
benefits of investing in and using the
PICS bags sufficiently to ‘find’ the
disposable cash to buy them as
compared to Doers.
Barrier Analysis and Perceptions Many of the results here suggest that Doers believe in their own self-efficacy and severity of the problem; Non-Doers, on the contrary, do not believe that they have the ability to do the behavior, access necessary materials, or that there is a severe problem if they do not use PICS bags. Barrier analyses measure people’s perceptions, whether those perceptions are accurate or not. For instance, perceived positive consequences is not the same as actual positive consequences; individuals may think that doing the behavior results in certain benefits, even if this is not the case in reality. As a result, many of the results in a barrier analysis suggest changing perceptions, either rather than or in addition to increasing access or knowledge.

24
Doers cited specific benefits that they associate with bag investment and use.
For instance, Doers were six times more likely than Non-Doers to say that PICS
bags prevent damage from insects. They were two times more likely to say that
using PICS bags can lead to higher incomes (because there is more maize to
sell), and almost three times more likely to say that they save money on pesticide
purchases with the PICS bags. Doers were also almost four times more likely
than Non-Doers to say that maize stored in PICS bags is safer due to less
pesticide use. These responses suggest that Doers perceive greater
benefits to investing in and using PICS bags.
Conversely, Doers were three times more likely to say that there are no negative
consequences to PICS bag investment and use; 75% of Doers were unable to
highlight a negative consequence, while only 35% of Non-Doers said that there
are no negative consequences.
Non-Doers were seven times more likely to perceive negative
consequences of using PICS bags, citing that if the bag does not work, there
might be huge losses of stored maize (even though none of them experienced
this problem). In contrast, where Doers did cite negative perceived ramifications
of investment in bags, they worried that the device might be damaged by rats,
highlighting not a failure or mistrust of the bag itself, but a concern that it could be
ruined.
In terms of perceived social norms, both Doers and Non-Doers stated that almost
everyone approves of them doing the behavior. However, Doers were much
more likely to cite specific groups who would approve of them doing the behavior:
Doers were approximately 4 times more likely to say spouses support investment
in PICS bags, 2 times more likely to say children support the behavior, and 12.3
times more likely to say that neighbors and friends support the behavior. This
finding suggests that, while Doers and Non-Doers both feel that their social
groups support the behavior, Doers may have more specific and vocal
support from spouses, family, and friends.
With regard to perceived self-efficacy, Doers and Non-Doers responded
differently when asked what might make it easier for them to do the behavior.
Doers were 11 times more likely to suggest that it would be easier for them to
invest in PICS bags if they were able to make more money, whereas Non-Doers
were approximately seventy times more likely to cite that they could invest if the
price of bags were lower (with 86% of Non-Doers reporting this response, and
0% of Doers.
25
On the surface, these answers seem similar, but they may reflect a difference in
attitude between Doers and Non-Doers regarding the value of the bags. Doers
would like to have more money in order to buy the bags; Non-Doers, on the
other hand, want the cost of the bags to be lower, suggesting that they are
perceiving a disconnect between cost and value.
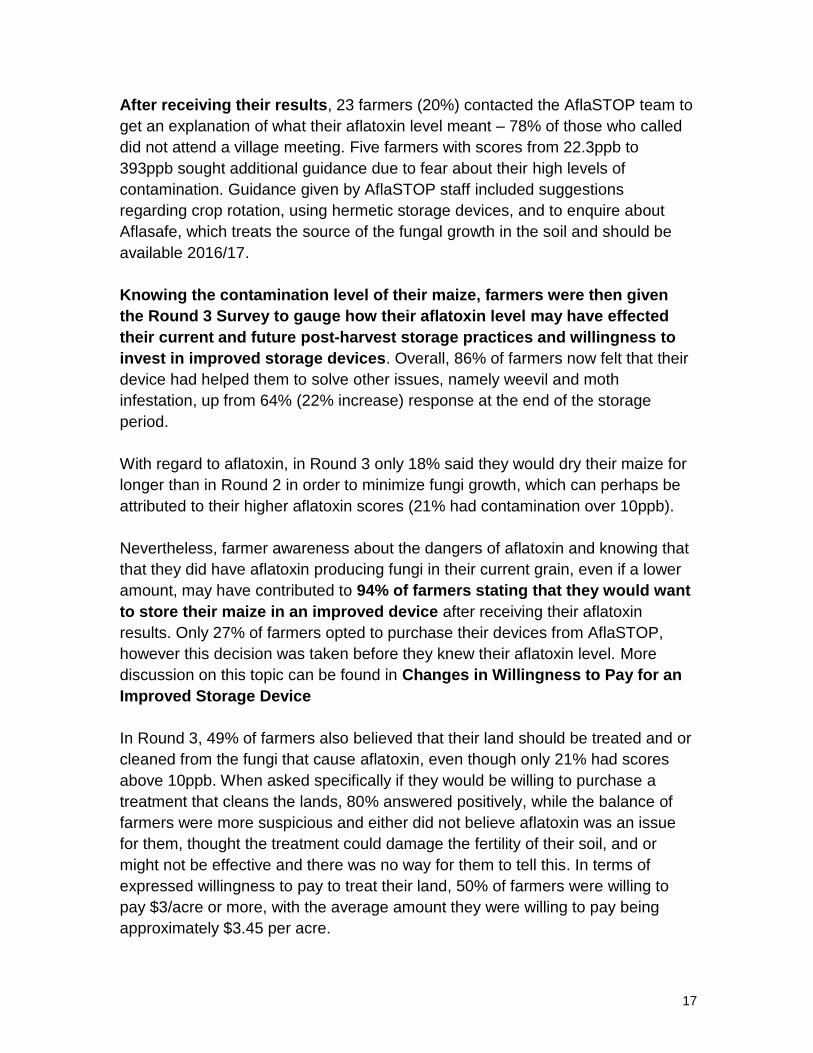
Finally, looking closely at those farmers who bought bags but were not part of
AflaSTOP’s smallholders, we wanted to know how important it was that the seller
of the bags visited them on their farms as compared to travelling to an agro
dealer to purchase the bags. With this in mind, we found the following:
14% of smallholder farmers who bought bags would have purchased a
PICS bag from their local agro dealer who was, on average, 1.4 km away.
86% of smallholder farmers who bought the bags, and whose agro dealer
was located on average 1.74 km away from them, would not have
travelled that distance to buy the bags.
71% of all farmers surveyed (including AflaSTOP’s farmers who did not
buy bags) estimated that their nearest agro dealer is 40mins or 1.7km or
more away.
While the distance between farmers and agro dealers has significantly reduced
over the last 10 years, these results indicate that farmers are still not routinely
connecting with market outlets, which are a source of seed, fertilizer, pesticides,
veterinary treatments and other farmer requirements. Even though the figures
above could indicate a reluctance to walk to an agro-deal to make purchases, we
know that most farmers buy the inputs listed above from these same agro-dealers.
As PICS storage bags are a recent technology that is being introduced, we
hypothesis that this current reluctance may be due to not knowing if their agro-
dealer stocks the PICS bags.

26
VI. Additional Detailed Findings
A. Round 1 (Baseline Survey)
Round 1 served as the baseline for analysis with data confirming that intervention
farmers were not statistically different in terms of their characteristics, behaviors,
or opinions from the general farming population. Therefore, changes in attitudes
toward maize storage practices in subsequent rounds of the survey could be
attributed to the devices and their interactions with the AflaSTOP project team.
In Round 1, the AflaSTOP Team found that farmers appeared to have a
potentially weak understanding of the actual size of their land, their yields per
acre, and the amount they consume. Meanwhile, questions related to the total
number of bags on a specific issue appear to be more accurate than bags per
acre, or kilograms of maize consumption per person per week, etc.
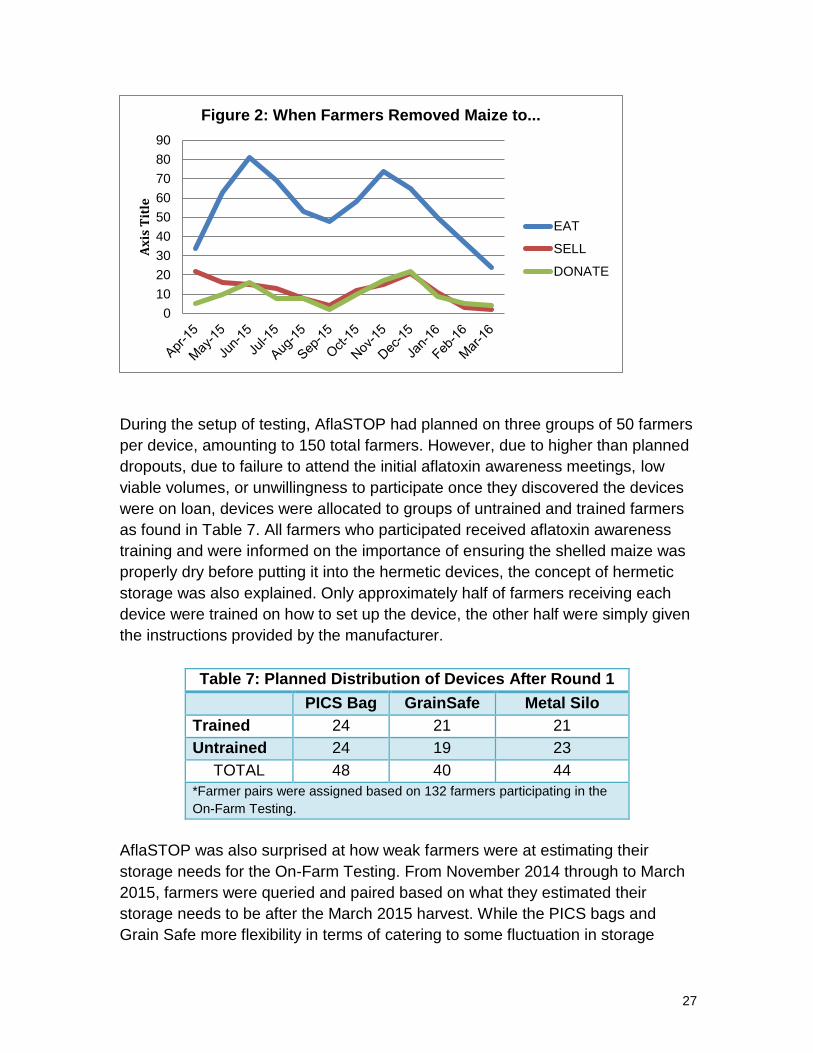
Other important findings from Round 1 relate to the reasons for sale at harvest,
which AflaSTOP found are not necessarily related to limited storage, insect, or
rat concerns, but to farmers' cash needs. Farmers understand that prices
normally go up through the year. However, the assumption that sales of
improved storage will be driven by farmers’ previous lack of access to and
awareness of such devices may effectively be false. While it was hoped that with
improved storage farmers would sell more later in the season and make higher
profits, or have more stable access to grain stores to eat for more months of the
year, they appear to be more constrained by their limited cash liquidity at harvest,
with food security and profit motivation being secondary considerations.
In subsequent Rounds of the On-Farm Testing, this continued to be the case,
even though 2016 was a good harvest period and farmers had improved storage
devices provided by AflaSTOP. As shown in Figure 1 below, based on a main
harvest in March 2015 and a smaller, secondary harvest in September/October
2015, farmers appear to have continued to sell their grain immediately,
presumably to address cash needs in April 2015 (planting) and in December
2015 (Christmas, school fees and preparing for planting). At these times, maize
prices would have been at their lowest, as compared to the “hungry season”
between August and September when they might have benefitted from higher
prices.
27
During the setup of testing, AflaSTOP had planned on three groups of 50 farmers
per device, amounting to 150 total farmers. However, due to higher than planned
dropouts, due to failure to attend the initial aflatoxin awareness meetings, low
viable volumes, or unwillingness to participate once they discovered the devices
were on loan, devices were allocated to groups of untrained and trained farmers
as found in Table 7. All farmers who participated received aflatoxin awareness
training and were informed on the importance of ensuring the shelled maize was
properly dry before putting it into the hermetic devices, the concept of hermetic
storage was also explained. Only approximately half of farmers receiving each
device were trained on how to set up the device, the other half were simply given
the instructions provided by the manufacturer.
Table 7: Planned Distribution of Devices After Round 1
PICS Bag GrainSafe Metal Silo
Trained 24 21 21
Untrained 24 19 23
TOTAL 48 40 44
*Farmer pairs were assigned based on 132 farmers participating in the
On-Farm Testing.
AflaSTOP was also surprised at how weak farmers were at estimating their
storage needs for the On-Farm Testing. From November 2014 through to March
2015, farmers were queried and paired based on what they estimated their
storage needs to be after the March 2015 harvest. While the PICS bags and
Grain Safe more flexibility in terms of catering to some fluctuation in storage
0
10
20
30
40
50
60
70
80
90A
xis
Tit
le
Figure 2: When Farmers Removed Maize to...
EAT
SELL
DONATE

28
requirements (either through distributing more PICS bags and or more
completely filling a Grain Safe), the metal silo could not be altered given that it
was made to order based on the estimated volume each farmer would store.
Table 8 shows how well farmers anticipated their storage needs for March 2015
based on the volumes provided in February. It is important to note that GrainSafe
farmers would have been those with estimated storage needs of 5 to 20 bags,
while PICS farmers were in the range of 2 to 20 bags, and Metal Silo farmers in
the range of 2 to 8 bags.
Table 8: How well did farmers anticipate their storage needs?
PICS
Bag
Metal
Silo
GrainSafe
% of farmers who estimated their storage volume
correctly
31.11 33.33 5.26
% of farmers who stored between 0 to 25% of the
volume they estimated
11.11 5.13 10.53
% of farmers who stored between 25 to 50% of volume
they estimated
24.44 30.77 34.21
% of farmers who stored between 51 to 75% of the
volume they estimated
17.78 15.38 23.68
% of farmers who stored between 76 to 99% of the
volume they estimated
8.89 2.56 15.79
% of farmers who underestimated the volume of maize
they would store in March 2015 (i.e. they needed more
storage)
6.67 12.82 10.53
Average % that farmers were below their estimated
storage volume
49.31 51.05 65.22
Average bags stored per family member 0.79 0.79 1.17
% of families storing more than one bag per person 17.78 10.26 65.79
29
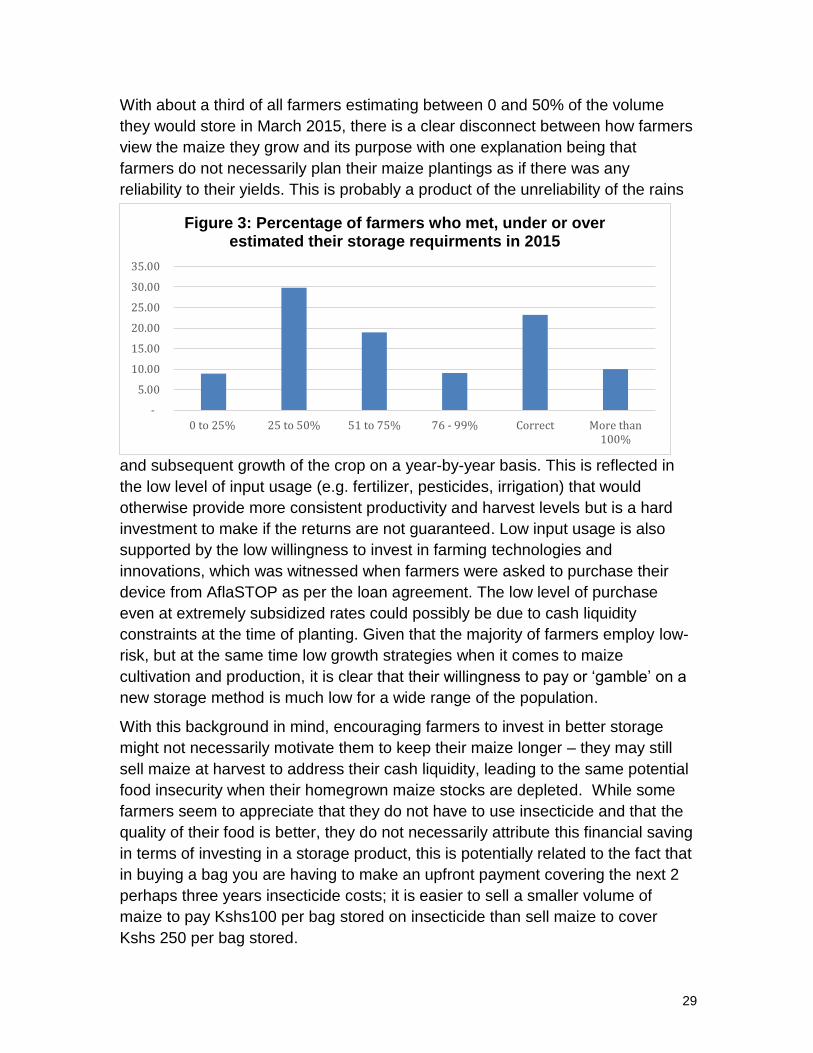
With about a third of all farmers estimating between 0 and 50% of the volume
they would store in March 2015, there is a clear disconnect between how farmers
view the maize they grow and its purpose with one explanation being that
farmers do not necessarily plan their maize plantings as if there was any
reliability to their yields. This is probably a product of the unreliability of the rains
and subsequent growth of the crop on a year-by-year basis. This is reflected in
the low level of input usage (e.g. fertilizer, pesticides, irrigation) that would
otherwise provide more consistent productivity and harvest levels but is a hard
investment to make if the returns are not guaranteed. Low input usage is also
supported by the low willingness to invest in farming technologies and
innovations, which was witnessed when farmers were asked to purchase their
device from AflaSTOP as per the loan agreement. The low level of purchase
even at extremely subsidized rates could possibly be due to cash liquidity
constraints at the time of planting. Given that the majority of farmers employ low-
risk, but at the same time low growth strategies when it comes to maize
cultivation and production, it is clear that their willingness to pay or ‘gamble’ on a
new storage method is much low for a wide range of the population.
With this background in mind, encouraging farmers to invest in better storage
might not necessarily motivate them to keep their maize longer – they may still
sell maize at harvest to address their cash liquidity, leading to the same potential
food insecurity when their homegrown maize stocks are depleted. While some
farmers seem to appreciate that they do not have to use insecticide and that the
quality of their food is better, they do not necessarily attribute this financial saving
in terms of investing in a storage product, this is potentially related to the fact that
in buying a bag you are having to make an upfront payment covering the next 2
perhaps three years insecticide costs; it is easier to sell a smaller volume of
maize to pay Kshs100 per bag stored on insecticide than sell maize to cover
Kshs 250 per bag stored.
-
5.00
10.00
15.00
20.00
25.00
30.00
35.00
0 to 25% 25 to 50% 51 to 75% 76 - 99% Correct More than100%
Figure 3: Percentage of farmers who met, under or over estimated their storage requirments in 2015

30
B. Round 2 (Post-Test Survey)
While 132 farmers participated in the On Farm Testing who were divided into 1
trained and 1 untrained group of farmers per device) with all trained farmers
coming from specific areas, and untrained farmers from different areas. Of this
group only 122 used the devices provided. Round 2 surveyed 120 farmers,
which took place from late 2015 to early 2016 (others were unavailable at the
time of survey).
With this in mind, this translates into 122 farmers who had used their device to
store part of all of their March 2015 and or September 2015 harvests and who
had also been visited on a monthly basis by AflaSTOP staff to check on their
device setup, extract a 2kg sample (and compensate the farmer for the same at
the prevailing market price), and record a brief monthly survey.
Therefore, it may be said that these 122 farmers were familiar enough with their
device to have an opinion on its operation and were perhaps more keenly aware
of their storage practices as related to aflatoxin contamination, simply through
interaction with the AflaSTOP team and initial discussions held. Prior to being
given the devices AFLASTOP’s training emphasized how important it was to dry
the maize before putting it into the device. Given this, it is not surprising that
Round 2 did indicate that farmers had altered some of their post-harvest drying
and storage practices. Namely, compared with Round 1, in Round 2 farmers
reported drying their cobs for longer – 13 days versus 9.65 days on average.
In terms of storing their maize, while 55% of Round 1 farmers reported using a
granary or crib to store their shelled maize, in Round 2, many farmers kept their
device with their maize, especially the larger devices, in their house - 48% of
PICS farmers; 83% of GrainSafe farmers; 60% of silo farmers. Granaries in this
area tend to be above supported on blocks to prevent termites, and be relatively
Table 9: Farmers by Device in Round 2
PICS Bag GrainSafe Metal Silo
Trained 21 20 20
Untrained 18 12 15
TOTAL 39 32 35
*Devices were allocated to 132 farmers. 10 never used their device. 2
additional farmers did not participate in Round 2 & 14 records had to be
removed for data inconsistencies.

31
low roofed, with fairly small doors. For many farmers it was impossible to get
these bigger devices into these stores and farmers relocated them.
Regarding farmers’ concerns when storing their maize, in Round 1 farmers
overwhelmingly felt that they were very susceptible to weevils (38%), followed by
rats (18%), mold (7%), and then aflatoxin. This translated to the average farmer
spending USD$1.00 per bag to prevent insects during storage. In terms of total
insecticide applied, the average farmer used about 950 grams of insecticide to
treat their maize, which amounts to approximately 87 grams per bag - the
recommended dosage is about 50 grams per bag. This is reiterated by the data,
which shows that while 91% of farmers in Round 1 previously used insecticide,
only 4% of farmers in Round 2 reported that they had used insecticide, a possible
savings of around USD$1.00 per bag stored based on Round 1 data.
Round 2, 91% of farmers were impressed at how well their device worked at
preventing insects because they were air tight and 93% thought the device
stored maize better than what they normally experience, overwhelmingly due to
the lack of insect infestation and damage by weevils, moths, larger grain borer
(LGB), etc. However, 6 metal silo farmers did report that if they were to buy the
device and use it again, they would add insecticide. Interestingly, 5 of these 6
were untrained on how to setup their device, most likely increasing their
infestation levels. Furthermore, 83% (70 farmers) in Round 2 also claimed to
have stored their maize for longer in their improved storage device than what
they usually do since it protected the maize from damage by insects.
Related to insect infestation, when asked in Round 2 if they would do anything
differently if they were to buy the device and use it again, 89% farmers who said
that they would indicated that in future they would clean their maize before
storage. Specifically, these 67 farmers would sieve and winnow their maize,
which involves removing the dirt and other debris.8
In terms of rat problems related to the use of improved storage device, only 8
farmers in Round 2 reported rat problems, and in all but one case the rat problem
occurred once the device was empty and left open (most often with the Grain
Safe). This can be compared to 39 farmers stating that they had trouble with rats
8 Sieving involves putting the maize onto a mesh table, and pushing it back and forward, so that the small pieces of dirt and debris fall through, and what is left is ‘clean maize.’ Winnowing involves putting the maize on a flat basket-type instrument, throwing it up into the air, and allowing the wind to blow the chaff away. However, this does not remove heavy dirt since it will fall down with the maize and it is unknown what amount of aflatoxin spores might be found in the chaff.

32
before, a decrease of 77%. Many farmers were worried that the PICS bags would
be eaten by rats – in fact two women farmers swapped because one would not
use the bags and wanted the metal silo. Other findings by other researchers
have also substantiated this finding that if the stores are clean, and there is no
reason for the rats to smell food and come in – they do not attack the bags.
C. Round 3 (Aflatoxin Survey)
As discussed above in the Summarized Findings, Round 3 (Aflatoxin Survey)
on page 16 farmers’ drying practices were compared before and after the
farmers received their aflatoxin results farmers. AflaSTOP found that before they
received their results, on average only 31.1% of all farmers dried their maize on a
tarpaulin. However, after receiving them, 51.8% of all farmers reported that they
had started drying the maize on a tarpaulin. This distribution by aflatoxin score is
shown below in Table 10.
Table 10: Changes in Drying Practices Before and After Receiving Their Results
Before the Aflatoxin Results After the Aflatoxin Results
Farmers
with
aflatoxin
result <
5ppb
Farmers
with
aflatoxin
result
>=5ppb
but
<10ppb
Farmers
with
aflatoxin
result >
10ppb
Aggregate
Farmers
with
aflatoxi
n result
< 5ppb
Farmers
with
aflatoxin
result
>=5ppb
but
<10ppb
Farmers
with
aflatoxin
result >
10ppb
Aggregate
Dry maize
on a
tarpaulin
instead of
the
ground
44.8%
(n=13)
22.2%
(n=2)
44.4%
(n=4)
40.4%
(n=19)
96.5%
(n=26)
100.0%
(n=9)
100.0%
(n=9)
97.8%
(n=45)
Dry maize
cobs in
sun
directly
48.3%
(n=14)
77.8%
(n=7)
55.6%
(n=5)
55.3%
(n=26)
0.0%
(n=0)
0.0%
(n=0)
0.0%
(n=0) 0.0% (n=0)
Dry maize
cobs in a
store
6.9%
(n=2)
0.0%
(n=0)
0.0%
(n=0) 4.3% (n=2)
0.0%
(n=0)
0.0%
(n=0)
0.0%
(n=0) 0.0% (n=0)

33
The Ministry of Agriculture extension officers constantly remind farmers that it is
best practise to dry on sheets, IFPRI’s recent work showed that maize dried on
impermeable plastic sheets (not the PP sheets farmers often use) results in 26%
less aflatoxin compared to maize dried on the ground 3 months later. In addition,
not only are farmers going to dry their maize on a tarpaulin, but some of them
also plan to dry their maize for longer. Figure 2 below illustrates which segments
of farmers from AflaSTOP’s on-farm testing will dry their maize for longer after
receiving their aflatoxin results. While all farmers indicate they will dry their maize
for longer, the largest change in behaviour lies with those farmers whose maize
was contaminated over 10ppb. Statistically, the Pearson chi square value ꭓ¬2
(2df) = 7.468, p < 0.05, shows that there is a significant difference between the
farmers with aflatoxin results of < 5ppb, > 5ppb but < 10ppb and those with
results > 10ppb with regards to their drying practices after receiving their results.
The results show that 100% (n=23) of the farmers with aflatoxin results > 10 will
dry
Built a
place to
dry the
maize
0.0%
(n=0)
0.0%
(n=0)
0.0%
(n=0)
0.0%
(n=0)
3.5%
(n=1)
0.0%
(n=0)
0.0%
(n=0)
2.2%
(n=1)
Total 100%
(n=47)
100%
(n=46)
24.5%
12.5%
0.0%
16.0%
75.5%
87.5%
100.0%
84.0%
Farmers withaflatoxin result <
5ppb
Farmers withaflatoxin result >5ppb but <10ppb
Farmers withaflatoxin result >
10ppb
Aggregate
Figure 4: Drying practices after Aflatoxin Results
Famer will continue with their usual drying practices as the maize had no/lowlevels of Afatoxin
The farmer will dry the maize for longer periods to ensure it is completely dry

34
their maize for longer periods of time to ensure it is completely dry, 87.5% (n=21)
of farmers with results > 5ppb but < 10 ppb will do same as compared to 75.5%
(n=40) of farmers with aflatoxin result that is less than 5ppb.
D. Willingness to pay With regard to willingness to purchase an improved storage device in Round 3,
AflaSTOP analysed whether the severity of contamination in their maize affected
farmers’ willingness to purchase PICS bags. The table below shows that there is
no statistically significant difference within the three groups in terms of their
willingness to buy PICs bag after receiving their results, as the P value is greater
than 0.05. Data was also compared between the trained and untrained groups,
there was also no statistically significant difference between the two groups in
terms of their willingness to purchase PICS bags. This data is shown more in
detail below in Table 11.
Table 11: Change in Farmer Willingness to buy PICS Bags
Will you now
buy a PICS
bag?
Farmers with
aflatoxin result
< 5ppb
Farmers with
aflatoxin result
> 5ppb but
<10ppb
Farmers with
aflatoxin
result >
10ppb
Aggregate
Yes 62.7% (n=37) 64.0% (n=16) 65.2% (n=15) 63.6% (n=68)
No 37.3% (n=22) 36.0% (n=9) 34.8% (n=8) 36.4% (n=39)
Total 100% (n=59) 100% (n=25) 100% (n=23) 100% (n=107)
Despite the similarities in willingness to purchase PICS bags, Table 12 below
shows that knowing the contamination level of their maize did change the way
farmers felt about their land and whether or not it needed to be treated and/or
cleaned for aflatoxin fungi. Statistically, the Pearson chi square value ꭓ2 (2df) =
20.483, p < 0.05, showed that there was a significance difference within the
groups with regard to what farmers thought the aflatoxin results said about their
land. Specifically, 56.2% of farmers with results < 5ppb, thought their land did not
have the fungus or was not very affected by it as compared to 39.1% and 0.0%
of farmers with results > 5ppb but < 10ppb and those with < results 5ppb.
Table 12: What do farmers think their aflatoxin result said about their land?
Farmers with
aflatoxin
Farmers with
aflatoxin result
Farmers with
aflatoxin Aggregate

35
While the newfound awareness of testing their maize obviously effected farmers,
only time will tell if this translates into an actual purchase of Aflasafe, which treats
the source of the fungi growth in the soil (at time of this report it was not available
in agro dealers), or if farmers take other “mitigating” actions with regard to their
post-harvest drying and storage practices to attempt to arrest the growth of
aflatoxin, or adopt a more frequent crop rotation. Either way, the only way to
completely eradicate aflatoxin growth is to treat the soil – improved storage,
better drying, and crop rotation only serve to minimize the contamination but it
can still be present. Commercially, Aflasafe costs an estimated $6.60 to treat per
acre and in Round 3, 50% of farmers did indicate a willingness to pay $3 or more
to treat their land, with the average amount they were willing to pay being
approximately $3.45 per acre.
E. Changes in Willingness to Pay for an Improved Storage Device
Despite farmers using devices on their farm and witnessing visible improvements
with regard to their stored maize, this unfortunately did not translate into an
increased willingness to invest in improved storage, even though devices were
offered to AflaSTOP farmers at extremely subsidized prices based. Overall,
AflaSTOP farmers demonstrated a willingness to pay and purchase improved
storage devices in the surveys, but yet this did not translate into action, perhaps
due to interaction with a NGO versus a private sector entity. This paradox among
farmers can be seen clearly in Table 14 below, as almost all farmers indicate
they want to store maize in an improved storage device, but none indicate that
they will purchase and/or continue storing in the device they tested with
AflaSTOP, which begs the question on what kind of “improved device” they plan
to use.
result <
5ppb
> 5ppb but
<10ppb
result >
10ppb
The land does not have/is
not very much affected by
the fungus that causes
aflatoxin growth.
56.2%(n=27) 39.1% (n=9) 0.0% (n=0) 39.6% (n=36)
The land has the fungi that
causes aflatoxin growth and
should be treated/cleaned
41.7% (n=20) 56.5% (n=13) 100% (n=20) 58.2% (n=53)
Nothing 2.1% (n=1) 4.3% (n=1) 0.0% (n=0) 2.2% (n=2)
Total 100% (n=91)

36
Table 13: Inconsistencies in Farmers’ Willingness to Pay
How will the farmer store maize in future after receiving aflatoxin results?
PICs GrainSafe Metal silo Aggregate
Store maize in an improved storage device to prevent aflatoxin growth
97.5% (n=39)
89.7% (n=26) 75.0% (n=27) 87.6% (n=84)
Buy improved storage bags to store maize
0.0% (n=0) 0.0% (n=0) 5.6% (n=2) 1.9% (n=2)
Store maize in a GrainSafe to prevent aflatoxin growth
0.0% (n=0) 3.4% (n=1) 0.0% (n=0) 1.0% (n=1)
Continue storing maize in the improved storage device given by AflaSTOP
0.0% (n=0) 6.9% (n=2) 0.0% (n=0) 1.9% (n=2)
Store maize in a PICS Bag to prevent aflatoxin growth
2.5% (n=1) 0.0% (n=0) 2.8% (n=1) 1.9% (n=2)
Store maize in a Metal Silo to prevent aflatoxin growth
0.0% (n=0) 0.0% (n=0) 16.7% (n=6) 5.7% (n=6)
Total 100% (n=40) 100% (n=29) 100% (n=36) 100% (n=97)
With this in mind, the On-Farm survey data shows that farmers’ willingness to
pay varied from survey to survey as shown in Table 14 below, starting off much
low and then increasing somewhat in the last aflatoxin survey, but dealing
directly with PICS bags by the end and not any other device tested.
Table 14: Changes in Willingness to Pay across Surveys
Price Threshold Important Factors
Round 1 USD$1.00 For a device that addressed their insect issue
Round 3 USD$1.00 What they stated they could AFFORD to pay for 1
PICS bag after receiving their aflatoxin score. 14
farmers answered.
Round 3 USD$1.97 What they would pay if someone comes to their
farm to sell them PICS bags (i.e. low willingness to
go to agro-dealer). 92 farmers answered.

37
However, when asked to bid for their device in late 2015, only 14 farmers (11%)
made an initial offer to purchase their device from AflaSTOP. The balance were
either unwilling to make a bid (58%), which is explored further in Purchase of
Devices, or were undecided and or wanted more time (23%). Out of the 14
farmers who did bid on their device, 50% were PICS farmers and 43% were
metal silo farmers. Only 1 GrainSafe farmer made a bid for their device, which
could be related to its market cost. In addition, 71% of those who made a bid (10)
had been trained on how to use their device, versus the 29% who were untrained
and made a bid.
Table 15: When Asked to Bid on Their Device
# who Bid Median Bid Undecided Unwilling to Bid
PICS Bag 7 USD$1.00 16 23
GrainSafe 1 USD$30.00 7 28
Metal Silo 6 USD$3.33 (per
bag capacity)
8 25
TOTAL 14 31 76
*4 farmers also returned their device when asked to bid & 7 were not found.
However, out of the original 14 who made bids, only 8 of them actually
purchased their device, with another 4 returning their device. The 4 who returned
their devices were split evenly between PICS and metal silos, and most likely
returned their device since their bid was too low and not accepted as the final
subsidized price.
After AflaSTOP announced the price of each device since farmers struggled with
the bidding process, an additional 28 farmers eventually decided to purchase
their device bringing the total who paid in full to 36 by the end of August 2016,
and 17 partially paid. While 27 farmers paid in cash, 9 farmers purchased their
device in-kind with maize when the project bought the balance of maize in their
devices so that aflatoxin testing could be started. It was clear that cash
management was an issue for many farmers in terms of paying for the devices.
Farmers were expected to pay for the device when they had finished using them;
when farmers finished using the devices they had nothing to sell to buy the
devices.
In terms of AflaSTOP’s farmers paying for their device; 31% of farmers given
PICS bags paid $0.50 per bag, 29% of Metal Silo farmers paid $5/bag for their
silo (capacity of 2 to 6 bags), and 34% of GrainSafe Farmers had paid
$30/GrainSafe. In the case of the PICS bags given, the bag probably only lasts

38
two years – it represents 40% of its value, in the case of the metal silo this
payment represents around 30% of the value and in the case of the GrainSafe it
represents 15% of the value of the bag and does not include the frame. The
metal silo and the GrainSafe’s much higher price represent a lifespan value – i.e.
the product should last 10 maybe 15 years. However, the cost of buying into that
lifespan is prohibitive for most smallholder farmers.
27% of AflaSTOP farmers decided to pay for the devices they had tested
and18% paid twice the cost of a PICS bag before they received their aflatoxin
result. Conversely, in the surveys, 64% of farmers stated they would not buy
PICS bags to address their aflatoxin issues but actual work in the field with
farmers demonstrated that farmers want to address their storage problems.
Furthermore, they are currently not happy with the use of insecticide and they
worry about the health of their family (this is possibly related to the fact they know
they put ‘too much’ insecticide on their maize). This is exacerbated by the fact
that farmers also do not believe its effective; noting that after three months or so
they start seeing more insects.
F. Purchase of Devices
With regard to the purchase of their devices, farmers were made aware in the
local language from the beginning that the devices they were being given were
on loan, and that they would be given the option to purchase them at the
conclusion of the on-farm testing.9 Farmers were also made aware that they
were to take good care of their device while in their possession.
However, by Round 3 only 11 farmers out of the 108 queried (10%) indicated
that they had purchased the storage device they had been given by AflaSTOP.
The balance of farmers gave varying reasons for not purchasing, the two main
ones being related to cash availability to purchase and not understanding that the
device was given on loan, despite all farmers having signed loan agreements.
Specific answers are show below in Table 16.
Table 16: Why farmers declined to purchase their device
9 Exact wording from the loan agreement: “I understand that the device has been loaned to me and I will return them to ASI upon completion of the project which is when I finish storing maize in the device. I will be offered the option of purchasing the [device] at a price which will be determined and discussed with me later. I further understand that I am solely responsible for the device and will take good care of the device.

39
33% wanted
device for
free
Thought device was for demonstration purposes &
that is was free of charge
29% (31)
Did not have cash & wanted to be given device as
a reward for participation
4% (4)
27% had
cash issues
Did not have cash at time of payment but planning
to pay soon
17% (18)
Device was too expensive & could not afford 10% (11)
19% cited
poor
performance
of device
Device did not work well – weevils and/or mold
found
14% (15)
Device was attacked by rats 5% (5)
Device issues observed when devices were retrieved from farmers
After collection of PICS bags, which were returned, an inspection of every PICS
bag returned to AflaSTOP found that 46% of farmers returned bags with no
penetrating holes. However, counting all bags returned; 30% had on average 14
penetrating holes, with the maximum being 32. Only holes that went all the way
through both layers were counted, indicating that insects had penetrated the
bags and nullified its hermetic efficacy. 66% of bags had holes either on the
inside or outer layer but they did not penetrate; the highest number of holes on
the outside which did not result in penetration was 62, once the bag was
penetrated the number of insects trying to get through appears to have
increased, for instance one bag had 150 holes in the outer layer, 50 holes in the
inner layer and 20 holes penetrating both layers.
It is important to note that farmers are currently being told that the PICS bags last
up to three seasons. What is unknown is whether these bags will work at all
during the second season to control insects or aflatoxin increases if it has an
insect hole. It is possible that any holes and or damage to the PICS bags will
allow enough air flow that large numbers of insects could thrive around these
holes and cause significant damage to the farmer’s grain. It is also possible these
holes and the resulting smell of maize will attract rats. Further research should
look at what degree of penetration and damaged bags will work a second
season, and whether reversing the inner bag by 180 degrees (so there is now
one layer of plastic between the holes) or covering the holes with farm level
solutions (e.g. tape) would be sufficient to re-establish the hermetic nature of the
bags.

40
In terms of awareness and information about new technology, specifically
among Doers, 36% heard about PICS bags from farmers within the intervention
group, 20% from organized field days with the Ministry of Agriculture, and 28%
from farmer groups and government extension officers. 65% of Doers were
motivated to buy PICS due to a belief that no insecticide needs to be put on the
maize in a PICS bag and that the maize inside a PICS will not be damaged by
insects. For the Doers, 98% stated that the person that sold them the PICS also
trained them on how to use the device and 77% deemed this important to
operating the device correctly.
64% of Doers were given the contact for the local AflaSTOP representative from
an intervention farmer to purchase the PICS bags, but only 25% bought enough
for all of their maize with the majority of other farmers selling most of their maize
and therefore not needing a PICS bag to store it in.
78% of Doers used PICS bags to store maize for home consumption and 13
Doers have sold maize that they stored in PICS bags. There is anecdotal reports
that most of the farmers who sold maize from their PICS bags did so at a higher
price than the then market price. It is not clear whether the premium was
because it looked better quality, or because the buyer knew it was from a PICS
bag. 11 said they sold maize at a higher price, of those that reported where they
sold the maize, 5 sold this maize to their neighbors and only one sold to trader,
perhaps indicating a consumption preference for maize perceived to be “cleaner”
(i.e. no insecticides, no insects, and no aflatoxin).
G. Barrier Analysis
To be able to do good barrier analysis there needs to be sufficient numbers of
doers and non-doers, ideally with a minimum of about 45 per group. AflaSTOP
only sold 9 metal silos and 13 GrainSafes therefore AflaSTOP was left with the
PICS bags as the only scenario where there was a sufficiently large group of
farmers who had demonstrated a willing to pay the market price for the device
(commercial sales made in the same area as AflaSTOP’s farmers, and AflaSTOP
farmers who did not buy their PICs bags). In order to better understand why
certain farmers were more likely to adopt and invest in these bags, the project
conducted a barrier analysis, which identifies key beliefs and constraints that
either encourage or discourage farmers to invest in the bags. More details on the
Barrier Analysis Methodology & Analysis can be found in Annex D: Barrier
Analysis Methodology & Analysis.

41
1. Perceived Positive Consequences
One of the biggest barriers to investment in PICS bags in the Non Doer group
was found to be around the lack of perceived positive consequences and the lack
of value attributed to these consequences. Overall, Non-Doers did not value the
benefits of investing in and using the PICS bags sufficiently to ‘find’ the
disposable cash to buy them as compared to Doers.
Doers cited specific benefits that they associate with bag investment and use.
For instance, Doers were seven times more likely than Non-Doers to say that
PICS bags prevent damage from insects. They were two times more likely to say
that using PICS bags can lead to higher incomes (because there is more maize
to sell), and almost three times more likely to say that they save money on
pesticide purchases with the PICS bags. Doers were also almost four times more
likely than Non-Doers to say that maize stored in PICS bags is safer due to less
pesticide use. These responses suggest that Doers perceive greater benefits to
investing in and using PICS bags, beyond just aflatoxin prevention, which they
were not aware about.
Interestingly, Non-Doers were much more likely (8 times more likely) to highlight
prevention of aflatoxins as a benefit of the PICS bags. This finding would suggest
that since AflaSTOP’s training on the benefits of hermetic storage and aflatoxin
prevention were limited to farmers doing the testing – this will be a potentially
powerful message in the future for those already willing to adopt.
The findings suggest that certain positive benefits – pest prevention, lower
expenditures on pesticides, and perceived lower risk of pesticide poisoning,
resonate most with Doers; on the other hand, aflatoxin as a perceived positive
benefit may not resonate enough with Non-Doers. Emphasizing the additional
positive consequences of bags with Non-Doers through social and behavior
change communication (SBCC) messaging may be an effective way to
encourage them to adopt the behavior.
2. Perceived Negative Consequences
Perceived negative consequences highlight whether Doers or Non-Doers think
that there will be any negative ramifications of using or investing in PICS bags.
Doers were three times more likely to say that there are no negative
consequences to PICS bag investment and use; 75 percent of Doers were
unable to highlight a negative consequence, while only 35% of Non-Doers said
that there are no negative consequences.

42
Non-Doers were seven times more likely to perceive negative consequences of
using PICS bags, citing that if the bag does not work, there might be huge losses
of stored maize. Interestingly none of the Non Doers reported this failure when
they used the bags. In contrast, where Doers did cite negative perceived
ramifications of investment in bags, they worried that the device might be
damaged by rats, highlighting not a failure or mistrust of the bag itself, but a
concern that it could be ruined and its value lost.
These findings suggest that messaging highlighting the positive consequences
and addressing perceived negative consequences may be helpful in encouraging
Non-Doers to adopt PICS or other hermetic bags. Showing testimonials from
Doers who have used the bags and have not lost maize is one option; another
involves conducting closing and opening ceremonies where farmers can see the
results of storing maize in hermetic bags.
3. Perceived Social Norms
Social norms relate to whether the Doer or Non-Doer perceives that people
around him/her, such as family and friends, approve of the behavior. In this
instance, both Doers and Non-Doers stated that almost everyone approves of
them doing the behavior. However, Doers were much more likely to cite specific
groups who would approve of them doing the behavior: Doers were
approximately 4 times more likely to say spouses support investment in PICS
bags, 2 times more likely to say children support the behavior, and 12.3 times
more likely to say that neighbors and friends support the behavior.
This finding suggests that, while Doers and Non-Doers both feel that their social
groups support the behavior, Doers may have more specific and vocal support
from spouses, family, and friends. The private sector and other projects might
consider working with influencing groups, such as spouses, community leaders,
and friends in the community to educate them on the benefits of using PICS
bags, and to ensure that they support both Doers and Non-Doers in adopting the
behavior.
4. Perceived Self Efficacy
Doers and Non-Doers alike were asked whether they felt they could do the
behavior. All reported that they had the knowledge and resources that they need
to invest in PICS bags. However, Doers and Non-Doers responded differently
when asked what might make it easier for them to do the behavior. Doers were
11 times more likely to suggest that it would be easier for them to invest in PICS
bags if they were able to make more money, whereas Non-Doers were
approximately seventy times more likely to cite that they could invest if the price

43
of bags were lower (with 86% of Non-Doers reporting this response, and 0% of
Doers.
On the surface, these answers seem similar, but they may reflect a difference in
attitude between Doers and Non-Doers regarding the value of the bags. Doers
would like to have more money in order to buy the bags; Non-Doers, on the other
hand, want the cost of the bags to be lower, suggesting that they are perceiving a
disconnect between cost and value.
In terms of private sector strategies to market hermetic bags it will be important
to;
Support demonstrations showing how to set up the bags, and how they work
over time
Target advertising campaigns which promote the value of the bag
Time the advertising campaigns
5. Perceptions and Outlook of Farmers
Of the 44 “Doers” surveyed in the Barrier Analysis survey (i.e. those that had
access to cash to purchase PICS bags but were not part of the AflaSTOP
intervention group), 84% would be happy for their children to become farmers
and 70% believed that there was room for farmers to improve. 73% agreed
strongly that there was no better investment than farming with 67% stating that
they would still be a full-time farmer given the choice. While opinion was split
fairly evenly over whether God meant them to be a farmer, 86% were proud to be
a farmer and nearly all “Doers” surveyed (98%) agreed that any farm method that
saves time was worth paying for.
Conversely, AflaSTOP Non Doer farmers were a bit more pessimistic – these
were the farmers who had been able or chose not to invest a quarter of the cost
of the PICS bag, as shown below in yellow and blue. Overall, more AflaSTOP
farmers expressed a desire that their children not end up as farmers versus their
Doer counterparts, and were also less hopeful about their prospects for
improvement. While these farmers only represent a small segment of the local
population, these differences in attitudes have important implications both in
terms of farming prospects and for the marketing of new agricultural technologies
to farmers in these areas.
Table 17: General Outlook of AflaSTOP Farmers vs. “Doers”

44
AflaSTOP Farmers
(118)
“Doers” (44)
Agree
Strongly
Disagree
Strongly
Agree
Strongly
Disagree
Strongly
I would prefer if my children
don’t end up working as
farmers
31% 58% 9% 84%
There is no hope for poor
farmers to improve 26% 40% 7% 70%
If I had a choice I would not be
a full time farmer 5% 70% 7% 67%
There is no better investment
than farming 75% 4% 73% 5%
God meant me to be a
farmer/it is my destiny to be a
farmer.
58% 22% 43% 45%
I am proud to be a farmer 88% 3% 86% 7%
Any farm method that saves
time is worth paying for 94% 0% 98% 2%

45
VII. Specific Analysis
A. Consumption Habits
Through AflaSTOP’s survey data, the project attempted to decipher how much
an average family eats when they have maize and what coping strategies they
employ when they do not have maize, such as dropping a meal or reducing
portion sizes. In this regard in Round 1, while a large portion of farmers sell
maize at some point and/or give away maize, almost all farmers keep the maize
they grow for household consumption. On average, the maize kept for household
consumption and the maize donated stays constant from year to year, but what
does vary is the amount of maize that is sold immediately and sold later. This
may mean that households prioritize a certain level of household consumption,
and sell whatever remains above and beyond this. More specifically, data from
Round 1 showed that average maize consumption for adults was about 2.79kg
per week, as compared to children who consumed 1.83kg per week. However,
out of 103 data points (others were discarded due to inconsistency), almost a half
seem to have a very poor idea about their consumption needs and/or had trouble
quantifying it accurately.
In Round 2, a majority of farmers (72%) stated that they removed maize on a
weekly basis to cater for approximately 10 meals of maize a week and even
though they had finished their previous maize stocks at the time of the survey,
99% indicated that they were still consuming maize. 65% of farmers stated that
they were eating the same amount of maize as when they had their own stocks,
but 35% had reduced their consumption and replaced it with other food sources,
and were mostly purchasing foodstuffs from the market while they waited for their
next harvest.
While a large portion of Round 2 farmers (72) answered that their stored maize
met their needs and that they did not sell any or purchase from the market – this
did not match the data collected monthly which noted only 20% still had maize in
their stores prior to the next harvest. In fact on average a farmer stored for 4.5
months, twice a year. For those who it did not, 30% sold maize to cater for cash
needs such as paying school fees, or farm and household inputs and
improvements. Of the 35 farmers (33%) from the overall survey who were eating
less maize, 95% were eating rice instead, followed by wheat flour/chapatti and
cooked bananas, which are all more expensive than maize, demonstrating that
when intervention farmers to the market, they choose to spend their limited cash
on alternative and more expensive products.

46
A smaller portion of female farmers (19) who were queried in two focus group
discussions after the post-test survey on the topic of household consumption
indicated that they no longer reduce intake and/or drop a meal when they run out
of maize. Instead, farmers purchase from the market, borrow from a neighbor, or
cook other foods like rice or cassava instead of reducing intake.
B. Willingness to Pay for Aflatoxin Testing in Meru & Makueni
AflaSTOP had 300 test strips left over from the testing of the aflatoxin samples,
and the project decided to use these strips to gauge farmer willingness to pay for
aflatoxin testing, given that one of the key constraints to addressing aflatoxin
contamination is that farmers do not know whether they have an aflatoxin problem
or not. Partnering with the Ministry of Agriculture, the AflaSTOP Team went to
Meru and Makueni with aflatoxin testing equipment and lab technicians, and met
with farmers who had brought two handfuls of maize flour with them. We first
discussed the issues around aflatoxin and then asked them to individually answer
a few questions, including whether they still wanted their maize tested and how
much they would be willing to pay. Once we had all the amounts that they were
willing to pay, we chose the median price, and any farmer could have their maize
tested for that price.
After the price for testing was explained, and why we were testing for aflatoxin,
around 70% of farmers still wanted to have their maize tested in Meru and
Makueni and of the farmers who did not want to test their maize, 50% state that
they were scared to learn the result. For those farmers who were willing to pay to
test their maize, 73% in Meru believed that aflatoxin killed, whereas only 48% of
those in Makueni had the same fear. However, 10% of farmers in Makueni knew
someone who had died from aflatoxin, which was not an issue mentioned by
farmers in Meru.

47
The majority of farmers who wanted to test their maize did so because they
wanted to know that their food was safe for their families (86% in Makueni and
92% in Meru, respectively). If found to be contaminated, 82% said they would
destroy their maize if contaminated, which seems unlikely due to the fact that this
could be a significant amount of maize for home consumption and or later sales.
Alternatively, around 3% said they would donate it and 5% of Makueni farmers and
1% of Meru farmers said they would sell it.
Interestingly, 100% of farmers in Meru paid the median price meaning that those
who had bid lower were prepared to pay more, and 83% stated that they would
test their maize again in the future. The price paid for testing in Makueni was
US$0.40 per test and in Meru was US$1.00 per test. More details on farmer
responses to testing their maize can be found in Annex F: Willingness to Pay
for Aflatoxin Testing in Meru & Makueni (2016).
This exercise was repeated in 2017 with similar findings. See Annex E:
Willingness to Pay for Aflatoxin Testing in Meru & Makueni (2017).
C. Prevalence of Aflatoxin at the Smallholder Level in Makueni
and Meru (2014 to 2016)
AflaSTOP has collected data of aflatoxin levels in smallholder farmer’s maize in Makueni and Meru over the last three years. The table below summarizes the number of samples found at different aflatoxin contamination levels.
05
101520253035404550
Figure 5: Range of prices that farmers were willing to pay to test their maize for Aflatoxin
Makueni Meru

48
AflaSTOPs earlier key findings were:
Aflatoxin levels increased 92% per month in polypropylene (PP) bags in
Makueni and 24% per month in Meru (PP bags being the normal way
smallholder farmers store their maize).
Hermetic storage significantly arrests the increase of aflatoxin to under 5%
per month
Given this background and the rates indicated above, it is possible to hypothesize
that the following could occur during storage in 2016 if the same rate of aflatoxin
growth continues:
After 6 months of storage in PP bags 99% of samples in Makueni could
have aflatoxin levels above 10ppb and 28% above 150ppb, whereas if the
maize had been stored in a hermetic bag such as a PICS, potentially only
47% of the samples would be above 10ppb (an 8% increase on the
baseline level found in 2016 in the table above) and only 6% would have
been above 150ppb (a 3% increase on the baseline).
After 6 months of storage in PP bags 50% of samples in Meru could have
aflatoxin levels above 10ppb and 8% above 150ppb, whereas if the maize
had been stored in a hermetic bag such as a PICS, potentially only 25%
would be above 10ppb (an increase of 2%) and only 6% above 150ppb (an
increase of 3%).
Consequently, it is clear that hermetic storage should be promoted as a method,
which allows farmers to store their maize more safely, for a longer period of time. It
does not remove the problem, but it will arrest the problem.
Table 18: Prevalence of Aflatoxin in Samples Collected from
Smallholders in Eastern Province
Makueni Meru
Ppb Above 10 Above 150 Above 10 Above 150
2014 74% 35% 75% 61%
2015 21% 4% ** **
2016 39% 3.45% 23% 2.56%
** AflaSTOP did not operate in Meru in 2015

49
VIII. Annex A: Visuals of Devices Tested
PICS BAG, 90kg capacity
GrainPro GrainSafe Bag, 1000kg capacity
Artisan Metal Silo, capacity varies by farmer (approximately 180 – 720kg)

50
IX. Annex B: Effective Device Performance Criteria Used
Device Criteria Grading
System
All Did the device control aflatoxin increases as well
as performance in Off Farm Testing
Did the device control insect damage to levels
below 0.05% per month
Did the device control discolouration as well as Off
Farm results
Did the device control other grading parameters as
well as Fff Farm results
PICS Bag Was it properly sealed?
If No, explain.
Are there any signs of rat damage?
If yes, explain.
Additional Enumerator Observations
Metal Silo Was the lid firmly on?
If No, explain.
Was the round strip around the lid properly
placed?
If No, explain.
Was the outlet firmly on?
If No, explain.
Was the strip around the outlet properly placed?
If No, explain.
Additional Enumerator Observations
GrainSafe Is the GrainSafe properly placed on a frame?
If No, explain.
Is the GrainSafe touching the walls of the store at
all?
If No, explain.
Is the top sealed?
If No, explain.
Is the outlet properly sealed?
If No, explain.
Additional Enumerator Observations

51
X. Annex C: Farmer Participation by Survey
Pre-Test
Survey
Round 1
Device
Distribution
Monthly Surveys Post-Test Survey
Round 2
Aflatoxin
Survey
Round 3
Barrier
Analysis
Survey
175 132 Minimum of 29 to maximum
of 112
120 108 44 Doers; 36
Non-Doers
NOTES
150 were
intervention
farmers & 25
represent a
control
group
Despite
distributing
132
devices,
only 122
farmers
actually
used their
device.
Participation fluctuated based
on the following: 1. Some
farmers did not have any
maize to store in their device
until the 2nd harvest;
2. In the later months, some
farmers had already used all
their maize and their storage
device was empty;
3. Occasionally, AflaSTOP
staff and the farmer’s
schedule did not lineup with
the day of the monthly visit.
While 132 farmers
received devices, 10
farmers did not store
any maize in their
device mostly due to
lack of having
anything to store
after selling their
maize. Out of this
122, 14 records
were cut during data
cleaning due to data
inconsistencies.
The number
above is
discounted for
a total of 14
farmers who
stored maize
late and only
received their
results at the
end of June
2016, as well
as for farmers
who indicated
that they did
not use their
device in the
post-test
survey.
The Doers were
from outside the
AflaSTOP
intervention
group but in the
same area, while
the Non-Doers
were PICS
farmers who
declined to
purchase their
device at the
end of the
testing period.
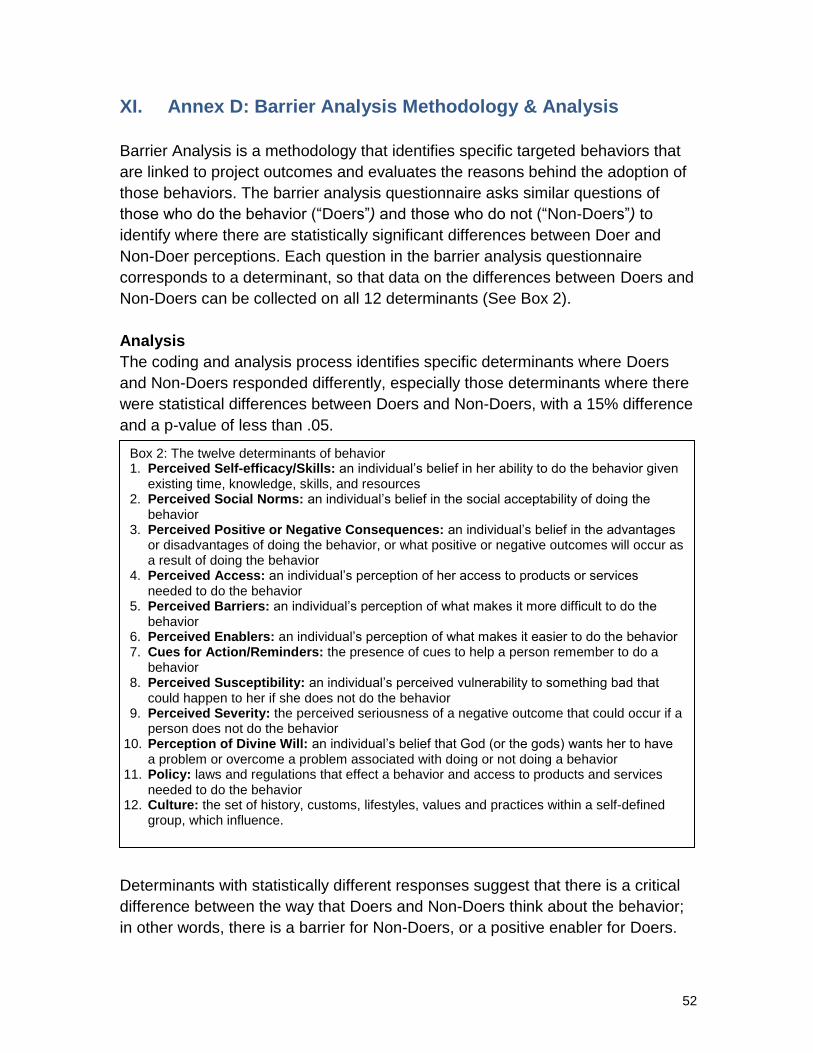
52
XI. Annex D: Barrier Analysis Methodology & Analysis
Barrier Analysis is a methodology that identifies specific targeted behaviors that
are linked to project outcomes and evaluates the reasons behind the adoption of
those behaviors. The barrier analysis questionnaire asks similar questions of
those who do the behavior (“Doers”) and those who do not (“Non-Doers”) to
identify where there are statistically significant differences between Doer and
Non-Doer perceptions. Each question in the barrier analysis questionnaire
corresponds to a determinant, so that data on the differences between Doers and
Non-Doers can be collected on all 12 determinants (See Box 2).
Analysis
The coding and analysis process identifies specific determinants where Doers
and Non-Doers responded differently, especially those determinants where there
were statistical differences between Doers and Non-Doers, with a 15% difference
and a p-value of less than .05.
Determinants with statistically different responses suggest that there is a critical
difference between the way that Doers and Non-Doers think about the behavior;
in other words, there is a barrier for Non-Doers, or a positive enabler for Doers.
Box 2: The twelve determinants of behavior 1. Perceived Self-efficacy/Skills: an individual’s belief in her ability to do the behavior given
existing time, knowledge, skills, and resources 2. Perceived Social Norms: an individual’s belief in the social acceptability of doing the
behavior 3. Perceived Positive or Negative Consequences: an individual’s belief in the advantages
or disadvantages of doing the behavior, or what positive or negative outcomes will occur as a result of doing the behavior
4. Perceived Access: an individual’s perception of her access to products or services needed to do the behavior
5. Perceived Barriers: an individual’s perception of what makes it more difficult to do the behavior
6. Perceived Enablers: an individual’s perception of what makes it easier to do the behavior 7. Cues for Action/Reminders: the presence of cues to help a person remember to do a
behavior 8. Perceived Susceptibility: an individual’s perceived vulnerability to something bad that
could happen to her if she does not do the behavior 9. Perceived Severity: the perceived seriousness of a negative outcome that could occur if a
person does not do the behavior 10. Perception of Divine Will: an individual’s belief that God (or the gods) wants her to have
a problem or overcome a problem associated with doing or not doing a behavior 11. Policy: laws and regulations that effect a behavior and access to products and services
needed to do the behavior 12. Culture: the set of history, customs, lifestyles, values and practices within a self-defined
group, which influence.

53
In Barrier Analysis methodology, identifying and understanding these barriers is
the first step to designing activities that can effectively improve behavior
adoption.
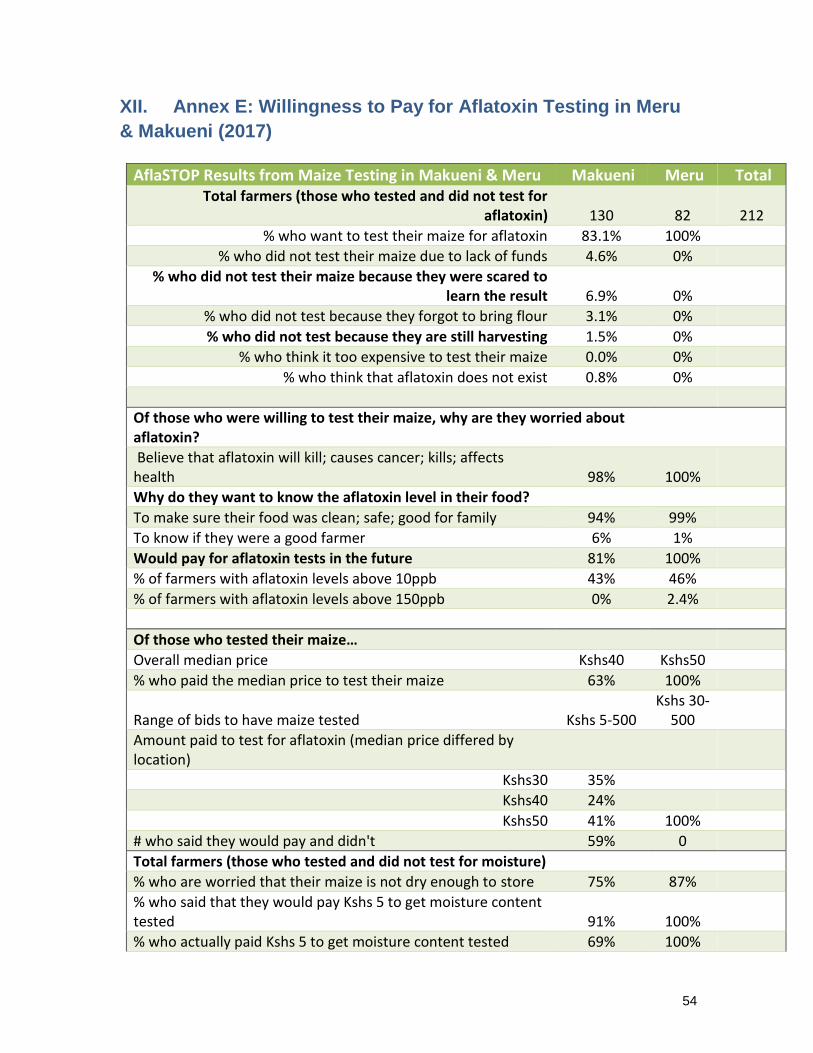
54
XII. Annex E: Willingness to Pay for Aflatoxin Testing in Meru
& Makueni (2017)
AflaSTOP Results from Maize Testing in Makueni & Meru Makueni Meru Total Total farmers (those who tested and did not test for
aflatoxin) 130 82 212
% who want to test their maize for aflatoxin 83.1% 100% % who did not test their maize due to lack of funds 4.6% 0%
% who did not test their maize because they were scared to learn the result 6.9% 0%
% who did not test because they forgot to bring flour 3.1% 0% % who did not test because they are still harvesting 1.5% 0%
% who think it too expensive to test their maize 0.0% 0% % who think that aflatoxin does not exist 0.8% 0%
Of those who were willing to test their maize, why are they worried about aflatoxin?
Believe that aflatoxin will kill; causes cancer; kills; affects health 98% 100% Why do they want to know the aflatoxin level in their food? To make sure their food was clean; safe; good for family 94% 99% To know if they were a good farmer 6% 1% Would pay for aflatoxin tests in the future 81% 100% % of farmers with aflatoxin levels above 10ppb 43% 46% % of farmers with aflatoxin levels above 150ppb 0% 2.4%
Of those who tested their maize…
Overall median price Kshs40 Kshs50
% who paid the median price to test their maize 63% 100%
Range of bids to have maize tested Kshs 5-500 Kshs 30-
500
Amount paid to test for aflatoxin (median price differed by location)
Kshs30 35%
Kshs40 24%
Kshs50 41% 100%
# who said they would pay and didn't 59% 0
Total farmers (those who tested and did not test for moisture)
% who are worried that their maize is not dry enough to store 75% 87%
% who said that they would pay Kshs 5 to get moisture content tested 91% 100%
% who actually paid Kshs 5 to get moisture content tested 69% 100%

55
Avg. Moisture Level 14.91% 15.05%
Interest in moisture cards % who indicated they would be willing to buy a moisture card 88% 100% % who were not willing to pay because they thought it should be free 8% % who were not willing to pay because they did not trust the card 4% Range of bids to buy a moisture card Kshs 10-100 Kshs 10-100
Overall median price Kshs20 Kshs20 % who bid the median price or more* 57% 45% # of farmers paid the median price for a moisture card 23 54 % who paid the median price for a moisture card, when available 34% 98% # who said they would pay and didn't* 44 1
*Moisture cards were not available in all survey locations in
Meru & Makueni

56
XIII. Annex F: Willingness to Pay for Aflatoxin Testing in Meru &
Makueni (2016)
AflaSTOP Results from Maize Testing in Makueni & Meru
Makueni Meru Total Total farmers (those who tested and did not test) 190 108 298
% who want to test their maize for aflatoxin 70% 72.2%
% who did not test their maize due to lack of funds 28.1% 36.7%
% who tested their maize and were scared to learn the result 50.9% 50%
% who did not test because they forgot to bring flour 10.5% 13.3%
% who do not want to destroy their maize if it registers higher than 10ppb for aflatoxin 3.5%
% who think it too expensive to test their maize 5.3%
% who think that aflatoxin does not exist 1.8%
Of the farmers who decided to pay and test their maize… 133 78 211
% who believe that aflatoxin will kill 47.7% 73.1%
% who believe that it causes cancer 18.2% 11.6%
% who believe aflatoxin affects your health 18.9% 15.4%
% who are not worried about aflatoxin in their maize 3.0%
% who believe that it causes cancer and death 2.3%
% who knew people who had died from aflatoxin poisoning 9.85%
% who tested their maize because they wanted to know that their food was safe to eat 85.6% 92.3%
% who wanted to know in order to take precautions & avoid eating contaminated maize 3.0% 7.7%
% who wanted to know for health reasons 6.8%
% who were simply curious 3.0%
% who said they would destroy/burn contaminated maize 81.8% 82.1%
% who will decide later what to with contaminated maize 6.1% 7.7%
% who will not eat contaminated maize 0% 6.4%
% who will donate contaminated maize 3.0% 2.6%
% who will sell contaminated maize 4.5% 1.3%
% who will mix contaminated maize with good maize 1.5%
% who will burn contaminated maize only if compensated 1.5%
% who will eat contaminated maize anyway 1.5%
% who will test their maize again 86% 83%
% who would rather not know the aflatoxin contamination level of their maize in the future 10% 14%
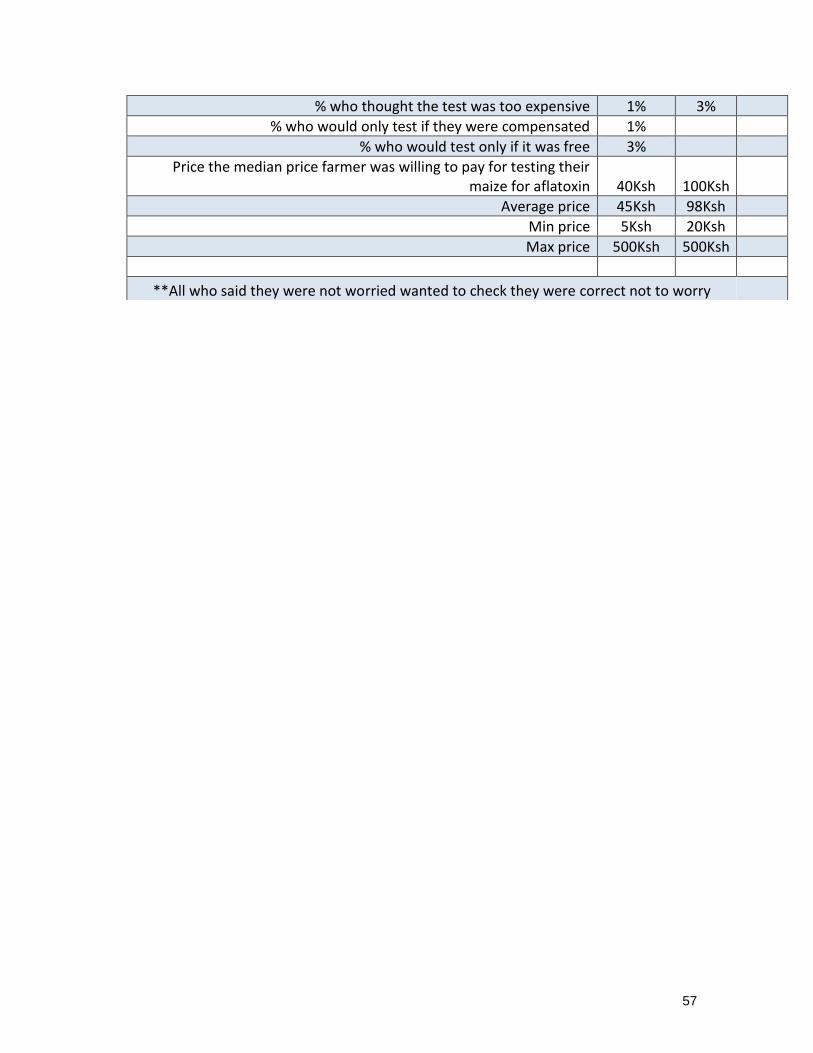
57
% who thought the test was too expensive 1% 3%
% who would only test if they were compensated 1%
% who would test only if it was free 3%
Price the median price farmer was willing to pay for testing their maize for aflatoxin 40Ksh 100Ksh
Average price 45Ksh 98Ksh
Min price 5Ksh 20Ksh
Max price 500Ksh 500Ksh
**All who said they were not worried wanted to check they were correct not to worry