Embed Size (px)
Citation preview
Brigham Young University Brigham Young University
BYU ScholarsArchive BYU ScholarsArchive
Faculty Publications
2010-01-01
AFM Study of Structural Changes in Supported Planar DPPC AFM Study of Structural Changes in Supported Planar DPPC
Bilayers Containing General Anesthetic Isofluorane (Plus Bilayers Containing General Anesthetic Isofluorane (Plus
Additional AFM Experiments) Additional AFM Experiments)
Chad McKell [email protected]
Hiram Conley
David D. Busath [email protected]
Follow this and additional works at: https://scholarsarchive.byu.edu/facpub
Part of the Cell and Developmental Biology Commons, and the Physiology Commons
BYU ScholarsArchive Citation BYU ScholarsArchive Citation McKell, Chad; Conley, Hiram; and Busath, David D., "AFM Study of Structural Changes in Supported Planar DPPC Bilayers Containing General Anesthetic Isofluorane (Plus Additional AFM Experiments)" (2010). Faculty Publications. 827. https://scholarsarchive.byu.edu/facpub/827
This Peer-Reviewed Article is brought to you for free and open access by BYU ScholarsArchive. It has been accepted for inclusion in Faculty Publications by an authorized administrator of BYU ScholarsArchive. For more information, please contact [email protected], [email protected].

McKell et al BYU Repository 1‐10
1
AFM study of structural changes in supported planar DPPC bilayers containing general anesthetic isofluorane (plus additional AFM experiments)
Chad McKell1, Hiram Conley2, and David Busath1
1Department of Physiology and Developmental Biology, Brigham Young University, Provo, Utah
2Department of Physics and Astronomy, Brigham Young University, Provo, Utah
Received 06 February 2010 Introduction Atomic force microscopy (AFM) is a remarkable tool for assessing the structural properties of supported lipid planar bilayers under different physiological conditions. Previous work has shown that incorporation of anesthetics into artificial lipid bilayers results in domain formation [1], destruction of lipid aggregates and patches [2], anesthetic-lipid mixed micelle formation [2], and the development of interdigitated phases of reduced thickness compared to anesthetic-free bilayers [3]. In particular, these interdigitated phases are suspected to affect the structure and activity of membrane proteins, such as ion channels, and thus further research with protein-embedded bilayers exposed to anesthetics could reveal the mechanism responsible for disrupting action potentials. In this study, we inspect the effect of the general anesthetic isofluorane, a drug used widely by physicians to induce anesthesia in patients, on supported dipalmitoylphophatidylcholine (DPPC) planar bilayers using AFM. Bilayers were formed using the vesicle fusion method and imaged with Pico AFM. Following the results section, we continue with a section dedicated to highlights from previous AFM experiments in the lab. Specifically, we look at studies of calibration gratings, anesthetic-free lipid bilayers, and cholera toxin B-oligomers on mica or DPPC/GM1 bilayers, all of which were imaged with Multimode AFM. The report ends with a discussion of the isofluorane study, of future AFM experiments likely to be conducted, and of foreseeable outcomes relating to these upcoming projects. Methodology Mica Stack To prepare the mica-Teflon-puck stack, first glue a clean disk of Teflon onto a clean metal puck (use acetone to clean). Press firmly enough on the stack to allow for a proper stick, but not too hard that the adhesive oozes out between the stack. Once you have allowed the adhesive to dry, glue a square piece of mica onto the Teflon-puck stack, following the same instructions as before. For easier mounting, use the wooden block with the plastic top provided in the Multimode AFM lab (it has the clever title, “This is not a piece of art! Please do not display.”). Although the manual advises against its use, Superglue is the adhesive of choice and is provided in the Multimode AFM lab. The manual suggests using Master Bond EP21LV or EP21AR instead, but Superglue has worked well for us so far. However, be sure to clean off any residual dry glue on the Teflon with acetone in order to maintain the hydrophobicity of the Teflon, and thus decrease the risk of fluid spillage onto the AFM piezo. Lipid Bilayer To make the DPPC solution used in the vesicle fusion technique, first pipette 200-600 µL of 10 mg/mL DPPC: Chloroform (provided in the -20 ºC freezer of the Biophysics Great Lab) into a long test tube. Evaporate the

McKell et al BYU Repository 1‐10
2
chloroform with a gentle stream of N2 gas by rotating the test tube around its long axis and while holding the N2 gas pipette no further than one-half of the way down the tube (holding the pipette away from the lipid will prevent contamination of the lipid). After the chloroform has completely evaporated, you should have a thin film of DPPC on the bottom end of the tube. Next, insert ddH20 (the same amount of ddH20 as you extracted of the10 mg/mL DPPC: Chloroform solution before) to create a 10-mg/mL DPPC: ddH20 mixture. Cover the tube with parafilm and vortex it for about 5 minutes. Next, freeze, thaw, and sonicate the lipid-water mixture, sonicating for approximately 3-5 minutes each time. Repeat this process three times. (Note that liquid nitrogen is provided next to Dr. Busath's office for freezing). The final lipid product should be a slightly foggy, clear solution with no particulate matter. Label the tube “10 mg/mL DPPC: ddH20” with your name and the date. Store the tube in the chemical room refrigerator by the AFM lab. The following procedure is known as the vesicle fusion method for constructing supported planar DPPC bilayers: On the day of imaging, first sonicate the DPPC-ddH20 mixture for 5-8 minutes, and then pipette 10 µL of the mixture onto the mica. Let the sample incubate for about 10 minutes before rinsing it 2-3 times with about 200 µL of sodium phosphate buffer (20-150 mM Na2P04). (As a side note, we suspect that a higher molarity of buffer may increase the electrostatic repulsion of the sample-probe interface). After rinsing, put a large bubble (300-500 µL) of buffer onto the mica and let incubate for 20-60 minutes (we usually prefer 30 minutes). Then, after incubating, rinse 1-2 times before imaging. (Note: a nine-step list is available in the drawer of the AFM Multimode lab that also covers this procedure. You can use that as a reference). Sodium Phosphate Buffer To make sodium phosphate buffer, you can use monosodium phosphate as your acid and disodium phosphate as your base. Step-by-step directions for making the buffer are available on the Internet. In the isofluorane study, we used 80 mM sodium phosphate buffer in all cases. For all other AFM experiments, we used between 20 and 150 mM sodium phosphate (Na2P04) buffer. Isofluorane Set-up Before imaging, make a solution of saturated 15 mM isofluorane solution in sodium phosphate buffer (20-150 mM Na2P04). To accomplish this, combine 1 mL pure isofluorane (available in the Biophysics Great Lab) with 49 mL buffer in a 50 mL air-tight test tube and let incubate overnight. The following day you should have a small amount of pure isofluorane at the bottom of the tube in equilibrium with 15 mM isofluorane above it. In this study, we only used 15 mM isofluorane for our experiments; however, smaller concentrations of isofluorane are more relevant since 0.3 mM isofluorane is the concentration used by physicians. Thus, our current study is merely a test of principle. To make smaller concentrations, simply dilute the 15 mM isofluorane with buffer; however, be sure to use the same type and molarity of buffer in all experiments or it will confound your comparisons. Once the isofluorane-buffer solution is prepared, it can be used for imaging. Both the Multimode and Pico AFM models are capable of exchanging fluids during imaging; however, the Pico model may be easier for beginners (assuming access to the Pico AFM is granted). In this study, we used the Pico AFM and the equipment available for imaging in fluids. We inserted 15 mM isofluorane into the fluid chamber with a 5 mL plastic syringe at one end and withdrew the solution in the fluid chamber (either a solution of pure sodium phosphate buffer or a mixture of buffer and 15 mM isofluorane solution) with a 5 mL plastic syringe at the other end. To ensure a tight seal between the feeding tube and the syringe, we wrapped the syringe-tube junction with parafilm. During drug insertion in the second experiment, we exchanged 5-6 mL of 15 mM isofluorane for 5-6 mL of buffer/isofluorane-buffer mixture in order to create a close to pure environment of 15 mM isofluorane. All scans were performed in tapping mode with single-beam tips of spring constant 0.06 nN/m and under room temperature. (Note: the additional AFM experiments presented after the results section used tips of spring constant 0.06 or 0.12 nN/m).
McKell et al BYU Repository 1‐10
3
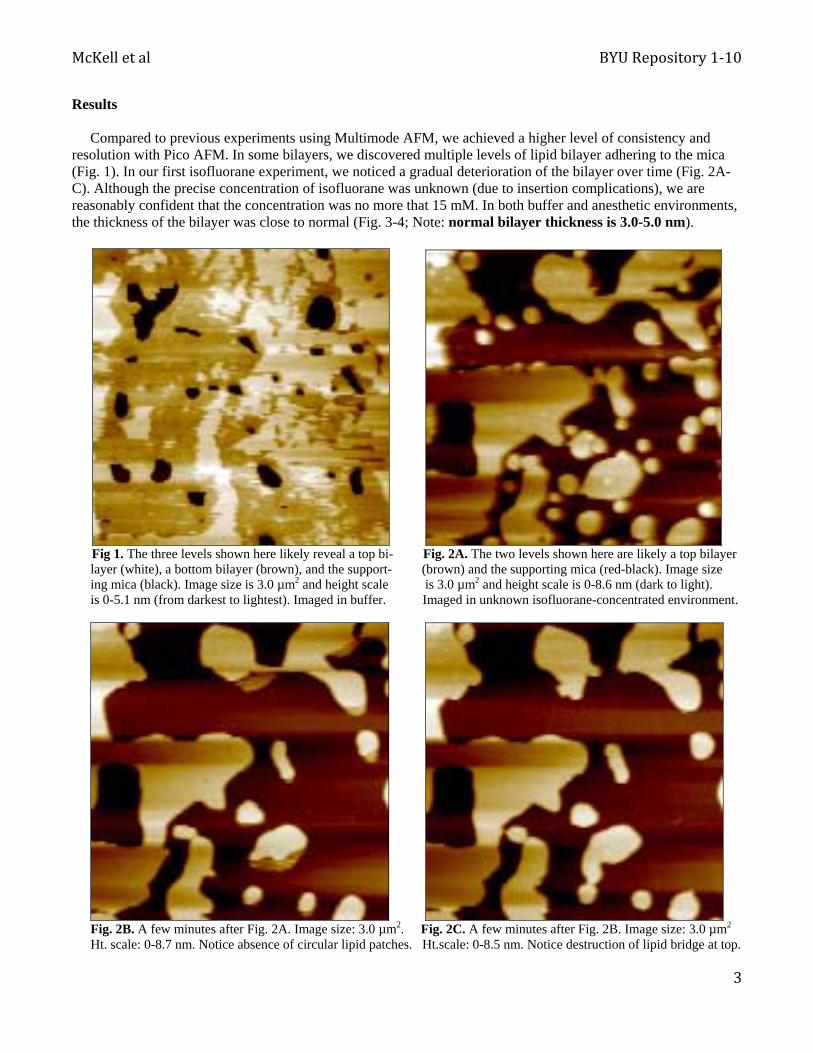
Results Compared to previous experiments using Multimode AFM, we achieved a higher level of consistency and resolution with Pico AFM. In some bilayers, we discovered multiple levels of lipid bilayer adhering to the mica (Fig. 1). In our first isofluorane experiment, we noticed a gradual deterioration of the bilayer over time (Fig. 2A-C). Although the precise concentration of isofluorane was unknown (due to insertion complications), we are reasonably confident that the concentration was no more that 15 mM. In both buffer and anesthetic environments, the thickness of the bilayer was close to normal (Fig. 3-4; Note: normal bilayer thickness is 3.0-5.0 nm).
Fig 1. The three levels shown here likely reveal a top bi- Fig. 2A. The two levels shown here are likely a top bilayer
layer (white), a bottom bilayer (brown), and the support- (brown) and the supporting mica (red-black). Image size ing mica (black). Image size is 3.0 µm2 and height scale is 3.0 µm2 and height scale is 0-8.6 nm (dark to light). is 0-5.1 nm (from darkest to lightest). Imaged in buffer. Imaged in unknown isofluorane-concentrated environment.
Fig. 2B. A few minutes after Fig. 2A. Image size: 3.0 µm2. Fig. 2C. A few minutes after Fig. 2B. Image size: 3.0 µm2 Ht. scale: 0-8.7 nm. Notice absence of circular lipid patches. Ht.scale: 0-8.5 nm. Notice destruction of lipid bridge at top.

McKell et al BYU Repository 1‐10
4
Fig 3. Height measurement for Fig. 1. The blue line represents a cross-section in the top portion of the image. The difference in height between the blue and red markers is 0.0034 µm (3.4 nm), as indicated by “Delta(x,y) (187.500, 0.0034)” in the upper right of the figure.
Fig 4. Height measurement for Fig. 2C. The blue line represents a cross-section in the top portion of the image. Difference in height between the blue and red markers is 0.0049 µm (4.9 nm).
In a subsequent experiment, we first imaged the bilayer in pure 80 mM sodium phosphate buffer before inserting isofluorane into the fluid chamber. In this control environment, we discovered an interesting adsorption of lipid to the mica: portions of ordered bilayer fused to the mica together with disordered portions (Fig. 5A). The disordered portions appear as clusters of circles (dark brown) embedded within the bilayer (light brown). Moreover, lines indicating the junction of different bilayers are also apparent in the image (see ordered portions of Fig. 5A). We measured the distance between the top bilayer (light brown) and bottom surface (black) to be about 4.1 nm (Fig. 6A). After inserting 15 mM isofluorane into the Pico fluid chamber, the black holes in the bilayer were filled in with more of this disordered phase (Fig. 5B). Although force-distance measurements would need to be completed in order to verify the type of substance composing each layer, we believe these disordered portions to be either segments of lipid monolayer or some form of protein aggregate. Height measurements indicate that the distance between the top bilayer (light brown) and bottom surface (black) is roughly 1.3 nm (Fig. 6B). At this point, we are unable to conclude whether the black portions in Fig. 5B represent mica, lipid, protein aggregate, or simply an accumulation of the isofluorane that was added to the chamber. However, due to the dramatic decrease in membrane thickness (i.e. from 4.1 nm to 1.3 nm), these black segments are most likely not mica. Instead, we have speculated that the isofluorane caused the bilayer to thin and subsequently fill in the original holes with monolayers or protein. However, the high level of noise in the cross sections (Fig. 6) may indicate that our height measurements are inaccurate. To resolve this uncertainty, cleaner cross sections must also be obtained.

McKell et al BYU Repository 1‐10
5
Fig 5A. Supported DPPC bilayer in 80 mM buffer at t = 0 Fig. 5B. Supported DPPC bilayer in 15 mM isofluorane min. Image size is 3.0 µm2 and height scale is 0-22 nm. solution at t = 26 min. Image size and height scale is same.
Fig 6A. Height measurement for Fig. 5A. The blue line represents a cross-section in the middle portion of the image. Difference in height between the blue and red markers is 0.0041 µm (4.1 nm).
Fig 6B. Height measurement for Fig. 5B. The blue line represents a cross-section in the middle
portion of the image. Difference in height between the blue and red markers is 0.0013 µm (1.3 nm).

McKell et al BYU Repository 1‐10
6
Additional AFM Experiments Calibration Grating A common control specimen used to assess of one’s own imaging ability as well as the condition of the AFM instrument is a calibration grating. A calibration grating is a small, gold-plated chip (about one square centimeter in size) with a recurring pattern of perpendicular, intersecting lines each separated by one micron. Multimode AFM consistently produces high-quality images of calibration gratings. In our studies, the grating pattern was clearly resolved along with small bumps of metal in between each calibration line (Fig. 7-9). Figure 7B shows the same calibration grating as in Figure 7A (imaged in height mode), but presented in a different imaging mode known as deflection mode (DM). As proven in Figs. 8-9, deflection mode is capable of nanometer resolution.
Fig. 7A. Calibration grating imaged in height mode. Fig. 7B. Calibration grating imaged in deflection mode. Image size is 6.0 µm2 and height scale is 0-30 nm. Image size is 6.0 µm2.
Fig 8. Calibration grating (DM). Image size is 634 nm2. Fig 9. Calibration grating (DM). Image size is 500 nm2.

McKell et al BYU Repository 1‐10
7
Pure Lipid Bilayers Before surmounting more difficult bilayer experiments (e.g. bilayers with anesthetics or proteins added), we first imaged pure lipid bilayers in Na2P04 buffer solution. As attested by the images below, Multimode AFM is capable of high resolution (Fig. 10-11) and moderate stability (Fig. 12). However, more often than not, the Multimode tends to disengage and disrupt image stability. Moreover, contact mode (the more consistent imaging mode) tends to destroy the bilayer (Fig. 13A-B). For this reason, we have recently favored using the Pico AFM.
Fig. 10. High-resolution image of DPPC bilayer imaged Fig. 11. Deflection mode image of DPPC bilayer using in tapping mode w/ spring constant 0.06 nN/m. Image size Multimode AFM. Image size is 1.44 µm2. is 2.0 µm2 and height scale is 0-20 nm (dark to light).
Fig 12A. Height image of three bilayer bumps at t=0 min. Fig. 12B. Same image as in Fig. 12A a few minutes later.

McKell et al BYU Repository 1‐10
8
Fig. 13A. Height image of DPPC bilayer at t=0 min. Image Fig 13B. Image of same bilayer after one subsequent scan size is 2.09 µm2 and height scale is 0-20 nm. in contact mode. Note the destruction of the bilayer. Cholera Toxin B In order to achieve professional image quality of various membrane proteins bound to lipid membranes, our lab sought to reproduce previous AFM images of cholera toxin B-oligomers (CT-B) bound to DPPC bilayers via ganglioside receptors (GM1). Yang et al [4] and Mou et al [5] successfully resolved the 5 nm diameter pentameric ring of CT-B in solution without the need for crystallization of the proteins. Following their methodology, we constructed and imaged a DPPC bilayer mixed with 10 mol % GM1 in solution before adding CT-B (Fig. 14).
Fig. 14. DPPC/GM1 bilayer. Image size is 3.0 µm2, height Fig 15. DPPC/GM1 w/ CT-B. Image size: 3.0 µm2, height scale is 0-8.1 nm. Note how GM1 blends in with DPPC. scale is 0-15 nm. Note that CT-B is not detectable.

McKell et al BYU Repository 1‐10
9
Fig. 16. False image of CT-B adhered to mica surface. Fig. 17. Transition from 7.5 µm2 image to 2.8 µm2 image. Image size is 7.5 µm2; thus our apparent “rings” must be The “rings” increase in diameter as expected, however, the approx. one micron in diameter. Height scale is 0-6 nm. diameter is still too large to be accurate. Ht scale: 0-6 nm. In the next step, we inserted CT-B oligomers onto the DPPC/GM1 bilayers. Unfortunately, however, we were unable to resolve the pentameric ring of CT-B (Fig. 15). Following instructions from Dr. Zhifeng Shao, professor of molecular physiology and biological physics at the University of Virginia and coauthor of the Yang and Mou papers, we subsequently allowed CT-B oligomers to adhere directly to the mica surface, instead of to GM1 receptors on lipid bilayers as before. We then imaged them in solution with Multimode AFM. However, what appeared to be pentameric rings of CT-B adsorbed to mica was confounded by the unusually large size of our supposed rings (Fig. 16-17). By comparing our approximately one micron diameter rings to the expected 5 nm diameter rings discovered by Yang and Mou, it became clearly evident that our results did not confirm the presence of CT-B oligomers adsorbed to the mica surface. Discussion The results of our isofluorane study are interesting but also inconclusive. After attaining some unknown concentration of isofluorane in our first experiment, we observed no change in bilayer thickness compared to normal bilayers; however, we did notice a gradual destruction of the bilayer over time (Fig. 2). In the second isofluorane experiment, thinning of the bilayer was uncertain and yet no gradual deterioration of the bilayer was observed (Fig. 5). The destruction of the bilayer in our first experiment seems to correspond to the corroding effects of dibucaine on EPC aggregates and DMPC patches [2]. With further evidence, we might discover several interesting correlations between isofluorane and dibucaine as they relate to membrane biophysics. Moreover, the apparent thinning of the bilayer in our second experiment partly mimics the effects of ethanol and halothane on bilayer thickness [1, 3]. To confirm this relationship, we would need to image bilayers with more distinctly recognizable holes so as to extract more convincing cross sections and height measurements. To address these questions, our lab will likely conduct more experiments on DPPC bilayers exposed to isofluorane. In addition to height measurements, we would like to conduct force-distance measurements in order to decipher the composition of the different layers being imaged (i.e. mica vs. lipid vs. protein). Also, we will probably continue to use the Pico AFM because of its impressive image consistency and high resolution

McKell et al BYU Repository 1‐10
10
capability. Moreover, in order to assess the impact of temperature on isofluorane-incorporated bilayers, we plan to compare room temperature images of drug-exposed DPPC bilayers with images taken in colder and hotter environments. Plus, we may also try to image DMPC bilayers in a cold environment to see if we can detect holes similar to those seen in DPPC bilayers at room temperature (Note: DMPC is liquid at room temperature). Then, we would inject isofluorane onto the DMPC bilayers and compare the results to those of dibucaine on DMPC patches [2]. Without supporting evidence and analysis from other isofluorane experiments, several misinterpretations of the AFM data in this paper are likely to persist. Based on the stark difference between the lipid bilayer compositions of our first and second experiments, for example, it is difficult to deduce the precise action of isofluorane on DPPC bilayers. For instance, the lipid deterioration in our first experiment seems convincing, but since the concentration of isofluorane is unknown, we can’t be certain that the gradual corrosion of the lipid bilayer was not due to some other factor, such as destruction caused by the AFM tip. However, with the drug insertion technique improved since our second experiment, we will likely confirm or refute this corrosion hypothesis in the next few isofluorane experiments. In regards to isofluorane-induced membrane thinning, force-distance measurements would reveal whether the unknown disordered phase in our second experiment was protein, monolayer, or something else, and also if any of the black areas in the images were mica; then, knowing the composition of each layer, we could correctly measure the actual lipid bilayer height. (As a side note, since mica forms exactly one-micron high steps, we could also identify whether something was mica based on simple height measurements). Indeed, by conducting more isofluorane experiments and analyzing the resulting data, we will likely advance our understanding of isofluorane’s role in lipid bilayer structure and membrane protein activity. Specifically, we anticipate that further research will significantly add to and improve the data presented in this paper. In the meanwhile, we can rest assured that the techniques and data acquired thus far will greatly aid our lab in the future realization of this endeavor. Acknowledgements We would like to thank Conrad Gibby and Bradley Strongin for offering training on the use of Multimode AFM and the preparation of liposome-based supported planar DPPC bilayers. References [1] Z. Leonenko, E. Finot, and D. Cramb. Atomic Force Microscopy to Study Interacting Forces in Phospholipid Bilayers Containing General Anesthetics. Methods in Molecular Biology, vol. 400: Methods in Membrane Lipids, Ch. 40. Edited by A. M. Dopico © Human Press Inc., Totowa, NJ. [2] G. Lorite, T. Nobre, M. Zaniquelli, E. de Paula, M. Cotta. Dibucaine effects on structural and elastic properties of lipid bilayers. Biophysical Chemistry, 139, 75-83, 2009. [3] E. Goksu, J. Vanegas, C. Blanchette, W. Lin, M. Longo. Review: AFM for structure and dynamics of biomembranes. Biochimica et Biophysica Acta 1788, 254-266, 2009. [4] J. Yang, L. Tamm, T. Tillack, Z. Shao. New Approach for Atomic Force Microscopy of Membrane Proteins: The Imaging of Cholera Toxin. Journal of Molecular Biology, 229, 286-290, 1993. [5] J. Mou, J. Yang, Z. Shao. Atomic Force Microscopy of Cholera Toxin B-oligomers Bound to Bilayers of Biologically Relevant Lipids. Journal of Molecular Biology, 248, 507-512, 1995.
**NOTE: The words and phrases that are bolded in the text indicate that the authors are uncertain as to their accuracy or validity.