Embed Size (px)
Citation preview
Air Force Institute of Technology Air Force Institute of Technology
AFIT Scholar AFIT Scholar
Theses and Dissertations Student Graduate Works
3-16-2008
AFMC Customer Satisfaction Study at the Air Logistics Centers AFMC Customer Satisfaction Study at the Air Logistics Centers
Kelly D. Kendall
Follow this and additional works at: https://scholar.afit.edu/etd
Part of the Operations and Supply Chain Management Commons
Recommended Citation Recommended Citation Kendall, Kelly D., "AFMC Customer Satisfaction Study at the Air Logistics Centers" (2008). Theses and Dissertations. 2802. https://scholar.afit.edu/etd/2802
This Thesis is brought to you for free and open access by the Student Graduate Works at AFIT Scholar. It has been accepted for inclusion in Theses and Dissertations by an authorized administrator of AFIT Scholar. For more information, please contact [email protected].
AFMC CUSTOMER SATISFACTION STUDY AT
THE AIR LOGISTICS CENTERS
THESIS
Kelly D. Kendall, Capt, USAF
AFIT/GLM/ENS/08-5
DEPARTMENT OF THE AIR FORCE
AIR UNIVERSITY
AIR FORCE INSTITUTE OF TECHNOLOGY
Wright-Patterson Air Force Base, Ohio
APPROVED FOR PUBLIC RELEASE; DISTRIBUTION UNLIMITED.
The views expressed in this graduate research project are those of the authors and do not reflect the official position of the United States Air Force, Department of Defense, or the United States Government
AFIT/GLM/ENS/08-5
AFMC CUSTOMER SATISFACTION STUDY AT THE AIR LOGISTICS CENTERS
Thesis
Presented to the Faculty
Department of Logistics Management
Graduate School of Engineering and Management
Air Force Institute of Technology
Air University
Air Education and Training Command
In Partial Fulfillment of the Requirements for the
Degree of Master of Science in Logistics Management
Kelly D. Kendall, MS
Capt, USAF
March 2008
APPROVED FOR PUBLIC RELEASE; DISTRIBUTION UNLIMITED. AFIT/GLM/ENS/08-5
AFMC CUSTOMER SATISFACTION STUDY AT THE AIR LOGISTICS CENTERS
Kelly D. Kendall, BS Captain, USAF
Approved: //signed// 16 March 2007 _______________________________ _____________ Dr. William A. Cunningham (Chairman) date
//signed// 16 March 2007 ________________________________ _____________ Dr. Martha Cooper (Member) date
AFIT/GLM/ENS/08-5
Abstract
The purpose of this research was to determine Air Force Material Command’s
(AFMCs) external customer issues and satisfaction levels as measured and compared by
Air Logistics Center. Specifically, this project sought to answer how AFMC’s Air
Logistics Centers were performing based on survey criteria chosen by AFMC’s A4
Logistics division. This research was guided by a previous Graduate Research Project
(GRP) effort, which sought to determine how customer relationship management (CRM)
initiatives varied in the private and public sectors, and to determine an appropriate means
of capturing and measuring this type of data for AFMC. The research question was
answered through a comprehensive literature review, and the use of survey methodology.
Over thirty-six hundred external customers were given the opportunity to participate in
the web based survey. The results were analyzed in an effort to determine what was
important to AFMC’s customers and identify future areas for improvement.
Comparisons were made between the Air Logistics centers as well as the previous
research conducted by Sullivan (2006) and this current research effort. The research
identified that, to date, the Customer Support Centers at the Air Logistics Centers are
providing consistent, valuable service to customers. Additionally, this research identified
potential areas for customer satisfaction improvements and the need for AFMC to
continue in its customer satisfaction improvement efforts.
iv
Acknowledgments
I would like to express my appreciation to my research advisor, Doctor William
Cunningham, and my reader Dr. Martha Cooper for their guidance and support
throughout the course of this thesis effort. Their interest, insight, and experience were
invaluable in keeping my efforts in focus and on schedule. I would also like to extend
my appreciation to Mr. Tommy Justice, Wing Commander Douglas Harrop, and Mr.
Haider Salahuddin from Air Force Material Command’s A4 Logistics Division that
contributed to and constantly supported this effort. I would also like to thank my lovely
wife for giving me the support and encouragement I needed and for keeping me grounded
in what is most important. Above all, I would like to thank the Lord for this opportunity
that I have had and the many blessings that he has so graciously provided during this
time.
Kelly D. Kendall
v
Table of Contents Abstract .............................................................................................................................. iv
Acknowledgments............................................................................................................... v
Table of Contents............................................................................................................... vi
List of Figures .................................................................................................................. viii
I. Introduction .................................................................................................................... 1
Background................................................................................................................ 1 Problem Statement..................................................................................................... 2 Research Objectives/Research Questions & Hypotheses .......................................... 2 Research Focus .......................................................................................................... 3
Methodology........................................................................................................ 3 Limitations ........................................................................................................... 4 Assumptions ........................................................................................................ 5 Implications ......................................................................................................... 5
II. Literature Review.......................................................................................................... 7
Chapter Overview...................................................................................................... 7 What is CRM? ........................................................................................................... 7 AFMC’s Initiatives to Date........................................................................................ 8 Practices of Award-Winning, Customer-Focused Organizations............................ 10 Customer Satisfaction Defined ................................................................................ 14 Why Measure Customer Satisfaction?..................................................................... 15 Customer Satisfaction Measurement Methods ........................................................ 16 How Often to measure Customer Satisfaction......................................................... 17 Summary.................................................................................................................. 18
III. Methodology.............................................................................................................. 19
Chapter Overview.................................................................................................... 19 Population and Sample ............................................................................................ 19 Survey Instrument.................................................................................................... 20 Data Collection Procedures ..................................................................................... 21 Data Analysis........................................................................................................... 22
IV. Results........................................................................................................................ 26
Chapter Overview.................................................................................................... 26 Survey Demographics.............................................................................................. 26 How did the ALCs perform based on the data collected from the Kendall (2008) survey? ..................................................................................................................... 27
Segment One Analysis....................................................................................... 27 Segment Two Analysis ...................................................................................... 32 Segment Three Analysis .................................................................................... 35 Segment Four Analysis...................................................................................... 38 Segment Five Analysis ...................................................................................... 44 Segment Six Analysis ........................................................................................ 47
vi
Segment Seven Analysis.................................................................................... 51 Segment Eight Analysis..................................................................................... 52
Comparison by ALC Utilizing Data from the Kendall (2008) Survey.................... 57 Segment Two Analysis ...................................................................................... 58 Segment Three Analysis .................................................................................... 59 Segment Five Analysis ...................................................................................... 61 Segment Eight Analysis..................................................................................... 64
Comparison by ALC Utilizing Data from the Sullivan (2006) Survey ................... 67 Segment One Analysis....................................................................................... 68 Segment Two Analysis ...................................................................................... 69 Segment Three Analysis .................................................................................... 72
Comparison between the Sullivan Survey (2006) and the Kendall Survey (2008) . 75 Segment One Analysis....................................................................................... 77 Segment Two Analysis ...................................................................................... 80 Segment Three Analysis .................................................................................... 82 Segment Four Analysis...................................................................................... 85 Segment Eight Analysis..................................................................................... 86
Summary.................................................................................................................. 88
V. Conclusions................................................................................................................. 89
Chapter Overview.................................................................................................... 89 Findings ................................................................................................................... 89 Recommendations.................................................................................................... 94 Research Summary .................................................................................................. 95
VI. Appendix A: Web-Based Survey Questions.............................................................. 96
Sullivan Survey (2006) ............................................................................................ 96 Kendall Survey (2008)........................................................................................... 101
VII. Appendix B: Results of Statistical Analysis........................................................... 108
ANOVA Tests Results: Comparison by ALC Utilizing Data from the Kendall (2008) Survey ........................................................................................................ 108 ANOVA Tests Results: Comparison by ALC Utilizing Data from the Sullivan (2006) Survey ........................................................................................................ 114 Paired-Samples T-test: Comparison by Sullivan (2006) Survey Data and the Kendall (2008) Survey Data .................................................................................. 119
VIII. Appendix C: Additional Customer Comments ..................................................... 128
IX. Bibliography ............................................................................................................ 134
vii
List of Figures Figure 1. PSCM Vision, Goals, and Pillars (USAF PSCM Brochure) ............................... 8 Figure 2 - Frequency Distribution of the Customer's Primary CSC. ................................ 28 Figure 3 - Frequency Distribution of how often Customer Utilizes the CSC................... 29 Figure 4 - Frequency Distribution of How Long Customer Has Utilized CSC Services . 29 Figure 5 - Frequency Distribution of Customer's Deployed Status .................................. 30 Figure 6 - Frequency Distribution of Customer's Duty AFSC/Job Series. ....................... 30 Figure 7 - Frequency Distribution of Customer's Call Support ........................................ 31 Figure 8 - Frequency Distribution of Reasons for the Customer's Call to CSC. .............. 31 Figure 9 - Frequency Distribution: Customer’s hold Time. ............................................. 33 Figure 10 - Frequency Distribution: Average Customer hold time. ................................. 33 Figure 11 - Frequency Distribution of Acceptable Wait Times. ...................................... 34 Figure 12 - Frequency Distribution of How Often Customer Hangs Up.......................... 34 Figure 13 - Frequency Distribution: How Long Customer was on the Phone.................. 35 Figure 14 - Frequency Distribution: Average time Customer was on the Phone. ............ 36 Figure 15 - Frequency Distribution of Timeliness of CSC Reps. Answer. ...................... 36 Figure 16 - Frequency Distribution: Number of Calls Required. ..................................... 37 Figure 17 - Frequency Distribution: Importance of Resolution with One Call. ............... 37 Figure 18 - Frequency Distribution of Customer's Awareness of CSC Services. ............ 38 Figure 19 - Frequency Distribution of Convenience of CSC Rep. Availability............... 39 Figure 20 - Frequency Distribution of CSC's Knowledge of Customer's Call History. ... 39 Figure 21 - Frequency Distribution of Accuracy of Information Provided by CSC. ....... 40 Figure 22 - Frequency Distribution: CSC's Ability to Address Questions/Issues. ........... 40 Figure 23 - Frequency Distribution: is the CSC Proactive. .............................................. 41 Figure 24 - Frequency Distribution: does CSC Deliver when they say they will............. 41 Figure 25 - Frequency Distribution: Customer's desire to communicate via E-mail........ 42 Figure 26 - Frequency Distribution: Customer is referred to another person................... 42 Figure 27 - Frequency Distribution: Importance of Status of Open Tickets. ................... 43 Figure 28 - Frequency Distribution: Customers Informed of Ticket Status. .................... 43 Figure 29 - Frequency Distribution: Customer would Utilize Internet for Services. ....... 44 Figure 30 - Frequency Distribution: Value of Tracking Status via Web Page. ................ 45 Figure 31 - Frequency Distribution: Customer would like Web-based Services. ............ 45 Figure 32 - Frequency Distribution: Why Customer would use Internet. ........................ 46 Figure 33 - Frequency Distribution: How Customer would prefer to query CSC............ 46 Figure 34 - Frequency Distribution: Professionalism of CSC Rep................................... 47 Figure 35 - Frequency Distribution: CSC Rep. was Helpful. ........................................... 48 Figure 36 - Frequency Distribution: CSC Reps. are Friendly. ......................................... 48 Figure 37 - Frequency Distribution: CSC Rep. Understood the Question/Need.............. 49 Figure 38 - Frequency Distribution: CSC Reps. are knowledgeable................................ 49 Figure 39 - Frequency Distribution: Urgency of Requests............................................... 50 Figure 40 - Frequency Distribution: Customer Notification in Advance. ........................ 50 Figure 41 - Frequency Distribution: Customer's overall Satisfaction with the CSC. ....... 51 Figure 42 - Frequency Distribution: Would Customer Still Utilize CSC......................... 52 Figure 43 - Frequency Distribution: Awareness of CSC Initiative................................... 53 Figure 44 - Frequency Distribution: Awareness of CRM Initiative before it began. ....... 54
viii
ix
Figure 45 - Frequency Distribution: CSC's Interest in Suggestions. ................................ 54 Figure 46 - Frequency Distribution: CSC use of Suggestions for Improvements. ........... 55 Figure 47 - Frequency Distribution: Customers that were previously surveyed. ............. 55 Figure 48 - Frequency Distribution: Customer can see results of inputs over time. ........ 56 Figure 49 - Frequency Distribution: Updating Customers on CRM Initiatives................ 56 Figure 50 - Frequency Distribution: Segment Two Question Two by ALC .................... 59 Figure 51 - Frequency Distribution: Segment Three Question One by ALC. .................. 60 Figure 52 - Frequency Distribution: Segment Three Question Two by ALC .................. 61 Figure 53 - Frequency Distribution: Segment Five Question One by ALC. .................... 62 Figure 54 - Frequency Distribution: Segment Five Question Two by ALC..................... 63 Figure 55 - Frequency Distribution: Segment Five Question Three by ALC................... 64 Figure 56 - Frequency Distribution: Segment Eight Question Two by ALC. .................. 66 Figure 57 - Frequency Distribution: Segment Eight Question Five by ALC. .................. 67 Figure 58 - Frequency Distribution: Segment One Question Three by ALC. .................. 69 Figure 59 - Frequency Distribution: Segment Two Question One by ALC. .................... 71 Figure 60 - Frequency Distribution: Segment Two Question Two by ALC. ................... 72 Figure 61 - Frequency Distribution: Segment Three Question One by ALC. .................. 74 Figure 62 - Frequency Distribution: Segment Three Question Three by ALC. ............... 75 Figure 63 - Frequency Distribution: Segment One Question One Comparison. .............. 78 Figure 64 - Frequency Distribution: Segment One Question Two Comparison. ............. 79 Figure 65 - Frequency Distribution: Segment One Question Seven Comparison. ........... 80 Figure 66 - Frequency Distribution: Segment Two Question Two Comparisons. ........... 81 Figure 67 - Frequency Distribution: Segment Two Question Four Comparisons. ........... 82 Figure 68 - Frequency Distribution: Segment Three Question Two Comparisons. ......... 83 Figure 69 - Frequency Distribution: Segment Three Question Four Comparisons. ......... 84 Figure 70 - Frequency Distribution: Segment Three Question Five Comparisons. ......... 85 Figure 71 - Frequency Distribution: Segment Four Question Ten Comparisons. ............ 86 Figure 72 - Frequency Distribution: Segment Eight Question Three Comparisons......... 87 Figure 73 - Frequency Distribution: Segment Eight Question Five Comparisons. .......... 88 Figure 74 - Frequency Distribution: Overall Satisfaction Level with CSC...................... 93
AFMC CUSTOMER SATISFACTION STUDY AT THE AIR LOGISTICS CENTERS
I. Introduction
Background
The Air Force recognizes that transformation from within is critical in order that
the warfighter be able to continuously adapt to the ever changing combat environment.
To address these transformational initiatives the Air Force has implemented, among
several other initiatives, Air Force Smart Operations for the 21st Century (AFSO21) and
Expeditionary Logistics for the 21st century (eLog21). AFSO21 is a transformational
initiative for all Airmen that eliminates waste from our end-to-end processes (AFSO21
CONOPS, 2007:3). Likewise, eLog21 is a transformation initiative that will change key
logistics processes to improve support to the warfighter. In cooperation with these
efforts, the Directorate of Logistics division (A4) at Air Force Material Command
(AFMC) has made several changes to many of its core processes. One of which is the
Air Mobility Command’s move toward a supply process transformation when, in 2006,
the command’s five Regional Supply Squadrons were re-designated as the Mobility
Logistics Support Centers (LSC). The five centers were reduced to two LSCs located at
Scott Air Force Base, Illinois, and Langley Air Force Base, Virginia. "This new structure
takes care of our warfighters around the world by giving them support, when they need it,
where they need it, in a timely manner," said Brig. Gen. Gary T. McCoy, director of
Logistics Readiness for the Office of the Deputy Chief of Staff for Logistics (MAF,
2007). One of the key reasons for this transformation was the desire to increase support
1
to the warfighter and do this more efficiently and effectively. To accomplish this, AFMC
is implementing Customer Relationship Management (CRM) as one of its initiatives.
Problem Statement
Due to the CRM initiative mentioned above and the desire on behalf of AFMC to
increase customer satisfaction and determine its customers’ issues, this research is aimed
at measuring AFMCs current customer satisfaction levels and customer issues at the Air
Logistics Centers (ALC). Through this initiative, AFMC hopes to increase the level of
customer satisfaction and provide better support to the customer. The overall intent of
this research is to assist AFMC in the implementation of its CRM initiative with the
ultimate goal of improving its processes and increasing customer satisfaction.
Research Objectives/Research Questions & Hypotheses
The purpose of this research is to accurately measure AFMCs external customer
issues and satisfaction levels at the Air Logistics Centers (ALCs). The measurements
derived from this research will be utilized by AFMC to seek areas for process
improvements, and to increase overall customer satisfaction.
The following research question is presented:
What are Air Force Material Command’s external customer issues and satisfaction levels
as measured and compared by Air Logistics Center?
Investigative Questions:
Multiple questions are addressed in order to answer the research question:
1. How are the ALCs performing based on the data collected from the Kendall (2008) survey criteria that were developed by AFMC’s A4 Logistics division?
2. How does customer satisfaction, based on the survey criteria chosen by AFMC’s
A4 Logistics division, compare between the three ALCs based on the data collected from the Kendall (2008) research survey?
2
3. How does customer satisfaction, based on the survey criteria chosen by AFMC’s
A4 Logistics division, compare between the three ALCs based on data collected from the Sullivan (2006) research survey?
4. How does customer satisfaction, based on the survey criteria chosen by AFMC’s
A4 Logistics division, compare between the data collected from the Sullivan (2006) research survey and the data collected from the Kendall (2008) research survey?
Research Focus
The focus of this research is to determine AFMCs current customer satisfaction,
based on the survey criteria chosen by AFMC’s A4 Logistics division; specifically the
customers that receive service from the Air Logistics Centers (ALC) at Tinker Air Force
Base in Oklahoma, Warner Robbins Air Force Base in Georgia, and Ogden Air Force
Base in Utah. Because this research will be focused toward specific customers of the
ALCs, alternative Air Force applications may be limited. However, this research and
methodology may serve as a general foundation for the concept of measuring customer
issues and satisfaction for other organizations.
Methodology
To identify customer needs and expectations, one should start by going directly to
the customer. This requires the use of a measurement tool in order to capture and analyze
this information. In the past AFMC has used survey instruments to measure customer
expectations and needs. In addition, AFMC has stated its desire for a well-developed
survey instrument in order to measure customer satisfaction; therefore, this study focuses
on the distribution of a survey instrument that will help identify the current state of
AFMCs customer satisfaction and issues, based on the criteria chosen by AFMC’s A4
Logistics division.
3
In order to determine customer relationship issues and customer needs, an
organization must first know who its customers are. In a previous research project,
Captain Damelsa White determined who AFMC’s external customers were and
differentiated those customers based on a segmentation model consisting of recency,
frequency, and location (Sullivan, 2006:43). However, due to the format of the electronic
mail addresses provided by AFMC, White’s segmentation of AFMC’s customers could
not be utilized for this project. To compensate, the survey for this research project
contains the same segmentation questions that were incorporated into Sullivan’s survey
which are based on White’s segmentation model of recency, frequency, and location.
Customers’ electronic mail addresses, for the three ALCs, were derived from Structured
Query Language (SQL) databases at Ogden Air Force Base in Utah (Ogden also
maintains Warner Robin’s ALC information) and Tinker Air Force Base in Oklahoma.
Currently, the customer support centers at each of these locations maintain databases on
their customers along with their contact information. Each Customer Service Center at
the Air Logistics Centers provided the required databases to compile customer contact
information.
Limitations
A limiting factor to this research is the information databases that are currently
utilized to capture customer information. At present, Mobility Air Force (MAF)
customers are expected to call the Logistics Support Centers (LSCs) at Scott Air Force
Base in Illinois and Combat Air Forces (CAFs) are expected to call the LSC at Langley
Air Force Base in Virginia. If the LSC does not have the information or expertise to
handle the call, the call is then forwarded to the ALC. However, many customers bypass
4
the LSC and call the ALC directly. If a call does not continue past the LSC, all
information concerning that call is never captured. Ogden Air Force Base maintains a
database that captures all customer information for Ogden ALC and Warner Robbins
ALC. Tinker Air Force Base has its own database to capture customer information. This
may limit the information obtained for all customers that only contact the LSC.
An additional limitation was the relatively low response rate, with an overall
response rate of thirteen percent. The low response rate may have partially been
contributed to the time span from which the contact information was derived. The
electronic mail addresses, provided by the customer service centers at the ALCs, were
dated from June 2006 to June 2007, which meant that it had been over one-and-a-half
years since some of the contacts had contacted the CSCs. This may have contributed to
the fifteen hundred and sixty electronic mail addresses that returned as invalid.
Additionally, eleven individuals responded that they had never contacted or received
service from the customer service center, and this could have been an indication that
more of the contacts were invalid but simply deleted the survey electronic mail
solicitation.
Assumptions
1. An adequate number of customers will respond to the survey in order to complete
the analysis and make logical conclusions.
Implications
5
Through this initiative, AFMC will be better equipped to implement CRM which
will allow them to more effectively communicate with customers, improve operational
efficiencies, decrease costs, and improve customer satisfaction. Additionally, as AFMC
seeks to implement Customer Relationship Management as one of its transformation
“pillars”, and capitalize on benchmarking some of the leading business practices in the
industry, more Air Force organizations will be able to follow AFMC’s example by truly
putting the customer first and focusing on better business processes and products.
6
II. Literature Review
Chapter Overview
The purpose of this literature review is to develop a thorough understanding of
customer satisfaction prior to developing and implementing a measurement instrument
for Air Force Material Command (AFMC). This literature review will begin with a broad
overview of CRM and AFMC’s initiatives to date to measure customer satisfaction as a
component of CRM. This literature review will then define customer satisfaction,
followed by an examination of the practices of award winning customer-focused
organizations. Finally, this literature review will establish the necessity to measure
customer satisfaction, analyze current customer satisfaction measurement methods, and
examine some general guidelines for how often to measure customer satisfaction.
What is CRM?
Today’s market competition is fiercer than ever. With the accessibility of the
internet and the implementation of advanced information technologies, the ability to
satisfy and thereby retain a customer has grown increasingly more difficult. As a result,
organizations are seeking ways to build customer relationships in an effort to gain
customer loyalty. One approach that many organizations turn to is CRM. CRM is not a
new concept; commercial businesses have sought to implement these practices for years
(Chalmeta, 2006:1015).
Several definitions of CRM exist throughout the literature. Representative of the
most common includes (Chalmeta, 2006:1015), who defines CRM as “a customer-
focused business strategy that dynamically integrates sales, marketing and customer care
service in order to create and add value for the company and its customers”, or (Harej and
7
Horvat, 2000:108) who equate CRM to customer care, and define CRM as “a customer
service that seeks to acquire new customers, provides superior customer satisfaction and
builds customer loyalty”. The fundamental premise behind CRM is to gain knowledge
and understanding of the customer which leads to better customer service and customer
retention. While implementation is much more complex, the end goal is the same, and
that is customer satisfaction.
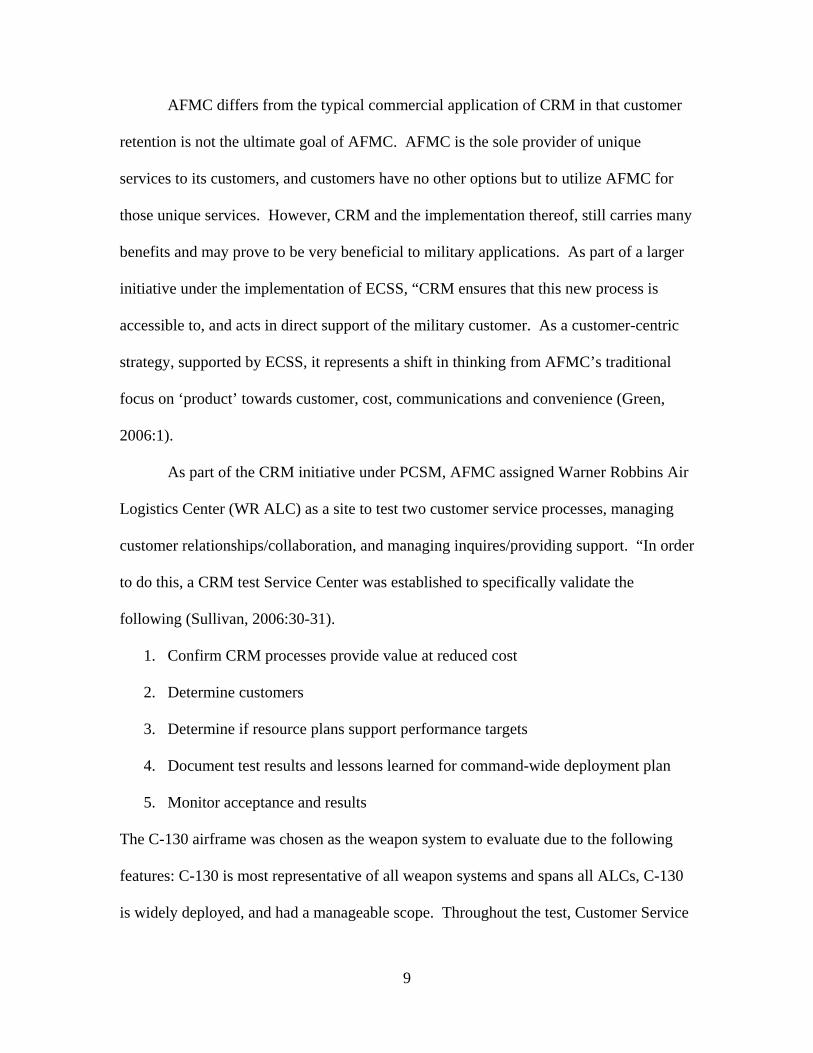
AFMC’s Initiatives to Date
“Through Elog21, the Air Force has embarked on one of the most significant
changes in sustainment support to the warfighter” (USAF PSCM Brochure, 2007:1). A
key component of the transformational initiative Elog21 is Purchasing and Supply Chain
Management (PSCM). PCSM seeks to “integrate purchasing and supply functions into a
single end-to-end process that spans the Air Force supply system” (USAF PSCM
Brochure, 2007:1). Initiated in 2001, PCSM seeks to reduce costs and improve
performance within headquarters AFMC and the three Air Logistics Centers. As
demonstrated in figure 1 below, CRM is one of the key pillars of PCSM.
End-
to-E
nd
Supp
ly C
hain
M
anag
emen
t
Cus
tom
er
Rel
atio
nshi
p M
anag
emen
t
Supp
lier
Rel
atio
nshi
p M
anag
emen
t
Inte
grat
ed S
uppl
y C
hain
Pla
nnin
g &
O
ps
Dyn
amic
Stra
tegi
cPl
anni
ng
Stra
tegi
c Pu
rcha
sing
Data As A Strategic ResourceTransparent Information & Asset Visibility
Performance-Based AccountabilityFlexible & Empowered Workforce
Extended Enterprise Collaboration
PSCM
End-
to-E
nd
Supp
ly C
hain
M
anag
emen
t
Cus
tom
er
Rel
atio
nshi
p M
anag
emen
t
Supp
lier
Rel
atio
nshi
p M
anag
emen
t
Inte
grat
ed S
uppl
y C
hain
Pla
nnin
g &
O
ps
Dyn
amic
Stra
tegi
cPl
anni
ng
Stra
tegi
c Pu
rcha
sing
Data As A Strategic ResourceData As A Strategic ResourceTransparent Information & Asset Visibility
Performance-Based AccountabilityFlexible & Empowered WorkforceFlexible & Empowered Workforce
Extended Enterprise Collaboration
PSCM
Figure 1. PSCM Vision, Goals, and Pillars (USAF PSCM Brochure)
8
AFMC differs from the typical commercial application of CRM in that customer
retention is not the ultimate goal of AFMC. AFMC is the sole provider of unique
services to its customers, and customers have no other options but to utilize AFMC for
those unique services. However, CRM and the implementation thereof, still carries many
benefits and may prove to be very beneficial to military applications. As part of a larger
initiative under the implementation of ECSS, “CRM ensures that this new process is
accessible to, and acts in direct support of the military customer. As a customer-centric
strategy, supported by ECSS, it represents a shift in thinking from AFMC’s traditional
focus on ‘product’ towards customer, cost, communications and convenience (Green,
2006:1).
As part of the CRM initiative under PCSM, AFMC assigned Warner Robbins Air
Logistics Center (WR ALC) as a site to test two customer service processes, managing
customer relationships/collaboration, and managing inquires/providing support. “In order
to do this, a CRM test Service Center was established to specifically validate the
following (Sullivan, 2006:30-31).
1. Confirm CRM processes provide value at reduced cost
2. Determine customers
3. Determine if resource plans support performance targets
4. Document test results and lessons learned for command-wide deployment plan
5. Monitor acceptance and results
The C-130 airframe was chosen as the weapon system to evaluate due to the following
features: C-130 is most representative of all weapon systems and spans all ALCs, C-130
is widely deployed, and had a manageable scope. Throughout the test, Customer Service
9
Center personnel collected data (to include a customer satisfaction survey) and captured
lessons learned (Sullivan, 2006:30-31). Additionally, one of the most telling “lessons
learned” from the outbrief was that “we should have invested in base-lining the current
state of customer service” (Sullivan, 2006:30-31). This statement establishes the main
focus and purpose of this research effort between AFMC and the Air Force Institute of
Technology (AFIT). Additionally, an article by (Harej and Horvat, 2000) reinforces this
notion that an organization should attempt to gain a better understanding of its customers
prior to implementing CRM initiatives. The article describes the fundamental, yet
necessary steps concerning successful CRM implementation, and describes four phases to
consider when implementing CRM: initiation phase, process definition phase,
introduction phase, and operation phase. The initiation phase describes processes that an
organization should consider early in the implementation of CRM. “The current state of
the organization should be evaluated – which processes are already in use, how well are
they structured, are there any customer-centric processes already defined, how well does
the organization knows its customers, and is the organization receiving any feed-back
from them” (Harej and Horvat, 2000, 109). A well-designed survey can benchmark the
“current state” of AFMC and determine how well it currently “knows its customers”. As
the Air Force looks for new and improved ways of doing business, AFMC can contribute
significantly to this effort by capitalizing on the potential benefits that a properly
implemented CRM model can provide.
Practices of Award-Winning, Customer-Focused Organizations
A good place to begin when examining award-winning, customer-focused
organizations is by looking at the awards themselves. Perhaps the best and well known
10
examples of such awards in the United States are the Malcolm Baldrige National Quality
Award (MBNQA) and the President’s Quality Award (PQA). “The Baldrige Award is
given by the President of the United States to businesses—manufacturing and service,
small and large—and to education, health care and nonprofit organizations that apply and
are judged to be outstanding in seven areas: leadership; strategic planning; customer and
market focus; measurement, analysis, and knowledge management; human resource
focus; process management; and results” (MBNQA FAQs, 2007). Organizations are
evaluated based on these seven categories. Category three is “customer and market
focus”, and evaluates several aspects of customer service as listed below:
1. How do you identify customers, customer groups, and market segments? How do you determine which customers, customer groups, and market segments to pursue for current and future products and services? How do you include customers of competitors and other potential customers and markets in this determination? 2. How do you use the voice of the customer to determine key customer requirements, needs, and changing expectations (including product and service features) and their relative importance to customers’ purchasing or relationship decisions? How do your listening methods vary for different customers, customer groups, or market segments? How do you use relevant information and feedback from current and former customers, including marketing and sales information, customer loyalty and retention data, customer referrals, win/loss analysis, and complaint data for purposes of planning products and services, marketing, making work system and work process improvements, and developing new business opportunities? 3. How do you use voice-of-the-customer information and feedback to become more customer-focused, to better satisfy customer needs and desires, and to identify opportunities for innovation? 4. How do you keep your customer and market listening and learning methods current with business needs and directions, including changes in your marketplace? (Baldrige National Quality Program, 2007)
11
Similar to the MBNQA is the PQA. The PQA is “designed to recognize federal
organizations that have documented high-performance management systems and
approaches”. (President's quality award program, 2007). The PQA is very similar to the
MBNQA, however the PQA is only awarded to federal organizations. Likewise, the
criteria are very similar. The following represents the criteria for evaluating a federal
organization based on customer satisfaction.
1. How do you determine or target customers, customer groups, and/or market/ mission-related segments? How do you consider customers of competitors and other potential customers and/or markets in this determination? 2. How do you listen and learn, and use the analysis of data and information to determine key requirements and drivers of purchase decisions for current, former, and potential customers? If determination methods differ for different customers and/or customer groups, include the key differences. 3. How do you determine and/or project key product/service features and their relative importance/value to customers for purposes of current and future marketing, product planning, and other business developments, as appropriate? How do you use relevant information from current and former customers, including marketing/sales information, customer retention, won/lost analysis, and complaints, in this determination? 4. How do you keep your listening and learning methods, and keep them current with business needs and directions? (PQA, 2001)
These criteria can serve as a good starting point for organizations seeking to implement
customer relationship improvement initiatives.
Finding award winning organizations in the area of customer satisfaction is not
difficult. One can look toward the recipients of these prestigious awards, as mentioned
above, such as the MBNQA and the PQA that recognize leading companies for customer
service efforts. However, determining commonalities among these organizations is not
as easy to accomplish. A study conducted by Hodgkiss and Casipit sought to capture
12
these commonalities as well as the differences among several award winning
organizations. The comparisons were based on three areas: commitment to satisfaction,
satisfaction measurement programs, and actual measurement tools used. The research
focused solely on winners of the MBNQA and PQA. The companies analyzed were
AT&T Universal Card Services (UCS), Federal Express, The Ritz-Carlton Hotel
Company, Arnold Engineering Development Center, Cherry Point Naval Aviation Depot
and Aeronautical Systems Center. The Authors discovered several similarities of note
that existed between these customer-focused organizations. As a result of their studies,
Hodgkiss and Casipit discovered the following commonalities among award winning
organizations:
1. All organizations had developed a program to measure customer needs and expectations. 2. Top management of all of the organizations recognize the importance of the customer satisfaction program to their mission and are thus committed to the program, all had corporate buy-in or a general acceptance among the organization’s employees concerning customer satisfaction. 3. Most organizations shared information concerning customer satisfaction throughout the organization and in all cases top management was informed of customer satisfaction information. 4. A majority of the organizations have a formalized procedure for measuring customer satisfaction data to drive continuous improvement. 5. A majority of the organizations empower employees to satisfy the customer. 6. A majority of the organizations have a formalized training program for customer contact employees. 7. All organizations developed their own customer satisfaction measures and methods to suit their organization’s needs.
13
8. All organizations use a mix of methods to measure customer satisfaction. In addition, all organizations use one or more forms of surveys. (Hodgkiss and Casipit, 1994:4.18-4.29) Other findings of note from the Hodgkiss and Casipit study were the non-
existence of a linkage between customer satisfaction and performance appraisals
in all military organizations; however, many of the public organizations had a
direct link between performance appraisals and customer satisfaction. A thorough
examination of the criteria used for the MBNQA and the PQA to evaluate
companies, as well as the insight gained from the Hodgkiss and Casipit study
serve as fundamental guidelines to consider when undergoing any customer
service initiative.
Customer Satisfaction Defined In an effort to define customer satisfaction, let us begin by examining some
common definitions throughout the literature: In their book entitled, “Customer
Satisfaction” by Hanan and Karp, customer satisfaction is simply defined as the “value
that has been added to the bottom line of the customer” (Hanan and Karp, 1989:XII).
ISO 9000 standard defines “customer satisfaction” as a “customers' perception of the
degree to which the customer's requirements have been fulfilled” (ISO 9000, 2005).
Customer satisfaction defined throughout the literature has a definite common theme; that
is a satisfied customer would do repeat business with the providing organization.
A customer can receive satisfaction from an organization through several different
channels, whether it is a service provided, a product purchased, a relationship established,
or a value received in any form from the contributing organization. One could argue that
customer satisfaction is the most important competitive advantage that an organization
14
can have; therefore, customer satisfaction should be the primary focus of all
organizations.
Because this research is focused on measuring whether the ALCs are meeting or
exceeding customer’s expectations, based on the criteria that AFMC’s A4 Logistics
division has established, customer satisfaction for the purpose of this research is defined
as: “a service provided, a product purchased, a relationship established, or a value
received in any form from the contributing organization that meets or exceeds the
customer’s needs and expectations, and results in a desire on behalf of the customer to
seek repeat business with the providing organization, should the need arise”.
Why Measure Customer Satisfaction? There are numerous research studies demonstrating the importance of customer
satisfaction in today’s market place: “Customer satisfaction is a key and valued outcome
of good marketing practice” (Malthouse and others, 2004:232); The primary focus of
your company’s operation should be on having uniformly excellent customer service”
(Johnson, 2007:40); “The payback to the organization that is driven by a customer needs
strategy is significant; Both management and employees benefit by improved work
environment, increased self-worth, value to the organization and increased job security,
benefits and financial rewards” (Aubrey, 1989:2). Among the empirical studies
conducted to attest to the importance of measuring and obtaining customer satisfaction
one could turn to the following: “firms that achieve high customer satisfaction also enjoy
superior economic returns” (Anderson, Fornell, Lehmann, 1994:63); “Customer
satisfaction is directly related to retention” (Anderson and Sullivan, 1993); Customer
retention leads to the security of future revenues (Fornell, 1992); and reduces the chances
15
that a customer will leave if quality declines (Anderson and Sullivan, 1993); Increasing
customer satisfaction reduces cost associated with defective goods and services
(Anderson, Fornell, and Rust, 1997).
Gauging by the vast amount of literature that has transpired, the sheer number of
marketing and customer satisfaction research firms that are available for hire, as well as
the number of organizations that are or have moved to a customer-focused business
perspective, the importance of measuring customer satisfaction is obvious. “The
fundamental reason customer satisfaction is important to your organization is because it
allows your organization to stay in business” (Deviney, 1998). To most organizations
that provides a good or service, attaining customer satisfaction is the ultimate goal.
Without customer satisfaction most organizations will not remain competitive and will
eventually seize to exist.
Customer Satisfaction Measurement Methods
Many methods exist to measure and capture a customer’s satisfaction: telephone
studies, direct mailings, facsimile, personal interviews, and customer focus groups are
among the most common. Each method presents its own advantages and disadvantages;
however, “the advent of electronic mail (e-mail) and the Internet provides researchers
with a new avenue for data collection; one that can negate many disadvantages associated
with traditional survey methods” (Griffis, Golsby, and Cooper, 2003). Web-based
surveys can result in a higher response rate, faster response times, and can provide the
same results at a lower cost (Griffis, Golsby, and Cooper, 2003). Alternative, but perhaps
more costly methods include in-person interviews. Additional methods to consider,
although less direct, are complaint handling systems, market share analysis, and
16
performance based measures. With the many alternatives that exist, an organization
should not be limited to only one measurement method. By considering multiple
measurement methods an organization can overcome many of the shortfalls that are
associated with single measurements.
How Often to measure Customer Satisfaction While there is no concrete answer to the question of how often to measure
customer satisfaction, there does exist in the literature general guidelines to consider
when determining measurement frequency. Hanan and Karp in a book entitled
Customer Satisfaction, describe two “factors” that influence how often an organization
should measure customer satisfaction. According to the authors, the “newer you are, the
more frequently you will need to evaluate how well you are satisfying your customers”
(Hanan and Karp, 1989:101). For a newer organization customer satisfaction must be
monitored very closely considering that the slightest customer dissatisfaction could
potentially have very negative results for an organization. Likewise, well-established
organizations can afford slight “aberrations” in customer satisfaction in the short term.
The second factor mentioned that should be considered is the type of business that you
are in. According to the authors, “If your customers make daily decisions about your
products or services and yesterday’s dissatisfaction can have an immediate impact on
today’s sales, you will have to measure more frequently than a business whose sales
cycle takes longer” (Hanan and Karp, 1989:101-102). Additionally, organizations must
consider how often it changes customers and the organizations need to maintain current
data regarding the satisfaction of its customers. According to Dr. Rick Johnson, founder
of CEO strategist LLC, a firm specializing in leadership and the creation of competitive
17
advantage in wholesale distribution, an organization “can only realistically conduct
comprehensive surveys annually, aside from the cost of collecting the information, your
customers will typically balk at more frequent requests” (Johnson, 2007:41). Inevitably,
as competition continues to increase, organizations will want a better perspective on
customer satisfaction and will labor to maintain accurate and current information in this
area.
Summary
This chapter reviewed relevant literature associated with customer satisfaction
measurements in an effort to develop an understanding of customer satisfaction prior to
developing a measurement instrument for Air Force Material Command (AFMC). This
literature review introduced a broad overview of CRM and AFMC’s initiatives to date to
measure customer satisfaction as a component of CRM. This literature review then
defined “customer satisfaction”, followed by an examination of the practices of award
winning customer focused organizations. Finally, this literature review established the
necessity to measure customer satisfaction and to analyze current customer satisfaction
measurement methods; and examined some general guidelines for how often to measure
“customer satisfaction”. Together, this chapter formed the foundation for the decision to
use a survey methodology to identify AFMC’s external customer needs, and to measure
its current satisfaction levels.
18
III. Methodology
Chapter Overview A description of the methodology used to conduct this research is provided in this
chapter. It begins with an overview of the population and sample used, followed by the
development of an instrument utilized to measure customer satisfaction of the population.
Data collection procedures followed by data analysis are then delineated.
Population and Sample ALC customer information was derived from Structured Query Language (SQL)
databases at Ogden Air Force Base in Utah and Tinker Air Force Base in Oklahoma.
Currently the customer support centers at each of these locations maintain databases on
their customers along with their contact information. Mr. Tommy Justice at AFMC’s A4
division provided the required databases in order to compile customer information. At
present Mobility Air Force (MAF) customers are “expected” to call the Logistics Support
Centers (LSC) at Scott Air Force Base in Illinois and Combat Air Forces (CAF) are
expected to call the LSC at Langley Air Force Base in Virginia. If the LSC does not have
the information or expertise to handle the call, the call is then forwarded to the ALC. The
available customer databases provide contact information in the form of electronic mail
addresses for all customers that contact the ALCs; therefore, the research was conducted
on the entire population which eliminated the requirements of a sample selection.
Additionally, customer segmentation was provided by introducing questions into the
survey that allowed the researcher to differentiate among various customers of the ALCs.
In a previous research effort conducted by Sullivan (2006), Sullivan attempted to
segment customers based on a research effort conducted by Captain Damelsa White, She
19
segmented customers based on recency, frequency, and location; however, Sullivan was
not able to specifically utilize White’s data due to the lack of customer identification that
was provided by AFMC. To overcome this, Sullivan incorporated questions into the
survey which allowed him to segment customers based on the same model of recency,
frequency, and location. In order to make relative comparisons between surveys, the
same segmentation model was utilized for this research and the questions concerning
customer segmentation were retained in the survey.
Survey Instrument The survey instrument utilized for this research is based on a previous research
effort conducted by Sullivan (2006). Sullivan developed a survey instrument that was
conducted in 2006 that provided an overall “foundation” from which to compare future
CRM and customer satisfaction efforts. The survey conducted for this research utilized
many of the same questions from the Sullivan (2006) research; however, some questions
were reworked in order to “fine tune” the previous survey and add to functionality. The
final survey can be found at VI. Appendix A: Web-Based Survey QuestionsKendall
Survey (2008), and will be referred to throughout the remainder of this literature as the
Kendall (2008) survey for readability purposes. By conducting a survey that was very
similar to the previous survey conducted by Major Sullivan, this researcher was able to
make comparisons between both surveys which allowed relative comparisons to be made
which aided in answering the following investigative question:
4. How does customer satisfaction, based on the survey criteria chosen by AFMC’s
A4 Logistics division, compare between the data collected from the Sullivan
20
(2006) research survey and the data collected from the Kendall (2008) research
survey?
This question is examined in detail in chapter IV of this research.
The original Sullivan (2006) survey was analyzed by AFMC, AFIT faculty, and
the researcher to ensure that the survey captured the scope of the responsibilities of the
ALCs. Minor changes were made to clarify certain areas of the survey; additionally,
Sullivan had identified an area for improvement concerning respondents that were at
deployed locations. Sullivan identified the following:
Only 2% of respondents identified themselves as “deployed”, yet, 16% of respondents had answers on whether or not their deployed location supported the warfighting AOR. This inconsistency is being attributed to poor wording on the survey. A better way to ask the question would have been “If you answered yes to the previous question, then please indicate if your deployed location is supporting the warfighting AOR.” (Sullivan, 2006: 48)
The revised survey utilized for this research incorporated Sullivan’s recommendation.
The minor changes referred to above can be quickly identified by comparing the original
Sullivan survey from Sullivan (2006) to the survey contained in this research effort. The
minor changes made primarily, if not exclusively, affected functionality of Sullivan’s
survey and not content.
Data Collection Procedures The data collection method for this research was a web-based survey due to the
increased speed of this method, the databases provided by AFMC contained electronic
mail addresses, better access to a larger population, and lower costs associated with web-
surveys (Griffis, Golsby, and Cooper, 2003). AFMC Customer Service Center’s (CSCs)
21
maintain databases to capture information on all customers to the ALCs. AFMC was
able to provide contact information, specifically electronic mail addresses for all of the
customers that contacted the ALCs from August 2006 to August 2007. Due to the
previous research effort by Sullivan (2006), these dates captured the customers that
AFMC was most interested in surveying. Additionally, this contact information included
all customers, which essentially was the entire population. This eliminated the need for a
sampling method and enabled parallel comparisons between this research and the
research conducted by Sullivan (2006).
The survey utilized for this research effort was distributed to thirty-six hundred
and seventy-one electronic mail addresses on 4 February 2008. A follow up e-mail
requesting completion of the survey was sent on 11 February 2008 in an attempt to serve
as a reminder to the survey focus population and encourage better participation. The
survey ended on 15 February 2008.
Data Analysis
The purpose of this section of the research is to describe the method of data
analysis utilized after the survey was conducted and the results were collected;
additionally, this section describes the reasons for choosing these methods. Once a
survey has been conducted, it is necessary to analyze and summarize the results. The
results must be presentable and displayed in a manner that makes the results easy to
utilize and understand. The primary methods of analysis and representation chosen for
this research were one-way Analysis of Variances (ANOVA) tests, Independent two-
sample T-test, and frequency distributions. The ANOVA is used to test for differences
among three or more groups (Statistics Homepage, 2008) within a population. ANOVA
22
analysis is appropriate whenever you want to compare the means of three groups;
therefore, ANOVA was utilized to determine if a significant statistical difference existed
between the ALCs for the Sullivan (2006) survey and the Kendall (2008) survey.
Statistical comparisons of the means, for each question of the survey, were conducted by
ALC utilizing the statistical software program, SPSS (Statistical Package for the Social
Sciences). VII. Appendix B: Results of Statistical Analysis, includes the results of all
statistical comparisons that were made for each question of the survey. The questions are
presented by segment in the same manner as the survey was distributed. An F-value
greater than one, with a respective significance value less than .1 (90% significance)
assumed that a difference existed between the individual question means of each ALC.
Conversely, an F-value less than one, with a respective significance value greater than .1
assumed that no difference existed between the means. The ANOVA tests were based on
a significance level or an alpha of .1 giving a 90% confidence that the means where either
equal or unequal. After analyzing the data at a 95% and a 90% significance level, the
researcher determined that a 90% significance level gave the best results without
excluding some differences and including menial differences. If the ANOVA test
indicated that a statistical difference existed with an F-value greater than one, based on a
significance level of 90%, a Tukey analysis was performed to determine which ALCs
differed; the data were then presented utilizing frequency distributions to provide further
analysis and usability of the results.
Additionally, independent sample T-tests were utilized to compare the Sullivan
(2006) survey and the Kendall (2008) survey to determine if differences in the responses
had transpired from the time of Sullivan’s research in 2006 to the conclusion of the data
23
collection of this research. Likewise, a significance value less than .1 (90% significance)
assumed that a difference existed between the Sullivan (2006) survey question and the
Kendall (2008) survey question, and the data were then presented utilizing frequency
distributions to provide further analysis and usability of the results. VII. Appendix B:
Results of Statistical Analysis, contains the results of the independent sample T-test in its
entirety.
Frequency distributions as a method of graphical representation of the data were
chosen due to two main factors:
1. Precedence: In the previous survey conducted in 2006, Sullivan’s primary means of analysis and presentation was the use of relatively simple and easy to understand histograms. Additionally, Sullivan’s method of histogram presentation was based on initial CRM testing at Warner Robins where a test team gathered some preliminary results by conducting a four question survey (Sullivan, 2006) and presented those results by means of histograms.
2. Frequency distributions provide a useful way to graphically present the results of
survey data allowing users to visually interpret the results (Archester, 1995:14).
Additionally, to make the data more useful, frequency distributions were conducted on all
segments of the Kendall (2008) survey.
The following summarizes the analysis that was conducted:
1. Frequency distributions were presented for each segment of the Kendall (2008) survey to give graphical representation of all the data collected.
2. Analysis of Variance (ANOVA) tests were conducted on all survey questions to
identify differences between ALCs for the Sullivan (2006) survey and the Kendall (2008) survey. If the difference was statistically significant with a confidence interval of 90%, frequency distributions were conducted to further present and highlight the differences.
3. Independent Sample T-tests were conducted on all survey questions to identify
differences between the Sullivan (2006) survey and the Kendall (2008) survey. If the difference was statistically significant with a confidence interval of 90%,
24
frequency distributions were conducted to further present and highlight the differences.
Prior to conducting an ANOVA, the data should be analyzed to see if it meets two
criteria in addition to being random and independent:
1. The distributions of the data are normal.
2. The data possess constant variance.
To ensure the results were not affected by these assumptions and wrong conclusions
made, two tests were performed in addition to the ANOVA. A non-parametric Kruskal-
Wallis test (compares group medians and is therefore very robust against non-normality)
was conducted to ensure that the results were not affected by non-normality, and Welch’s
ANOVA tests (very robust against non-constant variance) were performed to ensure that
the results were not affected by non-constant variance. In all comparisons, the Kruskal-
Wallis and the Welch’s ANOVA did not change the results or conflict with the one-way
ANOVA tests; therefore, the researcher concluded that the ANOVA was sufficient to
determine the differences, and only the ANOVA analysis was presented in this report.
The comparisons that resulted in an F-value greater than one with a significance value
less than .1 (for a 90% significance level) are presented in chapter IV for each respective
segment.
25
IV. Results
Chapter Overview The purpose of this chapter is to detail the results of the survey analysis. This
chapter begins by describing the survey demographics followed by frequency
distributions which provide a graphical representation, designed to present the results of
the survey and how the ALCs performed based on the criteria selected by AFMC’s A4
Logistics division, of the data collected from the Kendall (2008) survey. Details of the
comparisons made by ALC utilizing data from the Sullivan (2006) survey are then
presented, followed by comparisons by ALCs utilizing data from the Kendall (2008)
survey. Lastly, a detailed comparison of the two surveys, Sullivan (2006) and Kendall
(2008), is presented. If an individual failed to answer a portion of the survey or if the
individual did not identify their respective ALC contacted, that response was not included
in the analysis.
Survey Demographics
A total of thirty-six hundred and seventy-one surveys were distributed by
electronic-mail and fifteen hundred and sixty were returned due to incorrect addresses,
recipients being out of the office, and anti-spamming or anti-virus protocols. At the
conclusion of the survey, three hundred and two responses were received and twenty-
three responses were discarded due to incomplete responses. Additionally, eleven
respondents indicated that the survey was not applicable to them. After accounting for all
returns and incomplete responses the overall response rate was thirteen percent. No
participants responded that they had problems or issues with the actual survey.
26
How did the ALCs perform based on the data collected from the Kendall (2008) survey?
The purpose of this section of the chapter is to present frequency distributions
which provide a graphical representation, designed to convey the results of the survey
and how the ALCs performed based on the criteria selected by AFMC’s A4 Logistics
division, based on the data collected from the Kendall (2008) survey. This section seeks
to answer the following research investigative question:
1. How are the ALCs performing based on the data collected from the Kendall
(2008) survey criteria that were developed by AFMC’s A4 Logistics division?
The graphical representation of the frequency distributions for this section stands alone to
present the results; however, highlights and a brief commentary are provided at the
beginning of each segment.
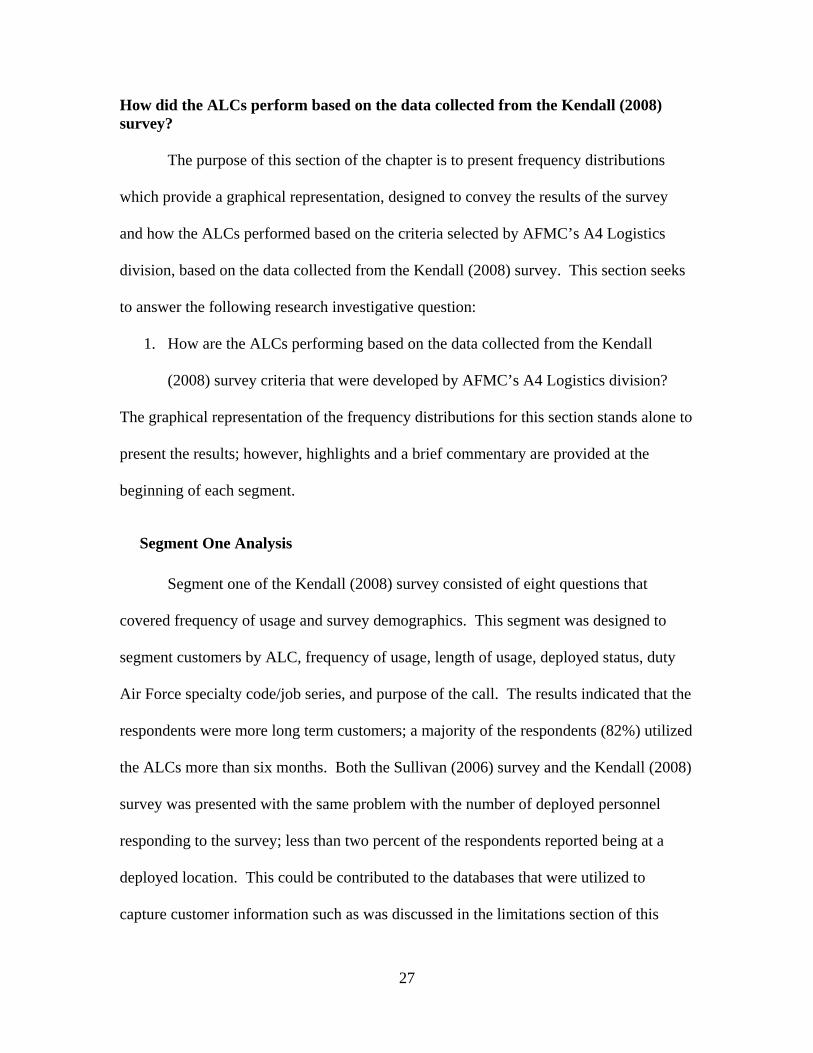
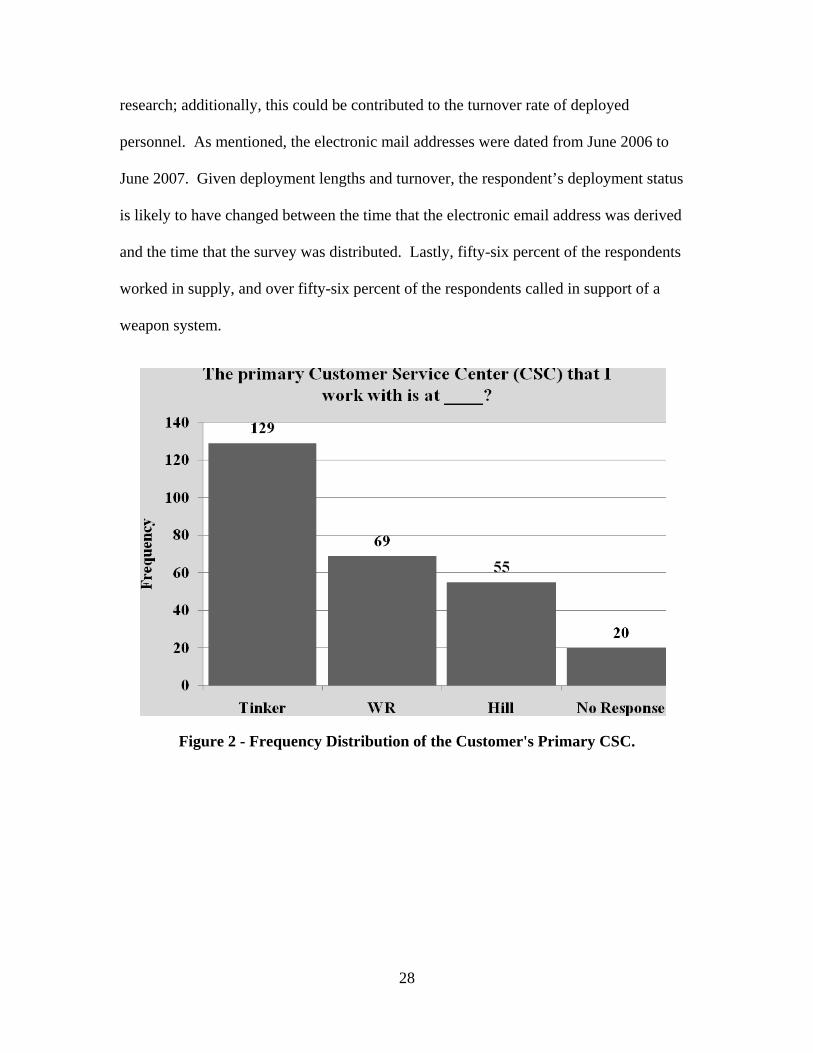
Segment One Analysis
Segment one of the Kendall (2008) survey consisted of eight questions that
covered frequency of usage and survey demographics. This segment was designed to
segment customers by ALC, frequency of usage, length of usage, deployed status, duty
Air Force specialty code/job series, and purpose of the call. The results indicated that the
respondents were more long term customers; a majority of the respondents (82%) utilized
the ALCs more than six months. Both the Sullivan (2006) survey and the Kendall (2008)
survey was presented with the same problem with the number of deployed personnel
responding to the survey; less than two percent of the respondents reported being at a
deployed location. This could be contributed to the databases that were utilized to
capture customer information such as was discussed in the limitations section of this
27
research; additionally, this could be contributed to the turnover rate of deployed
personnel. As mentioned, the electronic mail addresses were dated from June 2006 to
June 2007. Given deployment lengths and turnover, the respondent’s deployment status
is likely to have changed between the time that the electronic email address was derived
and the time that the survey was distributed. Lastly, fifty-six percent of the respondents
worked in supply, and over fifty-six percent of the respondents called in support of a
weapon system.
Figure 2 - Frequency Distribution of the Customer's Primary CSC.
28
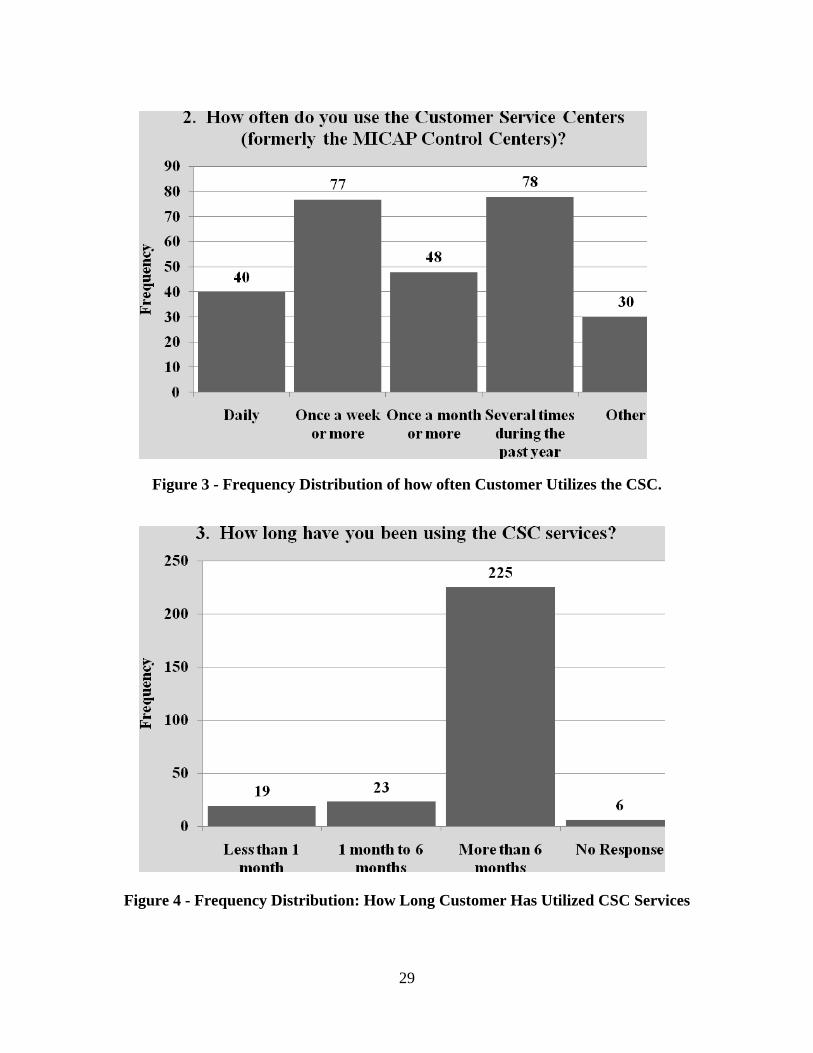
Figure 3 - Frequency Distribution of how often Customer Utilizes the CSC.
Figure 4 - Frequency Distribution: How Long Customer Has Utilized CSC Services
29
Figure 5 - Frequency Distribution of Customer's Deployed Status
Figure 6 - Frequency Distribution of Customer's Duty AFSC/Job Series.
30
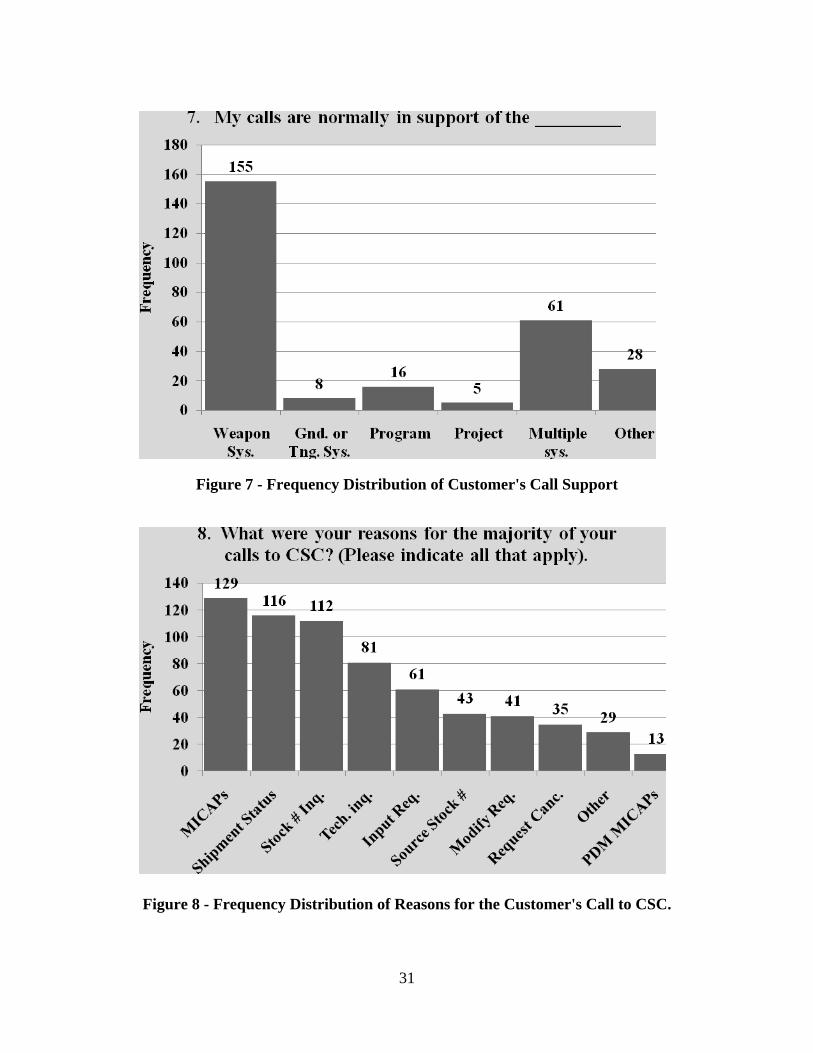
Figure 7 - Frequency Distribution of Customer's Call Support
Figure 8 - Frequency Distribution of Reasons for the Customer's Call to CSC.
31
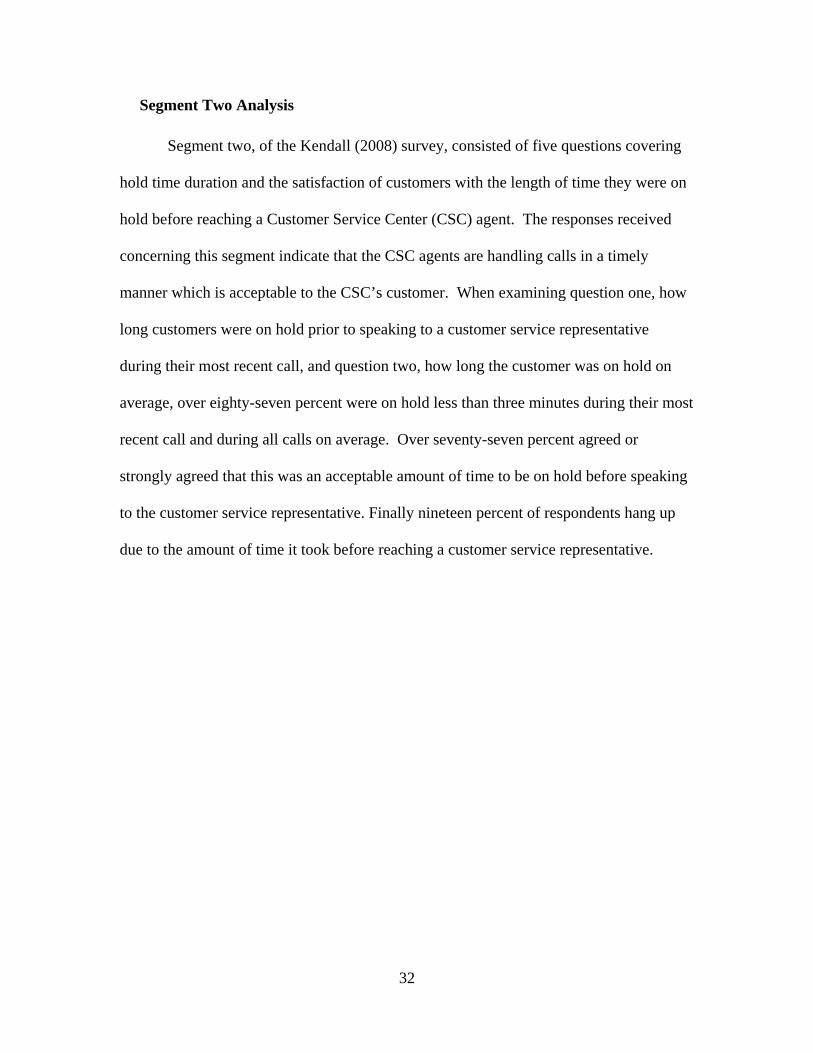
Segment Two Analysis
Segment two, of the Kendall (2008) survey, consisted of five questions covering
hold time duration and the satisfaction of customers with the length of time they were on
hold before reaching a Customer Service Center (CSC) agent. The responses received
concerning this segment indicate that the CSC agents are handling calls in a timely
manner which is acceptable to the CSC’s customer. When examining question one, how
long customers were on hold prior to speaking to a customer service representative
during their most recent call, and question two, how long the customer was on hold on
average, over eighty-seven percent were on hold less than three minutes during their most
recent call and during all calls on average. Over seventy-seven percent agreed or
strongly agreed that this was an acceptable amount of time to be on hold before speaking
to the customer service representative. Finally nineteen percent of respondents hang up
due to the amount of time it took before reaching a customer service representative.
32
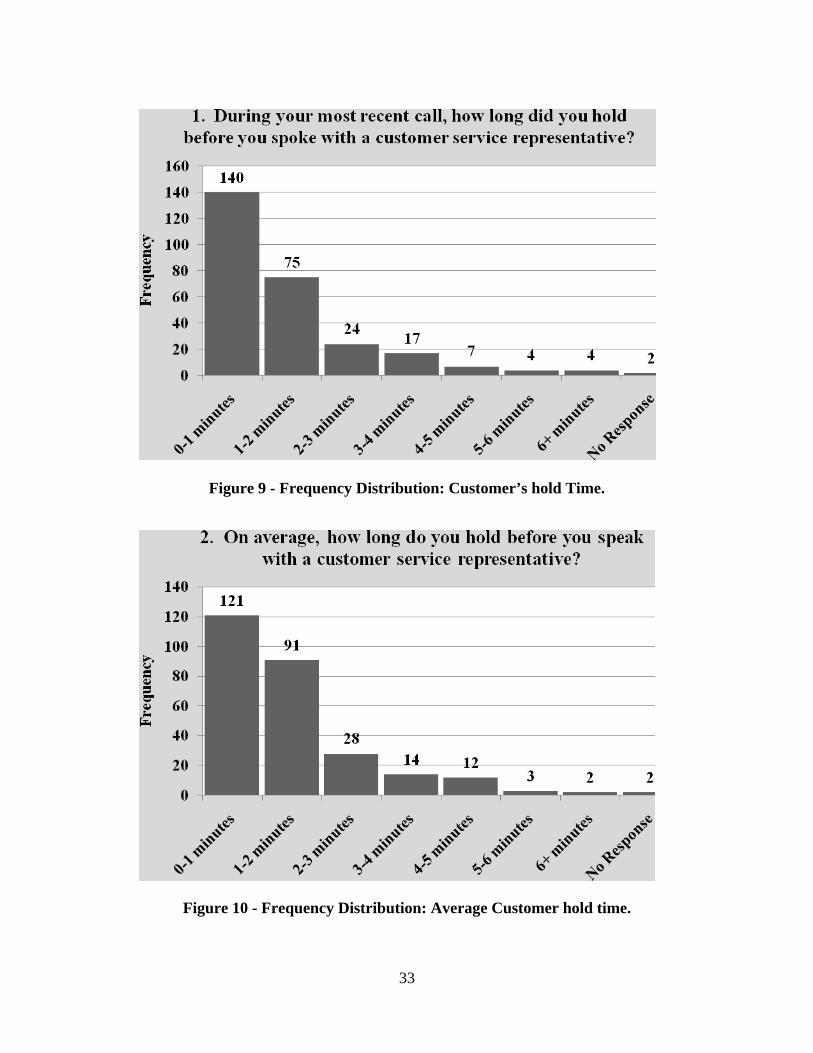
Figure 9 - Frequency Distribution: Customer’s hold Time.
Figure 10 - Frequency Distribution: Average Customer hold time.
33
Figure 11 - Frequency Distribution of Acceptable Wait Times.
Figure 12 - Frequency Distribution of How Often Customer Hangs Up.
34
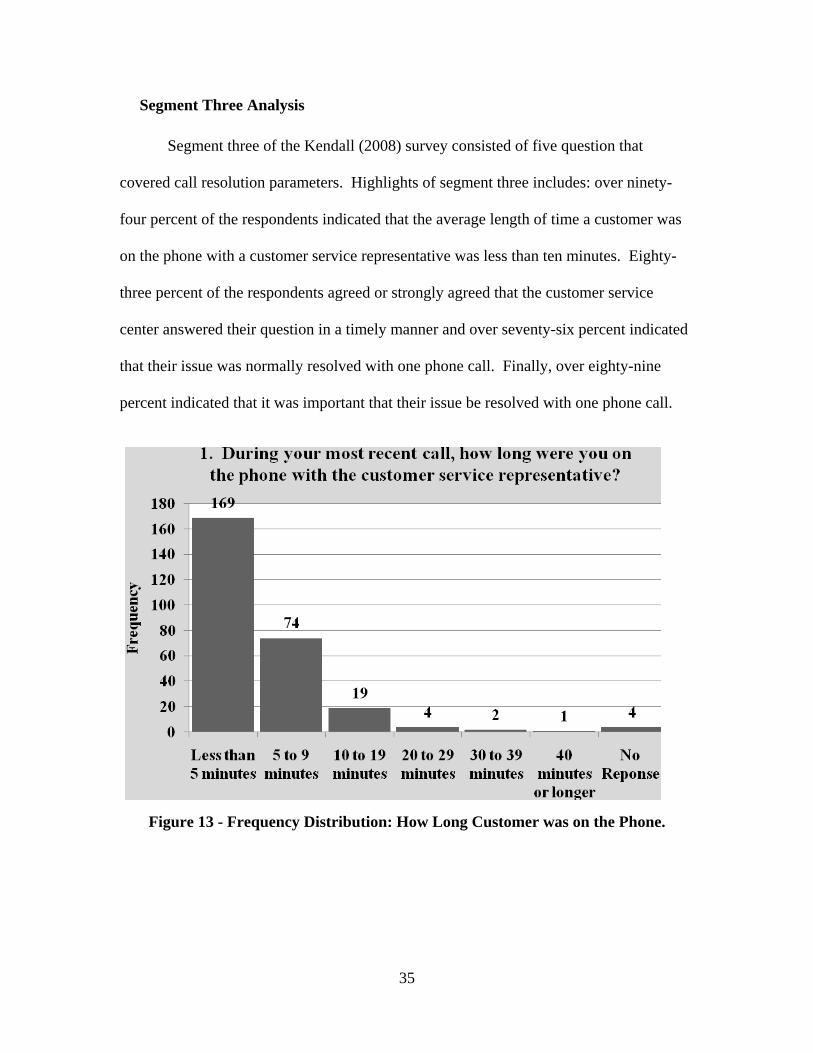
Segment Three Analysis
Segment three of the Kendall (2008) survey consisted of five question that
covered call resolution parameters. Highlights of segment three includes: over ninety-
four percent of the respondents indicated that the average length of time a customer was
on the phone with a customer service representative was less than ten minutes. Eighty-
three percent of the respondents agreed or strongly agreed that the customer service
center answered their question in a timely manner and over seventy-six percent indicated
that their issue was normally resolved with one phone call. Finally, over eighty-nine
percent indicated that it was important that their issue be resolved with one phone call.
Figure 13 - Frequency Distribution: How Long Customer was on the Phone.
35
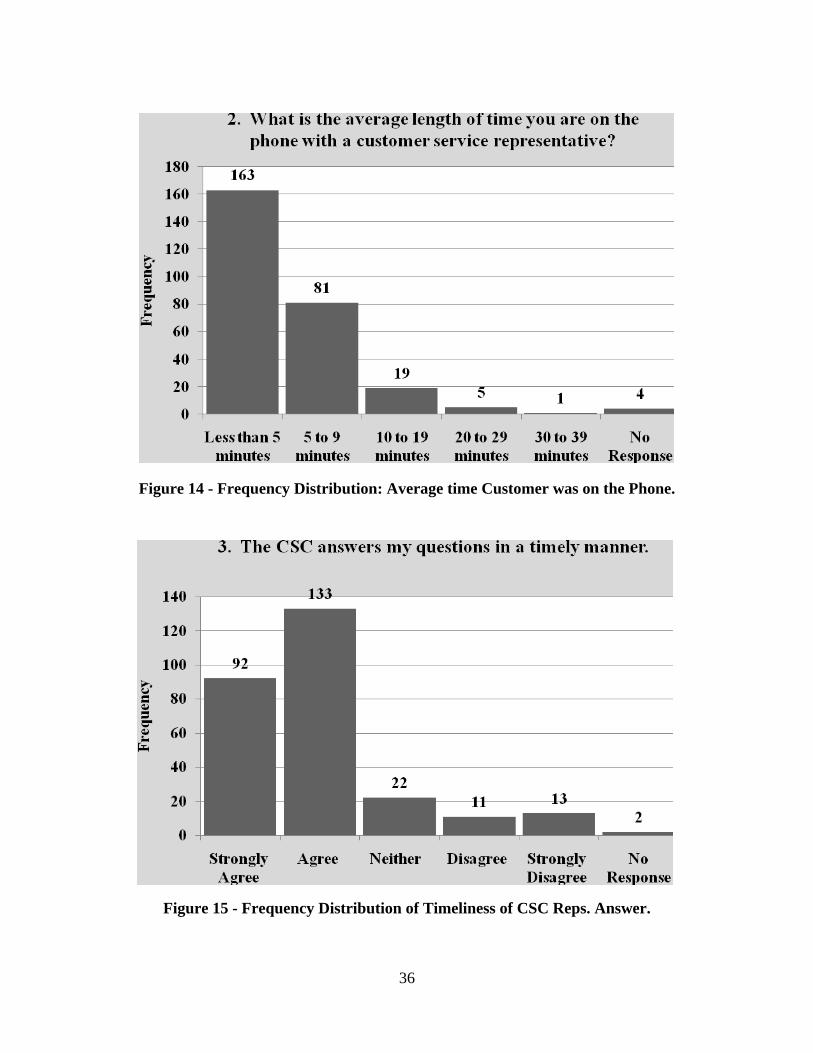
Figure 14 - Frequency Distribution: Average time Customer was on the Phone.
Figure 15 - Frequency Distribution of Timeliness of CSC Reps. Answer.
36
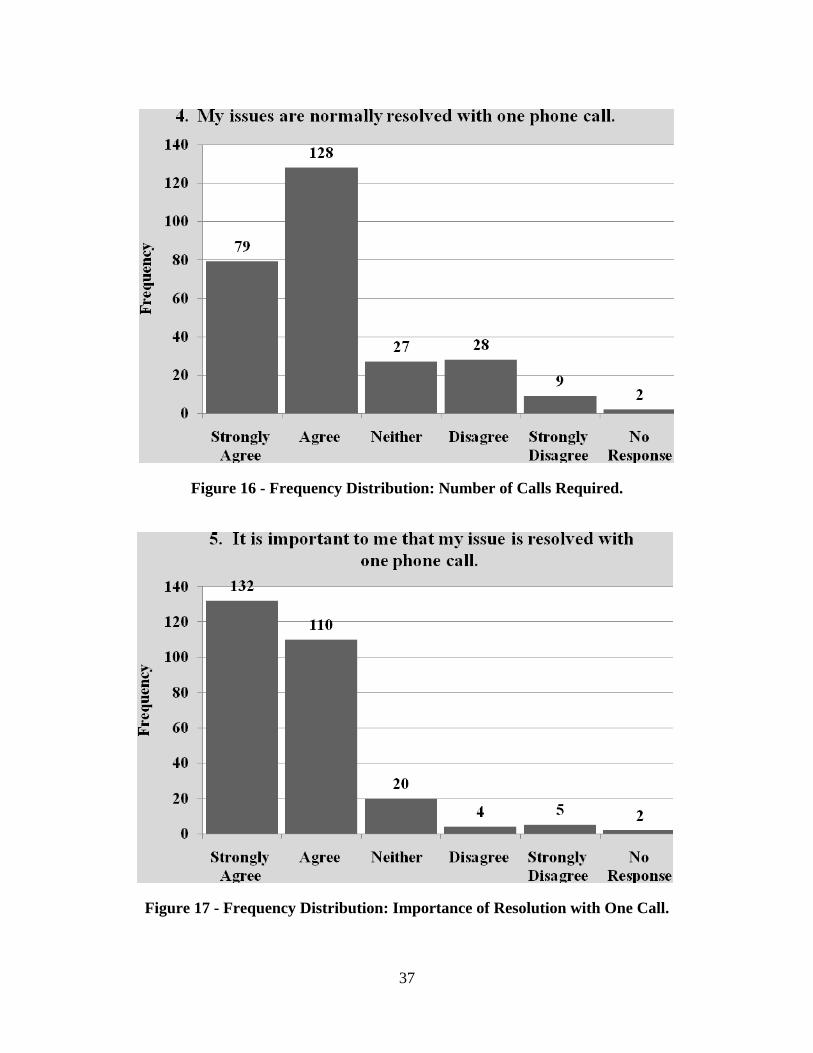
Figure 16 - Frequency Distribution: Number of Calls Required.
Figure 17 - Frequency Distribution: Importance of Resolution with One Call.
37
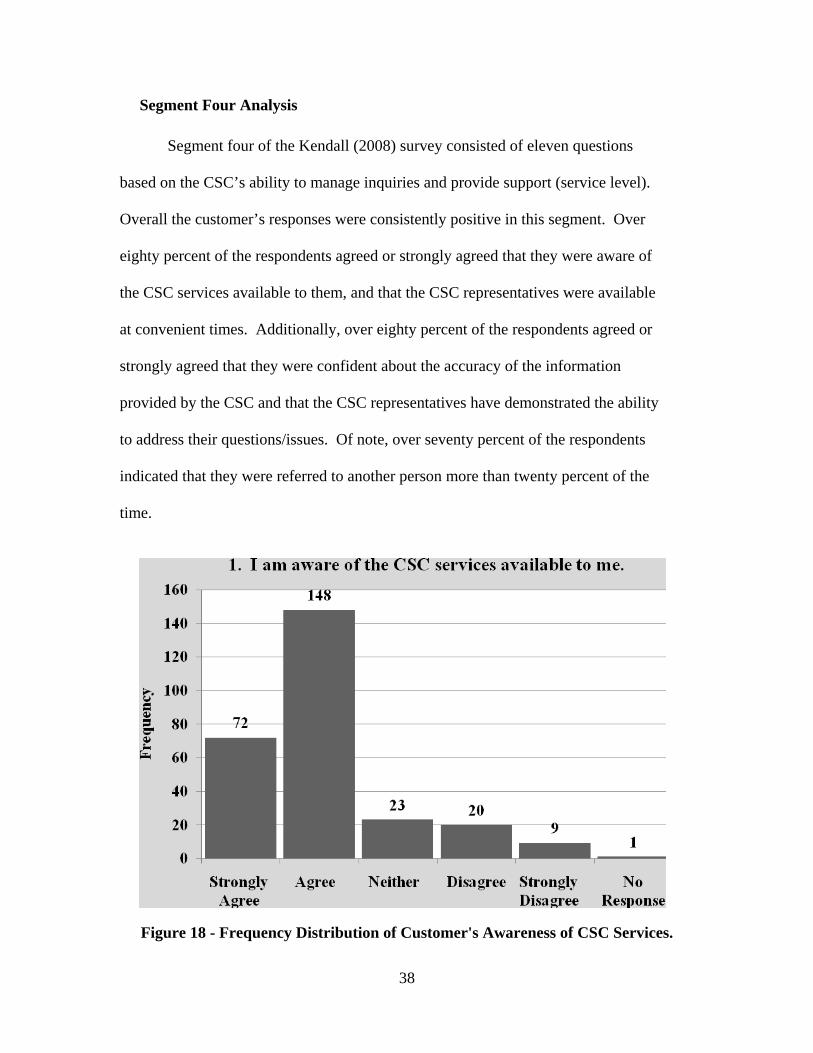
Segment Four Analysis
Segment four of the Kendall (2008) survey consisted of eleven questions
based on the CSC’s ability to manage inquiries and provide support (service level).
Overall the customer’s responses were consistently positive in this segment. Over
eighty percent of the respondents agreed or strongly agreed that they were aware of
the CSC services available to them, and that the CSC representatives were available
at convenient times. Additionally, over eighty percent of the respondents agreed or
strongly agreed that they were confident about the accuracy of the information
provided by the CSC and that the CSC representatives have demonstrated the ability
to address their questions/issues. Of note, over seventy percent of the respondents
indicated that they were referred to another person more than twenty percent of the
time.
Figure 18 - Frequency Distribution of Customer's Awareness of CSC Services.
38
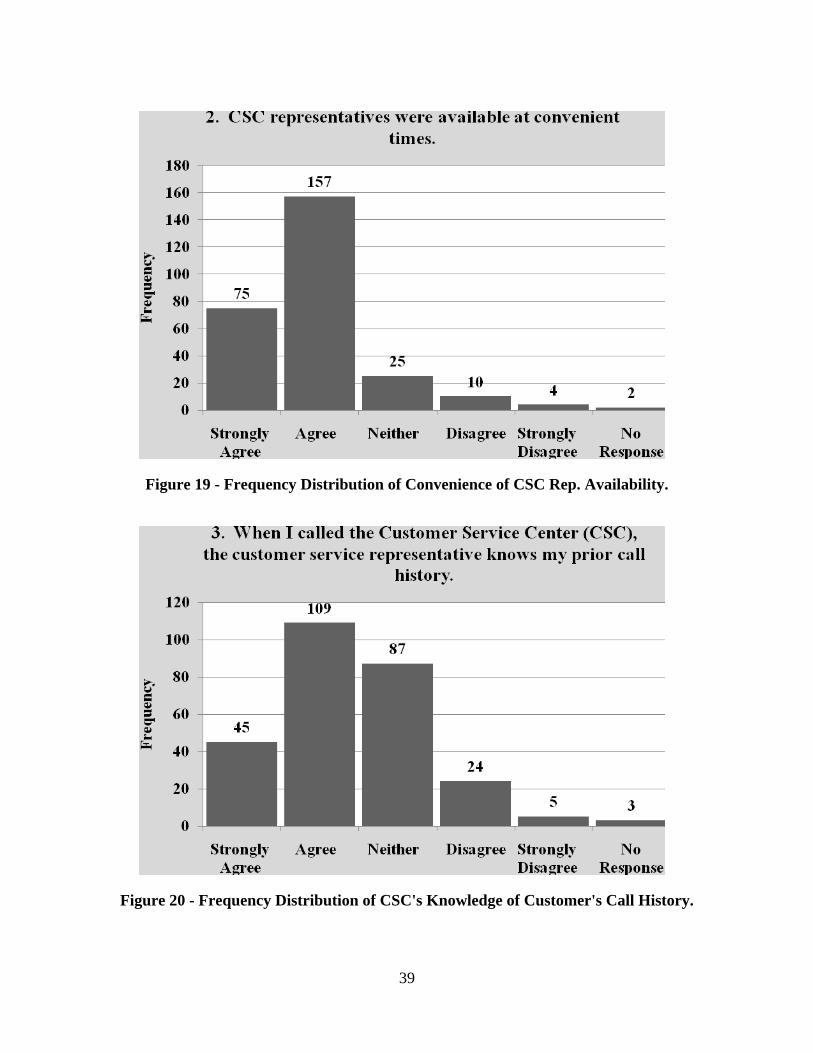
Figure 19 - Frequency Distribution of Convenience of CSC Rep. Availability.
Figure 20 - Frequency Distribution of CSC's Knowledge of Customer's Call History.
39
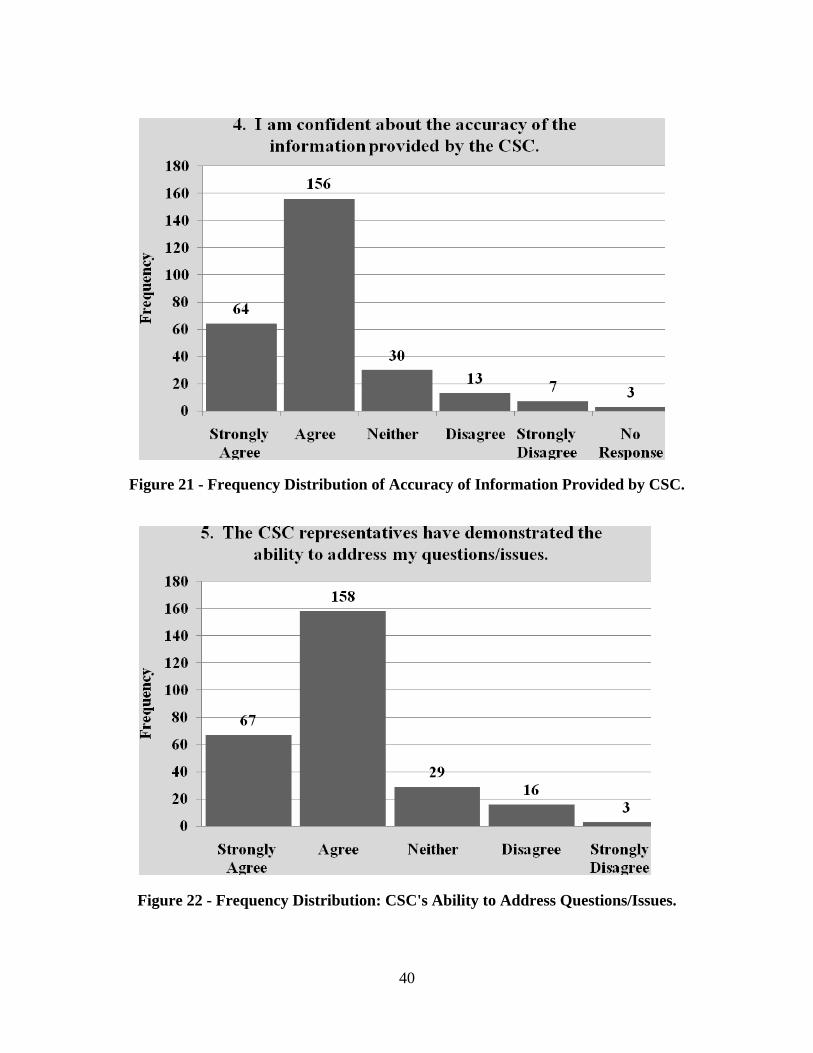
Figure 21 - Frequency Distribution of Accuracy of Information Provided by CSC.
Figure 22 - Frequency Distribution: CSC's Ability to Address Questions/Issues.
40
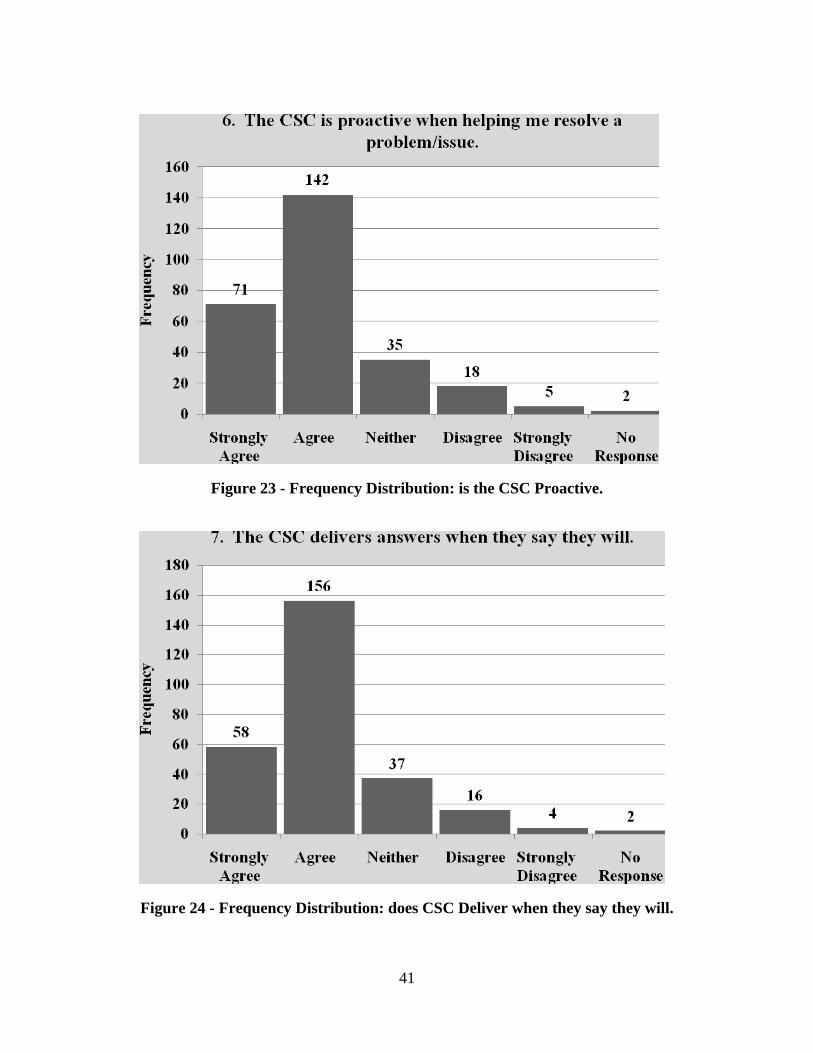
Figure 23 - Frequency Distribution: is the CSC Proactive.
Figure 24 - Frequency Distribution: does CSC Deliver when they say they will.
41
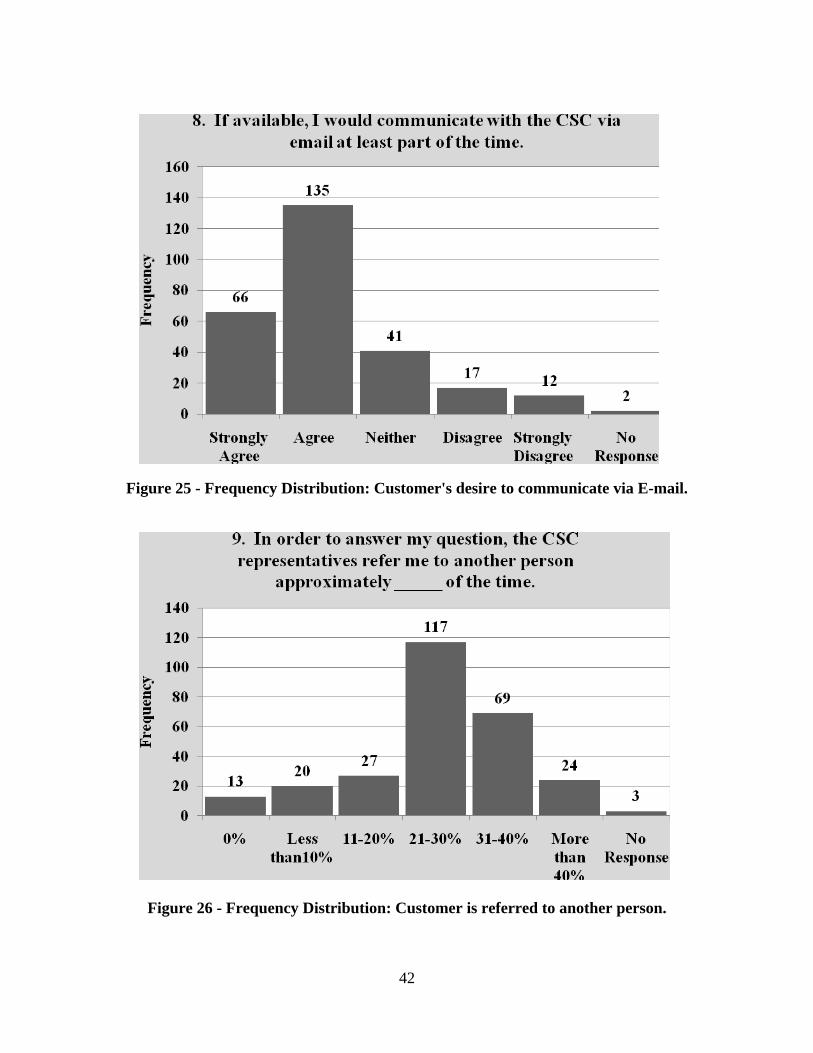
Figure 25 - Frequency Distribution: Customer's desire to communicate via E-mail.
Figure 26 - Frequency Distribution: Customer is referred to another person.
42
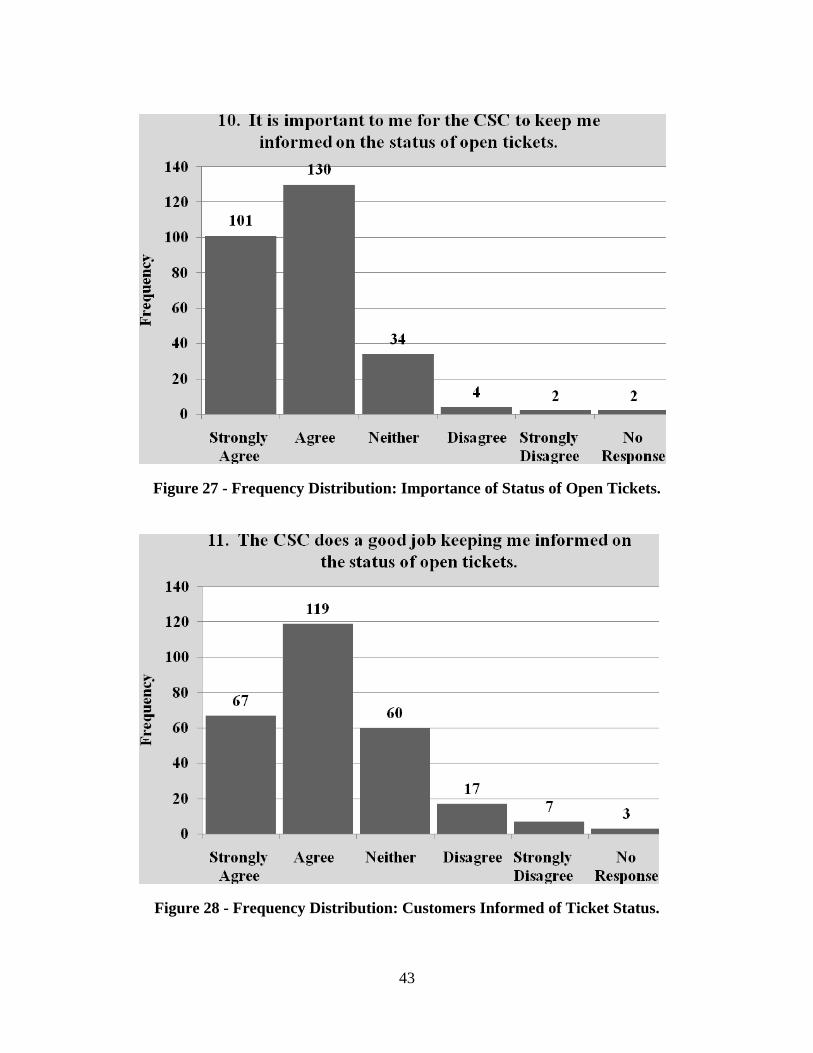
Figure 27 - Frequency Distribution: Importance of Status of Open Tickets.
Figure 28 - Frequency Distribution: Customers Informed of Ticket Status.
43
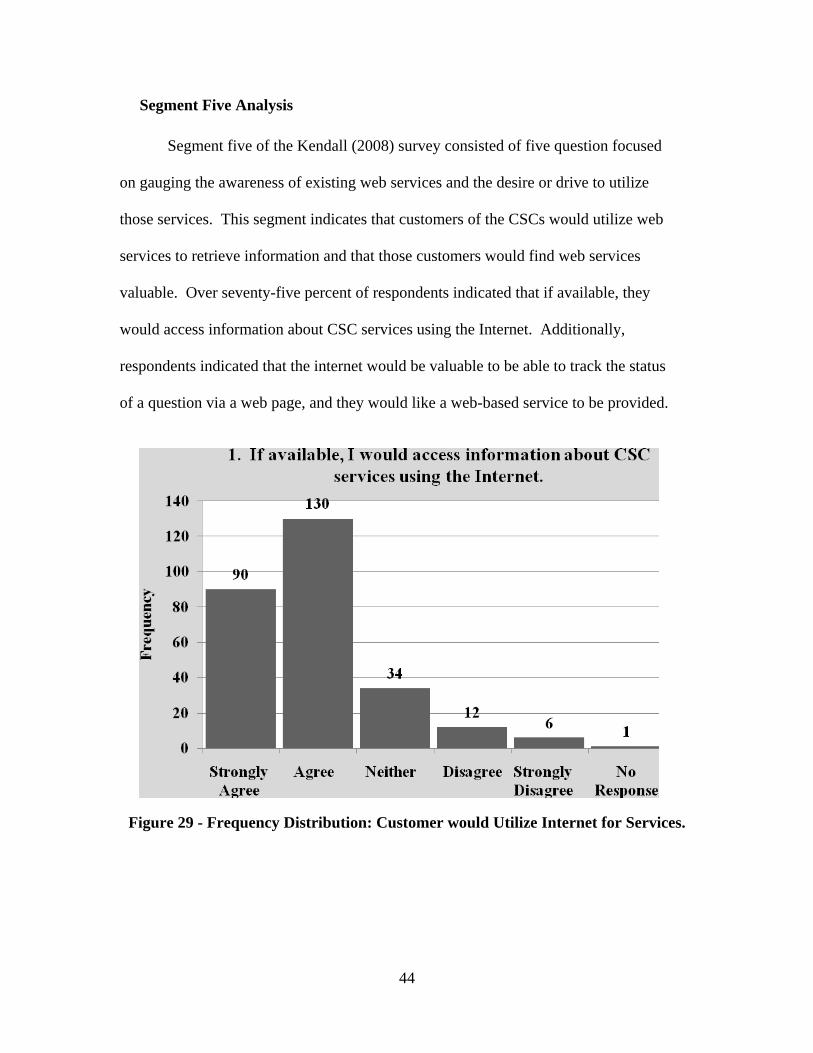
Segment Five Analysis
Segment five of the Kendall (2008) survey consisted of five question focused
on gauging the awareness of existing web services and the desire or drive to utilize
those services. This segment indicates that customers of the CSCs would utilize web
services to retrieve information and that those customers would find web services
valuable. Over seventy-five percent of respondents indicated that if available, they
would access information about CSC services using the Internet. Additionally,
respondents indicated that the internet would be valuable to be able to track the status
of a question via a web page, and they would like a web-based service to be provided.
Figure 29 - Frequency Distribution: Customer would Utilize Internet for Services.
44
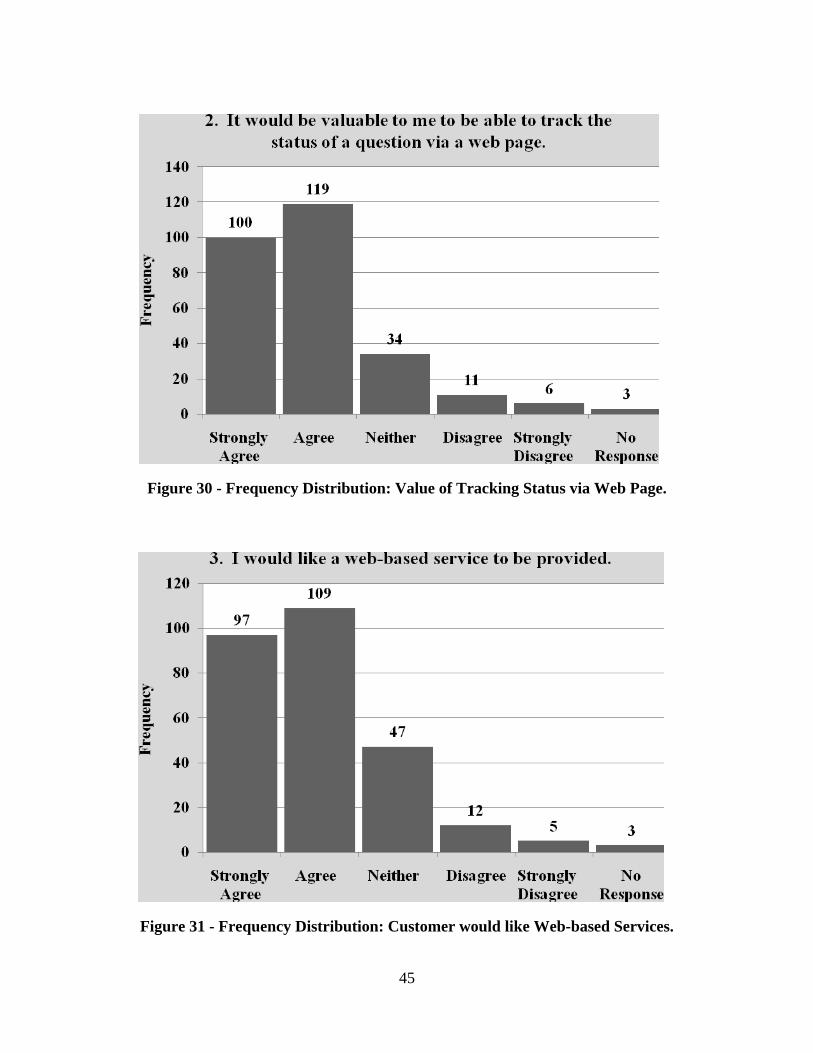
Figure 30 - Frequency Distribution: Value of Tracking Status via Web Page.
Figure 31 - Frequency Distribution: Customer would like Web-based Services.
45
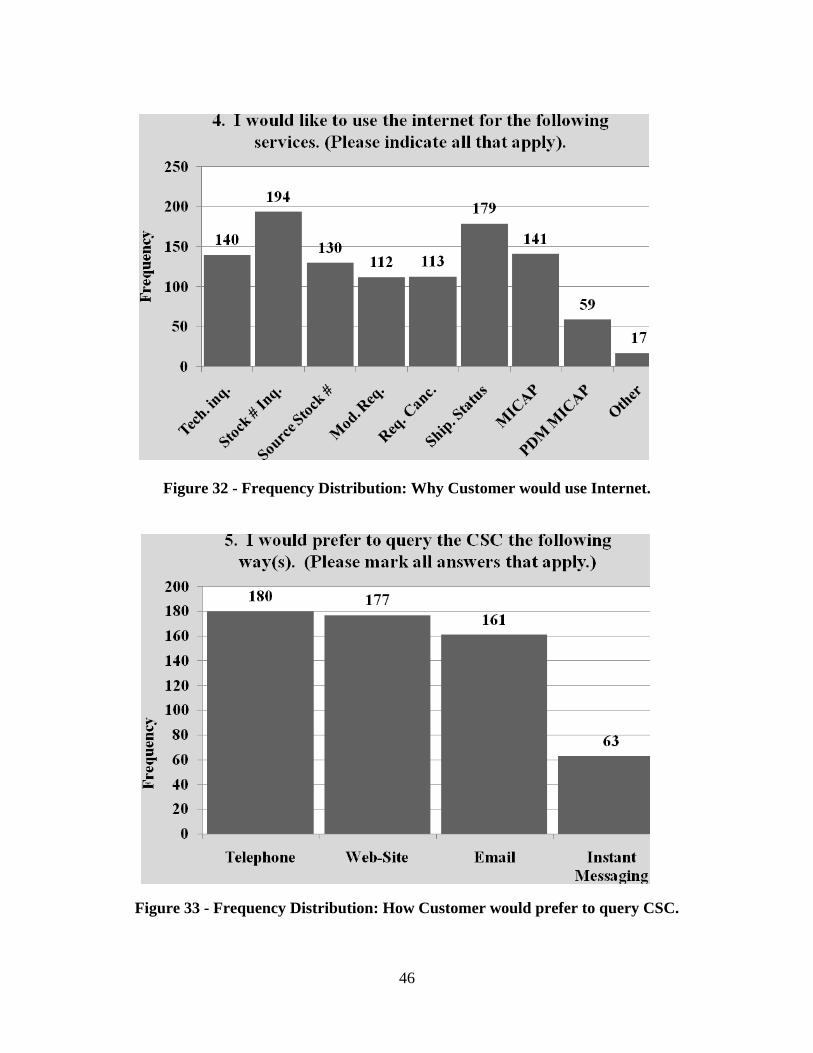
Figure 32 - Frequency Distribution: Why Customer would use Internet.
Figure 33 - Frequency Distribution: How Customer would prefer to query CSC.
46
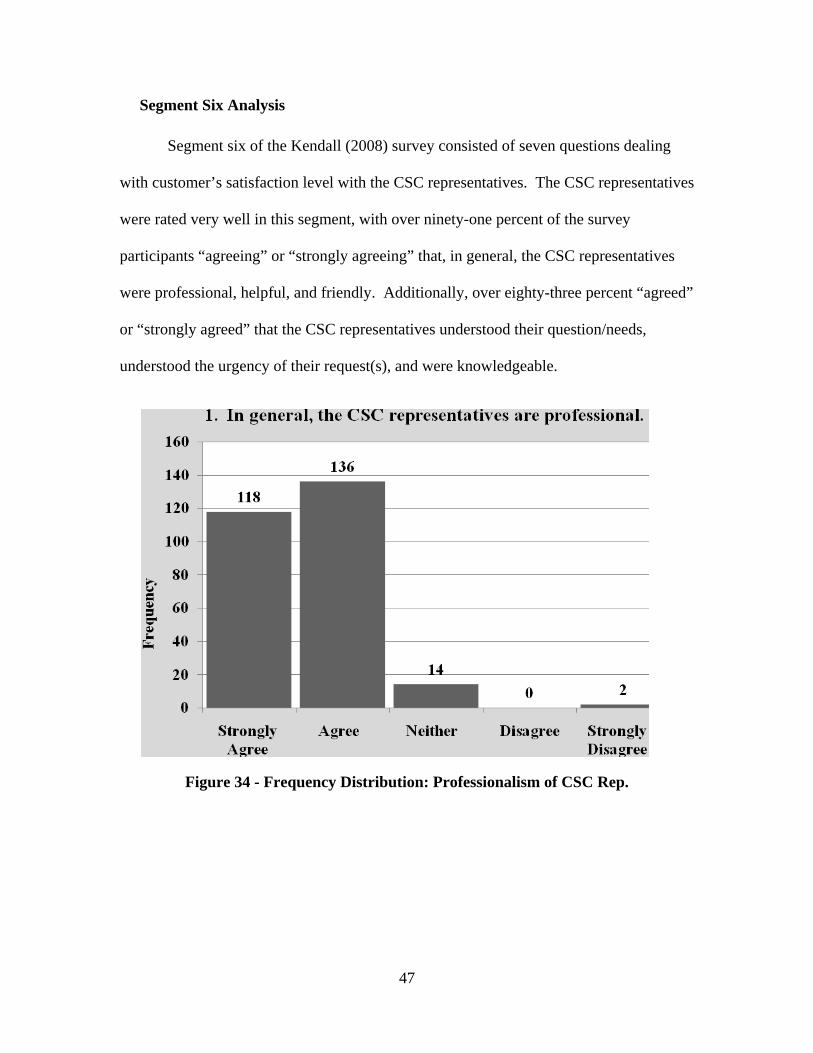
Segment Six Analysis Segment six of the Kendall (2008) survey consisted of seven questions dealing
with customer’s satisfaction level with the CSC representatives. The CSC representatives
were rated very well in this segment, with over ninety-one percent of the survey
participants “agreeing” or “strongly agreeing” that, in general, the CSC representatives
were professional, helpful, and friendly. Additionally, over eighty-three percent “agreed”
or “strongly agreed” that the CSC representatives understood their question/needs,
understood the urgency of their request(s), and were knowledgeable.
Figure 34 - Frequency Distribution: Professionalism of CSC Rep.
47
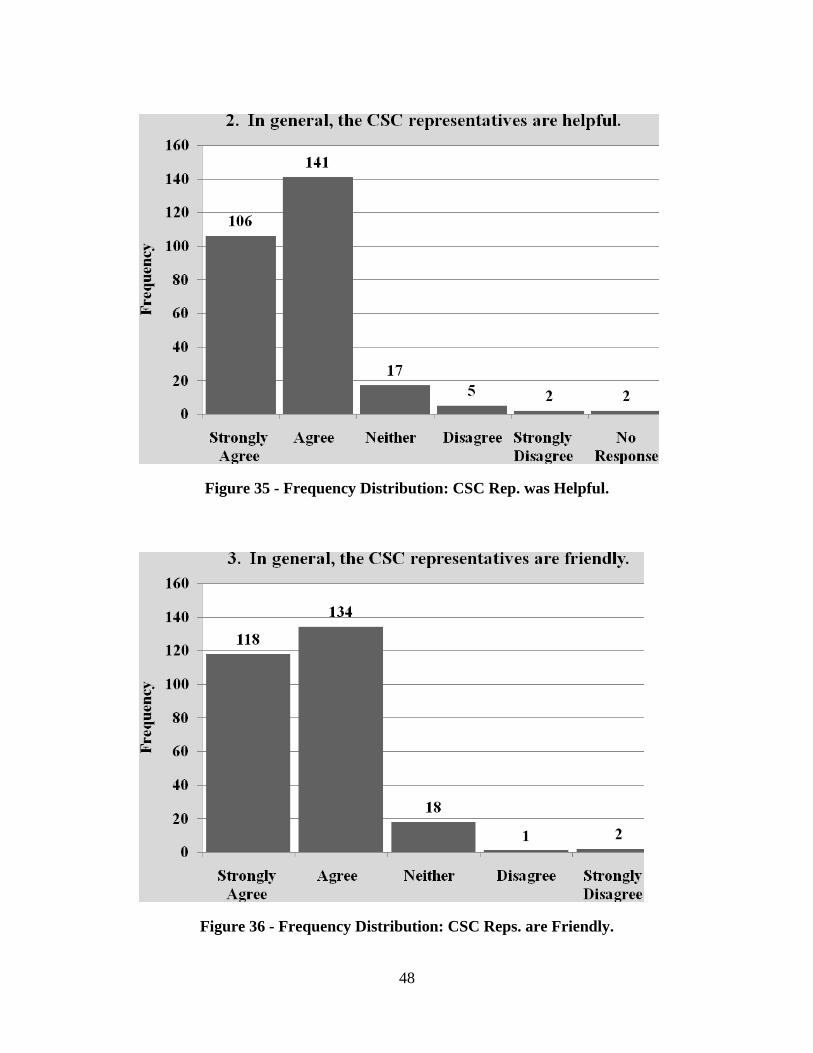
Figure 35 - Frequency Distribution: CSC Rep. was Helpful.
Figure 36 - Frequency Distribution: CSC Reps. are Friendly.
48
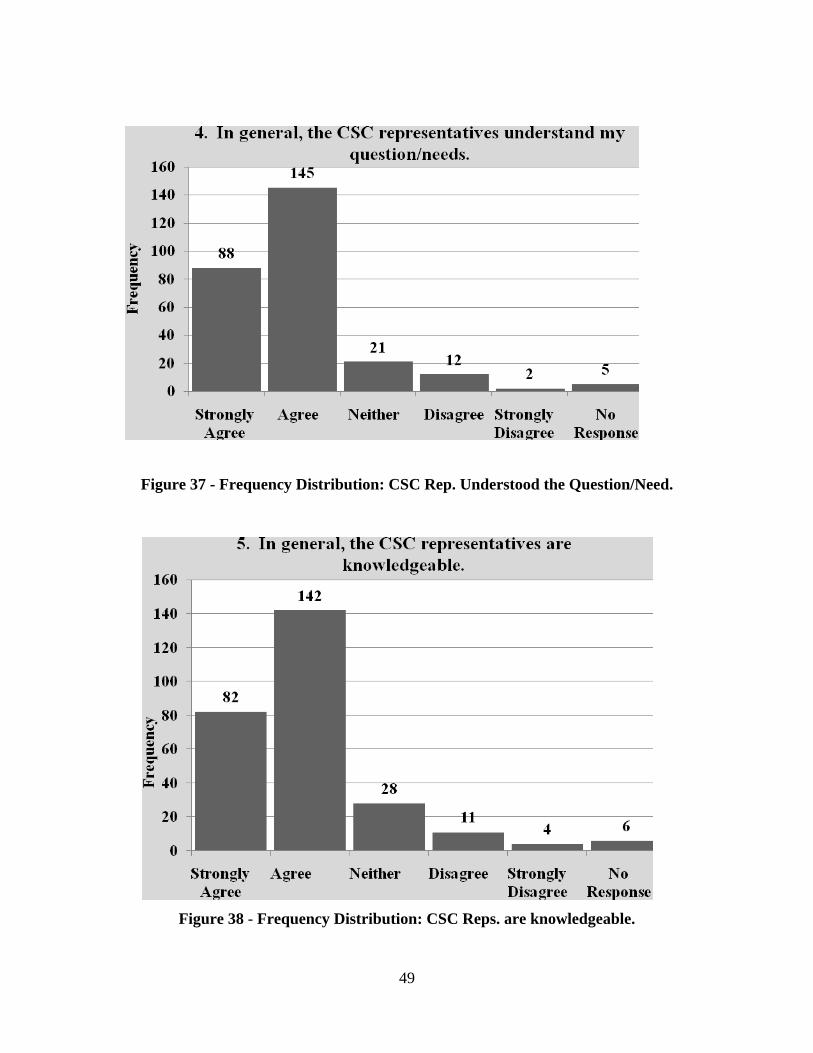
Figure 37 - Frequency Distribution: CSC Rep. Understood the Question/Need.
Figure 38 - Frequency Distribution: CSC Reps. are knowledgeable.
49
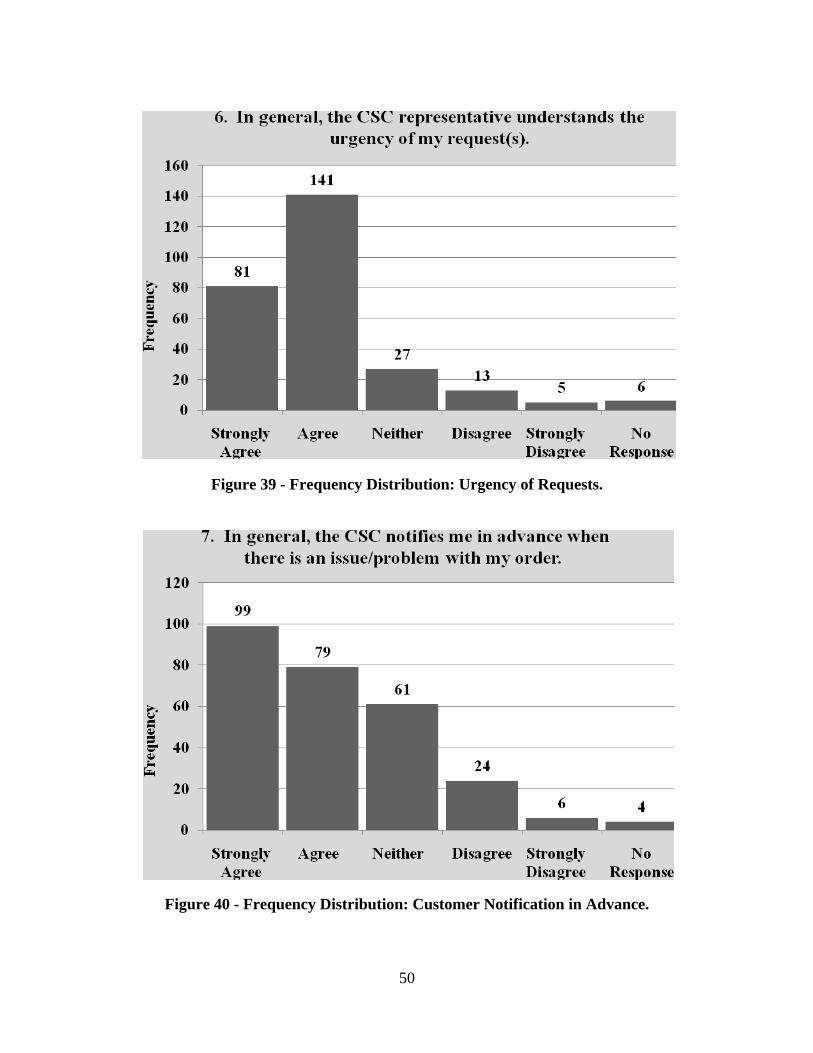
Figure 39 - Frequency Distribution: Urgency of Requests.
Figure 40 - Frequency Distribution: Customer Notification in Advance.
50
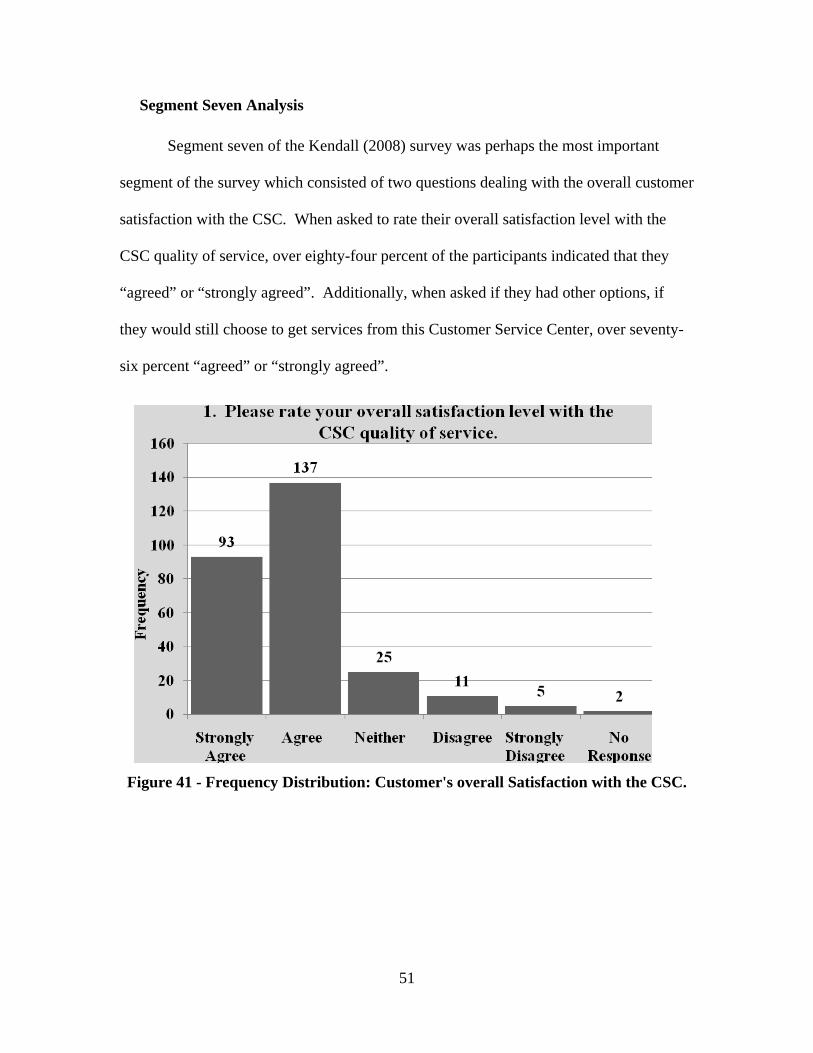
Segment Seven Analysis
Segment seven of the Kendall (2008) survey was perhaps the most important
segment of the survey which consisted of two questions dealing with the overall customer
satisfaction with the CSC. When asked to rate their overall satisfaction level with the
CSC quality of service, over eighty-four percent of the participants indicated that they
“agreed” or “strongly agreed”. Additionally, when asked if they had other options, if
they would still choose to get services from this Customer Service Center, over seventy-
six percent “agreed” or “strongly agreed”.
Figure 41 - Frequency Distribution: Customer's overall Satisfaction with the CSC.
51
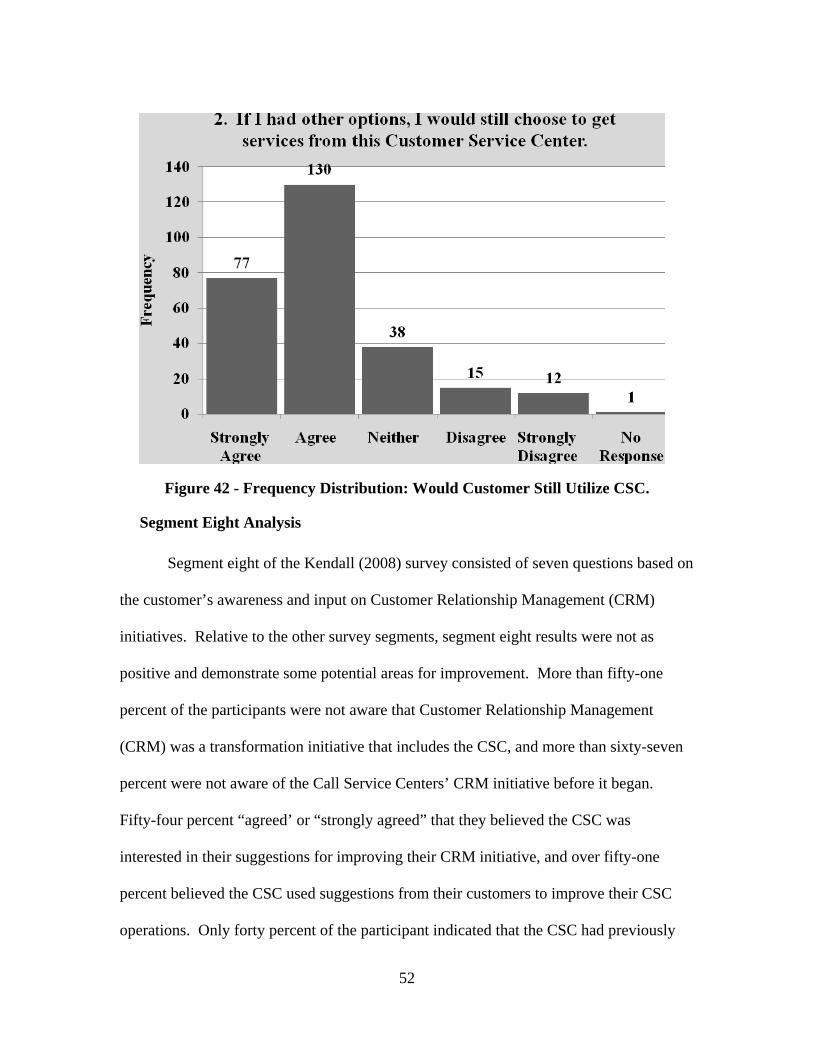
Figure 42 - Frequency Distribution: Would Customer Still Utilize CSC.
Segment Eight Analysis
Segment eight of the Kendall (2008) survey consisted of seven questions based on
the customer’s awareness and input on Customer Relationship Management (CRM)
initiatives. Relative to the other survey segments, segment eight results were not as
positive and demonstrate some potential areas for improvement. More than fifty-one
percent of the participants were not aware that Customer Relationship Management
(CRM) was a transformation initiative that includes the CSC, and more than sixty-seven
percent were not aware of the Call Service Centers’ CRM initiative before it began.
Fifty-four percent “agreed’ or “strongly agreed” that they believed the CSC was
interested in their suggestions for improving their CRM initiative, and over fifty-one
percent believed the CSC used suggestions from their customers to improve their CSC
operations. Only forty percent of the participant indicated that the CSC had previously
52
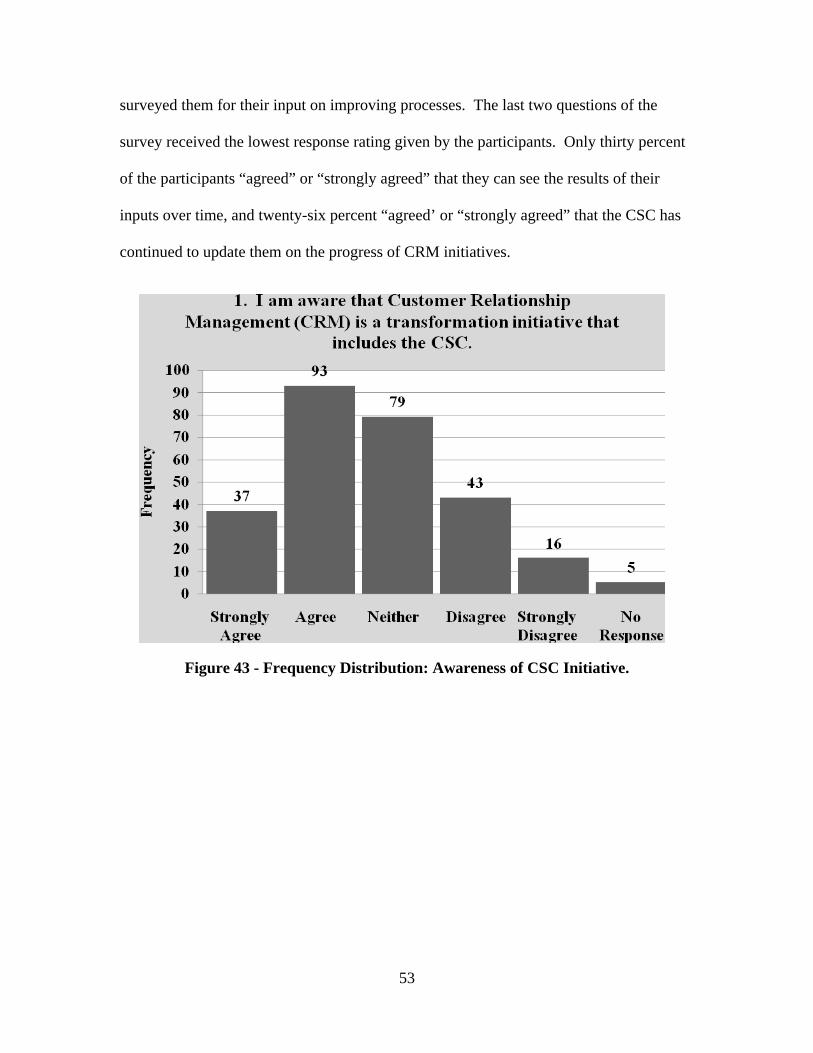
surveyed them for their input on improving processes. The last two questions of the
survey received the lowest response rating given by the participants. Only thirty percent
of the participants “agreed” or “strongly agreed” that they can see the results of their
inputs over time, and twenty-six percent “agreed’ or “strongly agreed” that the CSC has
continued to update them on the progress of CRM initiatives.
Figure 43 - Frequency Distribution: Awareness of CSC Initiative.
53
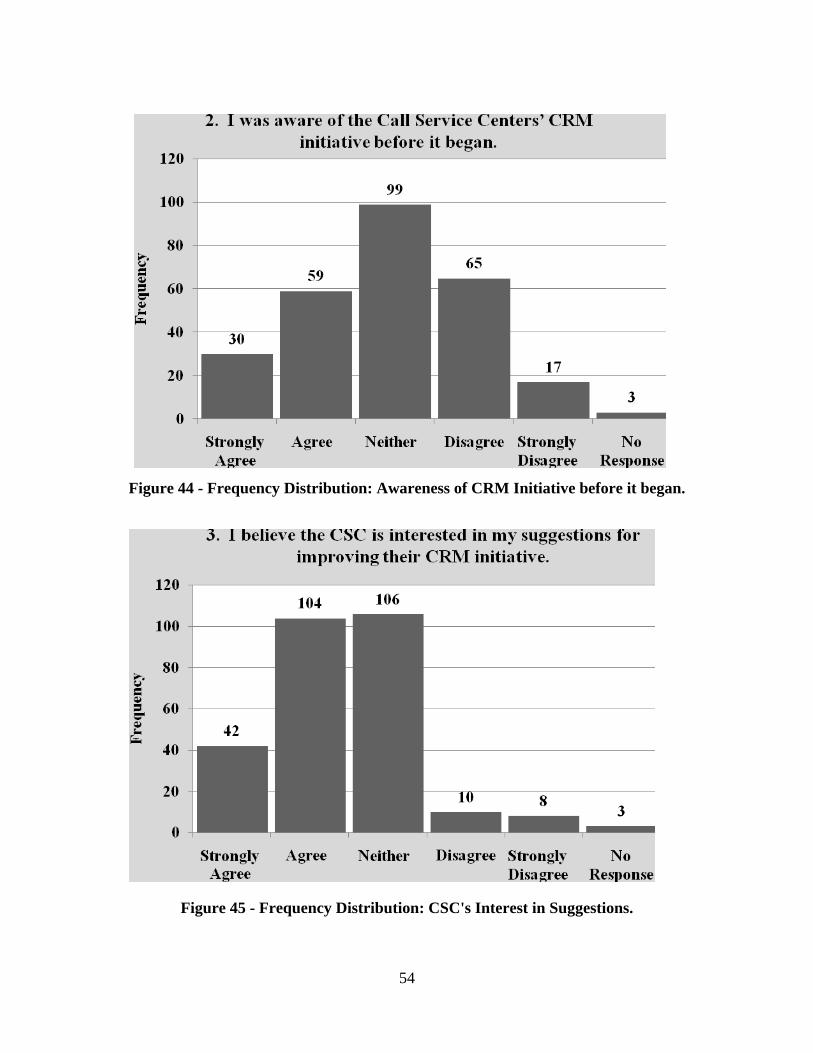
Figure 44 - Frequency Distribution: Awareness of CRM Initiative before it began.
Figure 45 - Frequency Distribution: CSC's Interest in Suggestions.
54
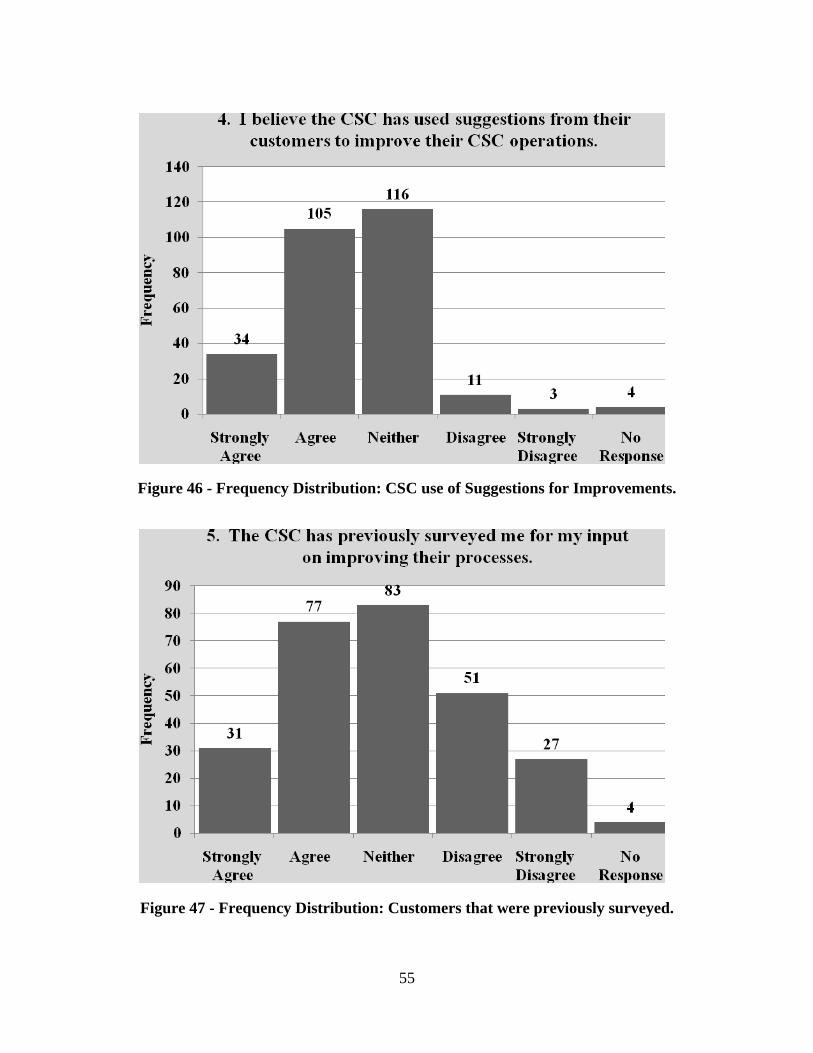
Figure 46 - Frequency Distribution: CSC use of Suggestions for Improvements.
Figure 47 - Frequency Distribution: Customers that were previously surveyed.
55
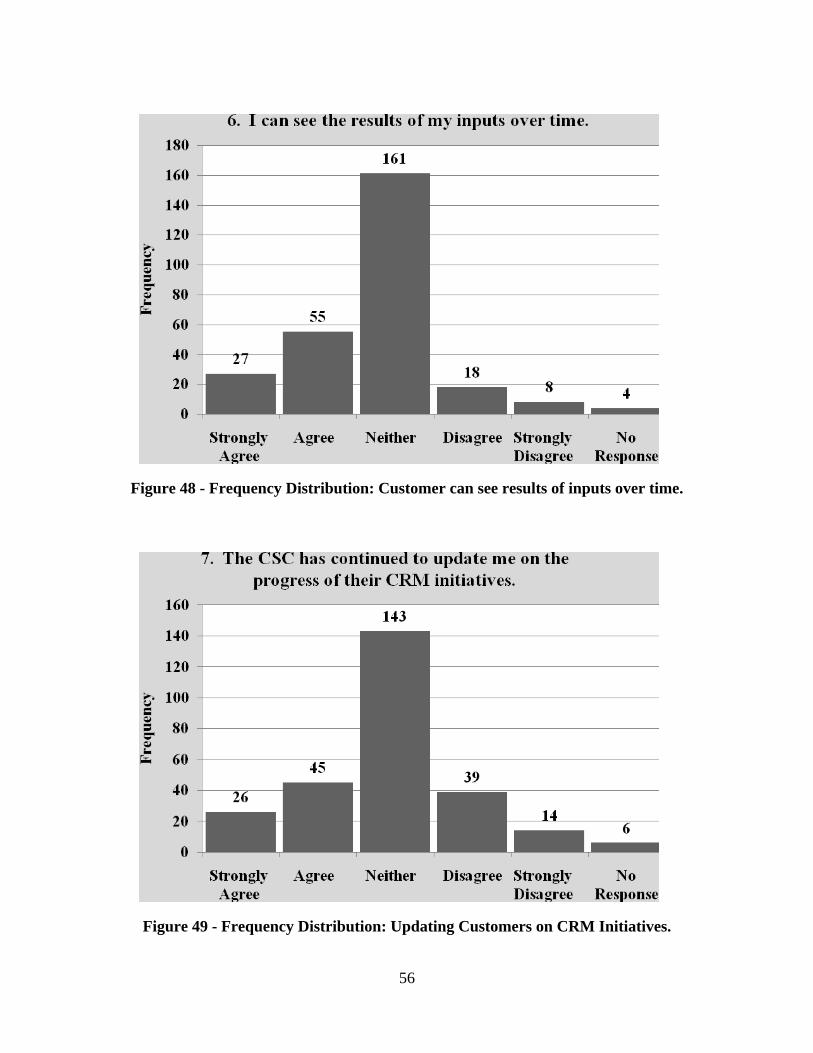
Figure 48 - Frequency Distribution: Customer can see results of inputs over time.
Figure 49 - Frequency Distribution: Updating Customers on CRM Initiatives.
56
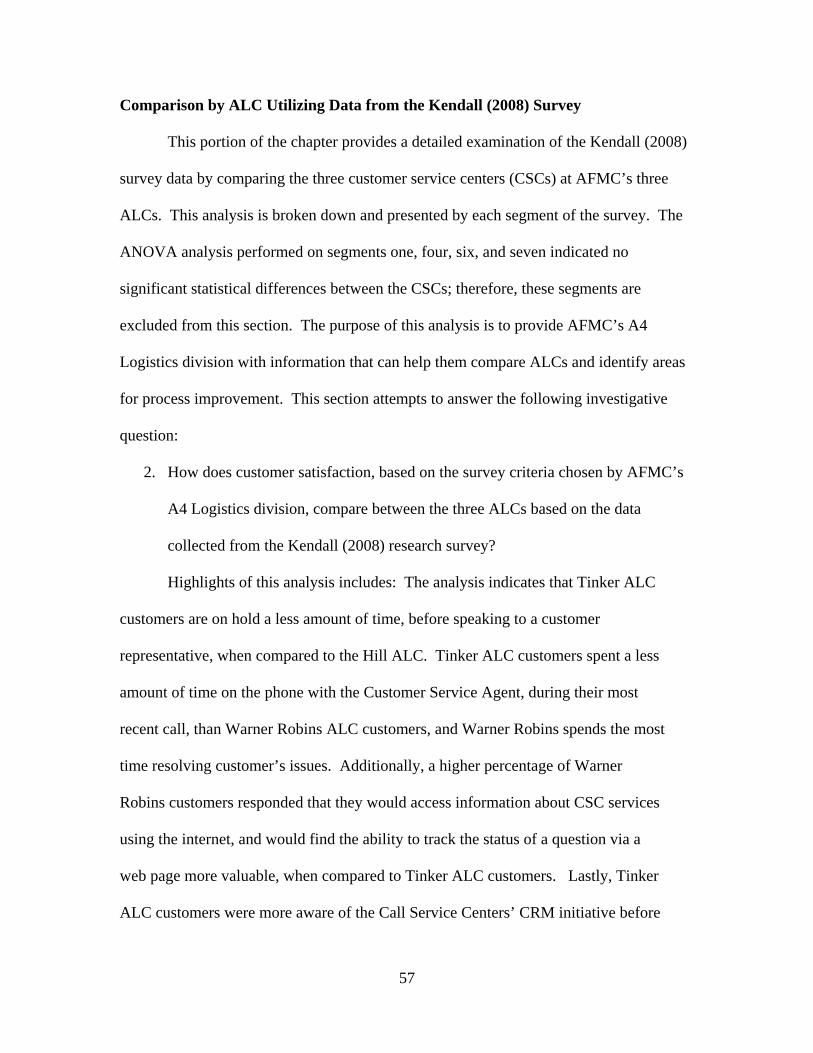
Comparison by ALC Utilizing Data from the Kendall (2008) Survey
This portion of the chapter provides a detailed examination of the Kendall (2008)
survey data by comparing the three customer service centers (CSCs) at AFMC’s three
ALCs. This analysis is broken down and presented by each segment of the survey. The
ANOVA analysis performed on segments one, four, six, and seven indicated no
significant statistical differences between the CSCs; therefore, these segments are
excluded from this section. The purpose of this analysis is to provide AFMC’s A4
Logistics division with information that can help them compare ALCs and identify areas
for process improvement. This section attempts to answer the following investigative
question:
2. How does customer satisfaction, based on the survey criteria chosen by AFMC’s
A4 Logistics division, compare between the three ALCs based on the data
collected from the Kendall (2008) research survey?
Highlights of this analysis includes: The analysis indicates that Tinker ALC
customers are on hold a less amount of time, before speaking to a customer
representative, when compared to the Hill ALC. Tinker ALC customers spent a less
amount of time on the phone with the Customer Service Agent, during their most
recent call, than Warner Robins ALC customers, and Warner Robins spends the most
time resolving customer’s issues. Additionally, a higher percentage of Warner
Robins customers responded that they would access information about CSC services
using the internet, and would find the ability to track the status of a question via a
web page more valuable, when compared to Tinker ALC customers. Lastly, Tinker
ALC customers were more aware of the Call Service Centers’ CRM initiative before
57
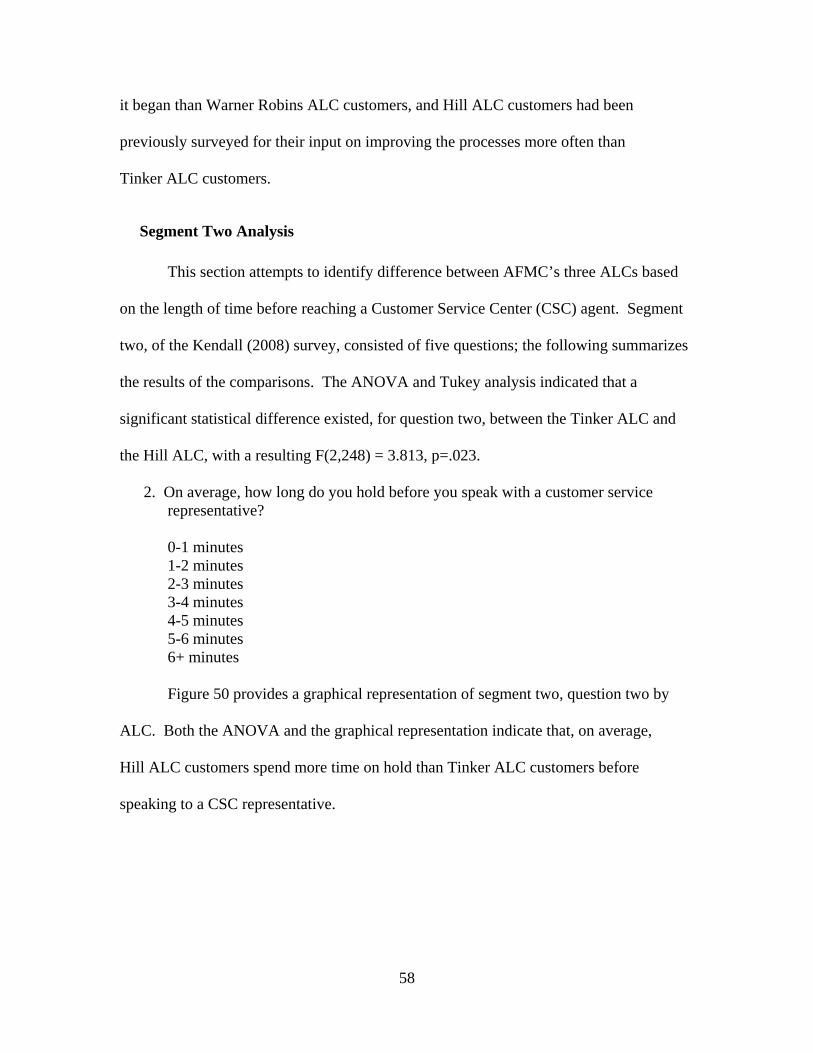
it began than Warner Robins ALC customers, and Hill ALC customers had been
previously surveyed for their input on improving the processes more often than
Tinker ALC customers.
Segment Two Analysis
This section attempts to identify difference between AFMC’s three ALCs based
on the length of time before reaching a Customer Service Center (CSC) agent. Segment
two, of the Kendall (2008) survey, consisted of five questions; the following summarizes
the results of the comparisons. The ANOVA and Tukey analysis indicated that a
significant statistical difference existed, for question two, between the Tinker ALC and
the Hill ALC, with a resulting F(2,248) = 3.813, p=.023.
2. On average, how long do you hold before you speak with a customer service representative? 0-1 minutes 1-2 minutes 2-3 minutes 3-4 minutes 4-5 minutes 5-6 minutes 6+ minutes
Figure 50 provides a graphical representation of segment two, question two by
ALC. Both the ANOVA and the graphical representation indicate that, on average,
Hill ALC customers spend more time on hold than Tinker ALC customers before
speaking to a CSC representative.
58
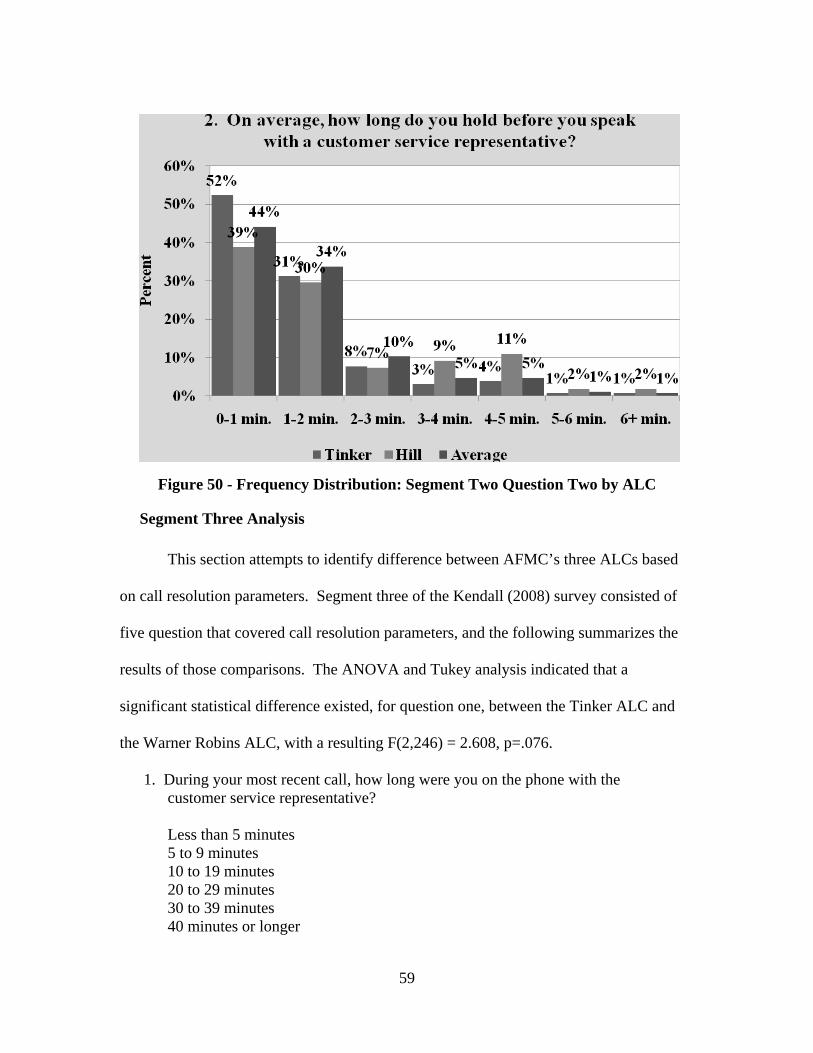
Figure 50 - Frequency Distribution: Segment Two Question Two by ALC
Segment Three Analysis
This section attempts to identify difference between AFMC’s three ALCs based
on call resolution parameters. Segment three of the Kendall (2008) survey consisted of
five question that covered call resolution parameters, and the following summarizes the
results of those comparisons. The ANOVA and Tukey analysis indicated that a
significant statistical difference existed, for question one, between the Tinker ALC and
the Warner Robins ALC, with a resulting F(2,246) = 2.608, p=.076.
1. During your most recent call, how long were you on the phone with the customer service representative?
Less than 5 minutes 5 to 9 minutes 10 to 19 minutes 20 to 29 minutes 30 to 39 minutes 40 minutes or longer
59
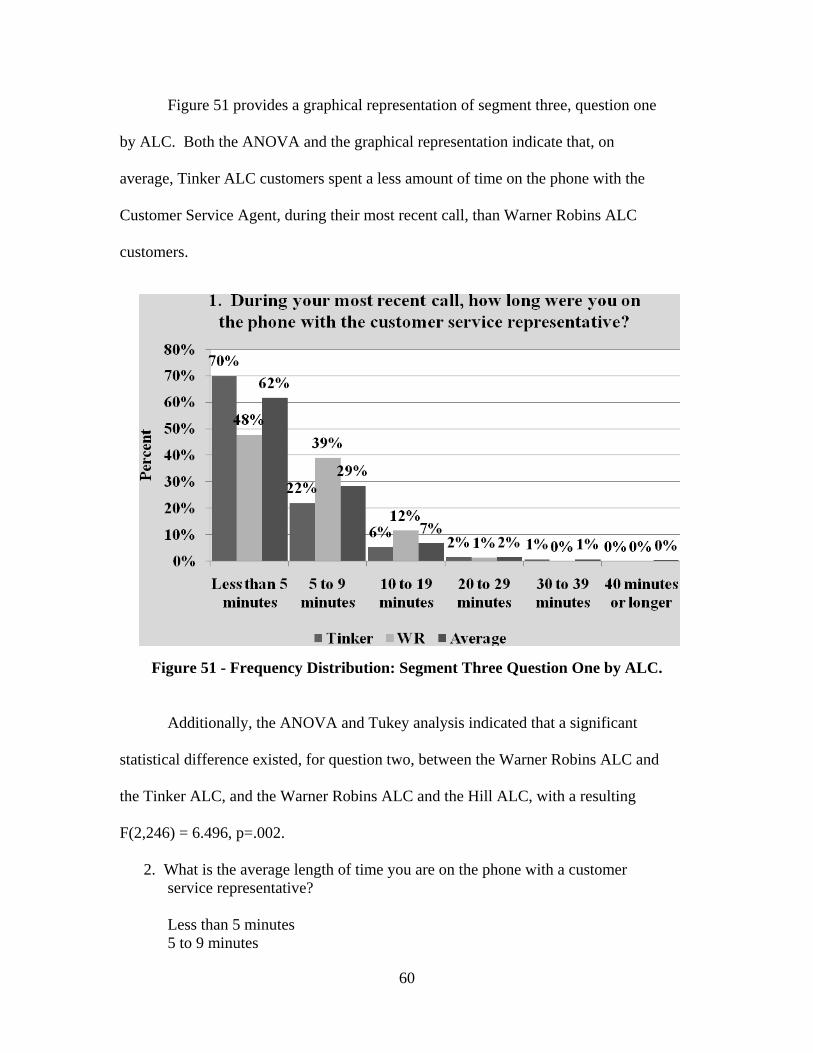
Figure 51 provides a graphical representation of segment three, question one
by ALC. Both the ANOVA and the graphical representation indicate that, on
average, Tinker ALC customers spent a less amount of time on the phone with the
Customer Service Agent, during their most recent call, than Warner Robins ALC
customers.
Figure 51 - Frequency Distribution: Segment Three Question One by ALC.
Additionally, the ANOVA and Tukey analysis indicated that a significant
statistical difference existed, for question two, between the Warner Robins ALC and
the Tinker ALC, and the Warner Robins ALC and the Hill ALC, with a resulting
F(2,246) = 6.496, p=.002.
2. What is the average length of time you are on the phone with a customer service representative?
Less than 5 minutes 5 to 9 minutes
60
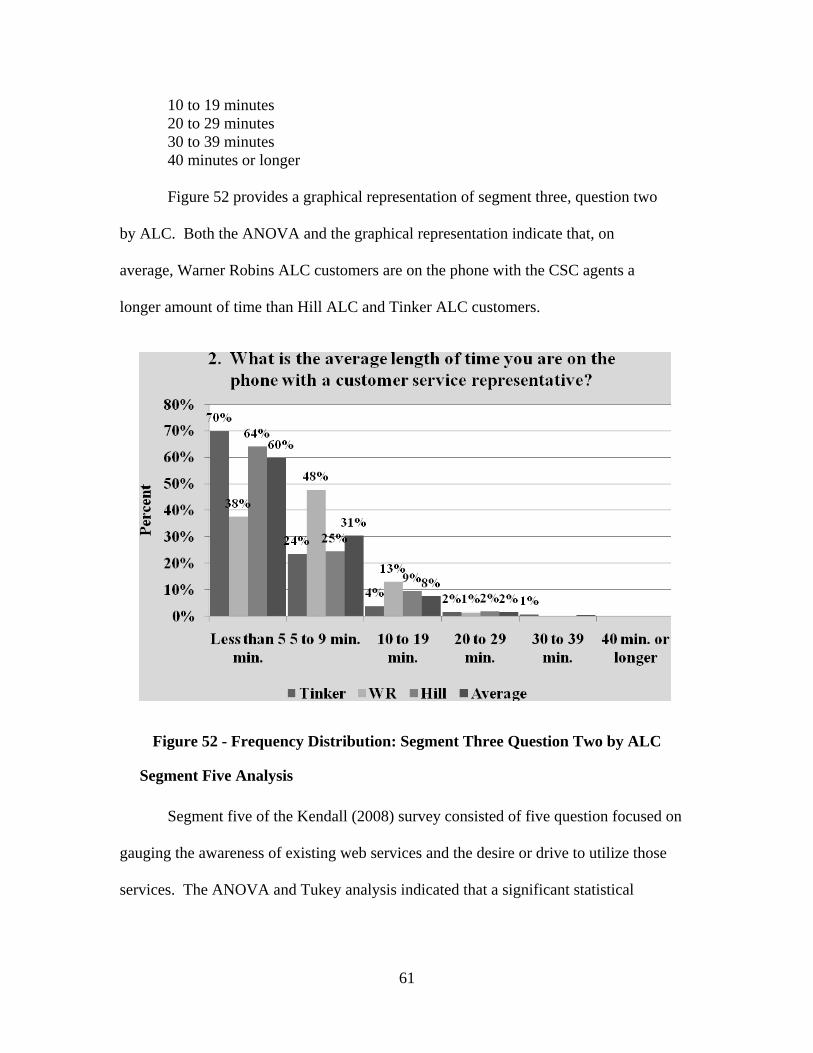
10 to 19 minutes 20 to 29 minutes 30 to 39 minutes 40 minutes or longer Figure 52 provides a graphical representation of segment three, question two
by ALC. Both the ANOVA and the graphical representation indicate that, on
average, Warner Robins ALC customers are on the phone with the CSC agents a
longer amount of time than Hill ALC and Tinker ALC customers.
Figure 52 - Frequency Distribution: Segment Three Question Two by ALC
Segment Five Analysis
Segment five of the Kendall (2008) survey consisted of five question focused on
gauging the awareness of existing web services and the desire or drive to utilize those
services. The ANOVA and Tukey analysis indicated that a significant statistical
61
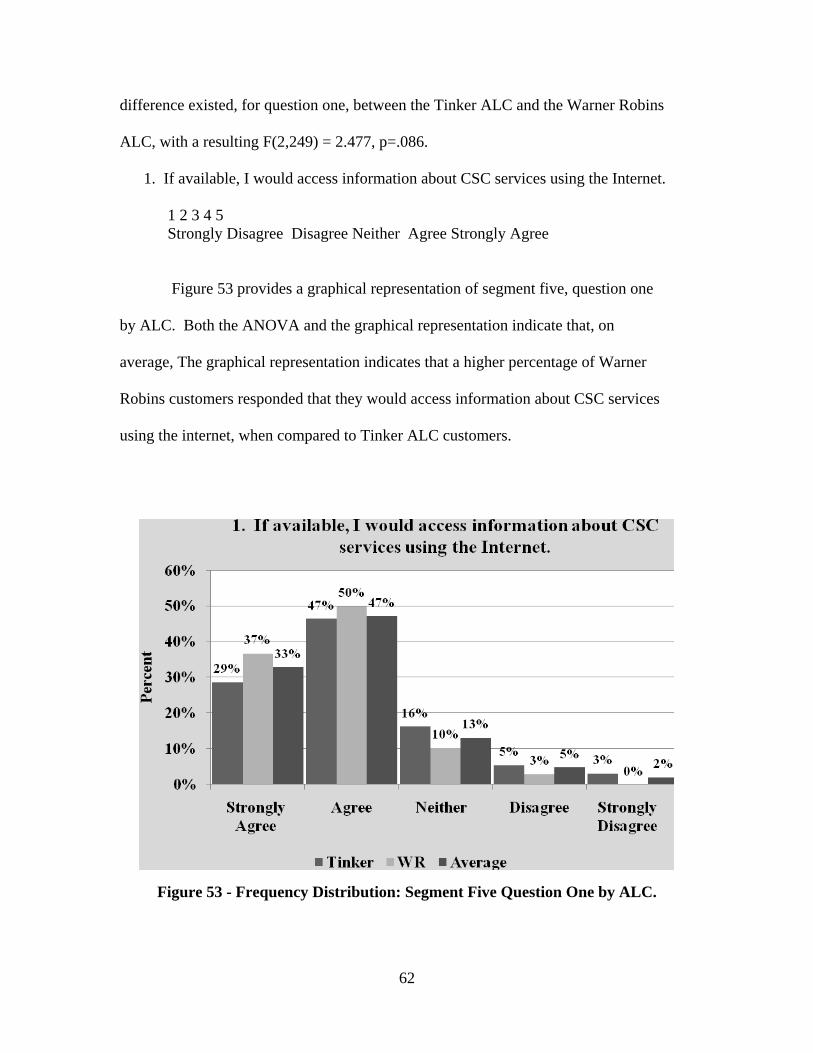
difference existed, for question one, between the Tinker ALC and the Warner Robins
ALC, with a resulting F(2,249) = 2.477, p=.086.
1. If available, I would access information about CSC services using the Internet.
1 2 3 4 5 Strongly Disagree Disagree Neither Agree Strongly Agree
Figure 53 provides a graphical representation of segment five, question one
by ALC. Both the ANOVA and the graphical representation indicate that, on
average, The graphical representation indicates that a higher percentage of Warner
Robins customers responded that they would access information about CSC services
using the internet, when compared to Tinker ALC customers.
Figure 53 - Frequency Distribution: Segment Five Question One by ALC.
62
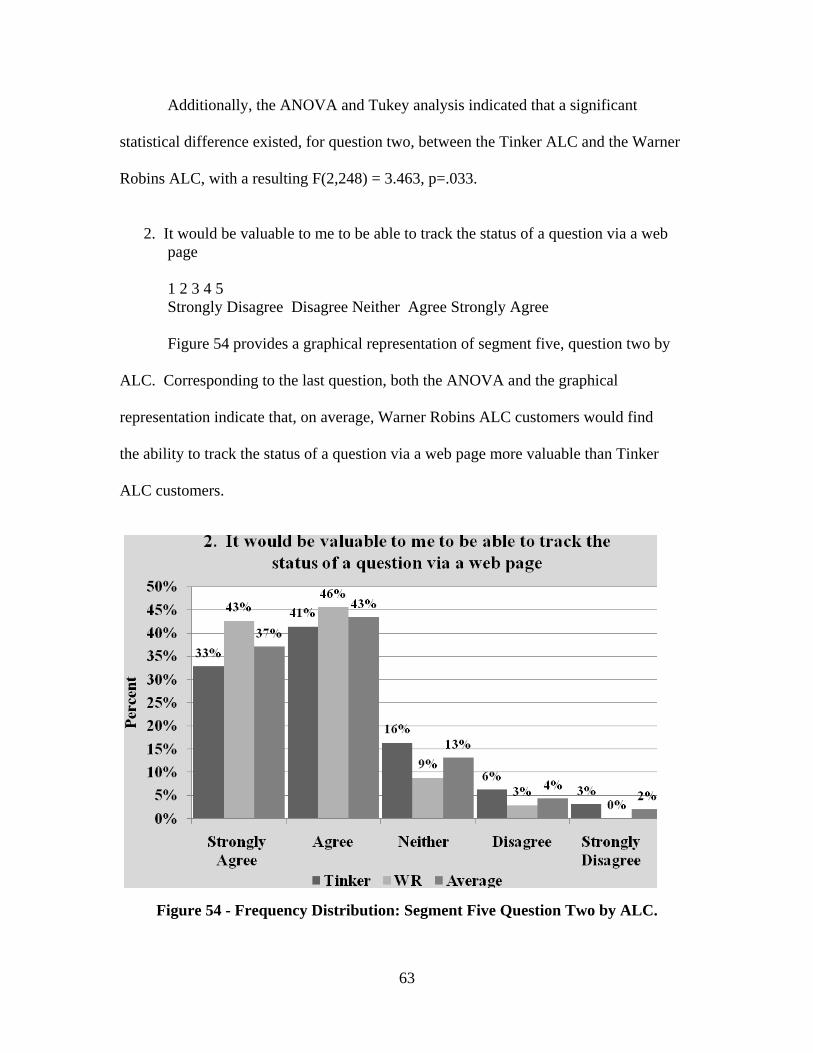
Additionally, the ANOVA and Tukey analysis indicated that a significant
statistical difference existed, for question two, between the Tinker ALC and the Warner
Robins ALC, with a resulting F(2,248) = 3.463, p=.033.
2. It would be valuable to me to be able to track the status of a question via a web
page
1 2 3 4 5 Strongly Disagree Disagree Neither Agree Strongly Agree
Figure 54 provides a graphical representation of segment five, question two by
ALC. Corresponding to the last question, both the ANOVA and the graphical
representation indicate that, on average, Warner Robins ALC customers would find
the ability to track the status of a question via a web page more valuable than Tinker
ALC customers.
Figure 54 - Frequency Distribution: Segment Five Question Two by ALC.
63
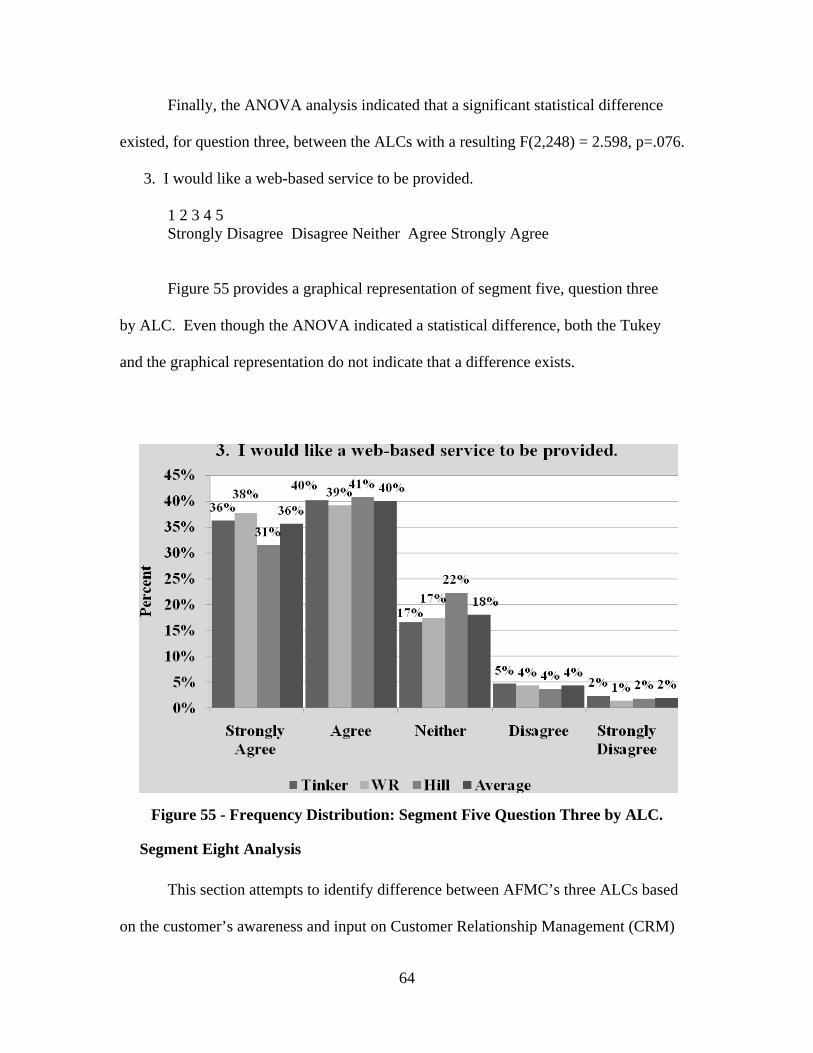
Finally, the ANOVA analysis indicated that a significant statistical difference
existed, for question three, between the ALCs with a resulting F(2,248) = 2.598, p=.076.
3. I would like a web-based service to be provided.
1 2 3 4 5 Strongly Disagree Disagree Neither Agree Strongly Agree
Figure 55 provides a graphical representation of segment five, question three
by ALC. Even though the ANOVA indicated a statistical difference, both the Tukey
and the graphical representation do not indicate that a difference exists.
Figure 55 - Frequency Distribution: Segment Five Question Three by ALC.
Segment Eight Analysis This section attempts to identify difference between AFMC’s three ALCs based
on the customer’s awareness and input on Customer Relationship Management (CRM)
64
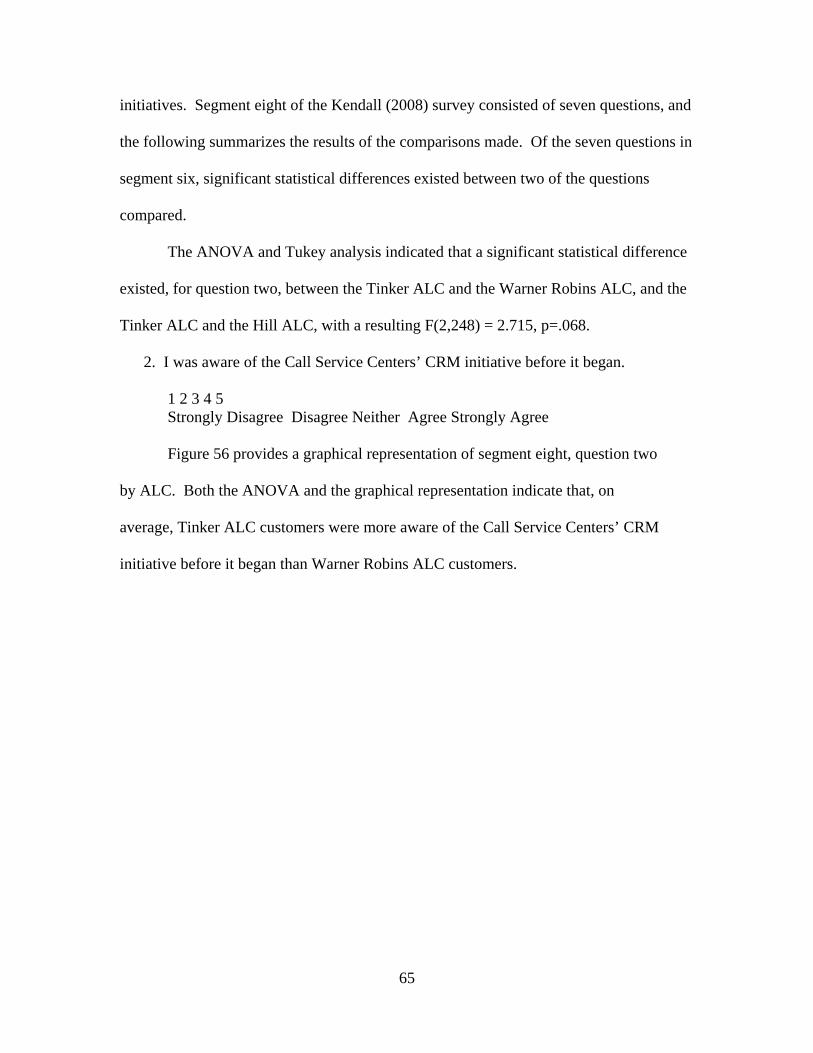
initiatives. Segment eight of the Kendall (2008) survey consisted of seven questions, and
the following summarizes the results of the comparisons made. Of the seven questions in
segment six, significant statistical differences existed between two of the questions
compared.
The ANOVA and Tukey analysis indicated that a significant statistical difference
existed, for question two, between the Tinker ALC and the Warner Robins ALC, and the
Tinker ALC and the Hill ALC, with a resulting F(2,248) = 2.715, p=.068.
2. I was aware of the Call Service Centers’ CRM initiative before it began.
1 2 3 4 5 Strongly Disagree Disagree Neither Agree Strongly Agree Figure 56 provides a graphical representation of segment eight, question two
by ALC. Both the ANOVA and the graphical representation indicate that, on
average, Tinker ALC customers were more aware of the Call Service Centers’ CRM
initiative before it began than Warner Robins ALC customers.
65
Figure 56 - Frequency Distribution: Segment Eight Question Two by ALC.
Additionally, the ANOVA and Tukey analysis indicated that a significant
statistical difference existed, for question five, between the Tinker ALC and the Hill
ALC, with a resulting F(2,246) = 2.349, p=.098.
5. The CSC has previously surveyed me for my input on improving their processes.
1 2 3 4 5 Strongly Disagree Disagree Neither Agree Strongly Agree
Figure 57 provides a graphical representation of segment eight, question five
by ALC. Both the ANOVA and the graphical representation indicate that, on
average, Hill ALC customers had been previously surveyed for their input on
improving the processes more often than Tinker ALC customers.
66
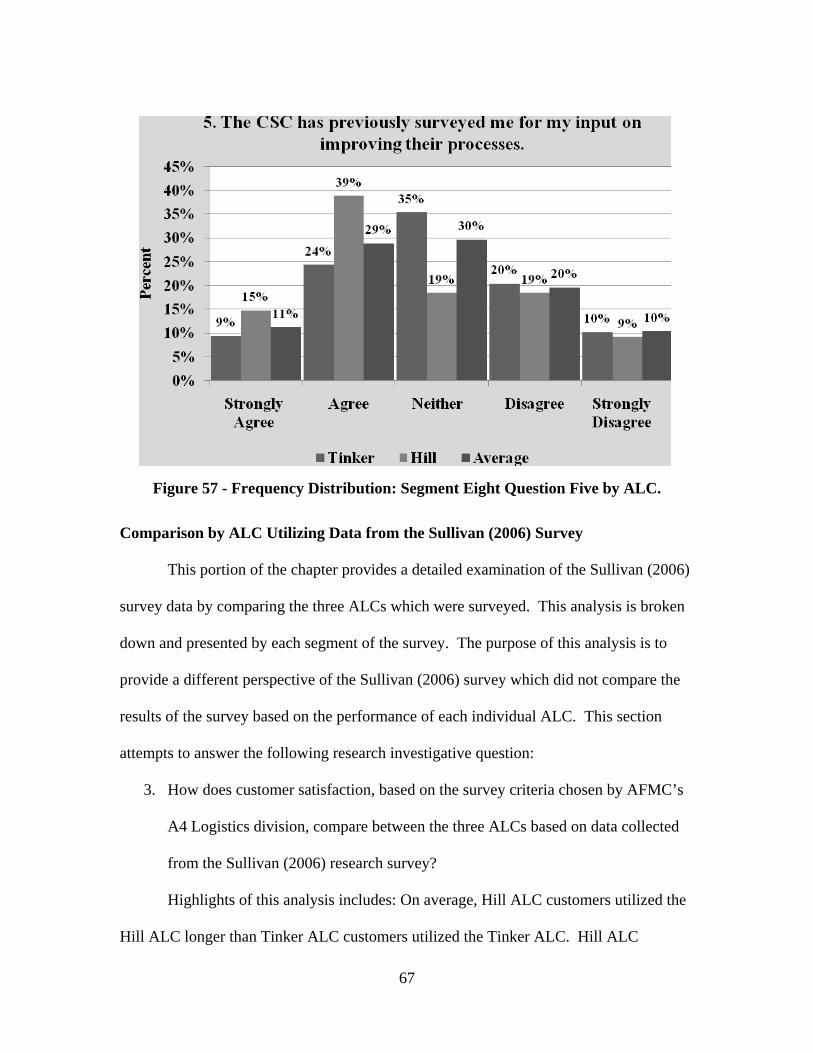
Figure 57 - Frequency Distribution: Segment Eight Question Five by ALC.
Comparison by ALC Utilizing Data from the Sullivan (2006) Survey This portion of the chapter provides a detailed examination of the Sullivan (2006)
survey data by comparing the three ALCs which were surveyed. This analysis is broken
down and presented by each segment of the survey. The purpose of this analysis is to
provide a different perspective of the Sullivan (2006) survey which did not compare the
results of the survey based on the performance of each individual ALC. This section
attempts to answer the following research investigative question:
3. How does customer satisfaction, based on the survey criteria chosen by AFMC’s
A4 Logistics division, compare between the three ALCs based on data collected
from the Sullivan (2006) research survey?
Highlights of this analysis includes: On average, Hill ALC customers utilized the
Hill ALC longer than Tinker ALC customers utilized the Tinker ALC. Hill ALC
67
customers, on average, were on hold a less amount of time than Tinker ALC and Warner
Robbins ALC customers, and Hill ALC customers found their wait times more
acceptable. Additionally, Warner Robbins customers spent a longer average amount of
time on the phone with the customer service representative, and spent more calls to
resolve customer issues. The ANOVA analysis performed on segments four, five, six,
seven, and eight indicated no significant statistical differences between the CSCs.
Segment One Analysis
This section attempts to identify difference between AFMC’s three ALCs based
on frequency of usage and demographics. Segment one of the Sullivan (2006) survey
consisted of eight questions that covered frequency of usage and demographics. Due to
the nature of question one, which was included to determine the primary Customer
Service Center (CSC) that the customer worked with, it was excluded from this analysis.
The following summarizes the results of the comparisons. When examining how long
customers had been using the CSC services, both the ANOVA and the graphical
representation indicate that, on average, Hill ALC customers have been utilizing the Hill
ALC longer than Tinker ALC customers have been utilizing the Tinker ALC. Segment
one had no other significant statistical difference that existed between ALCs.
The ANOVA and Tukey analysis indicated that a significant statistical difference
existed, for question three, between the Hill ALC and the Tinker ALC, and the Hill ALC
and the Warner Robins ALC, with a resulting F(2,252) = 4.115, p=.017.
3. How long have you been using the CSC services?
Less than 1 month 1 month to 6 months More than 6 months
68
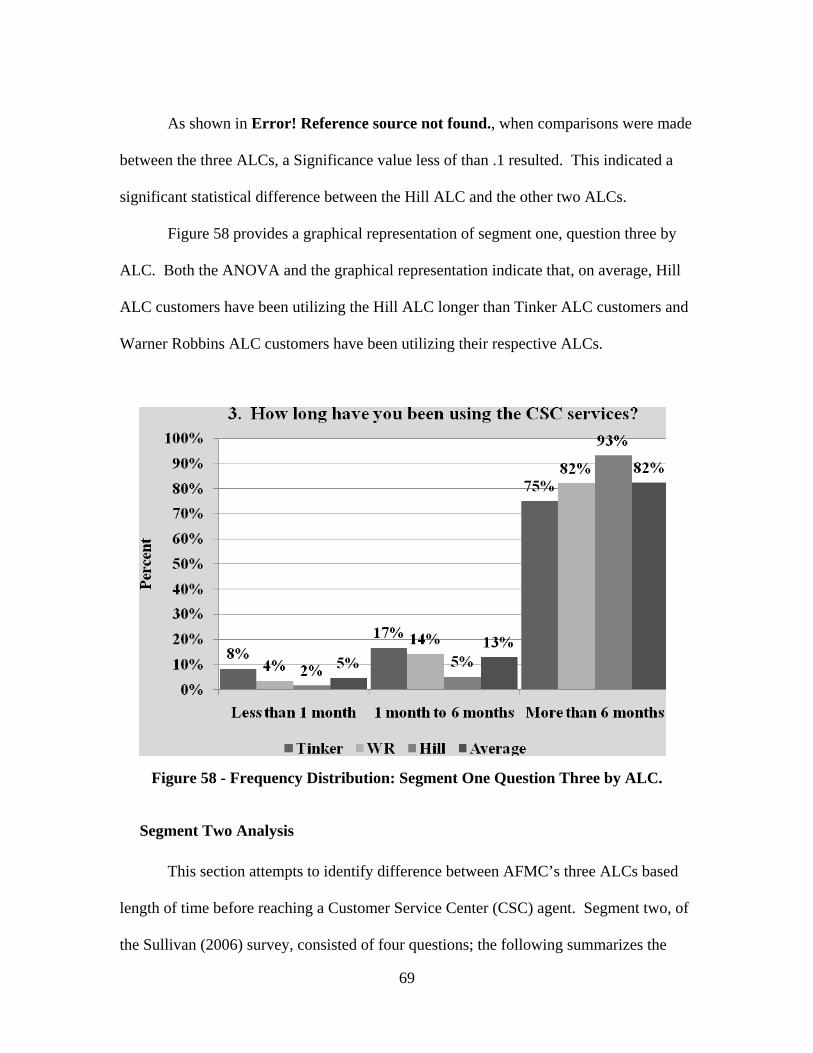
As shown in Error! Reference source not found., when comparisons were made
between the three ALCs, a Significance value less of than .1 resulted. This indicated a
significant statistical difference between the Hill ALC and the other two ALCs.
Figure 58 provides a graphical representation of segment one, question three by
ALC. Both the ANOVA and the graphical representation indicate that, on average, Hill
ALC customers have been utilizing the Hill ALC longer than Tinker ALC customers and
Warner Robbins ALC customers have been utilizing their respective ALCs.
Figure 58 - Frequency Distribution: Segment One Question Three by ALC.
Segment Two Analysis
This section attempts to identify difference between AFMC’s three ALCs based
length of time before reaching a Customer Service Center (CSC) agent. Segment two, of
the Sullivan (2006) survey, consisted of four questions; the following summarizes the
69
results of the comparisons. When examining question one, how long customers are on
hold prior to speaking to a customer service representative, Hill ALC customers, on
average, are on hold a less amount of time than Tinker ALC and Warner Robbins ALC
customers. Additionally, Hill ALC customers find their wait times more acceptable when
compared to the customers of Tinker and Warner Robbins ALC. Questions three and
four did not present any statistical differences.
The ANOVA and Tukey analysis indicated that a significant statistical difference
existed, for question one, between the Warner Robbins ALC and the Hill ALC, with a
resulting F(2,253) = 4.759, p=.009.
1. On average, how long do you hold before you speak with a customer service representative?
0-1 minutes 1-2 minutes 2-3 minutes 3-4 minutes 4-5 minutes 5-6 minutes 6+ minutes Figure 59 provides a graphical representation of segment two, question one by
ALC. Both the ANOVA and the graphical representation indicate that Hill ALC
customers, on average, are on hold a less amount of time than Tinker ALC and Warner
Robbins ALC customers.
70
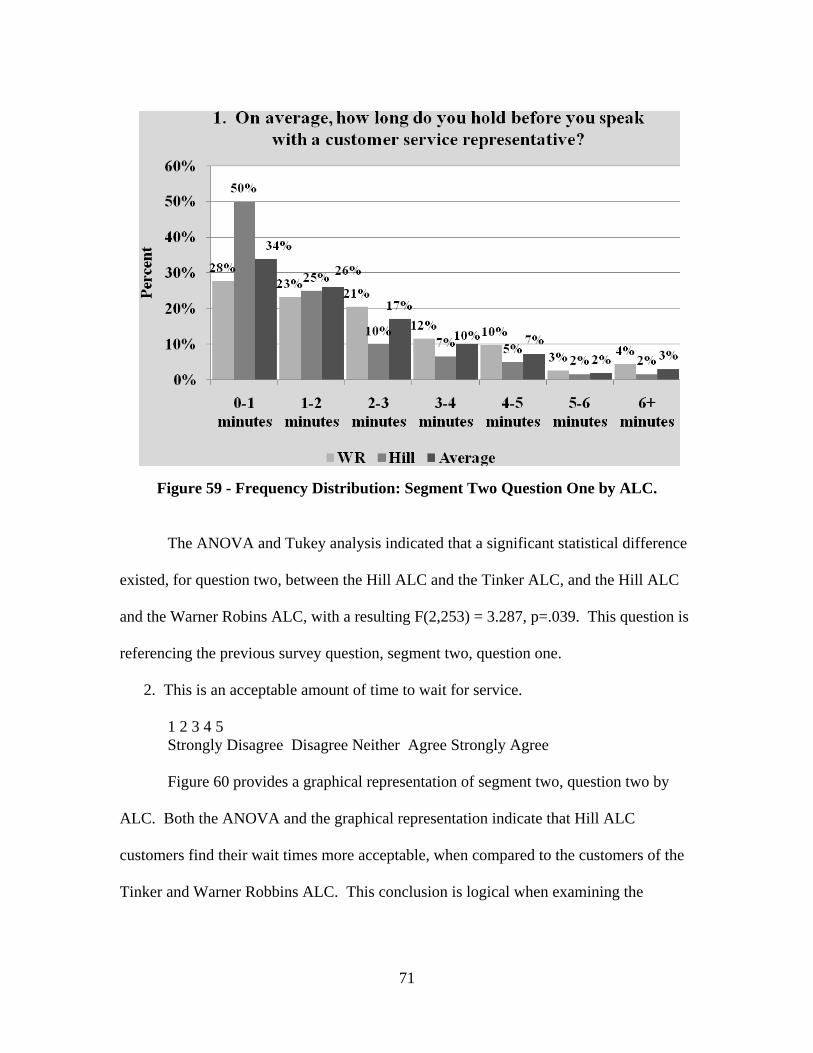
Figure 59 - Frequency Distribution: Segment Two Question One by ALC.
The ANOVA and Tukey analysis indicated that a significant statistical difference
existed, for question two, between the Hill ALC and the Tinker ALC, and the Hill ALC
and the Warner Robins ALC, with a resulting F(2,253) = 3.287, p=.039. This question is
referencing the previous survey question, segment two, question one.
2. This is an acceptable amount of time to wait for service. 1 2 3 4 5
Strongly Disagree Disagree Neither Agree Strongly Agree Figure 60 provides a graphical representation of segment two, question two by
ALC. Both the ANOVA and the graphical representation indicate that Hill ALC
customers find their wait times more acceptable, when compared to the customers of the
Tinker and Warner Robbins ALC. This conclusion is logical when examining the
71
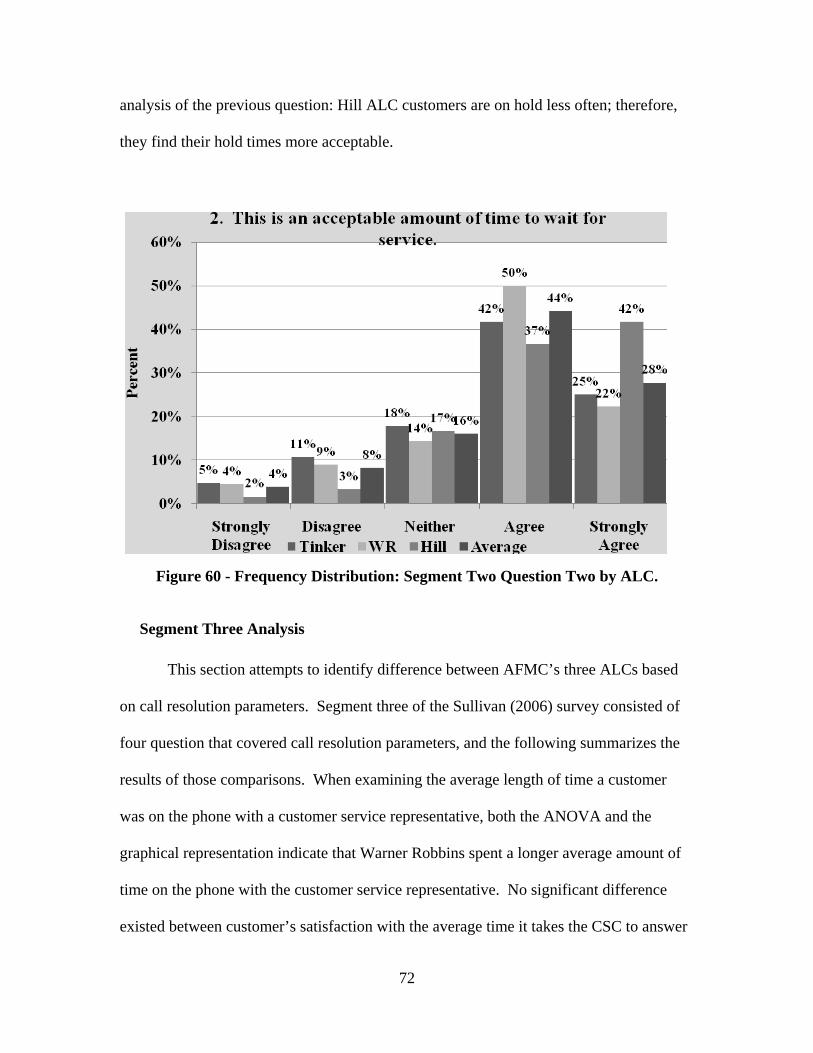
analysis of the previous question: Hill ALC customers are on hold less often; therefore,
they find their hold times more acceptable.
Figure 60 - Frequency Distribution: Segment Two Question Two by ALC.
Segment Three Analysis
This section attempts to identify difference between AFMC’s three ALCs based
on call resolution parameters. Segment three of the Sullivan (2006) survey consisted of
four question that covered call resolution parameters, and the following summarizes the
results of those comparisons. When examining the average length of time a customer
was on the phone with a customer service representative, both the ANOVA and the
graphical representation indicate that Warner Robbins spent a longer average amount of
time on the phone with the customer service representative. No significant difference
existed between customer’s satisfaction with the average time it takes the CSC to answer
72
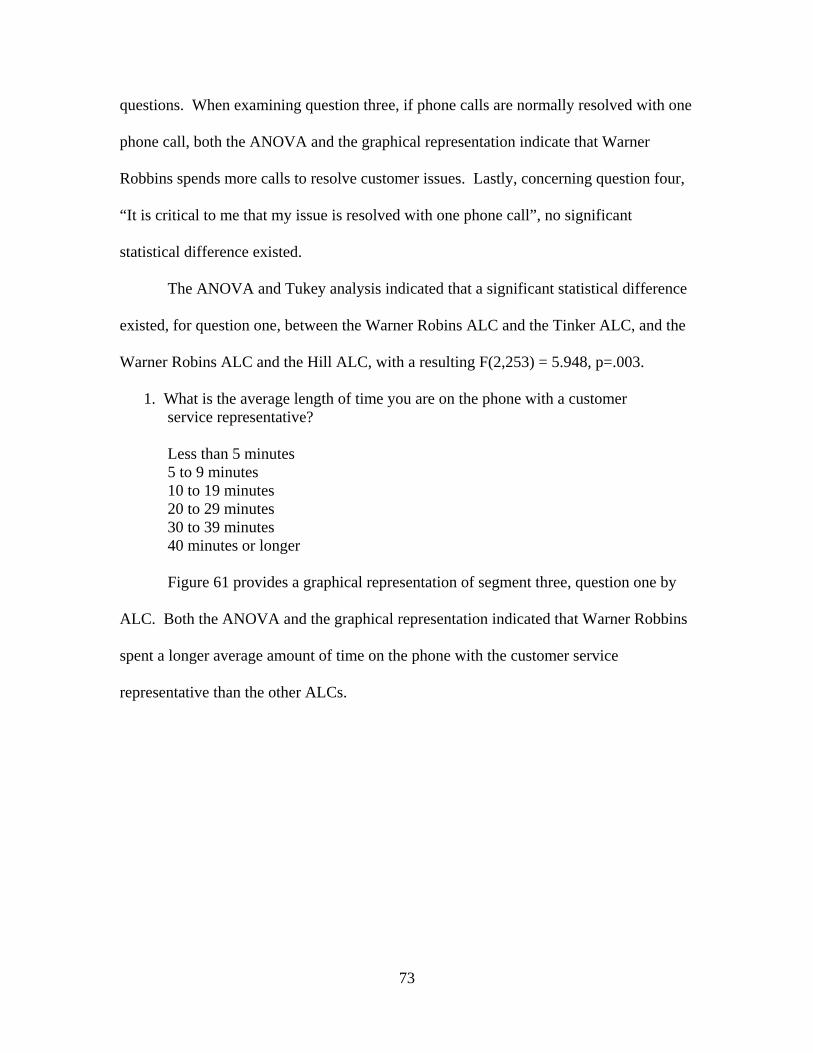
questions. When examining question three, if phone calls are normally resolved with one
phone call, both the ANOVA and the graphical representation indicate that Warner
Robbins spends more calls to resolve customer issues. Lastly, concerning question four,
“It is critical to me that my issue is resolved with one phone call”, no significant
statistical difference existed.
The ANOVA and Tukey analysis indicated that a significant statistical difference
existed, for question one, between the Warner Robins ALC and the Tinker ALC, and the
Warner Robins ALC and the Hill ALC, with a resulting F(2,253) = 5.948, p=.003.
1. What is the average length of time you are on the phone with a customer service representative? Less than 5 minutes 5 to 9 minutes 10 to 19 minutes 20 to 29 minutes 30 to 39 minutes 40 minutes or longer Figure 61 provides a graphical representation of segment three, question one by
ALC. Both the ANOVA and the graphical representation indicated that Warner Robbins
spent a longer average amount of time on the phone with the customer service
representative than the other ALCs.
73
Figure 61 - Frequency Distribution: Segment Three Question One by ALC.
The ANOVA and Tukey analysis indicated that a significant statistical difference
existed, for question three, between the Warner Robins ALC and the Tinker ALC, and
the Warner Robins ALC and the Hill ALC, with a resulting F(2,253) = 4.167, p=.017.
3. My issues are normally resolved with one phone call. 1 2 3 4 5
Strongly Disagree Disagree Neither Agree Strongly Agree
As shown in Error! Reference source not found. when comparisons were made
between Warner Robbins and the other ALCs, a Significance value less than .1 resulted.
This indicated a significant statistical difference between Warner Robbins and the other
ALCs.
74
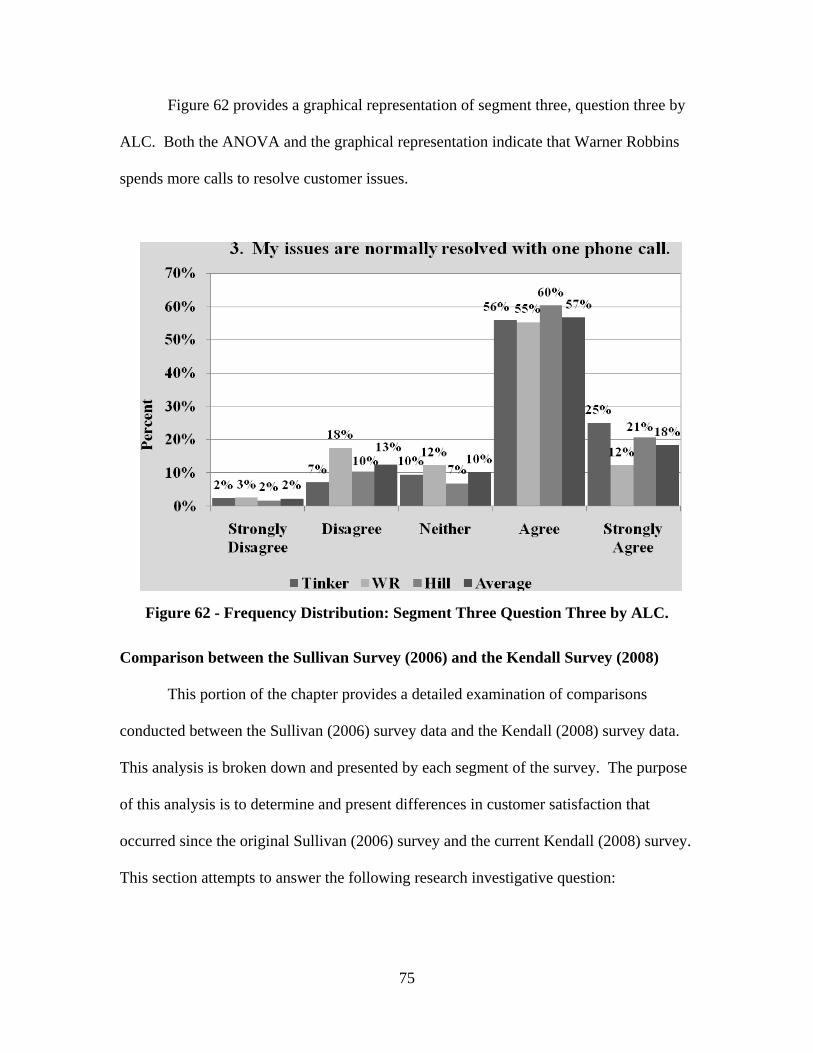
Figure 62 provides a graphical representation of segment three, question three by
ALC. Both the ANOVA and the graphical representation indicate that Warner Robbins
spends more calls to resolve customer issues.
Figure 62 - Frequency Distribution: Segment Three Question Three by ALC.
Comparison between the Sullivan Survey (2006) and the Kendall Survey (2008)
This portion of the chapter provides a detailed examination of comparisons
conducted between the Sullivan (2006) survey data and the Kendall (2008) survey data.
This analysis is broken down and presented by each segment of the survey. The purpose
of this analysis is to determine and present differences in customer satisfaction that
occurred since the original Sullivan (2006) survey and the current Kendall (2008) survey.
This section attempts to answer the following research investigative question:
75
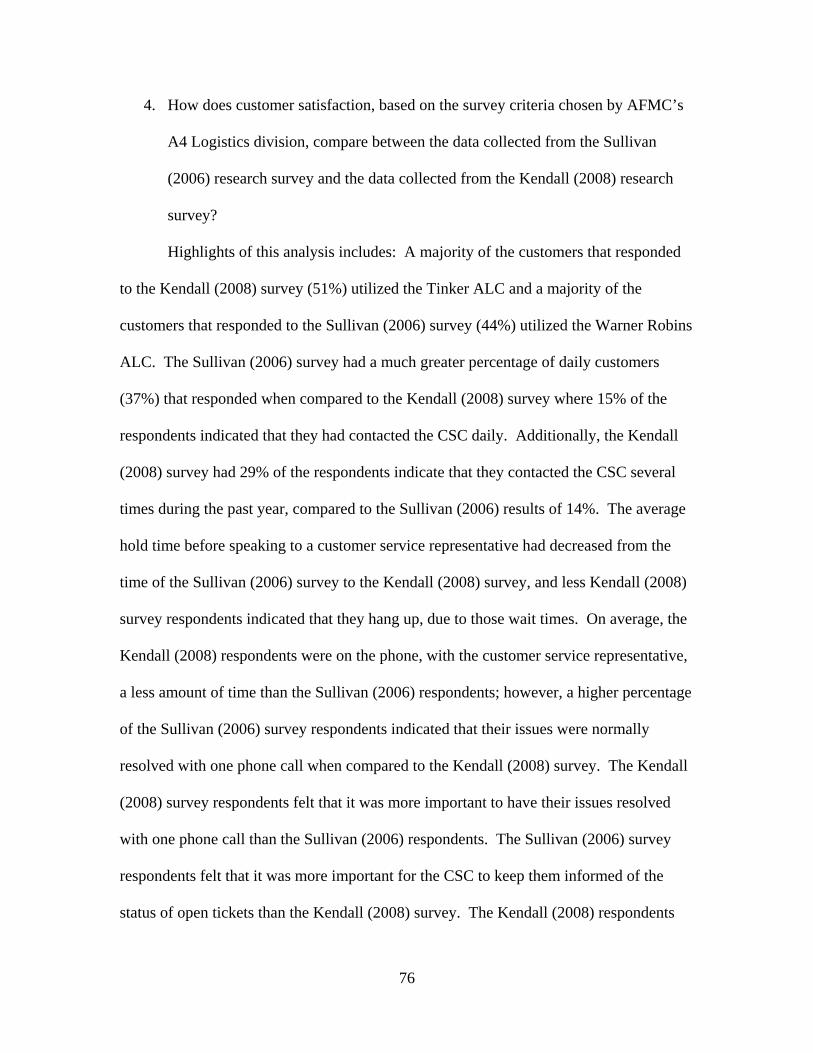
4. How does customer satisfaction, based on the survey criteria chosen by AFMC’s
A4 Logistics division, compare between the data collected from the Sullivan
(2006) research survey and the data collected from the Kendall (2008) research
survey?
Highlights of this analysis includes: A majority of the customers that responded
to the Kendall (2008) survey (51%) utilized the Tinker ALC and a majority of the
customers that responded to the Sullivan (2006) survey (44%) utilized the Warner Robins
ALC. The Sullivan (2006) survey had a much greater percentage of daily customers
(37%) that responded when compared to the Kendall (2008) survey where 15% of the
respondents indicated that they had contacted the CSC daily. Additionally, the Kendall
(2008) survey had 29% of the respondents indicate that they contacted the CSC several
times during the past year, compared to the Sullivan (2006) results of 14%. The average
hold time before speaking to a customer service representative had decreased from the
time of the Sullivan (2006) survey to the Kendall (2008) survey, and less Kendall (2008)
survey respondents indicated that they hang up, due to those wait times. On average, the
Kendall (2008) respondents were on the phone, with the customer service representative,
a less amount of time than the Sullivan (2006) respondents; however, a higher percentage
of the Sullivan (2006) survey respondents indicated that their issues were normally
resolved with one phone call when compared to the Kendall (2008) survey. The Kendall
(2008) survey respondents felt that it was more important to have their issues resolved
with one phone call than the Sullivan (2006) respondents. The Sullivan (2006) survey
respondents felt that it was more important for the CSC to keep them informed of the
status of open tickets than the Kendall (2008) survey. The Kendall (2008) respondents
76
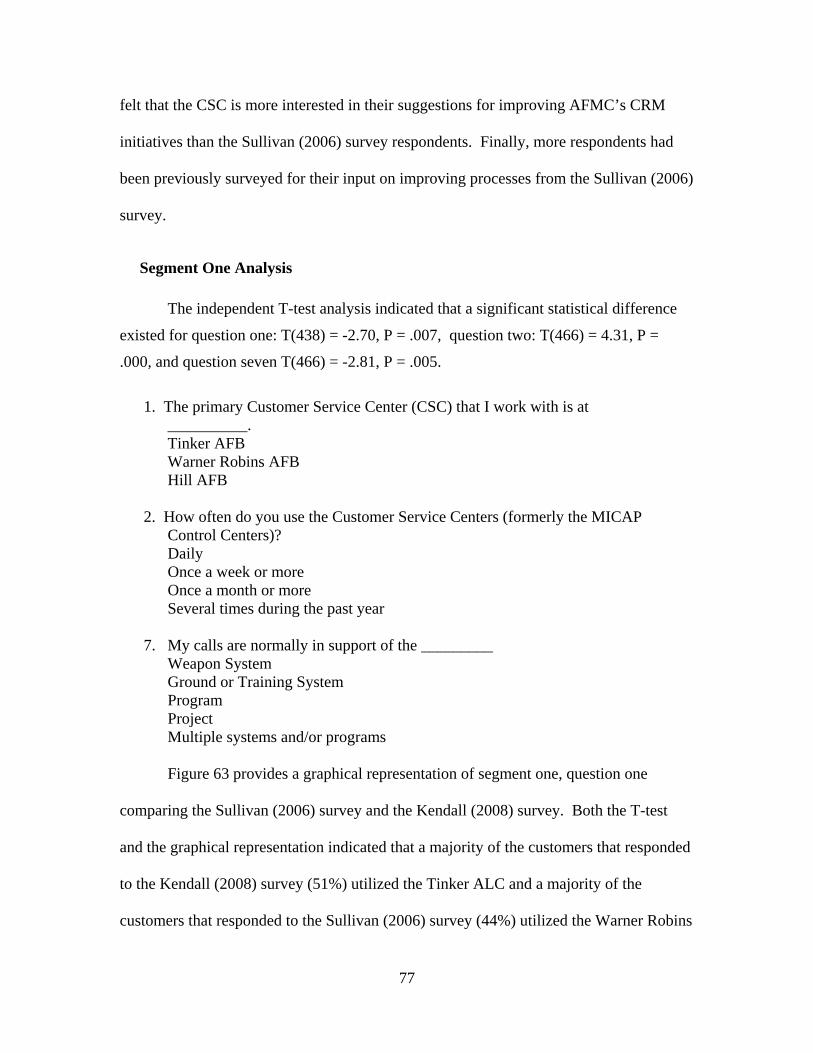
felt that the CSC is more interested in their suggestions for improving AFMC’s CRM
initiatives than the Sullivan (2006) survey respondents. Finally, more respondents had
been previously surveyed for their input on improving processes from the Sullivan (2006)
survey.
Segment One Analysis
The independent T-test analysis indicated that a significant statistical difference
existed for question one: T(438) = -2.70, P = .007, question two: T(466) = 4.31, P =
.000, and question seven T(466) = -2.81, P = .005.
1. The primary Customer Service Center (CSC) that I work with is at
__________. Tinker AFB Warner Robins AFB Hill AFB
2. How often do you use the Customer Service Centers (formerly the MICAP
Control Centers)? Daily Once a week or more Once a month or more Several times during the past year
7. My calls are normally in support of the _________
Weapon System Ground or Training System Program Project Multiple systems and/or programs
Figure 63 provides a graphical representation of segment one, question one
comparing the Sullivan (2006) survey and the Kendall (2008) survey. Both the T-test
and the graphical representation indicated that a majority of the customers that responded
to the Kendall (2008) survey (51%) utilized the Tinker ALC and a majority of the
customers that responded to the Sullivan (2006) survey (44%) utilized the Warner Robins
77
ALC. These differences, and the affects that they could contribute to the outcome of
each respective survey, should be considered throughout the remainder of this analysis.
Figure 63 - Frequency Distribution: Segment One Question One Comparison.
Figure 64 provides a graphical representation of segment one, question two
comparing the Sullivan (2006) survey and the Kendall (2008) survey. Both the T-test
and the graphical representation indicated that the Sullivan (2006) survey had a much
greater percentage of daily customers (37%) that responded when compared to the
Kendall (2008) survey where 15% of the respondents indicated that they had contacted
the CSC daily. Additionally, the Kendall (2008) survey had 29% of the respondents
indicate that they contacted the CSC several times during the past year, and the Sullivan
(2006) survey had 14% of the respondents indicate that they had contacted the CSC
several times during the past year.
78
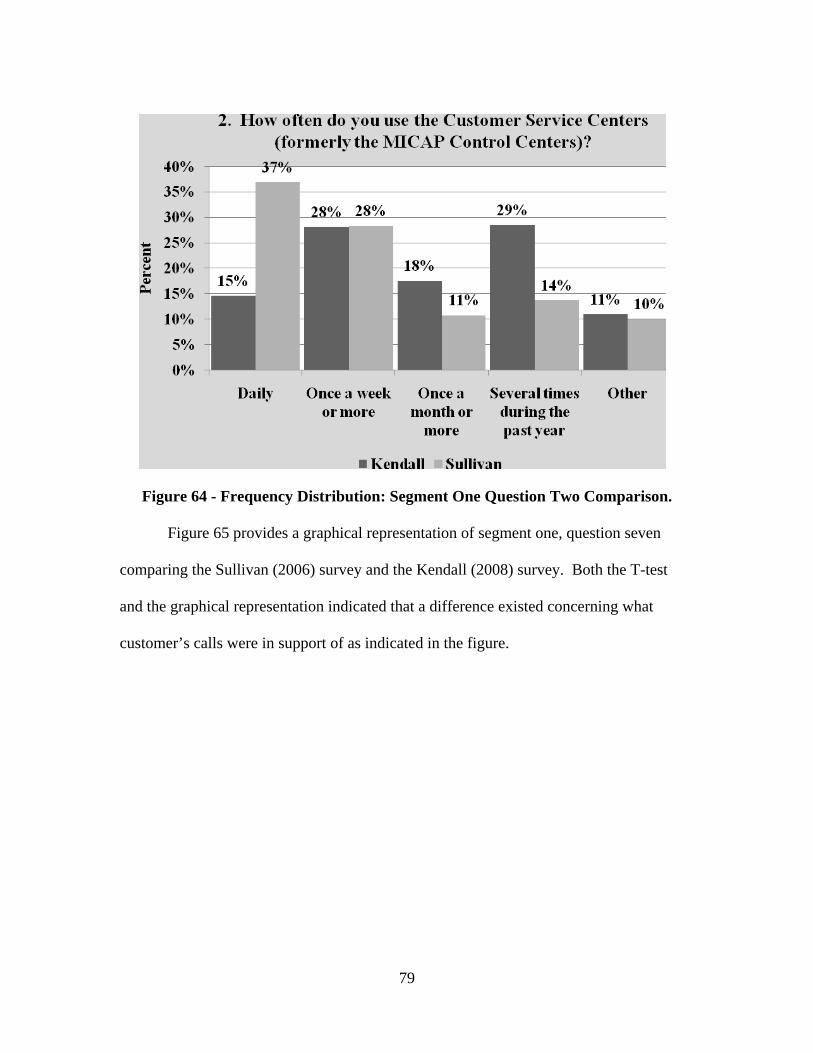
Figure 64 - Frequency Distribution: Segment One Question Two Comparison.
Figure 65 provides a graphical representation of segment one, question seven
comparing the Sullivan (2006) survey and the Kendall (2008) survey. Both the T-test
and the graphical representation indicated that a difference existed concerning what
customer’s calls were in support of as indicated in the figure.
79
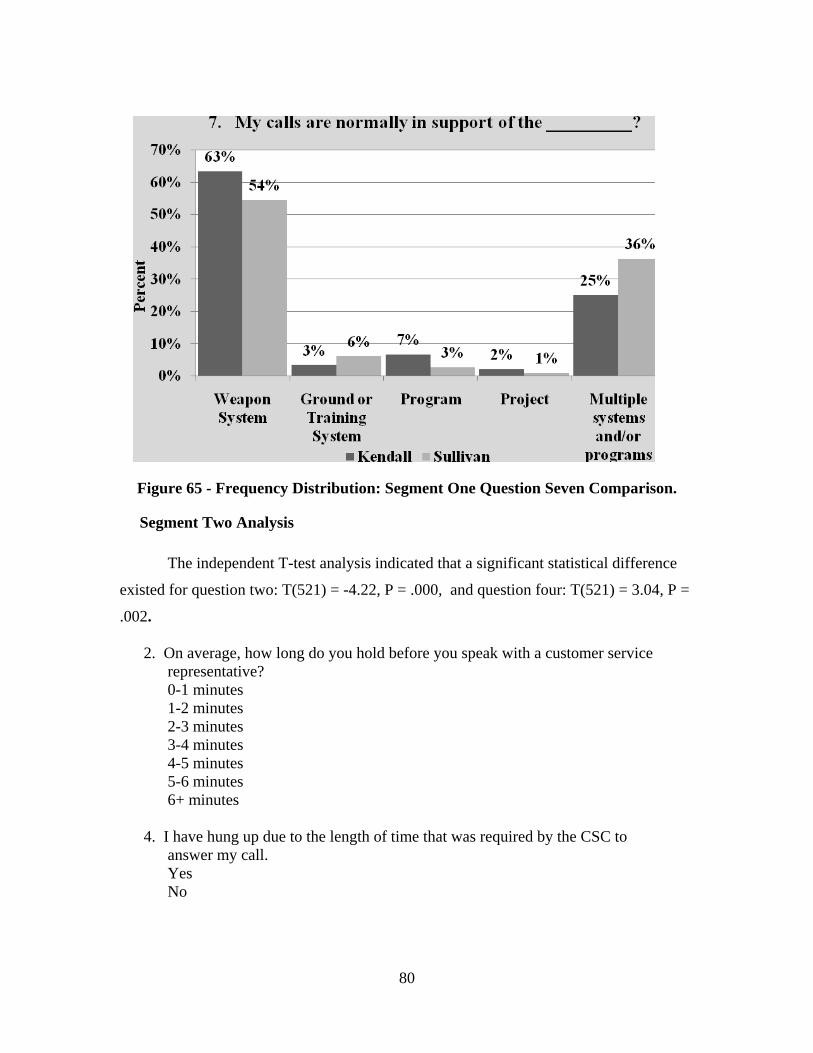
Figure 65 - Frequency Distribution: Segment One Question Seven Comparison.
Segment Two Analysis The independent T-test analysis indicated that a significant statistical difference
existed for question two: T(521) = -4.22, P = .000, and question four: T(521) = 3.04, P =
.002.
2. On average, how long do you hold before you speak with a customer service representative? 0-1 minutes 1-2 minutes 2-3 minutes 3-4 minutes 4-5 minutes 5-6 minutes 6+ minutes
4. I have hung up due to the length of time that was required by the CSC to
answer my call. Yes No
80
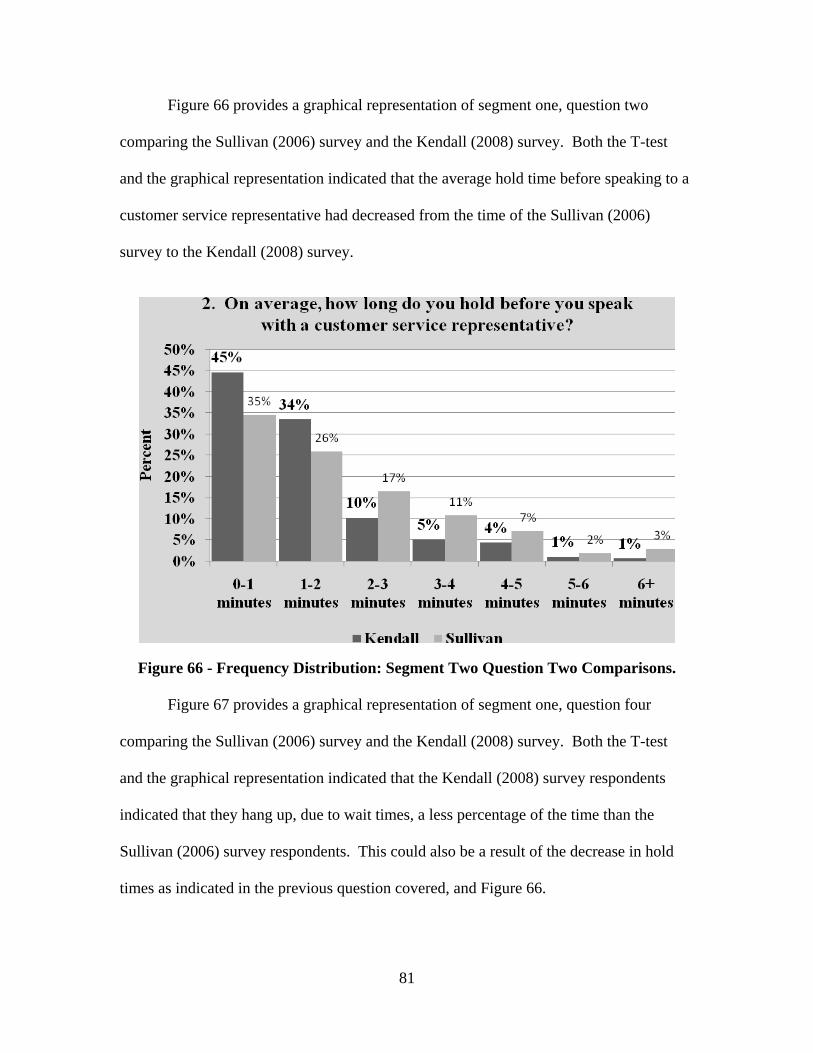
Figure 66 provides a graphical representation of segment one, question two
comparing the Sullivan (2006) survey and the Kendall (2008) survey. Both the T-test
and the graphical representation indicated that the average hold time before speaking to a
customer service representative had decreased from the time of the Sullivan (2006)
survey to the Kendall (2008) survey.
Figure 66 - Frequency Distribution: Segment Two Question Two Comparisons.
Figure 67 provides a graphical representation of segment one, question four
comparing the Sullivan (2006) survey and the Kendall (2008) survey. Both the T-test
and the graphical representation indicated that the Kendall (2008) survey respondents
indicated that they hang up, due to wait times, a less percentage of the time than the
Sullivan (2006) survey respondents. This could also be a result of the decrease in hold
times as indicated in the previous question covered, and Figure 66.
81
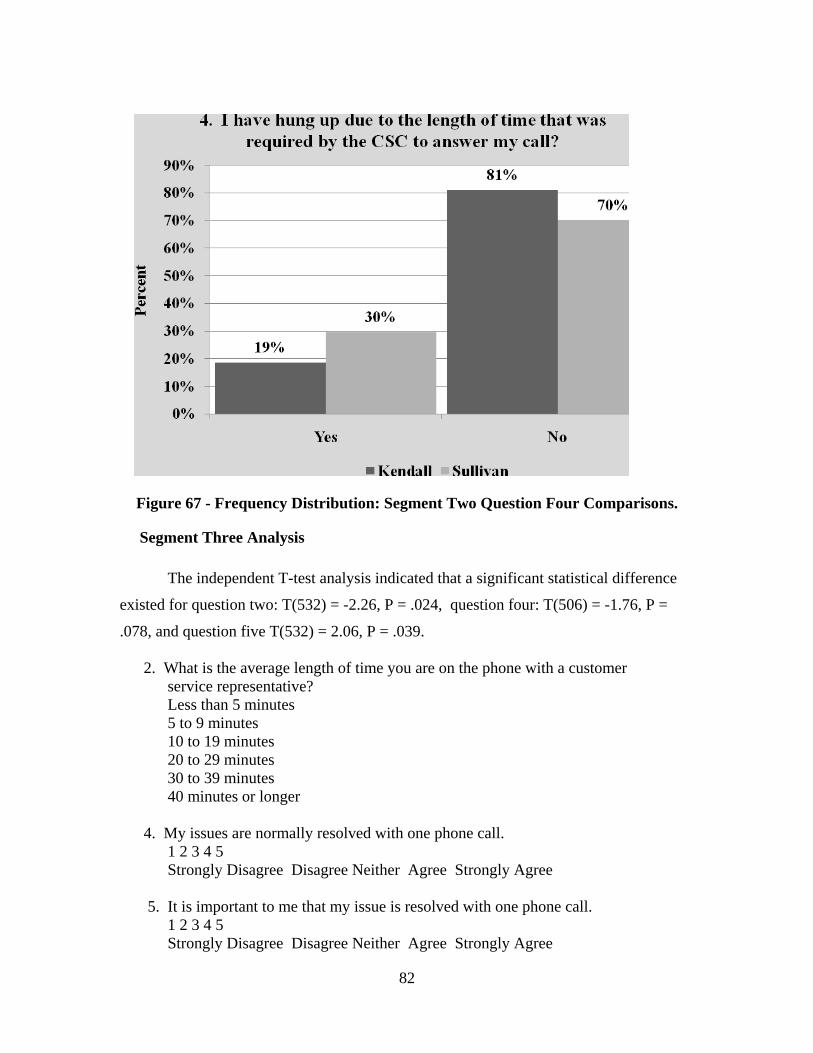
Figure 67 - Frequency Distribution: Segment Two Question Four Comparisons.
Segment Three Analysis The independent T-test analysis indicated that a significant statistical difference
existed for question two: T(532) = -2.26, P = .024, question four: T(506) = -1.76, P =
.078, and question five T(532) = 2.06, P = .039.
2. What is the average length of time you are on the phone with a customer service representative? Less than 5 minutes 5 to 9 minutes 10 to 19 minutes 20 to 29 minutes 30 to 39 minutes 40 minutes or longer
4. My issues are normally resolved with one phone call.
1 2 3 4 5 Strongly Disagree Disagree Neither Agree Strongly Agree
5. It is important to me that my issue is resolved with one phone call.
1 2 3 4 5 Strongly Disagree Disagree Neither Agree Strongly Agree
82
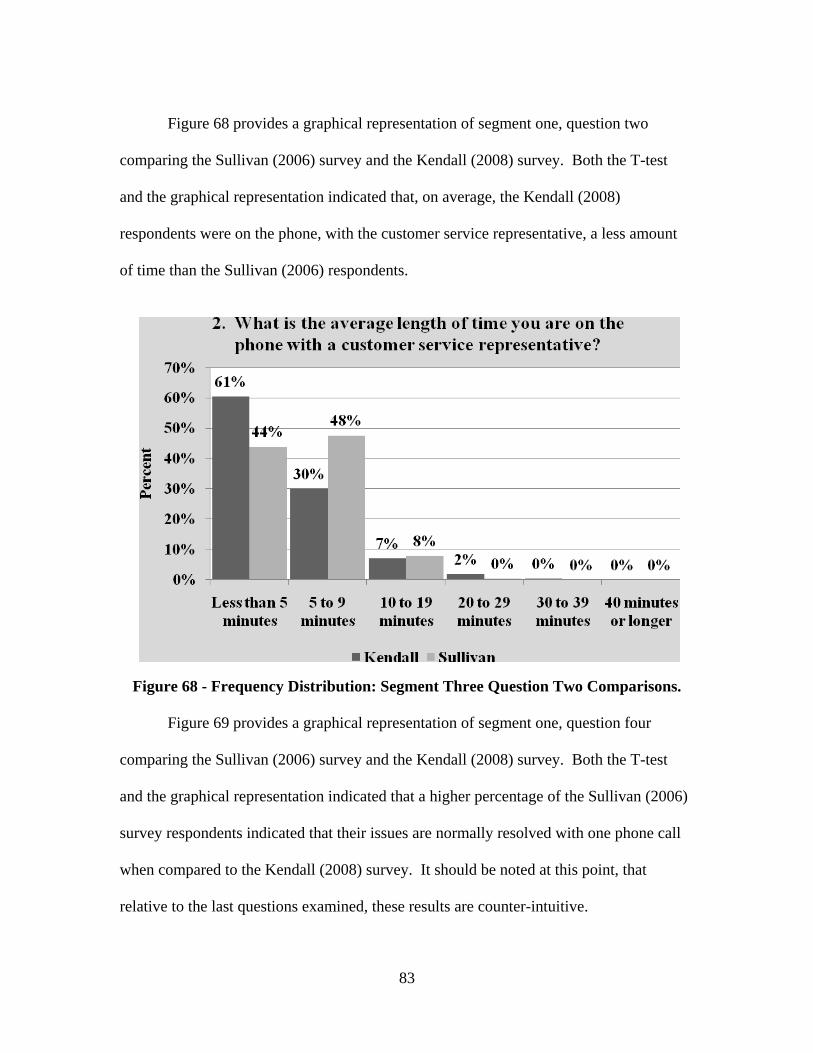
Figure 68 provides a graphical representation of segment one, question two
comparing the Sullivan (2006) survey and the Kendall (2008) survey. Both the T-test
and the graphical representation indicated that, on average, the Kendall (2008)
respondents were on the phone, with the customer service representative, a less amount
of time than the Sullivan (2006) respondents.
Figure 68 - Frequency Distribution: Segment Three Question Two Comparisons.
Figure 69 provides a graphical representation of segment one, question four
comparing the Sullivan (2006) survey and the Kendall (2008) survey. Both the T-test
and the graphical representation indicated that a higher percentage of the Sullivan (2006)
survey respondents indicated that their issues are normally resolved with one phone call
when compared to the Kendall (2008) survey. It should be noted at this point, that
relative to the last questions examined, these results are counter-intuitive.
83
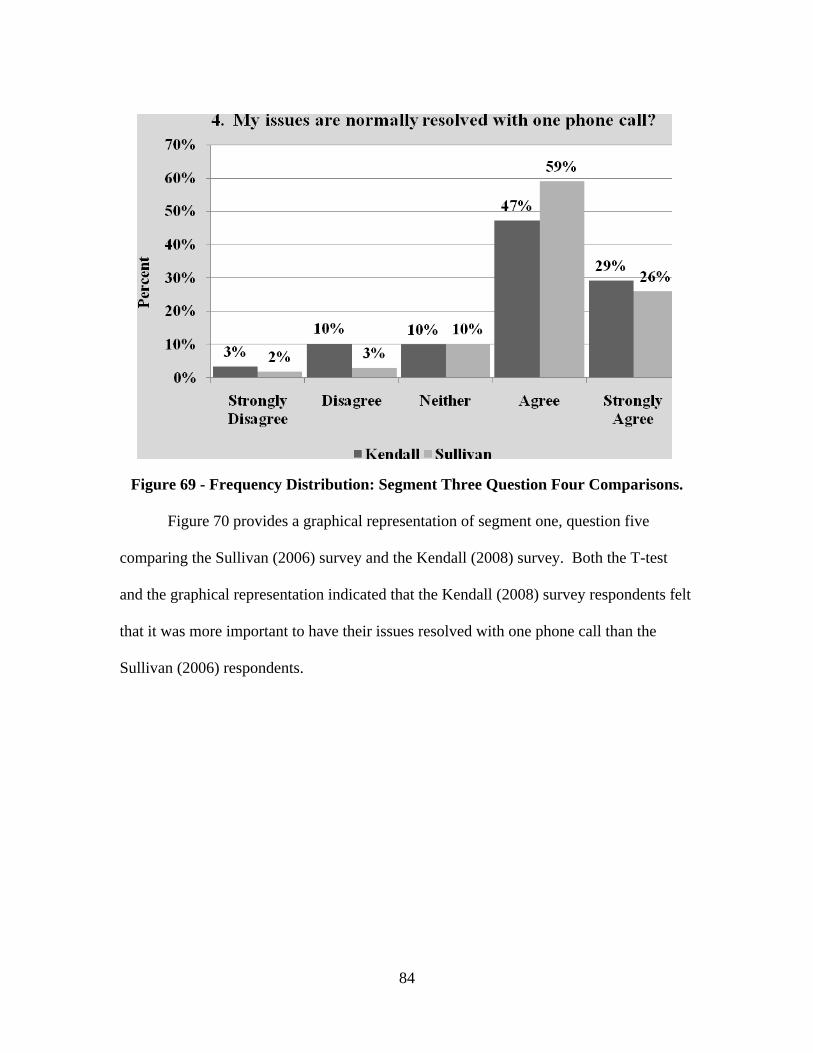
Figure 69 - Frequency Distribution: Segment Three Question Four Comparisons.
Figure 70 provides a graphical representation of segment one, question five
comparing the Sullivan (2006) survey and the Kendall (2008) survey. Both the T-test
and the graphical representation indicated that the Kendall (2008) survey respondents felt
that it was more important to have their issues resolved with one phone call than the
Sullivan (2006) respondents.
84
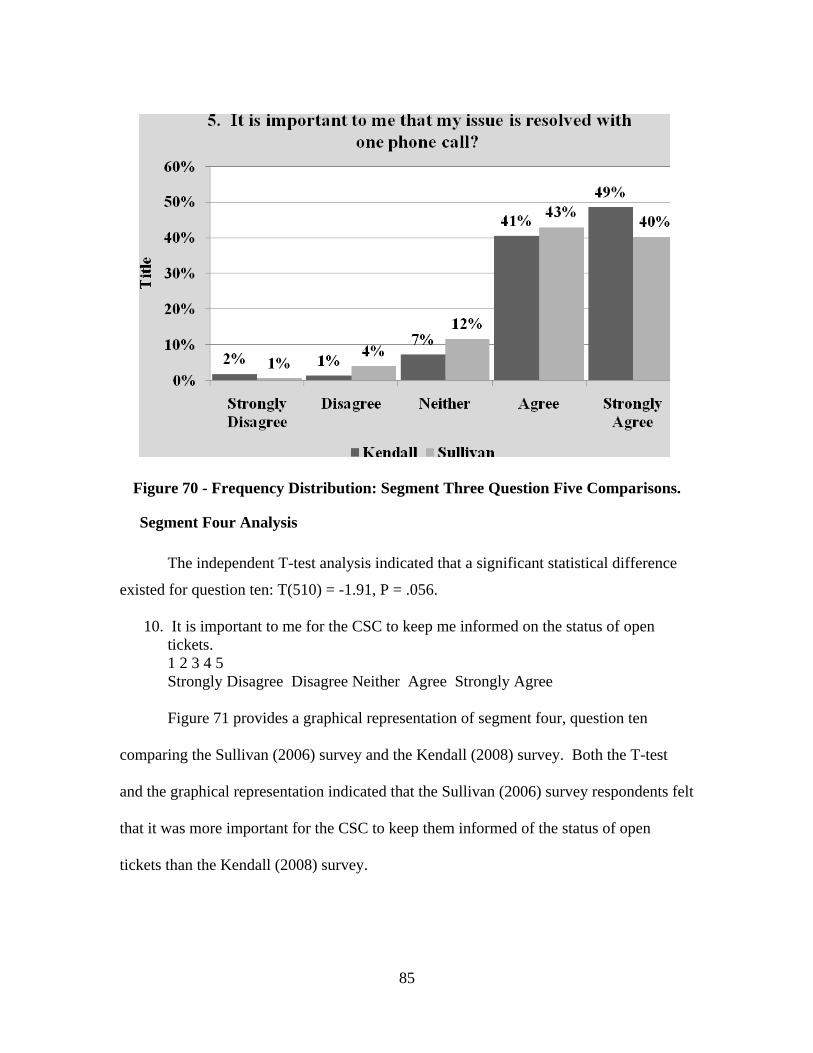
Figure 70 - Frequency Distribution: Segment Three Question Five Comparisons.
Segment Four Analysis The independent T-test analysis indicated that a significant statistical difference
existed for question ten: T(510) = -1.91, P = .056.
10. It is important to me for the CSC to keep me informed on the status of open tickets. 1 2 3 4 5 Strongly Disagree Disagree Neither Agree Strongly Agree Figure 71 provides a graphical representation of segment four, question ten
comparing the Sullivan (2006) survey and the Kendall (2008) survey. Both the T-test
and the graphical representation indicated that the Sullivan (2006) survey respondents felt
that it was more important for the CSC to keep them informed of the status of open
tickets than the Kendall (2008) survey.
85
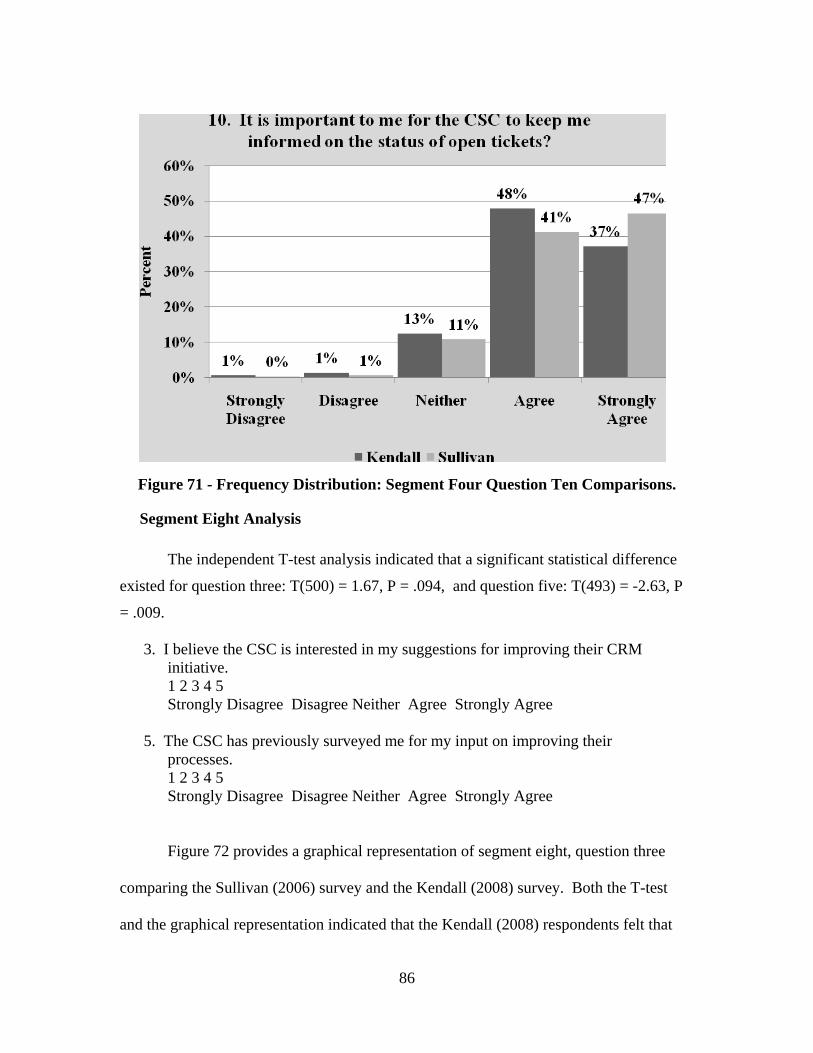
Figure 71 - Frequency Distribution: Segment Four Question Ten Comparisons.
Segment Eight Analysis
The independent T-test analysis indicated that a significant statistical difference
existed for question three: T(500) = 1.67, P = .094, and question five: T(493) = -2.63, P
= .009.
3. I believe the CSC is interested in my suggestions for improving their CRM initiative. 1 2 3 4 5 Strongly Disagree Disagree Neither Agree Strongly Agree
5. The CSC has previously surveyed me for my input on improving their
processes. 1 2 3 4 5 Strongly Disagree Disagree Neither Agree Strongly Agree Figure 72 provides a graphical representation of segment eight, question three
comparing the Sullivan (2006) survey and the Kendall (2008) survey. Both the T-test
and the graphical representation indicated that the Kendall (2008) respondents felt that
86
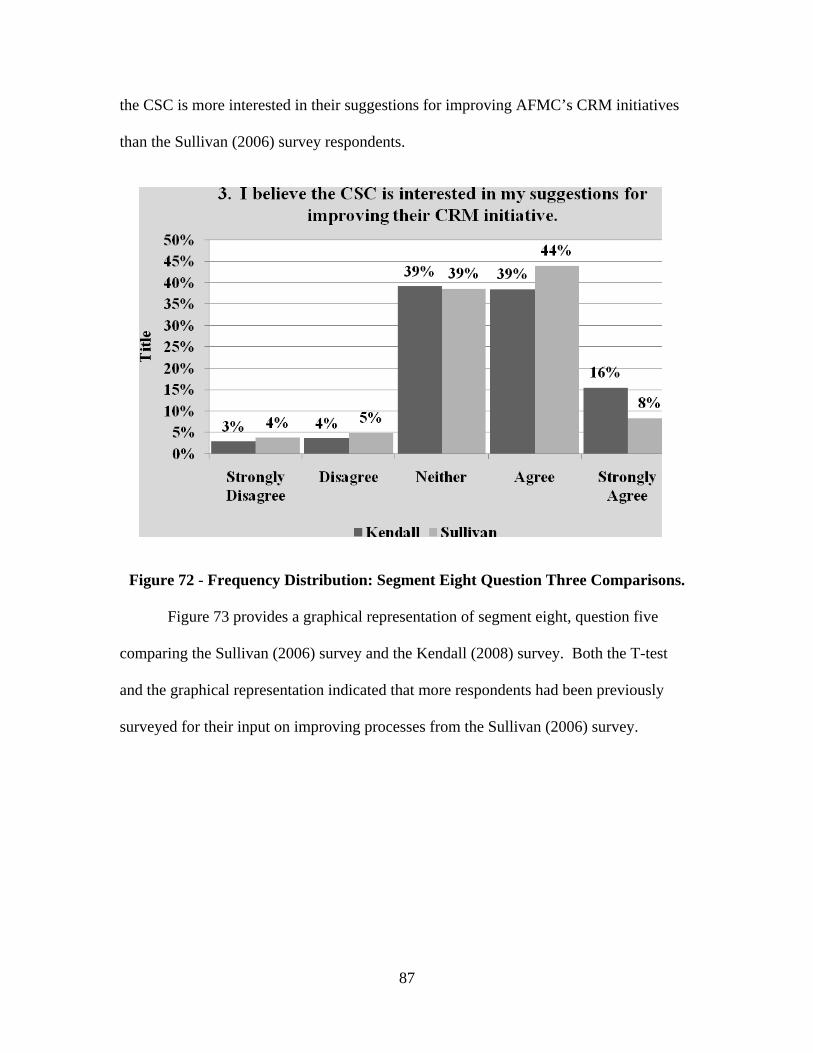
the CSC is more interested in their suggestions for improving AFMC’s CRM initiatives
than the Sullivan (2006) survey respondents.
Figure 72 - Frequency Distribution: Segment Eight Question Three Comparisons.
Figure 73 provides a graphical representation of segment eight, question five
comparing the Sullivan (2006) survey and the Kendall (2008) survey. Both the T-test
and the graphical representation indicated that more respondents had been previously
surveyed for their input on improving processes from the Sullivan (2006) survey.
87
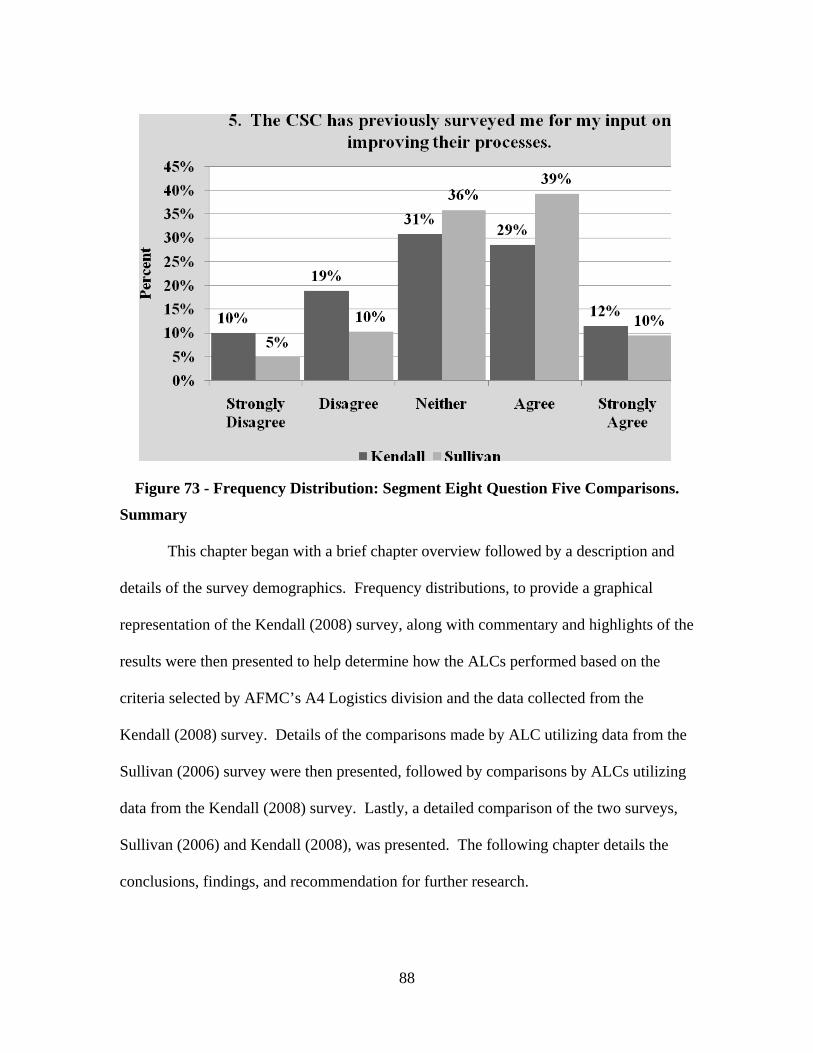
Figure 73 - Frequency Distribution: Segment Eight Question Five Comparisons.
Summary
This chapter began with a brief chapter overview followed by a description and
details of the survey demographics. Frequency distributions, to provide a graphical
representation of the Kendall (2008) survey, along with commentary and highlights of the
results were then presented to help determine how the ALCs performed based on the
criteria selected by AFMC’s A4 Logistics division and the data collected from the
Kendall (2008) survey. Details of the comparisons made by ALC utilizing data from the
Sullivan (2006) survey were then presented, followed by comparisons by ALCs utilizing
data from the Kendall (2008) survey. Lastly, a detailed comparison of the two surveys,
Sullivan (2006) and Kendall (2008), was presented. The following chapter details the
conclusions, findings, and recommendation for further research.
88
V. Conclusions
Chapter Overview The purpose of this chapter is to present and summarize the results of this Thesis.
This chapter begins with a summary of the Kendall (2008) survey results, followed by a
summary of all comparisons that were made, between ALCs for each survey, and finally
between the surveys. This chapter concludes with recommendations to AFMC and areas
for future research. A research summary is provided.
Findings
Four investigative questions were presented at the beginning of this research
focused on answering the overall research question: What are Air Force Material
Command’s external customer issues and satisfaction levels as measured and compared
by Air Logistics Center? Each investigative question is now discussed and the findings
presented for each.
The first investigative question focused on answering the overall research
question was:
1. How are the ALCs performing based on the data collected from the Kendall
(2008) survey criteria that were developed by AFMC’s A4 Logistics division?
The frequency distributions utilized to graphically present the results of the Kendall
(2008) survey demonstrated that the Customer Service Centers (CSCs) are providing
consistently valuable service to the customer. A high percentage of the customer’s
responses were positive throughout each segment of the survey; however, relative to the
other segments, segment eight demonstrated less positive results. Customer responses
indicated that the CSC representatives were handling calls in a timely manner, were
available at convenient times, and were professional, helpful, and friendly. The main
89
questions of the survey dealing directly with the customer’s level of satisfaction with the
CSC showed similar positive results with over eighty-four percent of the participants
rating the overall satisfaction level with the CSC positively. Likewise, when asked if
they had other options, if they would still choose to get services from this Customer
Service Center, over seventy-six percent responded positively. Additionally, the survey
responses indicated that customers of the CSCs would utilize web services to retrieve
information and that those customers would find web services valuable. Again, relative
to the results of the other survey segments, customers did not rate segment eight as
positively based on the customer’s awareness and input on Customer Relationship
Management (CRM) initiatives.
The second investigative question focused on answering the overall research
question was:
2. How does customer satisfaction, based on the survey criteria chosen by AFMC’s
A4 Logistics division, compare between the three ALCs based on the data
collected from the Kendall (2008) research survey?
While many of the questions did show a difference between the three ALCs, as presented
in the previous chapter of this thesis, there were no differences in the overall customer’s
satisfaction levels with the CSCs when comparing questions from segment seven of the
survey. Given the lack of differences concerning segment seven, it is difficult to
determine if one ALC was rated higher, in terms of customer’s level of satisfaction;
however, it does appear, based on the results from the previous chapter, that the Tinker
ALC keeps its customers on hold a less amount of time and is able to resolve the
customers issue in a less amount of time. Additionally, the Tinker ALC customers were
90
more aware of the Call Service Centers’ CRM initiatives which would indicate that they
were better informed. Consistent with the results of the previous investigative question
examined, it appears that the Customer Service Centers (CSCs), at each of the respective
ALCs, provided a valuable service to the customer.
The third investigative question focused on answering the overall research
question was:
3. How does customer satisfaction, based on the survey criteria chosen by AFMC’s
A4 Logistics division, compare between the three ALCs based on data collected
from the Sullivan (2006) research survey?
Just as was concluded concerning the second investigative question, comparing ALCs
from the Kendall (2008) survey, when comparing ALCs from the Sullivan (2006)
survey, there were no differences in the overall customer’s satisfaction levels with the
CSCs; however, there were differences in questions from various segments of the
survey. Hill ALC customers, on average, were on hold a less amount of time than
Tinker ALC and Warner Robbins ALC customers, and Hill ALC customers found
their wait times more acceptable. Additionally, Warner Robbins customers spent a
longer average amount of time on the phone with the customer service representative,
and spent more calls to resolve customer issues. As with the comparisons made from
the Kendall (2008) survey, it appears that the Customer Service Centers (CSCs), at
each of the respective ALCs, provided a valuable service to the customer.
It should be noted at this point that there were no consistent differences when
examining the questions that differed, among the ALCs, between the Kendall (2008)
survey and the Sullivan (2006) survey. In other words, if the ALCs differed
91
concerning one question from the Sullivan (2006) survey, that did not necessarily
mean that the same question would differ from the Kendall (2008) survey.
The fourth, and final investigative question focused on answering the overall
research question was:
4. How does customer satisfaction, based on the survey criteria chosen by AFMC’s
A4 Logistics division, compare between the data collected from the Sullivan
(2006) research survey and the data collected from the Kendall (2008) research
survey?
When comparing the Sullivan (2006) survey to the Kendall (2008) survey,
customer responses indicate that the CSCs have improved upon a few key questions
chosen to be included in the survey instrument. For example, the average hold time
before speaking to a customer service representative had decreased from the time of the
Sullivan (2006) survey to the Kendall (2008) survey, and less Kendall (2008) survey
respondents indicated that they hang up, due to those wait times. On average, the
Kendall (2008) respondents were on the phone, with the customer service representative,
a less amount of time than the Sullivan (2006) respondents. Although these
improvements were made in this area, no improvements in overall customer satisfaction
were realized as illustrated in Figure 74.
92
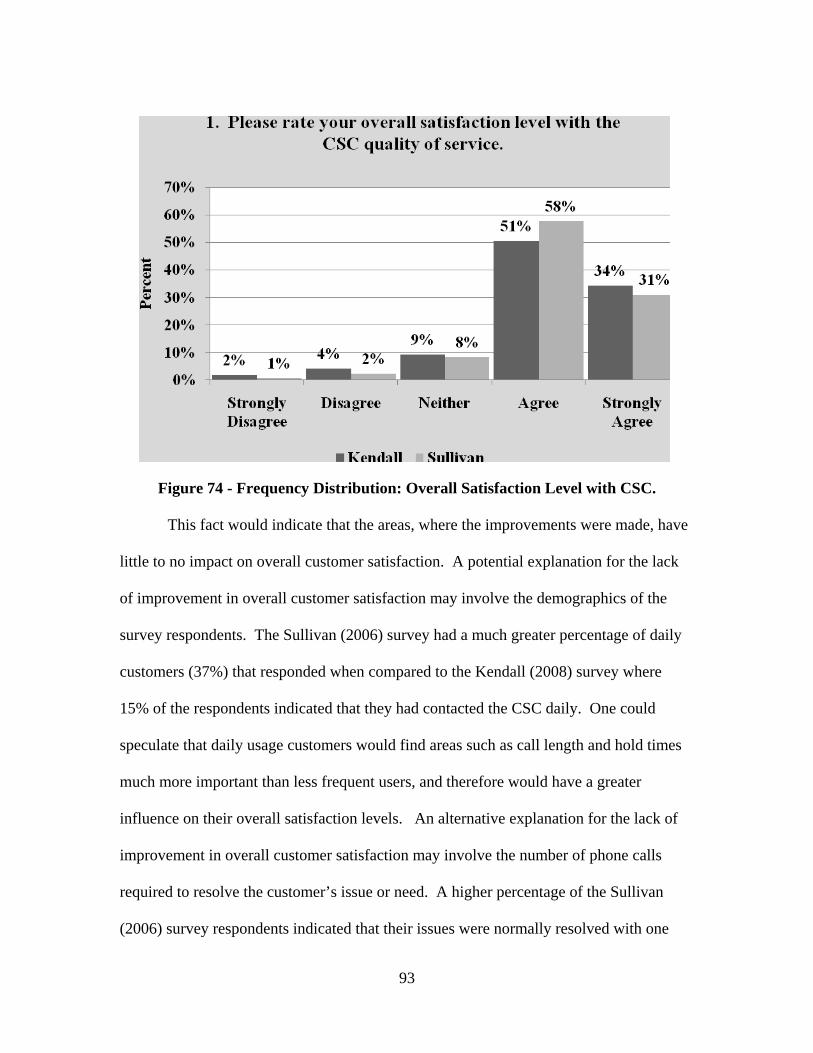
Figure 74 - Frequency Distribution: Overall Satisfaction Level with CSC.
This fact would indicate that the areas, where the improvements were made, have
little to no impact on overall customer satisfaction. A potential explanation for the lack
of improvement in overall customer satisfaction may involve the demographics of the
survey respondents. The Sullivan (2006) survey had a much greater percentage of daily
customers (37%) that responded when compared to the Kendall (2008) survey where
15% of the respondents indicated that they had contacted the CSC daily. One could
speculate that daily usage customers would find areas such as call length and hold times
much more important than less frequent users, and therefore would have a greater
influence on their overall satisfaction levels. An alternative explanation for the lack of
improvement in overall customer satisfaction may involve the number of phone calls
required to resolve the customer’s issue or need. A higher percentage of the Sullivan
(2006) survey respondents indicated that their issues were normally resolved with one
93
phone call when compared to the Kendall (2008) survey; however, the Kendall (2008)
survey respondents felt that it was more important to have their issues resolved with one
phone call than the Sullivan (2006) respondents. Additionally, several responses under
the additional comments area of the survey (see VIII. Appendix C: Additional Customer
Comments) indicated that customers were required to make multiple calls to the CSC so
that the CSC representative can retrieve the information from the “item manager”. This
area presents itself as a potential focus area for future customer satisfaction improvement
initiatives.
Recommendations As stated previously in this research, segment eight of the Kendall (2008) survey
was rated with less positive results relative to the remaining segment of the survey.
Segment eight dealt with the customer’s awareness and input on Customer Relationship
Management (CRM) initiatives. AFMC should continue its efforts to familiarize and
educate individuals on the CRM initiatives that are in place as well as the services that
the CSCs offer. Additionally, as demonstrated in segment eight, AFMC should continue
to seek its customer’s opinions and inputs for future improvements and CRM
implementation efforts.
Secondly, as stated in (Sullivan, 2006:85) AFMC should continue to utilize the
research effort of Sullivan (2006) and this current research effort as a baseline for further
customer satisfaction improvement initiatives and comparisons. The combined efforts of
these research initiatives provide AFMC with a solid framework for consideration in its
effort to continue its Customer Relationship Management implementation.
94
The third recommendation is for AFMC to analyze the comparisons made
between ALCs, from this research, as well as the comparisons that were made between
the two surveys, and attempt to identify similarities and differences that would provide
guidance for future improvement efforts. Individuals with firsthand knowledge of the
operations and processes performed by the Customer Service Centers will be better able
to identify the key areas where the improvements can be made when examining the
similarities and differences.
The fourth and final recommendation is for AFMC to investigate the reason for
the number of phone calls required to resolve the customer’s issue or needs as identified
in the findings section of this chapter. As stated, this may prove to be an area for future
customer satisfaction improvements efforts.
Research Summary The purpose of this research was to help AFMC determine and improve its overall
customer satisfaction. The research question that this research effort attempted to answer
was: What are Air Force Material Command’s external customer issues and satisfaction
levels as measured and compared by Air Logistics Center? This effort, combined with
the effort of the Sullivan (2006) research, provides AFMC with a solid platform upon
which to build future customer satisfaction and Customer Relationship Management
initiatives.
95
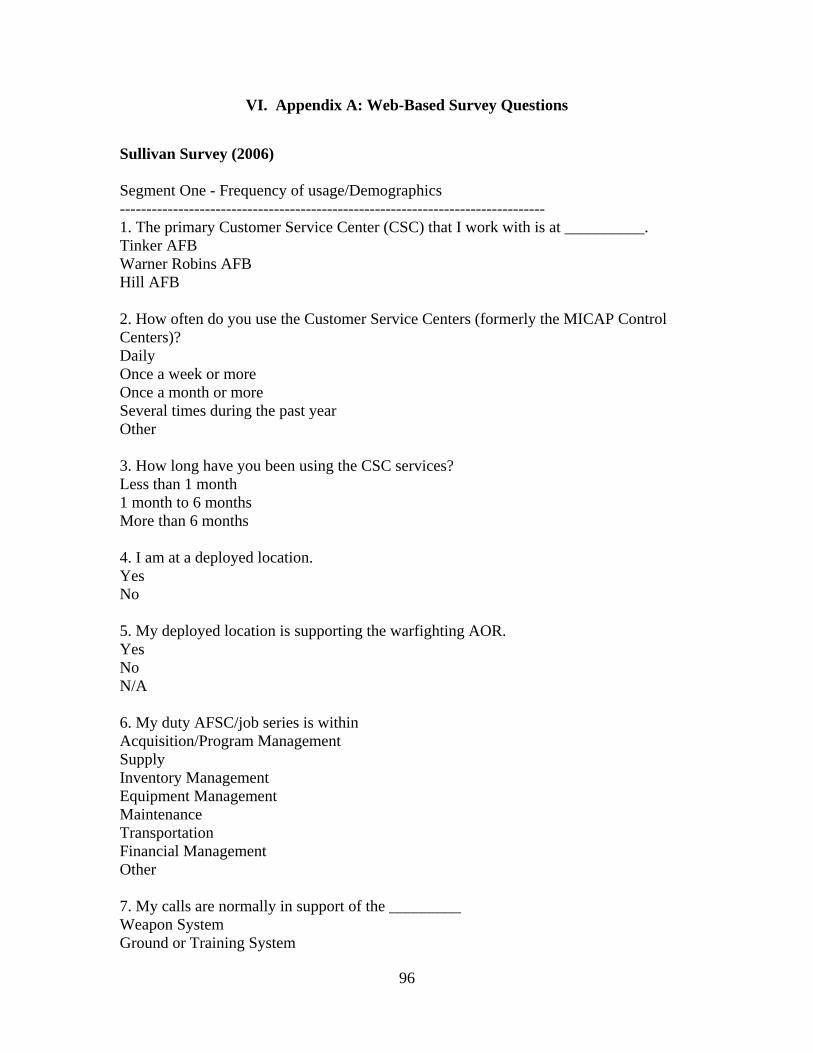
VI. Appendix A: Web-Based Survey Questions
Sullivan Survey (2006) Segment One - Frequency of usage/Demographics -------------------------------------------------------------------------------- 1. The primary Customer Service Center (CSC) that I work with is at __________. Tinker AFB Warner Robins AFB Hill AFB 2. How often do you use the Customer Service Centers (formerly the MICAP Control Centers)? Daily Once a week or more Once a month or more Several times during the past year Other 3. How long have you been using the CSC services? Less than 1 month 1 month to 6 months More than 6 months 4. I am at a deployed location. Yes No 5. My deployed location is supporting the warfighting AOR. Yes No N/A 6. My duty AFSC/job series is within Acquisition/Program Management Supply Inventory Management Equipment Management Maintenance Transportation Financial Management Other 7. My calls are normally in support of the _________ Weapon System Ground or Training System
96
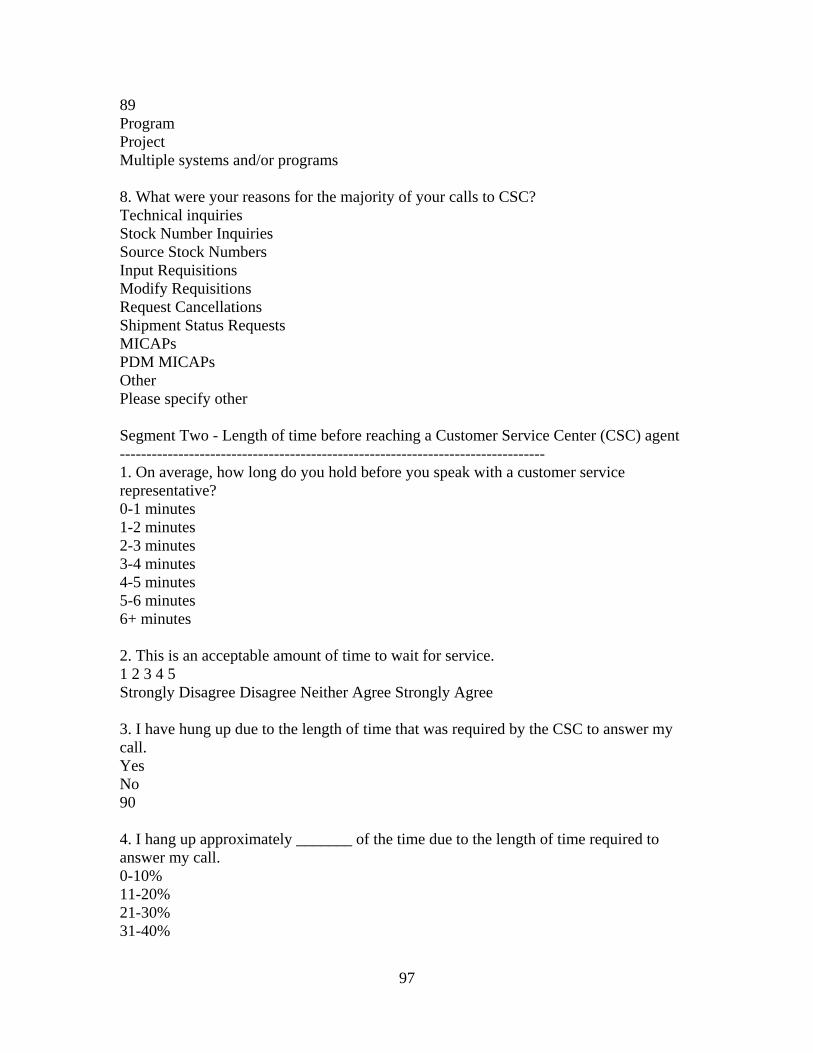
89 Program Project Multiple systems and/or programs 8. What were your reasons for the majority of your calls to CSC? Technical inquiries Stock Number Inquiries Source Stock Numbers Input Requisitions Modify Requisitions Request Cancellations Shipment Status Requests MICAPs PDM MICAPs Other Please specify other Segment Two - Length of time before reaching a Customer Service Center (CSC) agent -------------------------------------------------------------------------------- 1. On average, how long do you hold before you speak with a customer service representative? 0-1 minutes 1-2 minutes 2-3 minutes 3-4 minutes 4-5 minutes 5-6 minutes 6+ minutes 2. This is an acceptable amount of time to wait for service. 1 2 3 4 5 Strongly Disagree Disagree Neither Agree Strongly Agree 3. I have hung up due to the length of time that was required by the CSC to answer my call. Yes No 90 4. I hang up approximately _______ of the time due to the length of time required to answer my call. 0-10% 11-20% 21-30% 31-40%
97
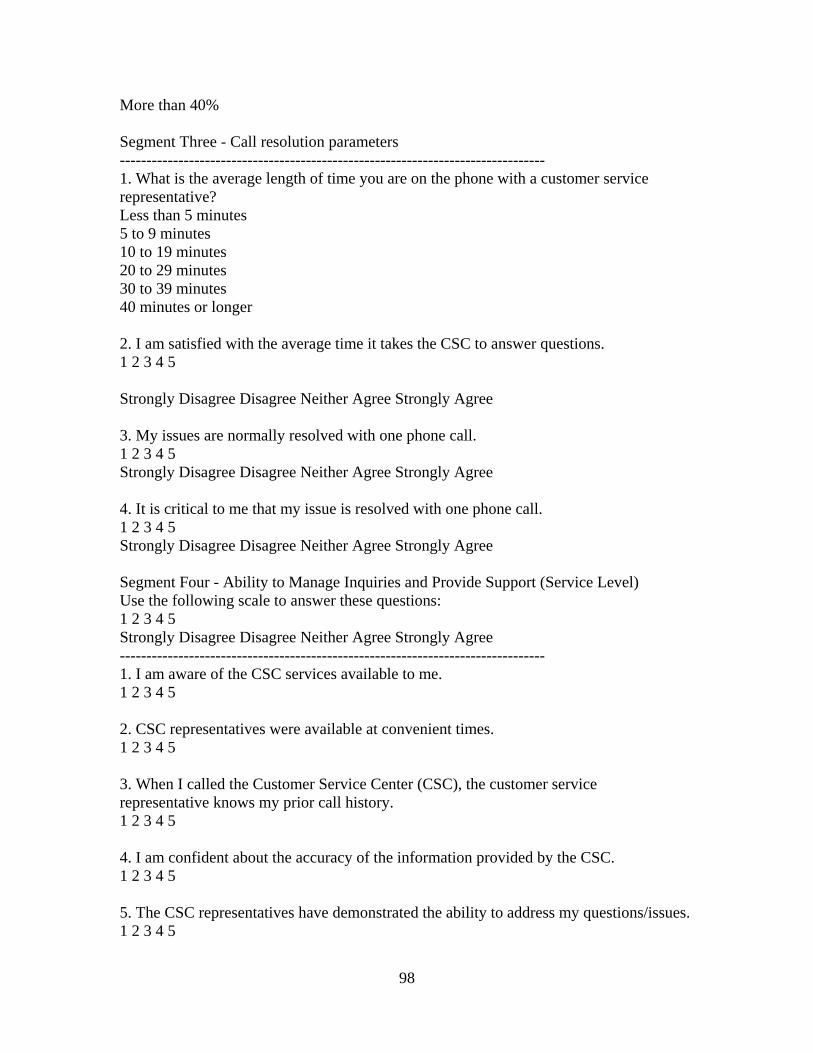
More than 40% Segment Three - Call resolution parameters -------------------------------------------------------------------------------- 1. What is the average length of time you are on the phone with a customer service representative? Less than 5 minutes 5 to 9 minutes 10 to 19 minutes 20 to 29 minutes 30 to 39 minutes 40 minutes or longer 2. I am satisfied with the average time it takes the CSC to answer questions. 1 2 3 4 5 Strongly Disagree Disagree Neither Agree Strongly Agree 3. My issues are normally resolved with one phone call. 1 2 3 4 5 Strongly Disagree Disagree Neither Agree Strongly Agree 4. It is critical to me that my issue is resolved with one phone call. 1 2 3 4 5 Strongly Disagree Disagree Neither Agree Strongly Agree Segment Four - Ability to Manage Inquiries and Provide Support (Service Level) Use the following scale to answer these questions: 1 2 3 4 5 Strongly Disagree Disagree Neither Agree Strongly Agree -------------------------------------------------------------------------------- 1. I am aware of the CSC services available to me. 1 2 3 4 5 2. CSC representatives were available at convenient times. 1 2 3 4 5 3. When I called the Customer Service Center (CSC), the customer service representative knows my prior call history. 1 2 3 4 5 4. I am confident about the accuracy of the information provided by the CSC. 1 2 3 4 5 5. The CSC representatives have demonstrated the ability to address my questions/issues. 1 2 3 4 5
98
6. The CSC delivers answers when they say they will. 1 2 3 4 5 7. If available, I would communicate with the CSC via email at least part of the time. 1 2 3 4 5 8. In order to answer my question, the CSC representatives refer me to another person approximately _____ of the time. 0% Less than10% 11-20% 21-30% 31-40% More than 40% 9. It is important to me for the CSC to keep me informed on the status of open tickets. 1 2 3 4 5 Segment Five - Web Services (Awareness of existing services, and desire/drive to use them) -------------------------------------------------------------------------------- Use the following scale to answer these questions: 1 2 3 4 5 Strongly Disagree Disagree Neither Agree Strongly Agree -------------------------------------------------------------------------------- 1. If available, I would access information about CSC services using the Internet. 1 2 3 4 5 2. It would be valuable to me to be able to track the status of a question via a web page 1 2 3 4 5 3. I would like a web-based service to be provided. 1 2 3 4 5 4. I would prefer to query the CSC the following way(s). (Please mark all answers that apply.) By Telephone Through a Web-Site Using Email Through an Instant Messaging Capability
99
Segment Six – Satisfaction Level with CSC Representatives -------------------------------------------------------------------------------- Use the following scale to answer these questions: 1 2 3 4 5 Strongly Disagree Disagree Neither Agree Strongly Agree -------------------------------------------------------------------------------- 1. The CSC representative was professional. 1 2 3 4 5 2. The CSC representative was helpful. 1 2 3 4 5 3. The CSC representative was friendly. 1 2 3 4 5 4. The CSC representative understood my question/needs. 1 2 3 4 5 5. The CSC representative understood the urgency of my request. 1 2 3 4 5 Segment Seven – Overall Satisfaction with the Customer Service Center (CSC) -------------------------------------------------------------------------------- Use the following scale to answer these questions: 1 2 3 4 5 Strongly Disagree Disagree Neither Agree Strongly Agree -------------------------------------------------------------------------------- 1. Please rate your overall satisfaction level with the CSC quality of service. 1 2 3 4 5 2. If I had other options, I would still choose to get services from this Customer Service Center. 1 2 3 4 5 Segment Eight – Awareness and Customer Input on CRM Initiative -------------------------------------------------------------------------------- 1 2 3 4 5 Strongly Disagree Disagree Neither Agree Strongly Agree -------------------------------------------------------------------------------- 1. I am aware Customer Relationship Management (CRM) is a transformation initiative that includes the CSC. 1 2 3 4 5 2. I was aware of the Call Service Centers’ CRM initiative before it began. 1 2 3 4 5
100
3. I believe the CSC is interested in my suggestions for improving their CRM initiative. 1 2 3 4 5 4. I believe the CSC has used suggestions from their customers to improve their CSC operations. 1 2 3 4 5 5. The CSC has surveyed me for my input on improving their processes. 1 2 3 4 5 6. I can see the results of my inputs over time. 1 2 3 4 5 7. The CSC has continued to update me on the progress of their CRM initiatives. 1 2 3 4 5
Kendall Survey (2008)
Segment One - Frequency of usage/Demographics -------------------------------------------------------------------------------- 1. The primary Customer Service Center (CSC) that I work with is at __________. Tinker AFB Warner Robins AFB Hill AFB 2. How often do you use the Customer Service Centers (formerly the MICAP Control Centers)? Daily Once a week or more Once a month or more Several times during the past year Please specify other ________ 3. How long have you been using the CSC services? Less than 1 month 1 month to 6 months More than 6 months 4. I am at a deployed location. Yes No 5. If you answered yes to the previous question, then please indicate if your deployed location is supporting the warfighting AOR. Yes No
101
N/A 6. My duty AFSC/job series is within Acquisition/Program Management Supply Inventory Management Equipment Management Maintenance Transportation Financial Management Please specify other ________ 7. My calls are normally in support of the _________ Weapon System Ground or Training System Program Project Multiple systems and/or programs Please specify other ________ 8. What were your reasons for the majority of your calls to CSC? (Please indicate all that apply). Technical inquiries Stock Number Inquiries Source Stock Numbers Input Requisitions Modify Requisitions Request Cancellations Shipment Status Requests MICAPs PDM MICAPs Other Please specify other Segment Two - Length of time before reaching a Customer Service Center (CSC) agent -------------------------------------------------------------------------------- 1. During your most recent call, how long did you hold before you spoke with a customer service representative? 0-1 minutes 1-2 minutes 2-3 minutes 3-4 minutes 4-5 minutes 5-6 minutes 6+ minutes
102
2. On average, how long do you hold before you speak with a customer service representative? 0-1 minutes 1-2 minutes 2-3 minutes 3-4 minutes 4-5 minutes 5-6 minutes 6+ minutes 3. This is an acceptable amount of time to wait for service. 1 2 3 4 5 Strongly Disagree Disagree Neither Agree Strongly Agree 4. I have hung up due to the length of time that was required by the CSC to answer my call. Yes No 90 5. I hang up approximately _______ of the time due to the length of time required to answer my call. 0-10% 11-20% 21-30% 31-40% More than 40% Segment Three - Call resolution parameters -------------------------------------------------------------------------------- 1. During your most recent call, how long were you on the phone with the customer service representative? Less than 5 minutes 5 to 9 minutes 10 to 19 minutes 20 to 29 minutes 30 to 39 minutes 40 minutes or longer 2. What is the average length of time you are on the phone with a customer service representative? Less than 5 minutes 5 to 9 minutes 10 to 19 minutes 20 to 29 minutes 30 to 39 minutes
103
40 minutes or longer 3. The CSC answers my questions in a timely manner. 1 2 3 4 5 Strongly Disagree Disagree Neither Agree Strongly Agree 4. My issues are normally resolved with one phone call. 1 2 3 4 5 Strongly Disagree Disagree Neither Agree Strongly Agree 5. It is critical to me that my issue is resolved with one phone call. 1 2 3 4 5 Strongly Disagree Disagree Neither Agree Strongly Agree Segment Four - Ability to Manage Inquiries and Provide Support (Service Level) Use the following scale to answer these questions: 1 2 3 4 5 Strongly Disagree Disagree Neither Agree Strongly Agree -------------------------------------------------------------------------------- 1. I am aware of the CSC services available to me. 1 2 3 4 5 2. CSC representatives were available at convenient times. 1 2 3 4 5 3. When I called the Customer Service Center (CSC), the customer service representative knows my prior call history. 1 2 3 4 5 4. I am confident about the accuracy of the information provided by the CSC. 1 2 3 4 5 5. The CSC representatives have demonstrated the ability to address my questions/issues. 1 2 3 4 5 6. The CSC is proactive when helping me resolve a problem/issue. 1 2 3 4 5 7. The CSC delivers answers when they say they will. 1 2 3 4 5 8. If available, I would communicate with the CSC via email at least part of the time. 1 2 3 4 5 9. In order to answer my question, the CSC representatives refer me to another person approximately _____ of the time.
104
0% Less than10% 11-20% 21-30% 31-40% More than 40% 10. It is important to me for the CSC to keep me informed on the status of open tickets. 1 2 3 4 5 11. The CSC does a good job keeping me informed on the status of open tickets. 1 2 3 4 5 Segment Five - Web Services (Awareness of existing services, and desire/drive to use them) -------------------------------------------------------------------------------- Use the following scale to answer these questions: 1 2 3 4 5 Strongly Disagree Disagree Neither Agree Strongly Agree -------------------------------------------------------------------------------- 1. If available, I would access information about CSC services using the Internet. 1 2 3 4 5 2. It would be valuable to me to be able to track the status of a question via a web page 1 2 3 4 5 3. I would like a web-based service to be provided. 1 2 3 4 5 4. I would like to use the internet for the following services. (Please indicate all that apply). 0 Technical inquiry 0 Stock Number Inquiry 0 Source Stock Number 0 Modify Requisition 0 Request Cancellation 0 Shipment Status Request 0 MICAP 0 PDM MICAP 0 Other Please specify other ________ 5. I would prefer to query the CSC the following way(s). (Please mark all answers that apply.) By Telephone
105
Through a Web-Site Using Email Through an Instant Messaging Capability Segment Six – Satisfaction Level with CSC Representatives -------------------------------------------------------------------------------- Use the following scale to answer these questions: 1 2 3 4 5 Strongly Disagree Disagree Neither Agree Strongly Agree -------------------------------------------------------------------------------- 1. In general, the CSC representative was professional. 1 2 3 4 5 2. In general, the CSC representative was helpful. 1 2 3 4 5 3. In general, the CSC representative was friendly. 1 2 3 4 5 4. In general, the CSC representative understood my question/needs. 1 2 3 4 5 5. In general, the CSC representatives are knowledgeable. 1 2 3 4 5 6. In general, the CSC representative understood the urgency of my request. 1 2 3 4 5
7. In general, the CSC notifies me in advance when there is an issue/problem with my order. 1 2 3 4 5 N/A Segment Seven – Overall Satisfaction with the Customer Service Center (CSC) -------------------------------------------------------------------------------- Use the following scale to answer these questions: 1 2 3 4 5 Strongly Disagree Disagree Neither Agree Strongly Agree -------------------------------------------------------------------------------- 1. Please rate your overall satisfaction level with the CSC quality of service. 1 2 3 4 5 2. If I had other options, I would still choose to get services from this Customer Service Center. 1 2 3 4 5
106
Segment Eight – Awareness and Customer Input on CRM Initiative -------------------------------------------------------------------------------- 1 2 3 4 5 Strongly Disagree Disagree Neither Agree Strongly Agree -------------------------------------------------------------------------------- 1. I am aware that Customer Relationship Management (CRM) is a transformation initiative that includes the CSC. 1 2 3 4 5 2. I was aware of the Call Service Centers’ CRM initiative before it began. 1 2 3 4 5 3. I believe the CSC is interested in my suggestions for improving their CRM initiative. 1 2 3 4 5 4. I believe the CSC has used suggestions from their customers to improve their CSC operations. 1 2 3 4 5 5. The CSC has previously surveyed me for my input on improving their processes. 1 2 3 4 5 6. I can see the results of my inputs over time. 1 2 3 4 5 7. The CSC has continued to update me on the progress of their CRM initiatives. 1 2 3 4 5 Please provide any additional comments/concerns…Your opinion is very important to us! ________________________________________________________________________________________________________________________________________________
107
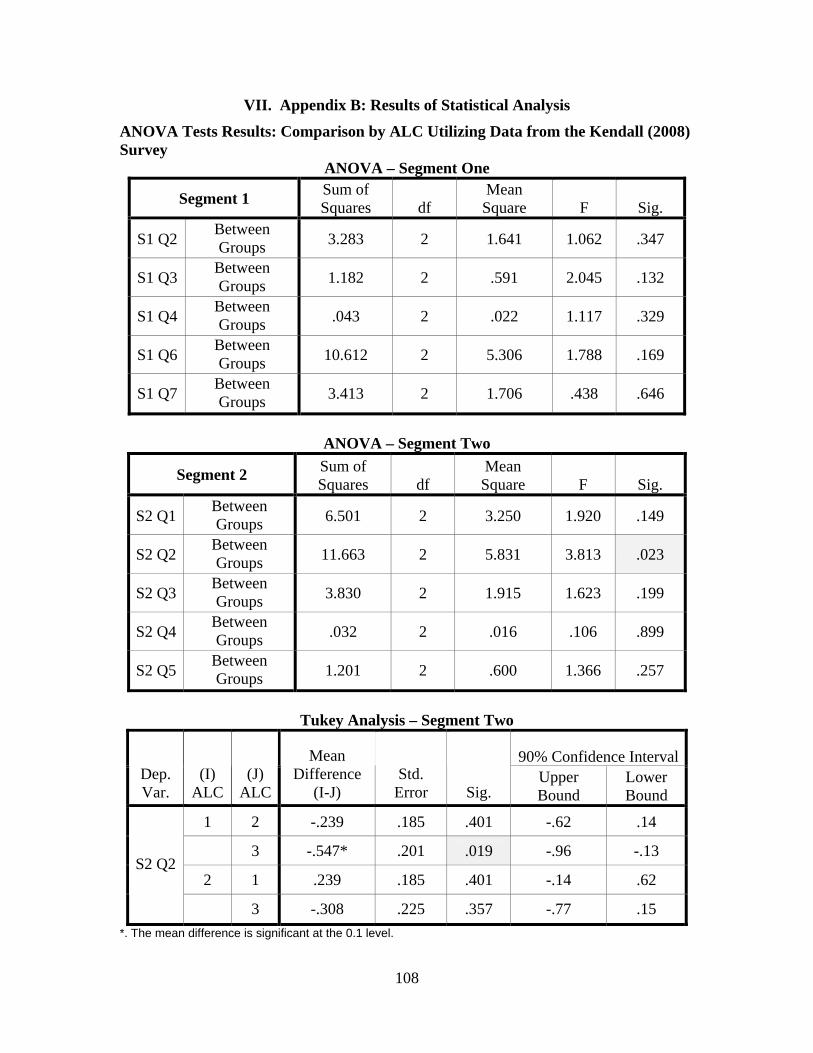
VII. Appendix B: Results of Statistical Analysis
ANOVA Tests Results: Comparison by ALC Utilizing Data from the Kendall (2008) Survey
ANOVA – Segment One
Segment 1 Sum of Squares df
Mean Square F Sig.
S1 Q2 Between Groups 3.283 2 1.641 1.062 .347
S1 Q3 Between Groups 1.182 2 .591 2.045 .132
S1 Q4 Between Groups .043 2 .022 1.117 .329
S1 Q6 Between Groups 10.612 2 5.306 1.788 .169
S1 Q7 Between Groups 3.413 2 1.706 .438 .646
ANOVA – Segment Two
Segment 2 Sum of Squares df
Mean Square F Sig.
S2 Q1 Between Groups 6.501 2 3.250 1.920 .149
S2 Q2 Between Groups 11.663 2 5.831 3.813 .023
S2 Q3 Between Groups 3.830 2 1.915 1.623 .199
S2 Q4 Between Groups .032 2 .016 .106 .899
S2 Q5 Between Groups 1.201 2 .600 1.366 .257
Tukey Analysis – Segment Two
90% Confidence IntervalDep. Var.
(I) ALC
(J) ALC
Mean Difference
(I-J) Std.
Error Sig. Upper Bound
Lower Bound
1 2 -.239 .185 .401 -.62 .14
3 -.547* .201 .019 -.96 -.13
2 1 .239 .185 .401 -.14 .62 S2 Q2
3 -.308 .225 .357 -.77 .15 *. The mean difference is significant at the 0.1 level.
108
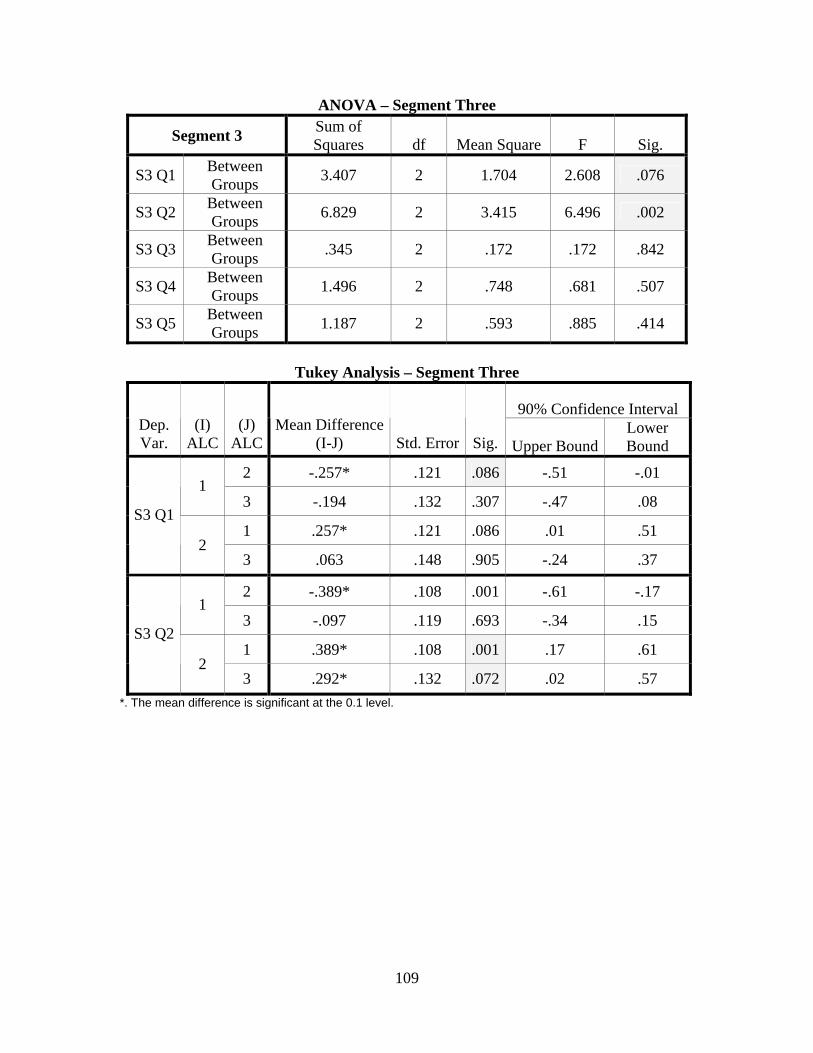
ANOVA – Segment Three
Segment 3 Sum of Squares df Mean Square F Sig.
S3 Q1 Between Groups 3.407 2 1.704 2.608 .076
S3 Q2 Between Groups 6.829 2 3.415 6.496 .002
S3 Q3 Between Groups .345 2 .172 .172 .842
S3 Q4 Between Groups 1.496 2 .748 .681 .507
S3 Q5 Between Groups 1.187 2 .593 .885 .414
Tukey Analysis – Segment Three
90% Confidence Interval Dep. Var.
(I) ALC
(J) ALC
Mean Difference (I-J) Std. Error Sig. Upper Bound
Lower Bound
2 -.257* .121 .086 -.51 -.01 1
3 -.194 .132 .307 -.47 .08
1 .257* .121 .086 .01 .51 S3 Q1
2 3 .063 .148 .905 -.24 .37
2 -.389* .108 .001 -.61 -.17 1
3 -.097 .119 .693 -.34 .15
1 .389* .108 .001 .17 .61 S3 Q2
2 3 .292* .132 .072 .02 .57
*. The mean difference is significant at the 0.1 level.
109
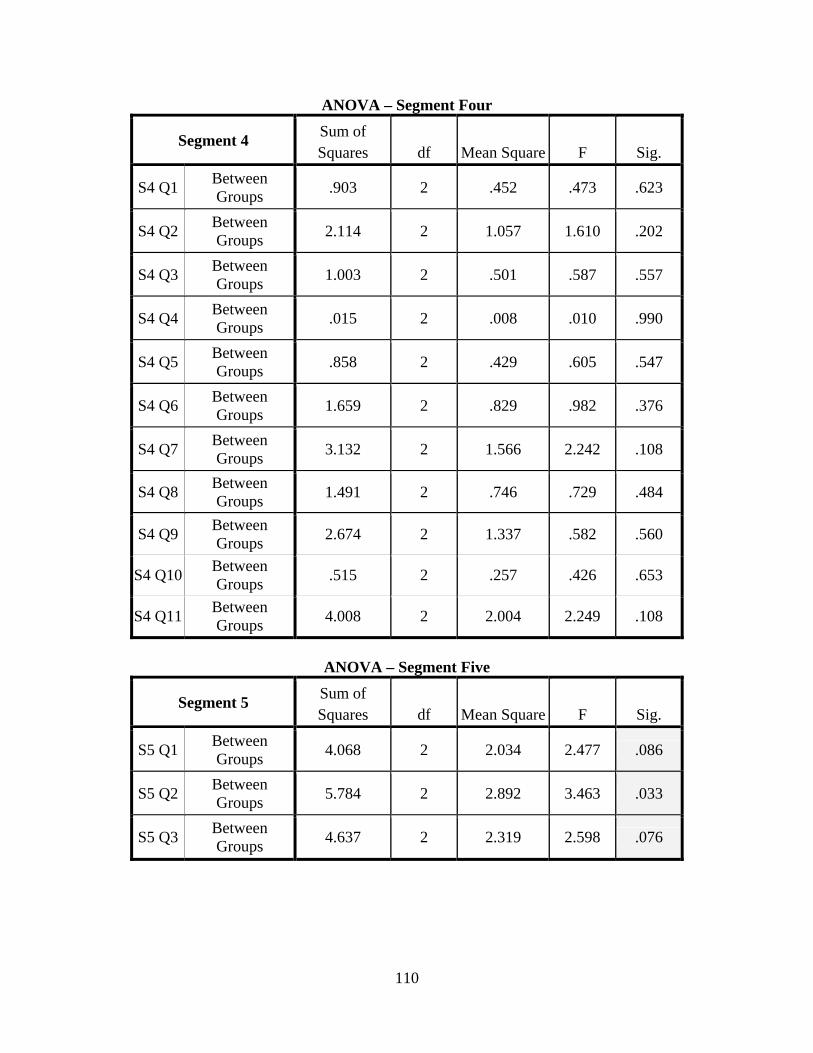
ANOVA – Segment Four
Segment 4 Sum of Squares df Mean Square F Sig.
S4 Q1 Between Groups .903 2 .452 .473 .623
S4 Q2 Between Groups 2.114 2 1.057 1.610 .202
S4 Q3 Between Groups 1.003 2 .501 .587 .557
S4 Q4 Between Groups .015 2 .008 .010 .990
S4 Q5 Between Groups .858 2 .429 .605 .547
S4 Q6 Between Groups 1.659 2 .829 .982 .376
S4 Q7 Between Groups 3.132 2 1.566 2.242 .108
S4 Q8 Between Groups 1.491 2 .746 .729 .484
S4 Q9 Between Groups 2.674 2 1.337 .582 .560
S4 Q10 Between Groups .515 2 .257 .426 .653
S4 Q11 Between Groups 4.008 2 2.004 2.249 .108
ANOVA – Segment Five
Segment 5 Sum of Squares df Mean Square F Sig.
S5 Q1 Between Groups 4.068 2 2.034 2.477 .086
S5 Q2 Between Groups 5.784 2 2.892 3.463 .033
S5 Q3 Between Groups 4.637 2 2.319 2.598 .076
110
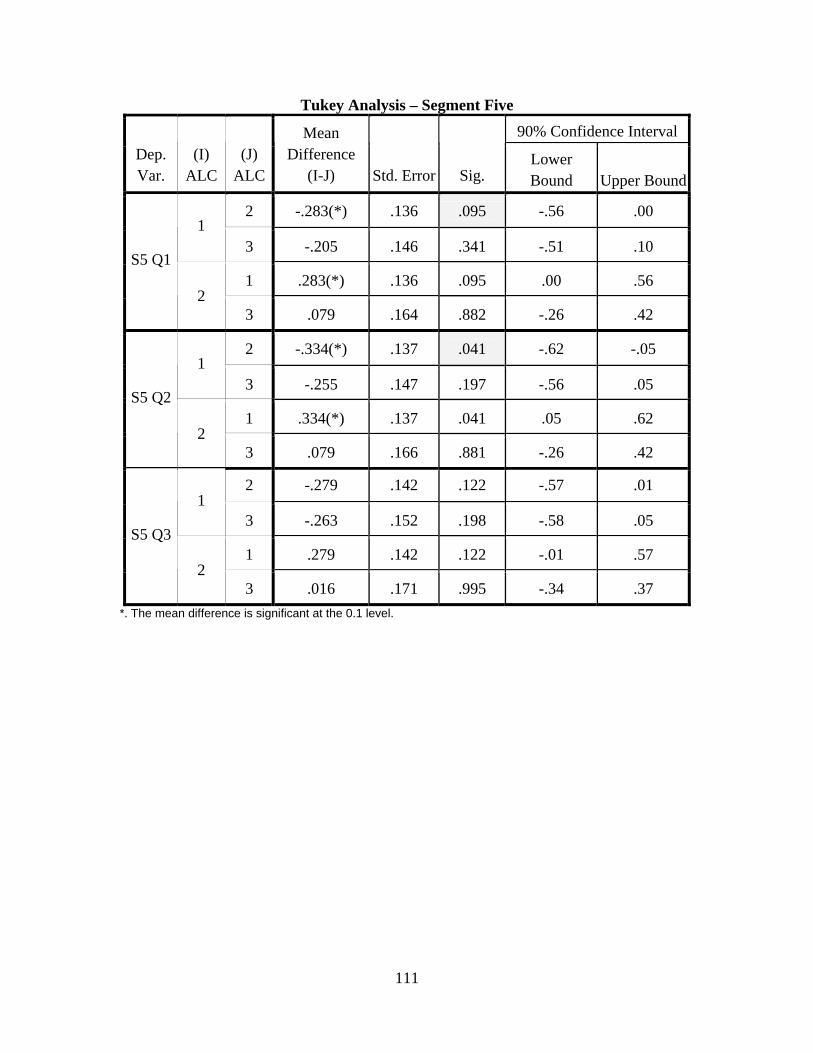
Tukey Analysis – Segment Five
90% Confidence Interval Dep. Var.
(I) ALC
(J) ALC
Mean Difference
(I-J) Std. Error Sig. Lower Bound Upper Bound
2 -.283(*) .136 .095 -.56 .00 1
3 -.205 .146 .341 -.51 .10
1 .283(*) .136 .095 .00 .56 S5 Q1
2 3 .079 .164 .882 -.26 .42
2 -.334(*) .137 .041 -.62 -.05 1
3 -.255 .147 .197 -.56 .05
1 .334(*) .137 .041 .05 .62 S5 Q2
2 3 .079 .166 .881 -.26 .42
2 -.279 .142 .122 -.57 .01 1
3 -.263 .152 .198 -.58 .05
1 .279 .142 .122 -.01 .57 S5 Q3
2 3 .016 .171 .995 -.34 .37
*. The mean difference is significant at the 0.1 level.
111
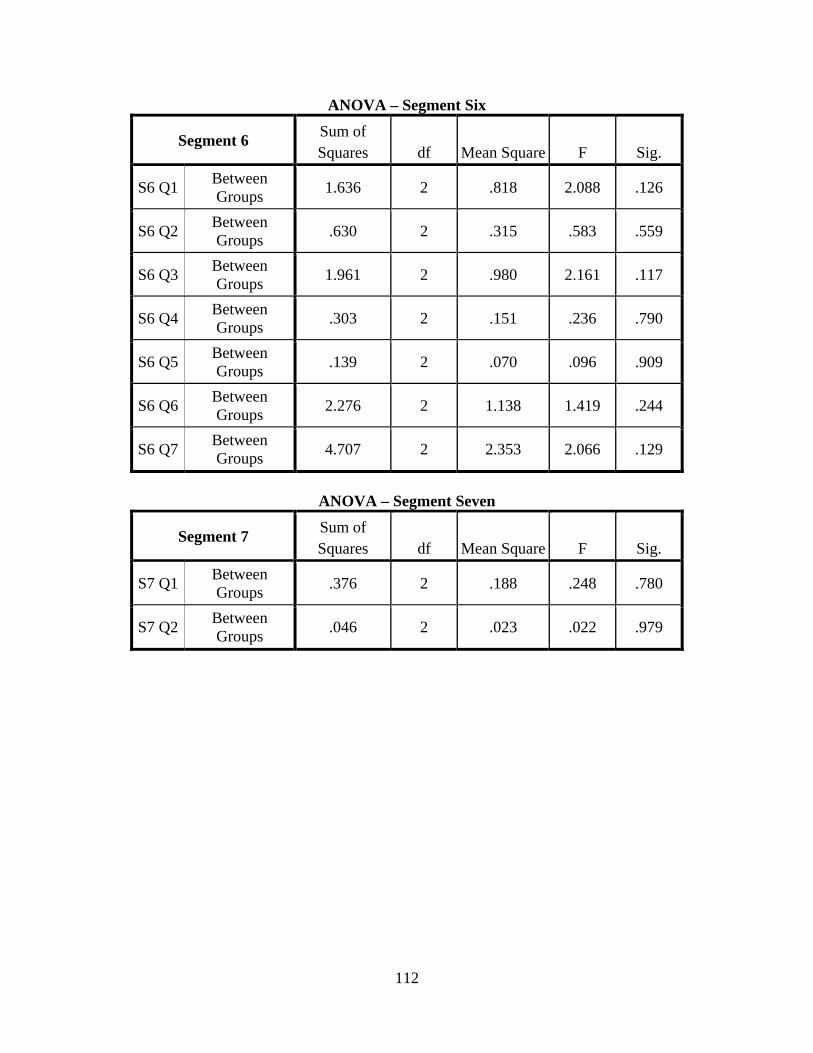
ANOVA – Segment Six
Segment 6 Sum of Squares df Mean Square F Sig.
S6 Q1 Between Groups 1.636 2 .818 2.088 .126
S6 Q2 Between Groups .630 2 .315 .583 .559
S6 Q3 Between Groups 1.961 2 .980 2.161 .117
S6 Q4 Between Groups .303 2 .151 .236 .790
S6 Q5 Between Groups .139 2 .070 .096 .909
S6 Q6 Between Groups 2.276 2 1.138 1.419 .244
S6 Q7 Between Groups 4.707 2 2.353 2.066 .129
ANOVA – Segment Seven
Segment 7 Sum of Squares df Mean Square F Sig.
S7 Q1 Between Groups .376 2 .188 .248 .780
S7 Q2 Between Groups .046 2 .023 .022 .979
112
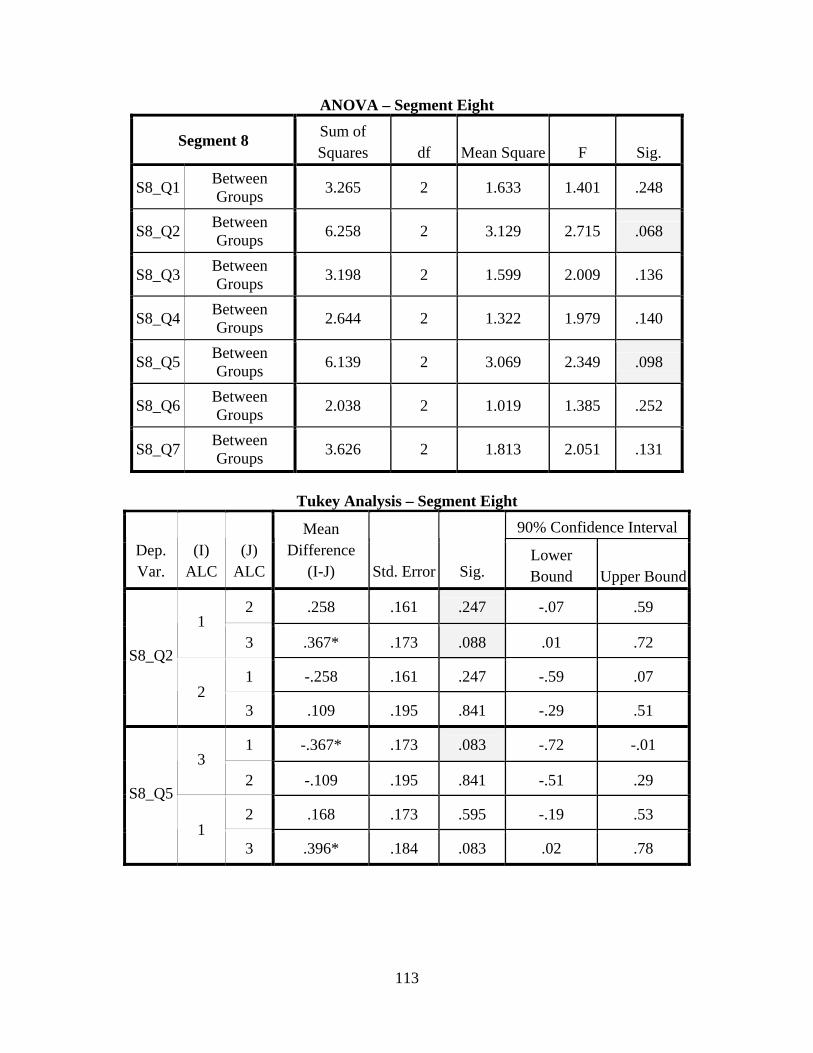
ANOVA – Segment Eight
Segment 8 Sum of Squares df Mean Square F Sig.
S8_Q1 Between Groups 3.265 2 1.633 1.401 .248
S8_Q2 Between Groups 6.258 2 3.129 2.715 .068
S8_Q3 Between Groups 3.198 2 1.599 2.009 .136
S8_Q4 Between Groups 2.644 2 1.322 1.979 .140
S8_Q5 Between Groups 6.139 2 3.069 2.349 .098
S8_Q6 Between Groups 2.038 2 1.019 1.385 .252
S8_Q7 Between Groups 3.626 2 1.813 2.051 .131
Tukey Analysis – Segment Eight
90% Confidence Interval Dep. Var.
(I) ALC
(J) ALC
Mean Difference
(I-J) Std. Error Sig. Lower Bound Upper Bound
2 .258 .161 .247 -.07 .59 1
3 .367* .173 .088 .01 .72
1 -.258 .161 .247 -.59 .07 S8_Q2
2 3 .109 .195 .841 -.29 .51
1 -.367* .173 .083 -.72 -.01 3
2 -.109 .195 .841 -.51 .29
2 .168 .173 .595 -.19 .53 S8_Q5
1 3 .396* .184 .083 .02 .78
113
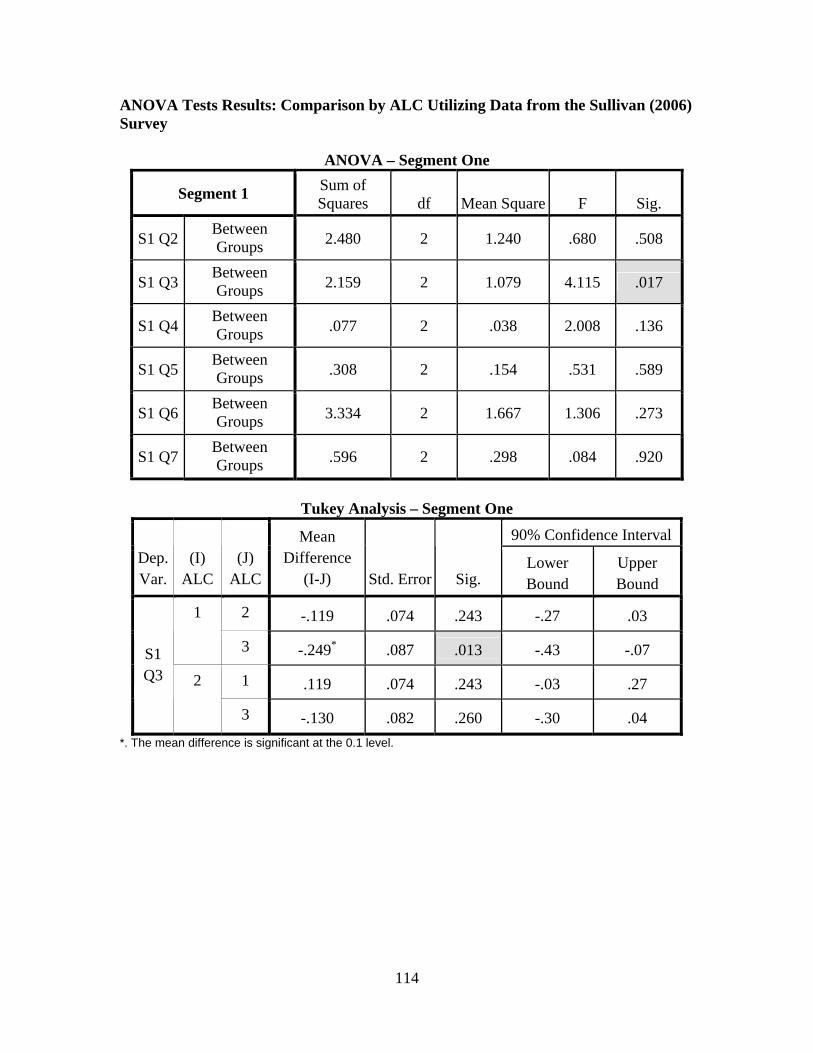
ANOVA Tests Results: Comparison by ALC Utilizing Data from the Sullivan (2006) Survey
ANOVA – Segment One
Segment 1 Sum of Squares df Mean Square F Sig.
S1 Q2 Between Groups 2.480 2 1.240 .680 .508
S1 Q3 Between Groups 2.159 2 1.079 4.115 .017
S1 Q4 Between Groups .077 2 .038 2.008 .136
S1 Q5 Between Groups .308 2 .154 .531 .589
S1 Q6 Between Groups 3.334 2 1.667 1.306 .273
S1 Q7 Between Groups .596 2 .298 .084 .920
Tukey Analysis – Segment One
*. The mean difference is significant at the 0.1 level.
90% Confidence Interval Dep. Var.
(I) ALC
(J) ALC
Mean Difference
(I-J) Std. Error Sig. Lower Bound
Upper Bound
2 -.119 .074 .243 -.27 .03 1
3 -.249* .087 .013 -.43 -.07
1 .119 .074 .243 -.03 .27
S1 Q3 2
3 -.130 .082 .260 -.30 .04
114
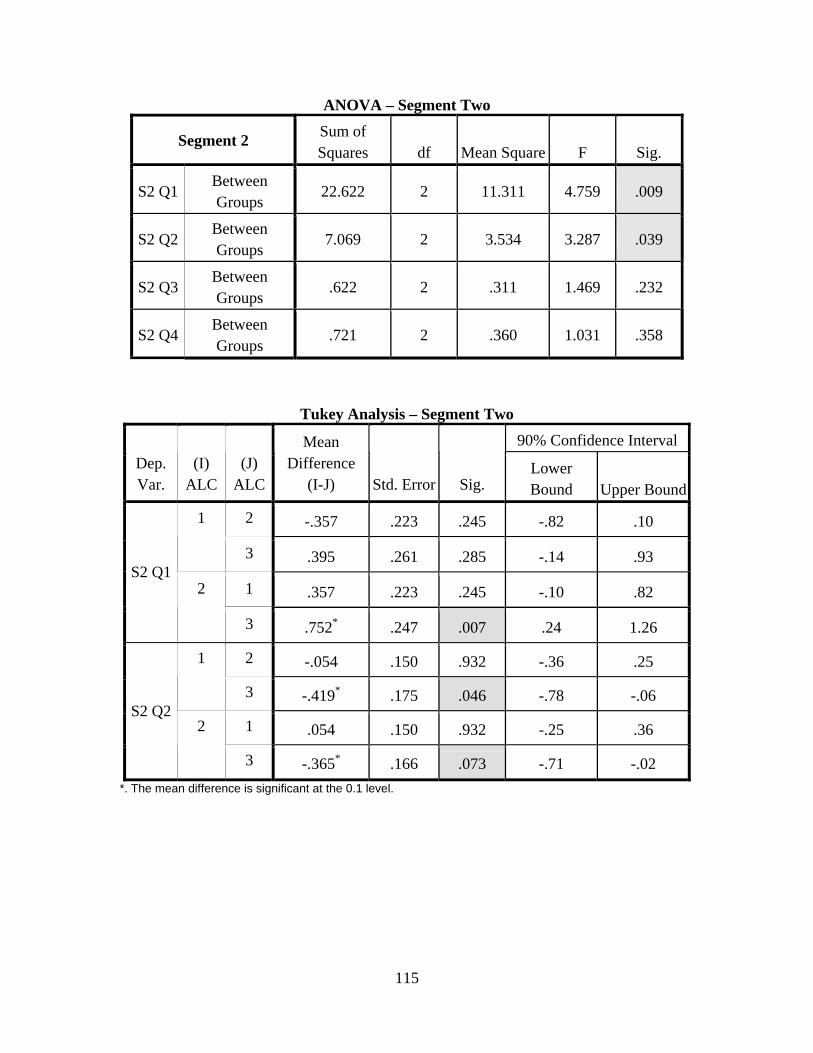
ANOVA – Segment Two
Segment 2 Sum of Squares df Mean Square F Sig.
S2 Q1 Between Groups
22.622 2 11.311 4.759 .009
S2 Q2 Between Groups
7.069 2 3.534 3.287 .039
S2 Q3 Between Groups
.622 2 .311 1.469 .232
S2 Q4 Between Groups
.721 2 .360 1.031 .358
Tukey Analysis – Segment Two 90% Confidence Interval
Dep. Var.
(I) ALC
(J) ALC
Mean Difference
(I-J) Std. Error Sig. Lower Bound Upper Bound
2 -.357 .223 .245 -.82 .10 1
3 .395 .261 .285 -.14 .93
1 .357 .223 .245 -.10 .82 S2 Q1
2
3 .752* .247 .007 .24 1.26
2 -.054 .150 .932 -.36 .25 1
3 -.419* .175 .046 -.78 -.06
1 .054 .150 .932 -.25 .36 S2 Q2
2
3 -.365* .166 .073 -.71 -.02 *. The mean difference is significant at the 0.1 level.
115
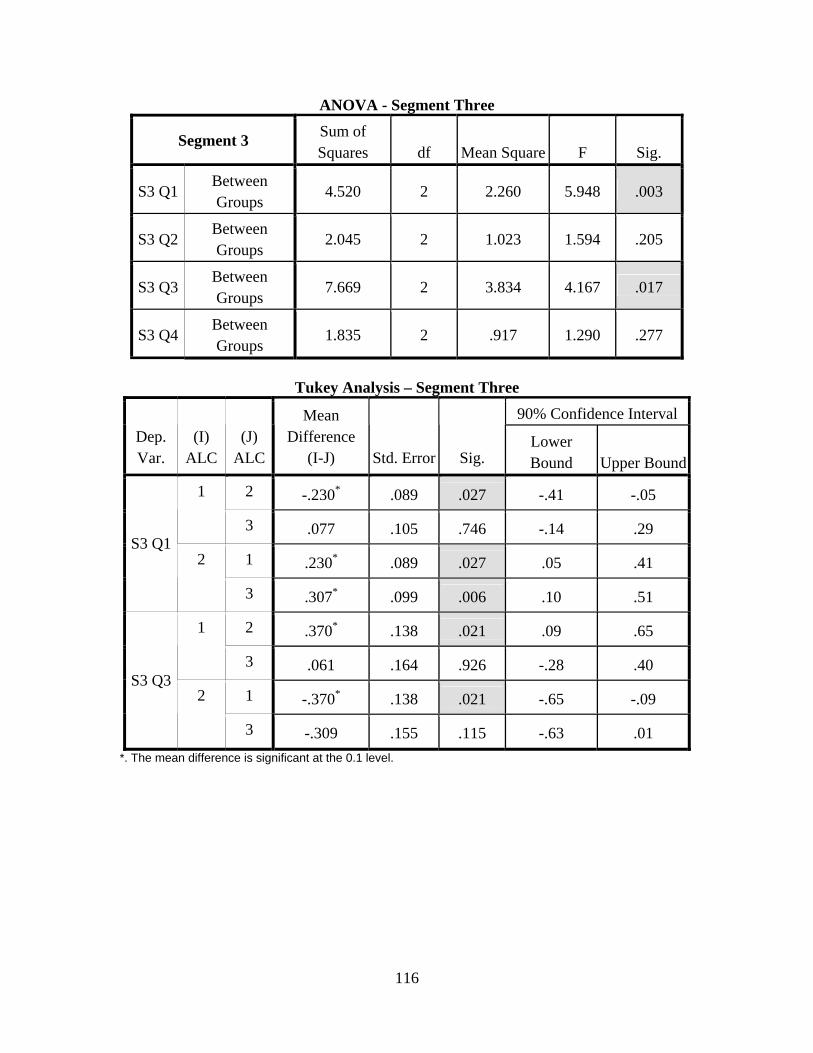
ANOVA - Segment Three
Segment 3 Sum of Squares df Mean Square F Sig.
S3 Q1 Between Groups
4.520 2 2.260 5.948 .003
S3 Q2 Between Groups
2.045 2 1.023 1.594 .205
S3 Q3 Between Groups
7.669 2 3.834 4.167 .017
S3 Q4 Between Groups
1.835 2 .917 1.290 .277
Tukey Analysis – Segment Three
90% Confidence Interval Dep. Var.
(I) ALC
(J) ALC
Mean Difference
(I-J) Std. Error Sig. Lower Bound Upper Bound
2 -.230* .089 .027 -.41 -.05 1
3 .077 .105 .746 -.14 .29
1 .230* .089 .027 .05 .41 S3 Q1
2
3 .307* .099 .006 .10 .51
2 .370* .138 .021 .09 .65 1
3 .061 .164 .926 -.28 .40
1 -.370* .138 .021 -.65 -.09 S3 Q3
2
3 -.309 .155 .115 -.63 .01 *. The mean difference is significant at the 0.1 level.
116
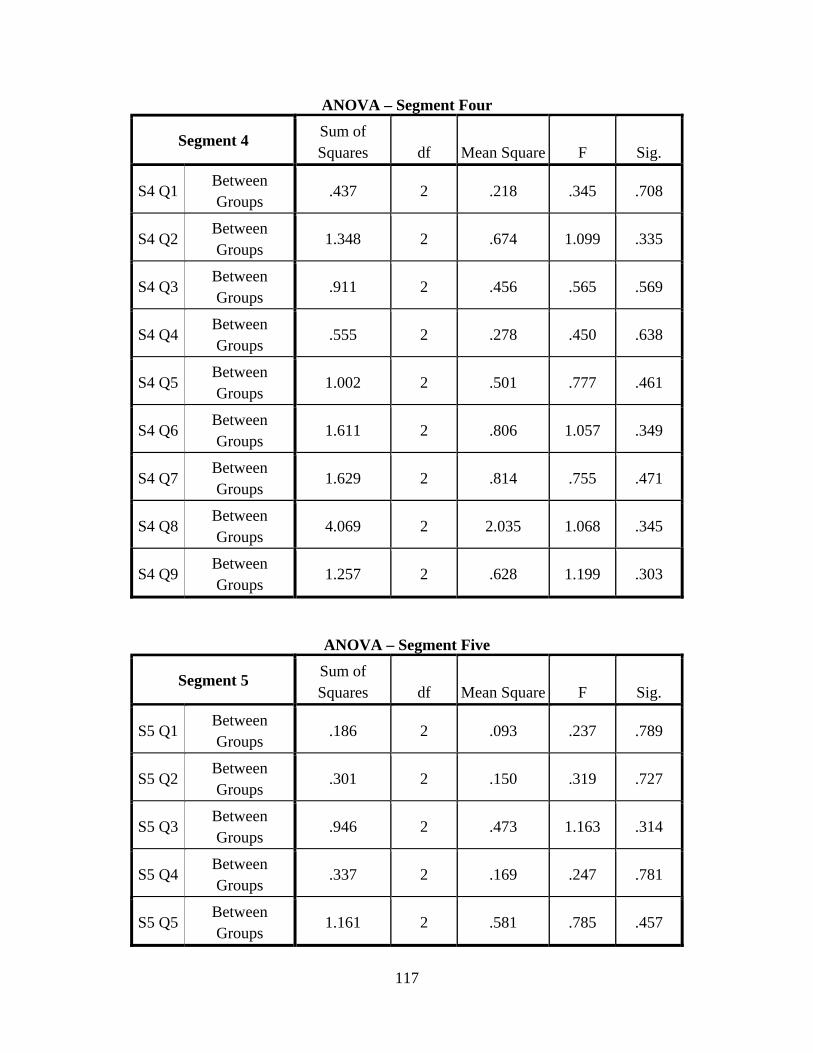
ANOVA – Segment Four
Segment 4 Sum of Squares df Mean Square F Sig.
S4 Q1 Between Groups
.437 2 .218 .345 .708
S4 Q2 Between Groups
1.348 2 .674 1.099 .335
S4 Q3 Between Groups
.911 2 .456 .565 .569
S4 Q4 Between Groups
.555 2 .278 .450 .638
S4 Q5 Between Groups
1.002 2 .501 .777 .461
S4 Q6 Between Groups
1.611 2 .806 1.057 .349
S4 Q7 Between Groups
1.629 2 .814 .755 .471
S4 Q8 Between Groups
4.069 2 2.035 1.068 .345
S4 Q9 Between Groups
1.257 2 .628 1.199 .303
ANOVA – Segment Five
Segment 5 Sum of Squares df Mean Square F Sig.
S5 Q1 Between Groups
.186 2 .093 .237 .789
S5 Q2 Between Groups
.301 2 .150 .319 .727
S5 Q3 Between Groups
.946 2 .473 1.163 .314
S5 Q4 Between Groups
.337 2 .169 .247 .781
S5 Q5 Between Groups
1.161 2 .581 .785 .457
117
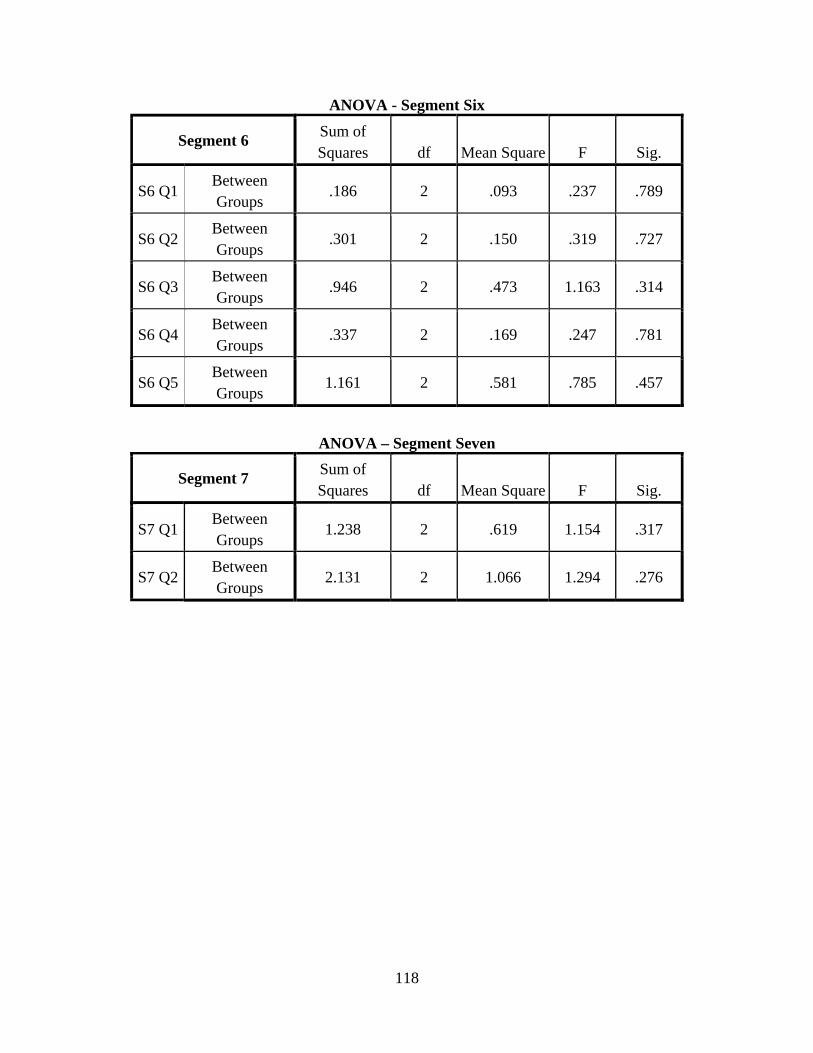
ANOVA - Segment Six
Segment 6 Sum of Squares df Mean Square F Sig.
S6 Q1 Between Groups
.186 2 .093 .237 .789
S6 Q2 Between Groups
.301 2 .150 .319 .727
S6 Q3 Between Groups
.946 2 .473 1.163 .314
S6 Q4 Between Groups
.337 2 .169 .247 .781
S6 Q5 Between Groups
1.161 2 .581 .785 .457
ANOVA – Segment Seven
Segment 7 Sum of Squares df Mean Square F Sig.
S7 Q1 Between Groups
1.238 2 .619 1.154 .317
S7 Q2 Between Groups
2.131 2 1.066 1.294 .276
118
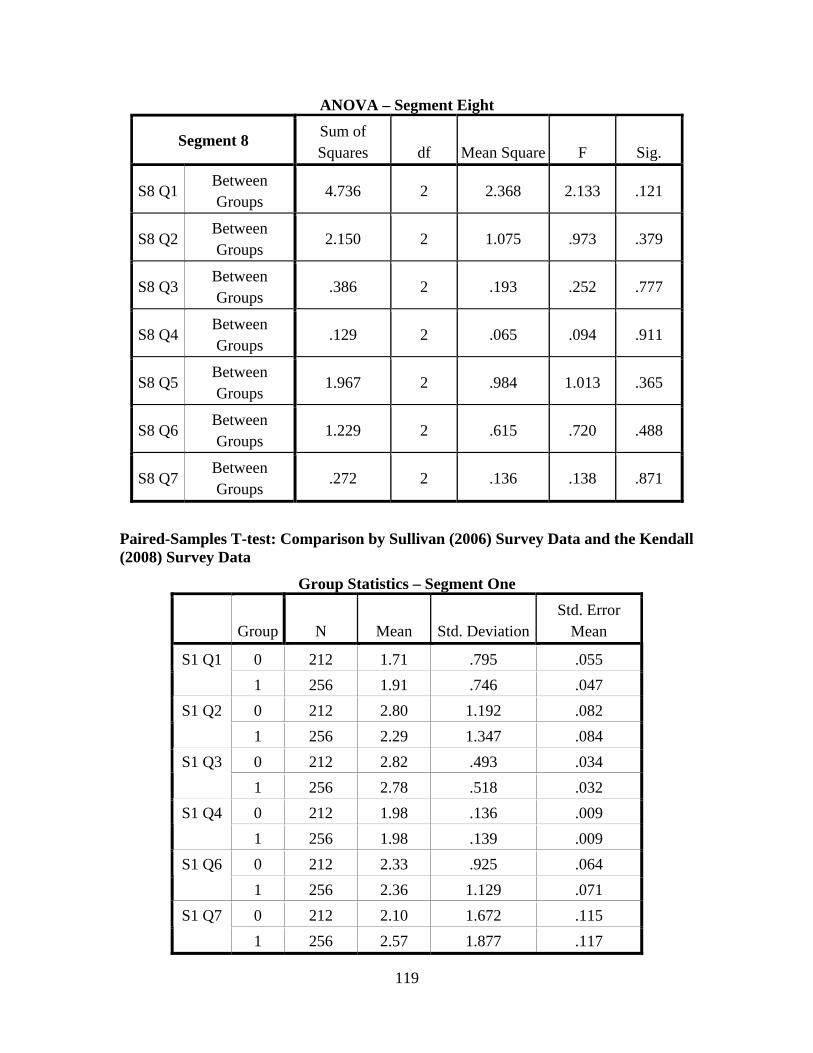
ANOVA – Segment Eight
Segment 8 Sum of Squares df Mean Square F Sig.
S8 Q1 Between Groups
4.736 2 2.368 2.133 .121
S8 Q2 Between Groups
2.150 2 1.075 .973 .379
S8 Q3 Between Groups
.386 2 .193 .252 .777
S8 Q4 Between Groups
.129 2 .065 .094 .911
S8 Q5 Between Groups
1.967 2 .984 1.013 .365
S8 Q6 Between Groups
1.229 2 .615 .720 .488
S8 Q7 Between Groups
.272 2 .136 .138 .871
Paired-Samples T-test: Comparison by Sullivan (2006) Survey Data and the Kendall (2008) Survey Data
Group Statistics – Segment One
Group N Mean Std. DeviationStd. Error
Mean
0 212 1.71 .795 .055 S1 Q1 1 256 1.91 .746 .047 0 212 2.80 1.192 .082 S1 Q2 1 256 2.29 1.347 .084 0 212 2.82 .493 .034 S1 Q3 1 256 2.78 .518 .032 0 212 1.98 .136 .009 S1 Q4 1 256 1.98 .139 .009 0 212 2.33 .925 .064 S1 Q6 1 256 2.36 1.129 .071 0 212 2.10 1.672 .115 S1 Q7 1 256 2.57 1.877 .117
119
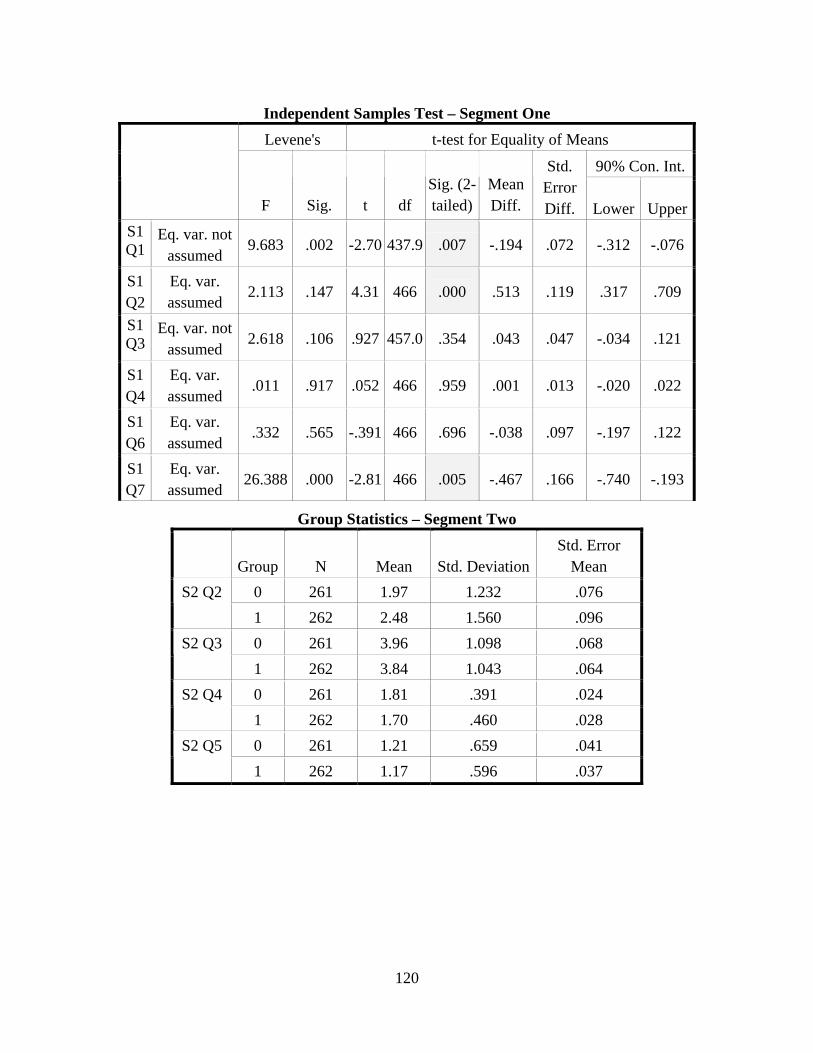
Independent Samples Test – Segment One Levene's t-test for Equality of Means
90% Con. Int.
F Sig. t df Sig. (2-tailed)
Mean Diff.
Std. Error Diff. Lower Upper
S1 Q1
Eq. var. not assumed
9.683 .002 -2.70 437.9 .007 -.194 .072 -.312 -.076
S1 Q2
Eq. var. assumed
2.113 .147 4.31 466 .000 .513 .119 .317 .709
S1 Q3
Eq. var. not assumed
2.618 .106 .927 457.0 .354 .043 .047 -.034 .121
S1 Q4
Eq. var. assumed
.011 .917 .052 466 .959 .001 .013 -.020 .022
S1 Q6
Eq. var. assumed
.332 .565 -.391 466 .696 -.038 .097 -.197 .122
S1 Q7
Eq. var. assumed
26.388 .000 -2.81 466 .005 -.467 .166 -.740 -.193
Group Statistics – Segment Two
Group N Mean Std. DeviationStd. Error
Mean 0 261 1.97 1.232 .076 S2 Q2 1 262 2.48 1.560 .096 0 261 3.96 1.098 .068 S2 Q3 1 262 3.84 1.043 .064 0 261 1.81 .391 .024 S2 Q4 1 262 1.70 .460 .028 0 261 1.21 .659 .041 S2 Q5 1 262 1.17 .596 .037
120
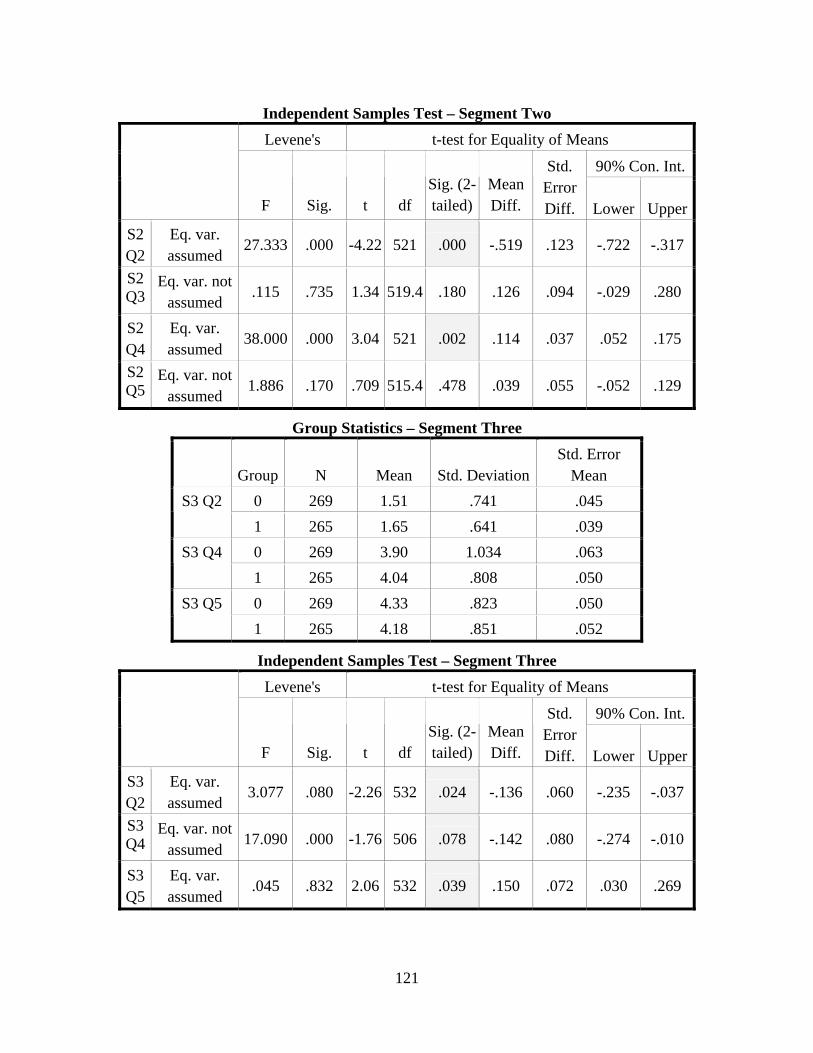
Independent Samples Test – Segment Two Levene's t-test for Equality of Means
90% Con. Int.
F Sig. t df Sig. (2-tailed)
Mean Diff.
Std. Error Diff. Lower Upper
S2 Q2
Eq. var. assumed
27.333 .000 -4.22 521 .000 -.519 .123 -.722 -.317
S2 Q3
Eq. var. not assumed
.115 .735 1.34 519.4 .180 .126 .094 -.029 .280
S2 Q4
Eq. var. assumed
38.000 .000 3.04 521 .002 .114 .037 .052 .175
S2 Q5
Eq. var. not assumed
1.886 .170 .709 515.4 .478 .039 .055 -.052 .129
Group Statistics – Segment Three
Group N Mean Std. DeviationStd. Error
Mean 0 269 1.51 .741 .045 S3 Q2 1 265 1.65 .641 .039 0 269 3.90 1.034 .063 S3 Q4 1 265 4.04 .808 .050 0 269 4.33 .823 .050 S3 Q5 1 265 4.18 .851 .052
Independent Samples Test – Segment Three
Levene's t-test for Equality of Means
90% Con. Int.
F Sig. t df Sig. (2-tailed)
Mean Diff.
Std. Error Diff. Lower Upper
S3 Q2
Eq. var. assumed
3.077 .080 -2.26 532 .024 -.136 .060 -.235 -.037
S3 Q4
Eq. var. not assumed
17.090 .000 -1.76 506 .078 -.142 .080 -.274 -.010
S3 Q5
Eq. var. assumed
.045 .832 2.06 532 .039 .150 .072 .030 .269
121
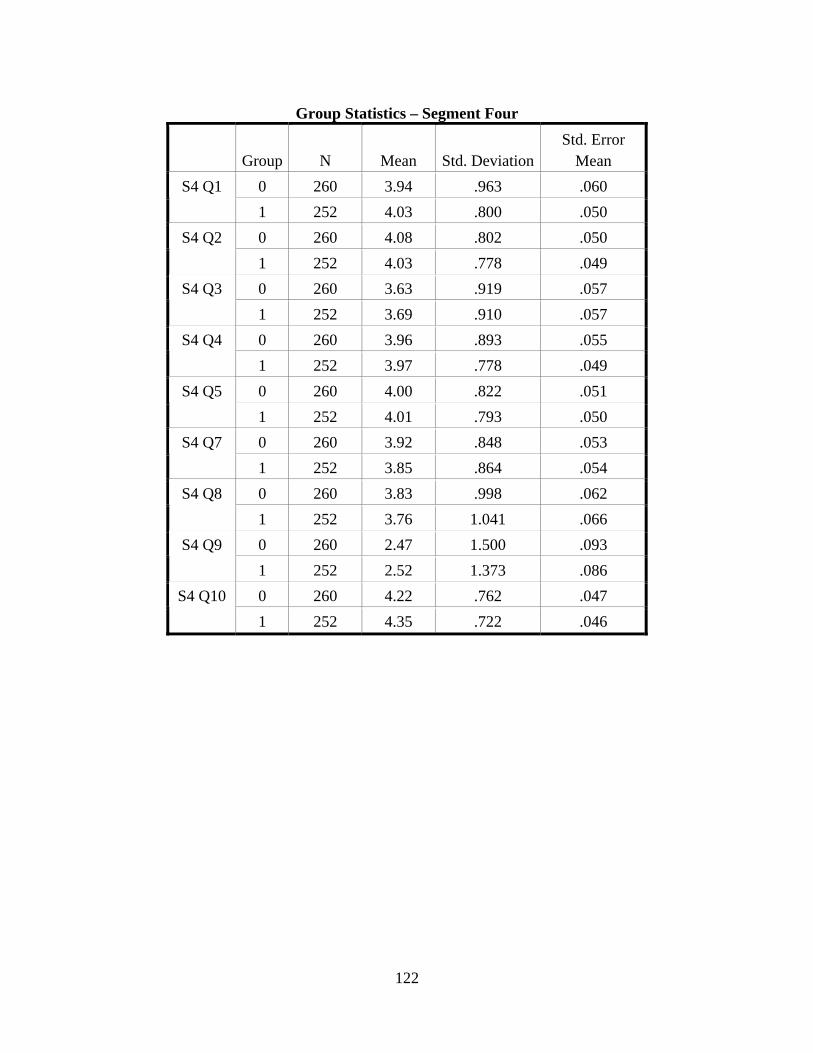
Group Statistics – Segment Four
Group N Mean Std. DeviationStd. Error
Mean 0 260 3.94 .963 .060 S4 Q1 1 252 4.03 .800 .050 0 260 4.08 .802 .050 S4 Q2 1 252 4.03 .778 .049 0 260 3.63 .919 .057 S4 Q3 1 252 3.69 .910 .057 0 260 3.96 .893 .055 S4 Q4 1 252 3.97 .778 .049 0 260 4.00 .822 .051 S4 Q5 1 252 4.01 .793 .050 0 260 3.92 .848 .053 S4 Q7 1 252 3.85 .864 .054 0 260 3.83 .998 .062 S4 Q8 1 252 3.76 1.041 .066 0 260 2.47 1.500 .093 S4 Q9 1 252 2.52 1.373 .086 0 260 4.22 .762 .047 S4 Q10 1 252 4.35 .722 .046
122
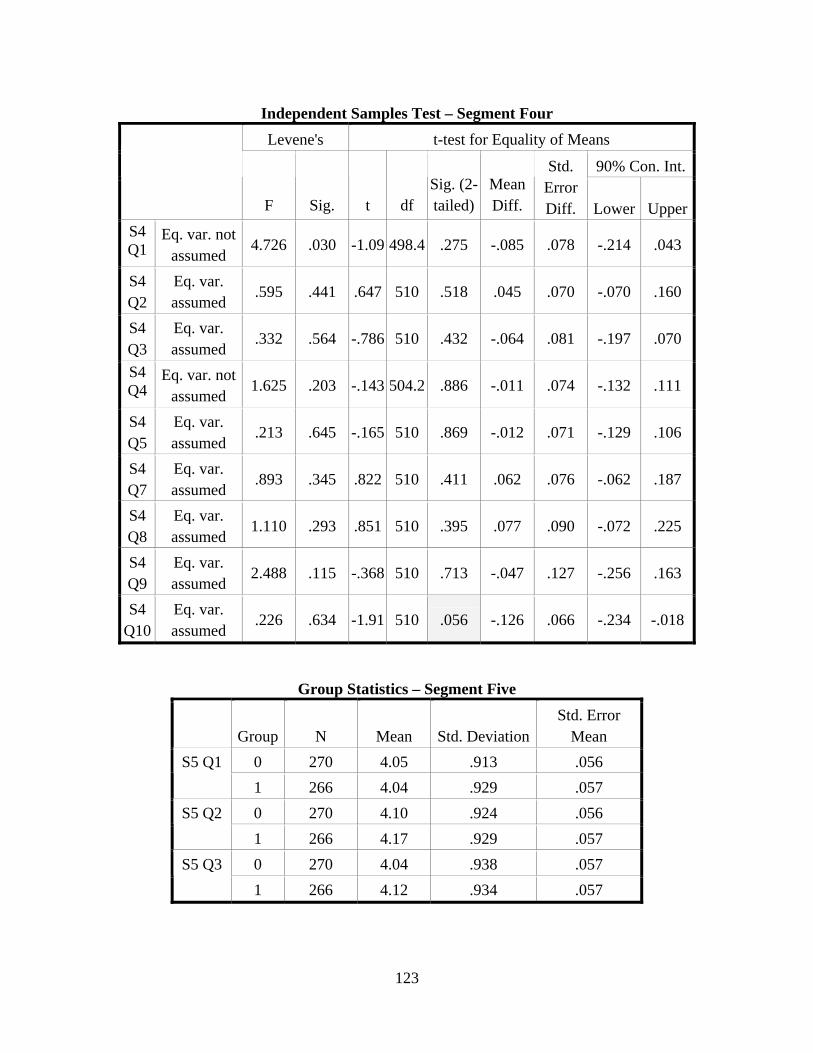
Independent Samples Test – Segment Four Levene's t-test for Equality of Means
90% Con. Int.
F Sig. t df Sig. (2-tailed)
Mean Diff.
Std. Error Diff. Lower Upper
S4 Q1
Eq. var. not assumed
4.726 .030 -1.09 498.4 .275 -.085 .078 -.214 .043
S4 Q2
Eq. var. assumed
.595 .441 .647 510 .518 .045 .070 -.070 .160
S4 Q3
Eq. var. assumed
.332 .564 -.786 510 .432 -.064 .081 -.197 .070
S4 Q4
Eq. var. not assumed
1.625 .203 -.143 504.2 .886 -.011 .074 -.132 .111
S4 Q5
Eq. var. assumed
.213 .645 -.165 510 .869 -.012 .071 -.129 .106
S4 Q7
Eq. var. assumed
.893 .345 .822 510 .411 .062 .076 -.062 .187
S4 Q8
Eq. var. assumed
1.110 .293 .851 510 .395 .077 .090 -.072 .225
S4 Q9
Eq. var. assumed
2.488 .115 -.368 510 .713 -.047 .127 -.256 .163
S4 Q10
Eq. var. assumed
.226 .634 -1.91 510 .056 -.126 .066 -.234 -.018
Group Statistics – Segment Five
Group N Mean Std. DeviationStd. Error
Mean 0 270 4.05 .913 .056 S5 Q1 1 266 4.04 .929 .057 0 270 4.10 .924 .056 S5 Q2 1 266 4.17 .929 .057 0 270 4.04 .938 .057 S5 Q3 1 266 4.12 .934 .057
123
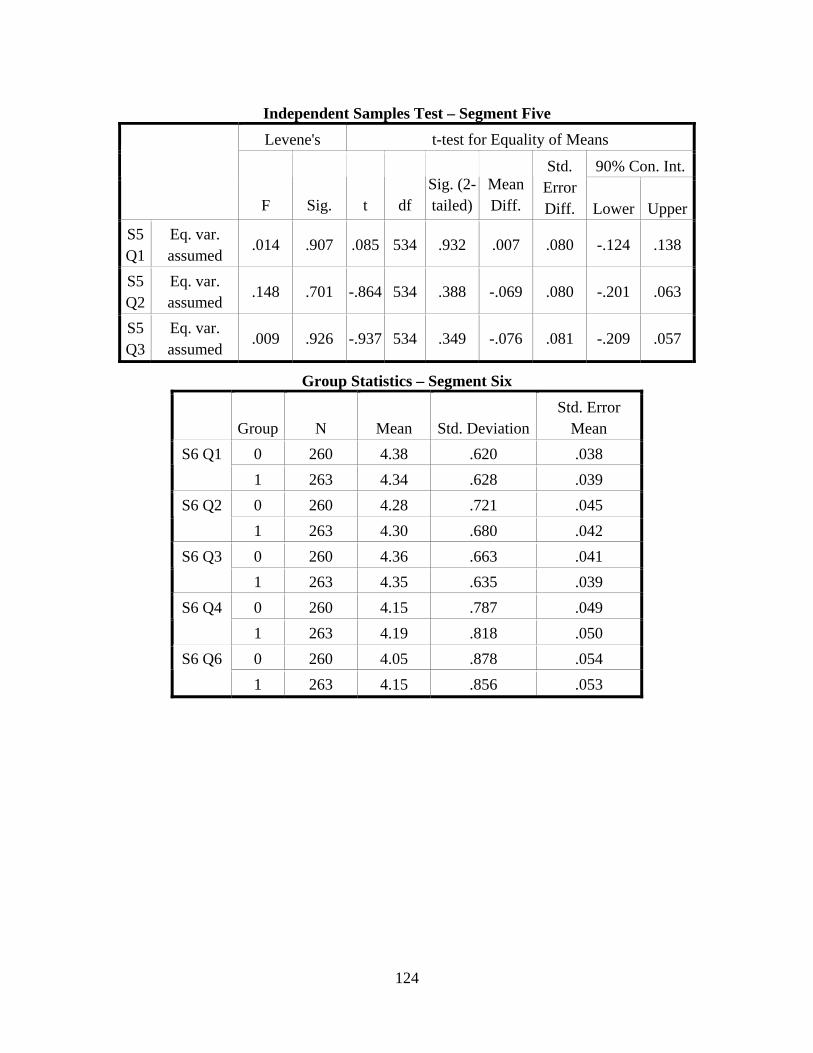
Independent Samples Test – Segment Five Levene's t-test for Equality of Means
90% Con. Int.
F Sig. t df Sig. (2-tailed)
Mean Diff.
Std. Error Diff. Lower Upper
S5 Q1
Eq. var. assumed
.014 .907 .085 534 .932 .007 .080 -.124 .138
S5 Q2
Eq. var. assumed
.148 .701 -.864 534 .388 -.069 .080 -.201 .063
S5 Q3
Eq. var. assumed
.009 .926 -.937 534 .349 -.076 .081 -.209 .057
Group Statistics – Segment Six
Group N Mean Std. DeviationStd. Error
Mean 0 260 4.38 .620 .038 S6 Q1 1 263 4.34 .628 .039 0 260 4.28 .721 .045 S6 Q2 1 263 4.30 .680 .042 0 260 4.36 .663 .041 S6 Q3 1 263 4.35 .635 .039 0 260 4.15 .787 .049 S6 Q4 1 263 4.19 .818 .050 0 260 4.05 .878 .054 S6 Q6 1 263 4.15 .856 .053
124
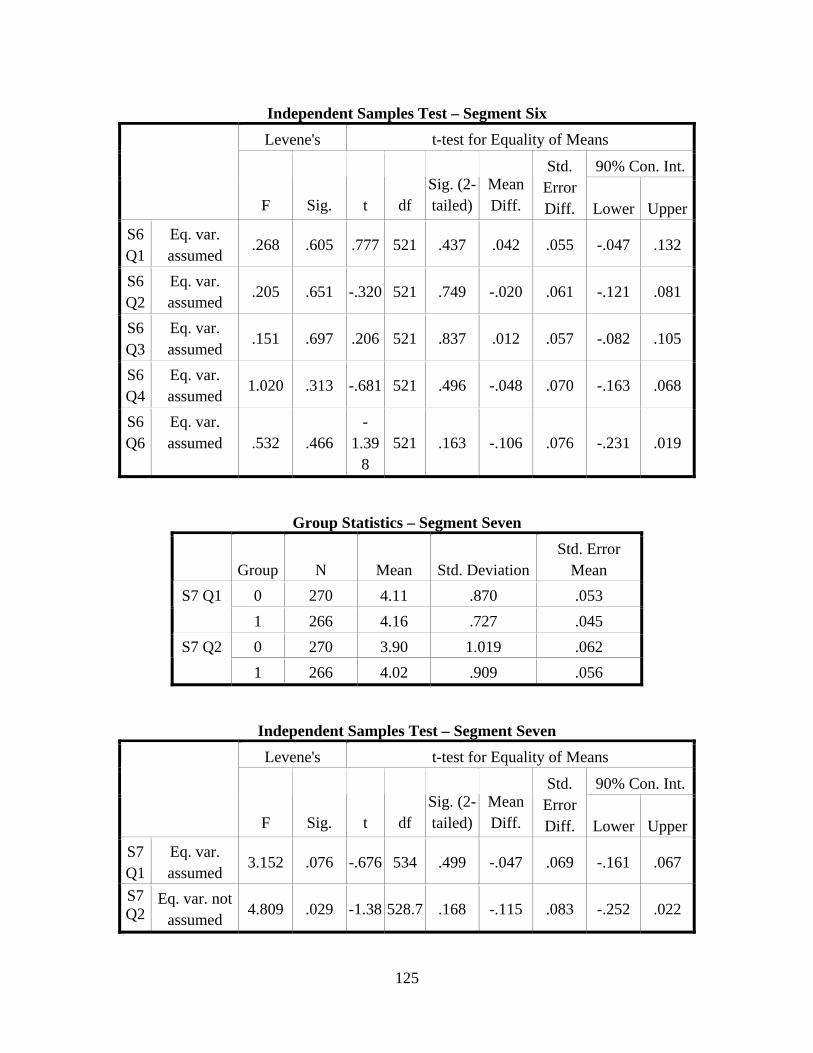
Independent Samples Test – Segment Six Levene's t-test for Equality of Means
90% Con. Int.
F Sig. t df Sig. (2-tailed)
Mean Diff.
Std. Error Diff. Lower Upper
S6 Q1
Eq. var. assumed
.268 .605 .777 521 .437 .042 .055 -.047 .132
S6 Q2
Eq. var. assumed
.205 .651 -.320 521 .749 -.020 .061 -.121 .081
S6 Q3
Eq. var. assumed
.151 .697 .206 521 .837 .012 .057 -.082 .105
S6 Q4
Eq. var. assumed
1.020 .313 -.681 521 .496 -.048 .070 -.163 .068
S6 Q6
Eq. var. assumed .532 .466
-1.39
8 521 .163 -.106 .076 -.231 .019
Group Statistics – Segment Seven
Group N Mean Std. DeviationStd. Error
Mean 0 270 4.11 .870 .053 S7 Q1 1 266 4.16 .727 .045 0 270 3.90 1.019 .062 S7 Q2 1 266 4.02 .909 .056
Independent Samples Test – Segment Seven Levene's t-test for Equality of Means
90% Con. Int.
F Sig. t df Sig. (2-tailed)
Mean Diff.
Std. Error Diff. Lower Upper
S7 Q1
Eq. var. assumed
3.152 .076 -.676 534 .499 -.047 .069 -.161 .067
S7 Q2
Eq. var. not assumed
4.809 .029 -1.38 528.7 .168 -.115 .083 -.252 .022
125
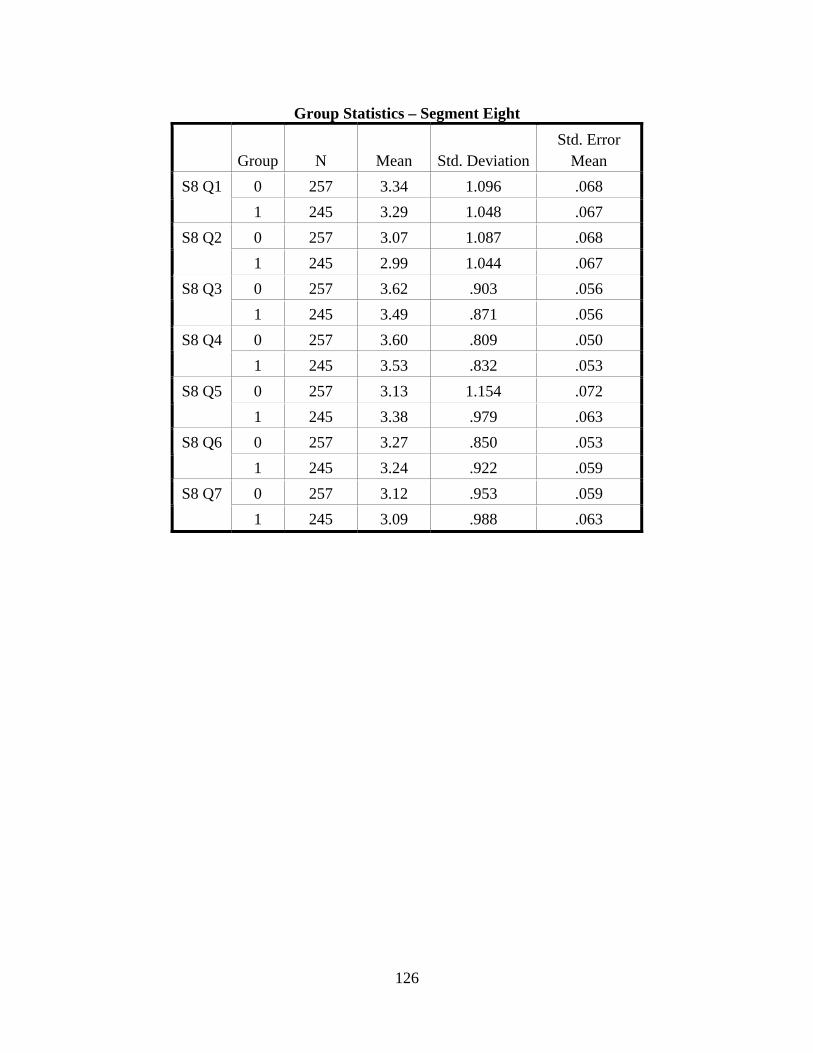
Group Statistics – Segment Eight
Group N Mean Std. DeviationStd. Error
Mean 0 257 3.34 1.096 .068 S8 Q1 1 245 3.29 1.048 .067 0 257 3.07 1.087 .068 S8 Q2 1 245 2.99 1.044 .067 0 257 3.62 .903 .056 S8 Q3 1 245 3.49 .871 .056 0 257 3.60 .809 .050 S8 Q4 1 245 3.53 .832 .053 0 257 3.13 1.154 .072 S8 Q5 1 245 3.38 .979 .063 0 257 3.27 .850 .053 S8 Q6 1 245 3.24 .922 .059 0 257 3.12 .953 .059 S8 Q7 1 245 3.09 .988 .063
126
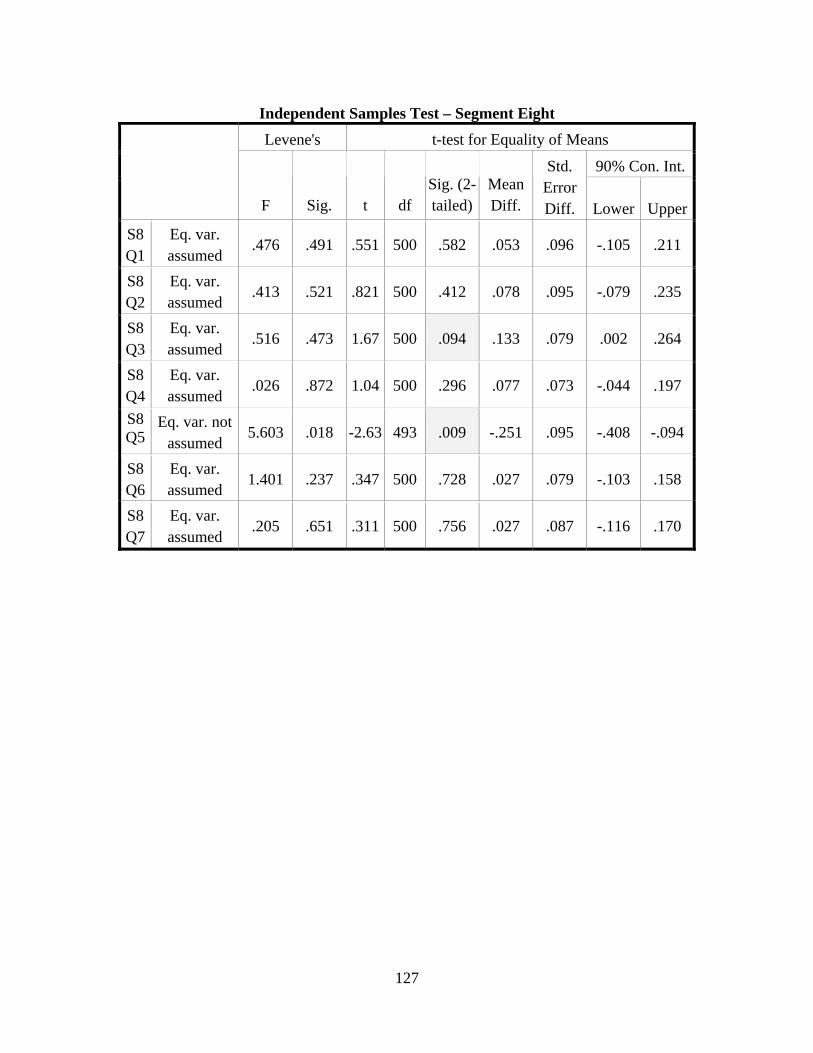
Independent Samples Test – Segment Eight Levene's t-test for Equality of Means
90% Con. Int.
F Sig. t df Sig. (2-tailed)
Mean Diff.
Std. Error Diff. Lower Upper
S8 Q1
Eq. var. assumed
.476 .491 .551 500 .582 .053 .096 -.105 .211
S8 Q2
Eq. var. assumed
.413 .521 .821 500 .412 .078 .095 -.079 .235
S8 Q3
Eq. var. assumed
.516 .473 1.67 500 .094 .133 .079 .002 .264
S8 Q4
Eq. var. assumed
.026 .872 1.04 500 .296 .077 .073 -.044 .197
S8 Q5
Eq. var. not assumed
5.603 .018 -2.63 493 .009 -.251 .095 -.408 -.094
S8 Q6
Eq. var. assumed
1.401 .237 .347 500 .728 .027 .079 -.103 .158
S8 Q7
Eq. var. assumed
.205 .651 .311 500 .756 .027 .087 -.116 .170
127
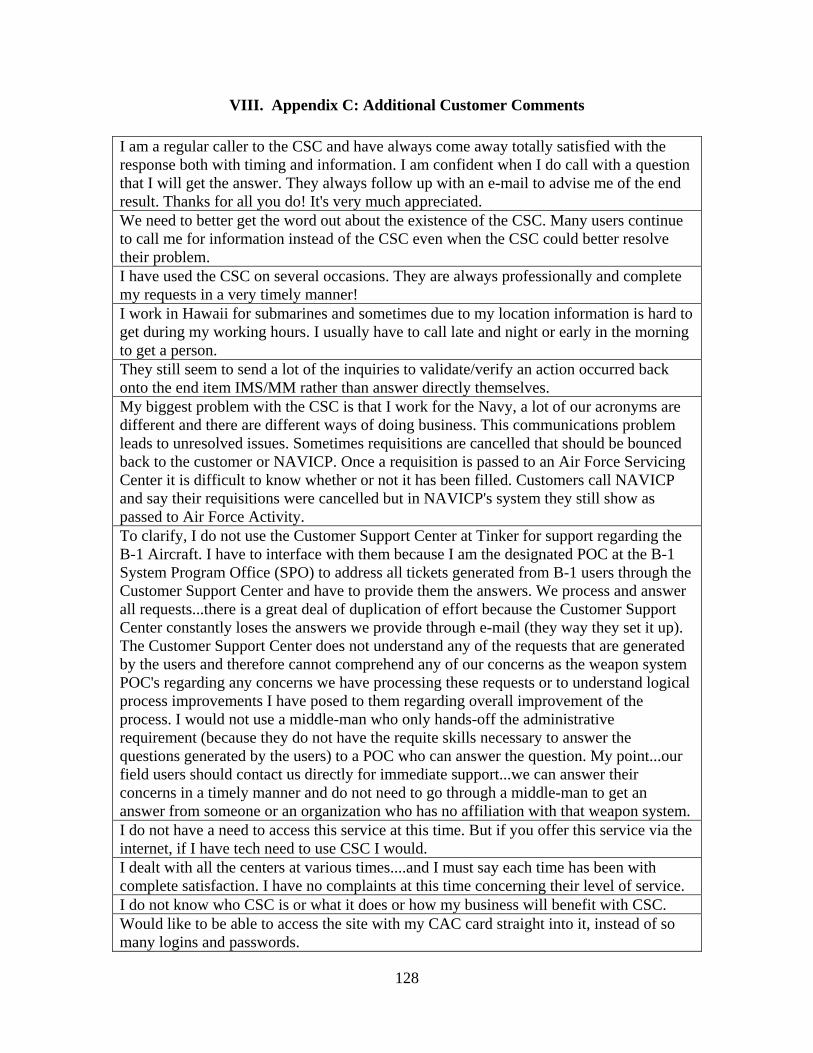
VIII. Appendix C: Additional Customer Comments I am a regular caller to the CSC and have always come away totally satisfied with the response both with timing and information. I am confident when I do call with a question that I will get the answer. They always follow up with an e-mail to advise me of the end result. Thanks for all you do! It's very much appreciated. We need to better get the word out about the existence of the CSC. Many users continue to call me for information instead of the CSC even when the CSC could better resolve their problem. I have used the CSC on several occasions. They are always professionally and complete my requests in a very timely manner! I work in Hawaii for submarines and sometimes due to my location information is hard to get during my working hours. I usually have to call late and night or early in the morning to get a person. They still seem to send a lot of the inquiries to validate/verify an action occurred back onto the end item IMS/MM rather than answer directly themselves. My biggest problem with the CSC is that I work for the Navy, a lot of our acronyms are different and there are different ways of doing business. This communications problem leads to unresolved issues. Sometimes requisitions are cancelled that should be bounced back to the customer or NAVICP. Once a requisition is passed to an Air Force Servicing Center it is difficult to know whether or not it has been filled. Customers call NAVICP and say their requisitions were cancelled but in NAVICP's system they still show as passed to Air Force Activity. To clarify, I do not use the Customer Support Center at Tinker for support regarding the B-1 Aircraft. I have to interface with them because I am the designated POC at the B-1 System Program Office (SPO) to address all tickets generated from B-1 users through the Customer Support Center and have to provide them the answers. We process and answer all requests...there is a great deal of duplication of effort because the Customer Support Center constantly loses the answers we provide through e-mail (they way they set it up). The Customer Support Center does not understand any of the requests that are generated by the users and therefore cannot comprehend any of our concerns as the weapon system POC's regarding any concerns we have processing these requests or to understand logical process improvements I have posed to them regarding overall improvement of the process. I would not use a middle-man who only hands-off the administrative requirement (because they do not have the requite skills necessary to answer the questions generated by the users) to a POC who can answer the question. My point...our field users should contact us directly for immediate support...we can answer their concerns in a timely manner and do not need to go through a middle-man to get an answer from someone or an organization who has no affiliation with that weapon system. I do not have a need to access this service at this time. But if you offer this service via the internet, if I have tech need to use CSC I would. I dealt with all the centers at various times....and I must say each time has been with complete satisfaction. I have no complaints at this time concerning their level of service. I do not know who CSC is or what it does or how my business will benefit with CSC. Would like to be able to access the site with my CAC card straight into it, instead of so many logins and passwords.
128
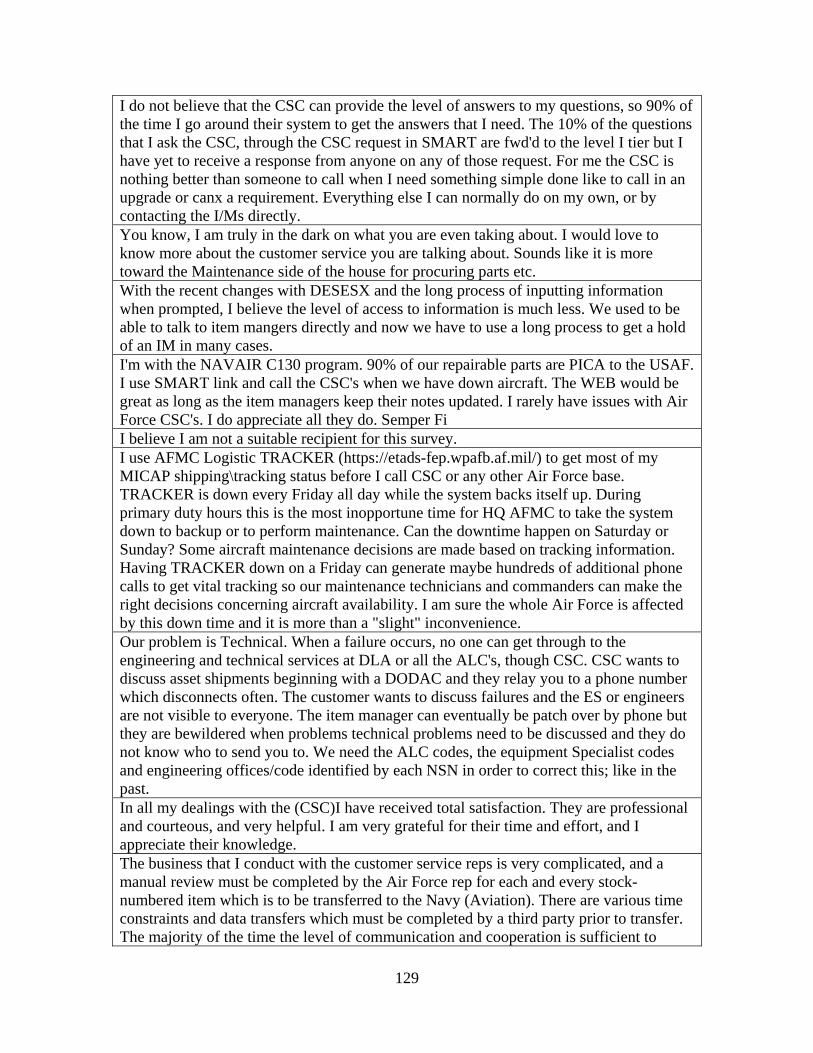
I do not believe that the CSC can provide the level of answers to my questions, so 90% of the time I go around their system to get the answers that I need. The 10% of the questions that I ask the CSC, through the CSC request in SMART are fwd'd to the level I tier but I have yet to receive a response from anyone on any of those request. For me the CSC is nothing better than someone to call when I need something simple done like to call in an upgrade or canx a requirement. Everything else I can normally do on my own, or by contacting the I/Ms directly. You know, I am truly in the dark on what you are even taking about. I would love to know more about the customer service you are talking about. Sounds like it is more toward the Maintenance side of the house for procuring parts etc. With the recent changes with DESESX and the long process of inputting information when prompted, I believe the level of access to information is much less. We used to be able to talk to item mangers directly and now we have to use a long process to get a hold of an IM in many cases. I'm with the NAVAIR C130 program. 90% of our repairable parts are PICA to the USAF. I use SMART link and call the CSC's when we have down aircraft. The WEB would be great as long as the item managers keep their notes updated. I rarely have issues with Air Force CSC's. I do appreciate all they do. Semper Fi I believe I am not a suitable recipient for this survey. I use AFMC Logistic TRACKER (https://etads-fep.wpafb.af.mil/) to get most of my MICAP shipping\tracking status before I call CSC or any other Air Force base. TRACKER is down every Friday all day while the system backs itself up. During primary duty hours this is the most inopportune time for HQ AFMC to take the system down to backup or to perform maintenance. Can the downtime happen on Saturday or Sunday? Some aircraft maintenance decisions are made based on tracking information. Having TRACKER down on a Friday can generate maybe hundreds of additional phone calls to get vital tracking so our maintenance technicians and commanders can make the right decisions concerning aircraft availability. I am sure the whole Air Force is affected by this down time and it is more than a "slight" inconvenience. Our problem is Technical. When a failure occurs, no one can get through to the engineering and technical services at DLA or all the ALC's, though CSC. CSC wants to discuss asset shipments beginning with a DODAC and they relay you to a phone number which disconnects often. The customer wants to discuss failures and the ES or engineers are not visible to everyone. The item manager can eventually be patch over by phone but they are bewildered when problems technical problems need to be discussed and they do not know who to send you to. We need the ALC codes, the equipment Specialist codes and engineering offices/code identified by each NSN in order to correct this; like in the past. In all my dealings with the (CSC)I have received total satisfaction. They are professional and courteous, and very helpful. I am very grateful for their time and effort, and I appreciate their knowledge. The business that I conduct with the customer service reps is very complicated, and a manual review must be completed by the Air Force rep for each and every stock-numbered item which is to be transferred to the Navy (Aviation). There are various time constraints and data transfers which must be completed by a third party prior to transfer. The majority of the time the level of communication and cooperation is sufficient to
129
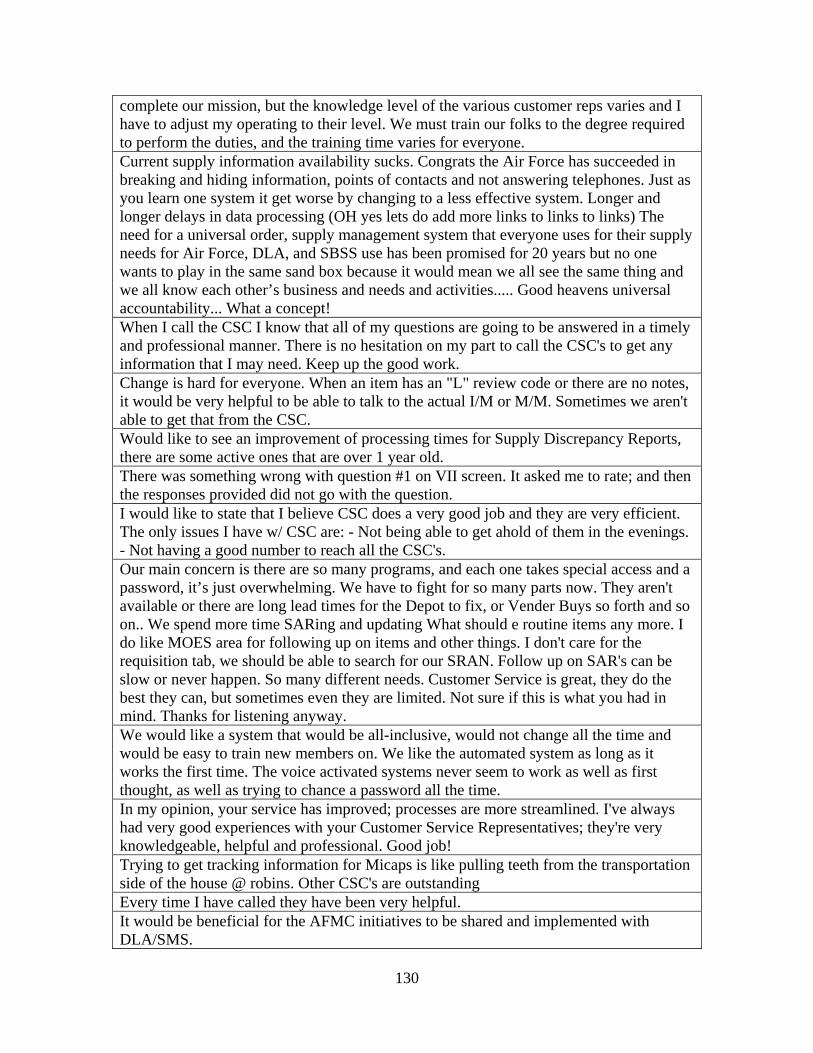
complete our mission, but the knowledge level of the various customer reps varies and I have to adjust my operating to their level. We must train our folks to the degree required to perform the duties, and the training time varies for everyone. Current supply information availability sucks. Congrats the Air Force has succeeded in breaking and hiding information, points of contacts and not answering telephones. Just as you learn one system it get worse by changing to a less effective system. Longer and longer delays in data processing (OH yes lets do add more links to links to links) The need for a universal order, supply management system that everyone uses for their supply needs for Air Force, DLA, and SBSS use has been promised for 20 years but no one wants to play in the same sand box because it would mean we all see the same thing and we all know each other’s business and needs and activities..... Good heavens universal accountability... What a concept! When I call the CSC I know that all of my questions are going to be answered in a timely and professional manner. There is no hesitation on my part to call the CSC's to get any information that I may need. Keep up the good work. Change is hard for everyone. When an item has an "L" review code or there are no notes, it would be very helpful to be able to talk to the actual I/M or M/M. Sometimes we aren't able to get that from the CSC. Would like to see an improvement of processing times for Supply Discrepancy Reports, there are some active ones that are over 1 year old. There was something wrong with question #1 on VII screen. It asked me to rate; and then the responses provided did not go with the question. I would like to state that I believe CSC does a very good job and they are very efficient. The only issues I have w/ CSC are: - Not being able to get ahold of them in the evenings. - Not having a good number to reach all the CSC's. Our main concern is there are so many programs, and each one takes special access and a password, it’s just overwhelming. We have to fight for so many parts now. They aren't available or there are long lead times for the Depot to fix, or Vender Buys so forth and so on.. We spend more time SARing and updating What should e routine items any more. I do like MOES area for following up on items and other things. I don't care for the requisition tab, we should be able to search for our SRAN. Follow up on SAR's can be slow or never happen. So many different needs. Customer Service is great, they do the best they can, but sometimes even they are limited. Not sure if this is what you had in mind. Thanks for listening anyway. We would like a system that would be all-inclusive, would not change all the time and would be easy to train new members on. We like the automated system as long as it works the first time. The voice activated systems never seem to work as well as first thought, as well as trying to chance a password all the time. In my opinion, your service has improved; processes are more streamlined. I've always had very good experiences with your Customer Service Representatives; they're very knowledgeable, helpful and professional. Good job! Trying to get tracking information for Micaps is like pulling teeth from the transportation side of the house @ robins. Other CSC's are outstanding Every time I have called they have been very helpful. It would be beneficial for the AFMC initiatives to be shared and implemented with DLA/SMS.
130
The use of the Customer Service Center is important to me because I am able to get information at the time of inquiry and they are always helpful in steering me in the right direction to resolve some of my issues. Part number request is normally submitted through the Fax machine and the response is fast. Normally CSC emails me with the part number request information and what action was taken at the depot. New Technology is always good, but there's nothing like talking to an individual to get information or submitting request when the system is down. I am open to new changes and am always willing to learn new processes. I don't have a problem with the ALC's as far as micaps are considered. The item managers are where we get most of our information about availability of parts and when certain assets will be released. I would like to see this survey done for the Defense Logistics Agency because that is where we have been having issues in obtaining parts for our weapon system. The parts availability for DLA items has suffered greatly. Their customer service is good, but what can you tell a customer when there are no assets available and there is no active contract for that item. Overall the service I have received is good. When will a survey for Item Managers be available? All CSC's need to be doing things the same way. To promote efficiency and continuity. Also as they do more and more of the IM's Job They need their 201 file to reflect experience in that area. Also the Rep's ever increasing work load warrants a GS 11 Rating. We need to automate as much as possible. The CSC is providing outstanding support. However, if it were automated, we would never be on hold and have all info readily available. It is much easier for customers overseas to utilize the internet and email versus a phone call. The time difference is the main issue facing customers not stationed in the Continental United States. In my opinion, customer service reps. should have more resources available to them when helping over the phone. A lot of times they do not know the answer to the questions themselves and put you on hold to ask somebody else or make some phone calls. Another issue is the turn-around time to close open tickets, sometimes I've seen as long as 2 weeks. Any help on this issue will be greatly appreciated. Thanks. Every time I call I get a CS representative who sends a ticket to the IM who never responds. With all the transactions I do every day it would be great that when I get an e-mail I see the doc# or stock# of the problem in question in the subject box. That would eliminate a lot of confusion when I have multiple tickets open. i also receive duplicate e-mails quite often.....also a time waster. I always receive the best customer service when I call. (even if they can't help me) The Service Center is an added level of people who don't have the answers except to the very simplest questions. They simply do the same thing I can currently do myself, look in SMART. I avoid using the Center whenever possible. I think it would be better if we ordered an item such, 04, BQ. It would be nice if they directly ship to our base right away. What happened is? we tracked an item, it goes to Tracy, CA, then thru AMC enroute to our base even though it is a small item like gasket or O-ring. There is a tendency that the asset gets lost or comes to us in a long period of
131
time and it happened to us most of the time.. I just hope that my suggestion would bring up the process more accurately and faster for the customer to get their asset. Thank you. Greatly appreciate all the support. The information was been accurate and beneficial. The CSRM and AFMC CSC folks are professional and friendly; they get you the answer when you need it and follow up. I appreciate the support and will continue to use them. Their response time is above average and they stay on top of things. Overall, they do a good job! Overall pretty happy with telephone service received. But web based platforms may be more convenient. At this time, my only interaction has been via email requesting shipments to the contractor through the Customer Service Center. Representatives have always been prompt and courteous with their responses. Email versus telephone communication is preferable as the information is easily tracked and verified for my contract purposes. The CSC has done a great job providing exceptional service. As a Defense Contractor supporting not only AFMC, but also SOF the CSC support is vital to our support of the "War Fighter". The CSCs are supporting initiatives worldwide and always providing the support to the best of their ability, and always in a professional capacity; contract repair matters are out of CSC representative(s) control and we as customers need to understand each situation. Thank you for the support at all AFMC CSCs. The Tinker call center has always been helpful to the needs of my Customer Support Section here at Robins AFB the SBSS side. I certainly thank you for all the hard work the people have put forth to us. We have the capabilities you mention in the Survey; the problem is there not all at one site. Either that or the parts just aren't available. It makes it hard to keep our Shops happy when they have to wait for something to be bought or the CDD is postponed and we don't know that still too late. We have an inspection coming up and we have two items that we won't have available, but I must show why they are open one has been for almost a year now. Everyone just works around the problem. Takes too long to get information. Not worth time Someone needs to be held accountable for parts/chemicals not being available for such a long time. I have no way of talking to the item manager for chemicals that I need which are on delayed shipment status or totally unavailable for far, far too long a period of time. The CSC agents have no clue as to when backorders will be filled. If something is not available for immediate shipment then I need to know when it will be available. It is frustrating trying to have questions answered because the CSC is not fully aware of the NSNs problems. We would like the CSC to be able to answer the following questions, instead of just reading the SMART PID, which we already do. 1. Where are we in the pecking order? 2. What is the shop flow of the depot turning out the assets? a. How many assets per week? 3. If a slow repair process, what are the problems that cause the slow repair: (training, personnel, etc?) a. When do you anticipate a get well date? 4. Are the test stations down? a. Why is it down? b. If down for parts, when are the parts due in? c. How long will the repairs take? d. What are the NSNs of these parts? 5. If a bit and piece problem, what are the parts (NSN), when are the parts due in and how long will the repairs take? a. What actions are being taken by the repair shop to expedite the piece parts? b. Are reps being inducted for cross-canns? 6. If there is a repair contract, what is
132
the firm contract date? a. How many per week is the contractor obligate to turn out? b. For long lead times can the contract be modified? c. Have you asked for accelerated delivery and what is the result? 7. If the ESD slipped, why did it slip? 8. Is the ACCLO/PACLLO actively involved with this problem item? 9. If the assets are in a testing stage, what is the actual testing time frame? 10. If a long lead-time with organic repair, is a bridge contract in place? a. If so, what is the ESD? b. How many assets are on the bridge contract? I have really appreciated the help from the Call center; it has made a big difference. If the future holds a web-based service, I would also appreciate the call center still be staffed to some degree. I would be concerned as to how quickly I would get a response or when I Micap request would be input into the system. With the time zones of the storage depots to be considered, those Micap requests have to be dealt with quickly or you will lose a day. Thanks for the fine support, the call center has given me. I like dealing with the customer service center over the phone. To me, there is nothing else like actually talking to a real person and getting my questions answered right away. I personally don't feel like anything can replace an actual person when it comes to needing answers right away. Our stock control section and MICAP section do interact with CSC more than myself. Many times I encounter quality control problems such as overages and shortages in inchecking supplies from the depots. And TCN labels should not be pasted over serviceable tags on the box shipped to me. We do not really know when a part or supply item would come in to us, unless I am notified by the MICAP or Stock Control sections. Thanks for a good job supporting us at FB/FE6041.
I am actively involved with the CSC at Hill AFB, as a program manager we are always looking for ways to improve our processes and providing the War Fighter timely customer service, whatever the request is. We have a can do attitude and we do not turn any phone call or e-mail away. A common ground is what we build on; a website needs contact numbers and can sometimes not answer a question. I only email the Item Managers and do not use the phone. My main concern with the Item Managers is getting disposition on items being turned in so I can get them off base. MICAPs are worked 24/7 and should be supported as such, not just 9 - 5. If I need anything from the CSC I have a Wholesale Item Manager contact them. I have been very satisfied with all my calls to the Customer Services from the Air Force. I believe having an online source for common information as to stock number information, pricing, and availability would be really helpful and save everyone time.
133
IX. Bibliography
Air Force Smart Operations for the 21st Century (AFSO 21) CONOPS; Working Draft Version 6.3; Retrieved from website 28 August 2007; https://www.my.af.mil/gcss-af/afp40/USAF/ep/globalTab.do?channelPageId=-946951&pageId=681743
Anderson, Fornell, and Lehmann. Customer Satisfaction, Market Share, and
Profitability: Findings from Sweden. Journal of Marketing: 58(3), 53-66, 1994. Anderson, Fornell, and Rust. Customer Satisfaction, Productivity, and Profitability:
Differences Between Goods and Services. Marketing Science: 16(2), 129-145, 1997.
Anderson and Sullivan. The Antecedents and Consequences of Customer Satisfaction for
Firms. Marketing Science: 12(2) 125-143, 1993. Archester, Houston. Survey Handbook. Organizational Systems Division Total Quality Leadership Office. Office of the Under Secretary of the Navy, 1995 Aubrey, Charles R. Continuous Improvement to Meet Customers Needs. ASQC Quality
Congress Transactions-Toronto: 2-8, 1989. Baldrige National Quality Program. Criteria for Performance Excellence, 2007. Chalmeta, Ricardo. Methodology for customer relationship management. Journal of
Systems and Software: 1015-1024, 2006.
Deviney, D. E. Outstanding customer service: The key to customer loyalty. West Des Moines, Iowa: American Media Pub, 1998.
Fornell. A National Customer Satisfaction Barometer: The Swedish Experience. Journal of Marketing: 56(1), 6-21, 1992.
Green, Jeff. “Customer Relationship Management CONOPS,” February 2006,
https://afkm.wpafb.af.mil
Griffis, Stanley E., Goldsby, Thomas J., and Cooper, Martha. Web-Based and Mail Surveys: A Comparison of Response, Data, and Cost. Journal of Business Logistics, 24(2), 237-258. 2003
Hanan, M., & Karp, P. Customer satisfaction : How to maximize, measure, and market your company's "ultimate product". New York: Amacom, 1989.
Harej and Horvat. Customer Relationship Management Momentum for Business Improvement. 26th Int. Conf. Information Technology Interfaces ITI, 2000.
134
135
Hodgkiss and Capisit. Measuring customer satisfaction: practices of leading military and
commercial service organizations. M.S. Thesis. Wright-Patterson AFB, OH: Air Force Institute of Technology, 1994.
ISO 9000: 2005, Quality Management Systems – Fundamentals and Vocabulary,
October, 2005.
Johnson, R. The realities of Servicing the Customer. Supply House Times, 49(12), 40, 2007.
MAF.New center provides single contact for mobility air forces. Retrieved 8/28/2007, 2007, from http://www.af.mil/news/story.asp?storyID=123018447
Malthouse, Oakley, Calder, Iacobucci. Customer Satisfaction Across Organizational
Units. Journal of Service Research: JSR, 6(3), 231-242, 2004. MBNQA FAQs; Frequently asked questions and answers about the malcolm baldrige
national quality award (nov. 2006). Retrieved 8/28/2007, 2007, from http://www.nist.gov/public_affairs/factsheet/baldfaqs.htm
Mentzer, J. T., Bienstock, C. C., & Kahn, K. B. Benchmarking satisfaction. Marketing Management, 4(1), 40, 1995.
PQA; The President’s Quality Award Program. Information and Application, 2001.
President's quality award program. Retrieved 8/28/2007, 2007, from http://www.opm.gov/quality/
The statistics homepage. Retrieved 2/20/2008, 2008, from http://www.statsoft.com/textbook/stathome.html?stanman.html&1
Sullivan, Christopher B. Headquarters Air Force Material Command Customer Relationship Management. Graduate Research Project, AFIT/GLM/ENS 06-17, School of Logistics, Air Force Institute of Technology (AU), Wright Patterson AFB OH, March 2006.
USAF PSCM Brochure: Purchasing and Supply Chain Management (PCSM) Fast sheet;
Retrieved from website 28 August 2007; https://afkm.wpafb.af.mil/ASPs/CoP/OpenCoP.asp?Filter=OO-LG-OO-SC
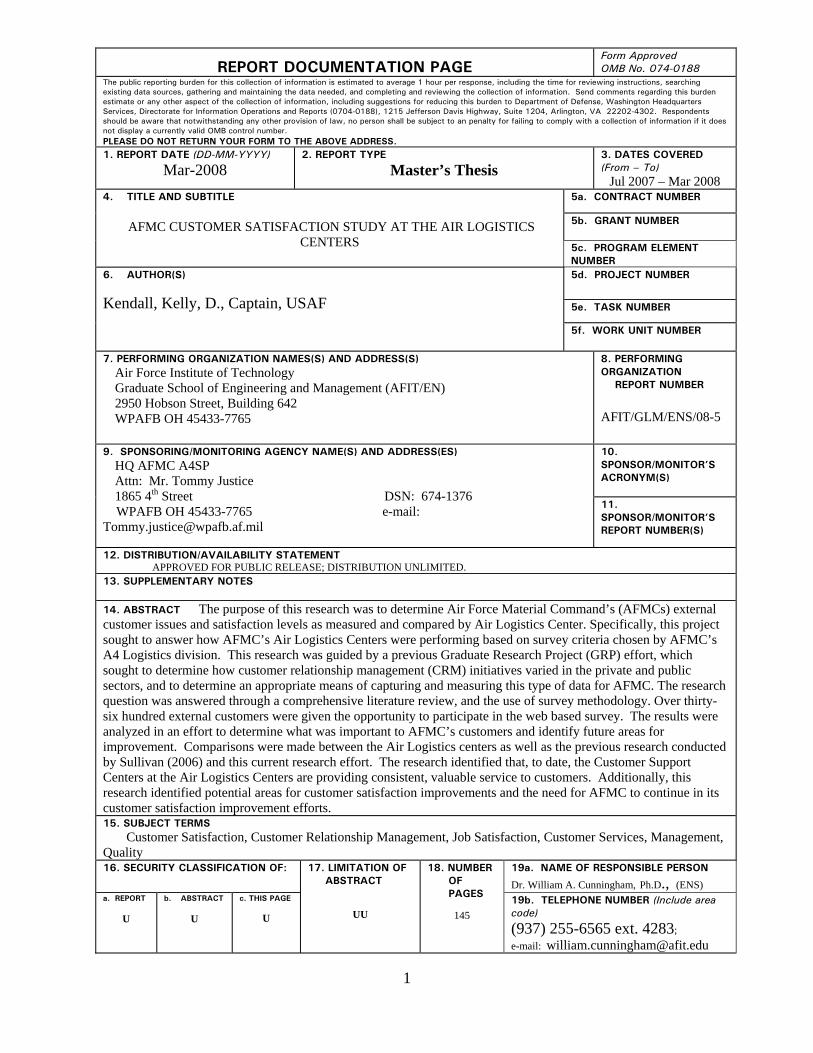
1
REPORT DOCUMENTATION PAGE Form Approved OMB No. 074-0188
The public reporting burden for this collection of information is estimated to average 1 hour per response, including the time for reviewing instructions, searching existing data sources, gathering and maintaining the data needed, and completing and reviewing the collection of information. Send comments regarding this burden estimate or any other aspect of the collection of information, including suggestions for reducing this burden to Department of Defense, Washington Headquarters Services, Directorate for Information Operations and Reports (0704-0188), 1215 Jefferson Davis Highway, Suite 1204, Arlington, VA 22202-4302. Respondents should be aware that notwithstanding any other provision of law, no person shall be subject to an penalty for failing to comply with a collection of information if it does not display a currently valid OMB control number. PLEASE DO NOT RETURN YOUR FORM TO THE ABOVE ADDRESS. 1. REPORT DATE (DD-MM-YYYY)
Mar-2008 2. REPORT TYPE
Master’s Thesis 3. DATES COVERED (From – To)
Jul 2007 – Mar 2008 5a. CONTRACT NUMBER
5b. GRANT NUMBER
4. TITLE AND SUBTITLE
AFMC CUSTOMER SATISFACTION STUDY AT THE AIR LOGISTICS CENTERS
5c. PROGRAM ELEMENT NUMBER 5d. PROJECT NUMBER
5e. TASK NUMBER
6. AUTHOR(S)
Kendall, Kelly, D., Captain, USAF
5f. WORK UNIT NUMBER
7. PERFORMING ORGANIZATION NAMES(S) AND ADDRESS(S) Air Force Institute of Technology Graduate School of Engineering and Management (AFIT/EN) 2950 Hobson Street, Building 642 WPAFB OH 45433-7765
8. PERFORMING ORGANIZATION REPORT NUMBER
AFIT/GLM/ENS/08-5 10. SPONSOR/MONITOR’S ACRONYM(S)
9. SPONSORING/MONITORING AGENCY NAME(S) AND ADDRESS(ES) HQ AFMC A4SP
Attn: Mr. Tommy Justice 1865 4th Street DSN: 674-1376 WPAFB OH 45433-7765 e-mail: [email protected]
11. SPONSOR/MONITOR’S REPORT NUMBER(S)
12. DISTRIBUTION/AVAILABILITY STATEMENT APPROVED FOR PUBLIC RELEASE; DISTRIBUTION UNLIMITED. 13. SUPPLEMENTARY NOTES 14. ABSTRACT The purpose of this research was to determine Air Force Material Command’s (AFMCs) external customer issues and satisfaction levels as measured and compared by Air Logistics Center. Specifically, this project sought to answer how AFMC’s Air Logistics Centers were performing based on survey criteria chosen by AFMC’s A4 Logistics division. This research was guided by a previous Graduate Research Project (GRP) effort, which sought to determine how customer relationship management (CRM) initiatives varied in the private and public sectors, and to determine an appropriate means of capturing and measuring this type of data for AFMC. The research question was answered through a comprehensive literature review, and the use of survey methodology. Over thirty-six hundred external customers were given the opportunity to participate in the web based survey. The results were analyzed in an effort to determine what was important to AFMC’s customers and identify future areas for improvement. Comparisons were made between the Air Logistics centers as well as the previous research conducted by Sullivan (2006) and this current research effort. The research identified that, to date, the Customer Support Centers at the Air Logistics Centers are providing consistent, valuable service to customers. Additionally, this research identified potential areas for customer satisfaction improvements and the need for AFMC to continue in its customer satisfaction improvement efforts. 15. SUBJECT TERMS Customer Satisfaction, Customer Relationship Management, Job Satisfaction, Customer Services, Management, Quality 16. SECURITY CLASSIFICATION OF: 19a. NAME OF RESPONSIBLE PERSON
Dr. William A. Cunningham, Ph.D., (ENS) a. REPORT
U
b. ABSTRACT
U
c. THIS PAGE
U
17. LIMITATION OF ABSTRACT
UU
18. NUMBER OF PAGES
145 19b. TELEPHONE NUMBER (Include area code)
(937) 255-6565 ext. 4283; e-mail: [email protected]