Embed Size (px)
Citation preview
Operating System TransformationLeveraging FP&A Across a Multi-Industrial
Organization
Emmanuel CapraisVice President – Strategic & Financial PlanningITT Inc.
Holding Company Conglomerate
Integrated Operating Company
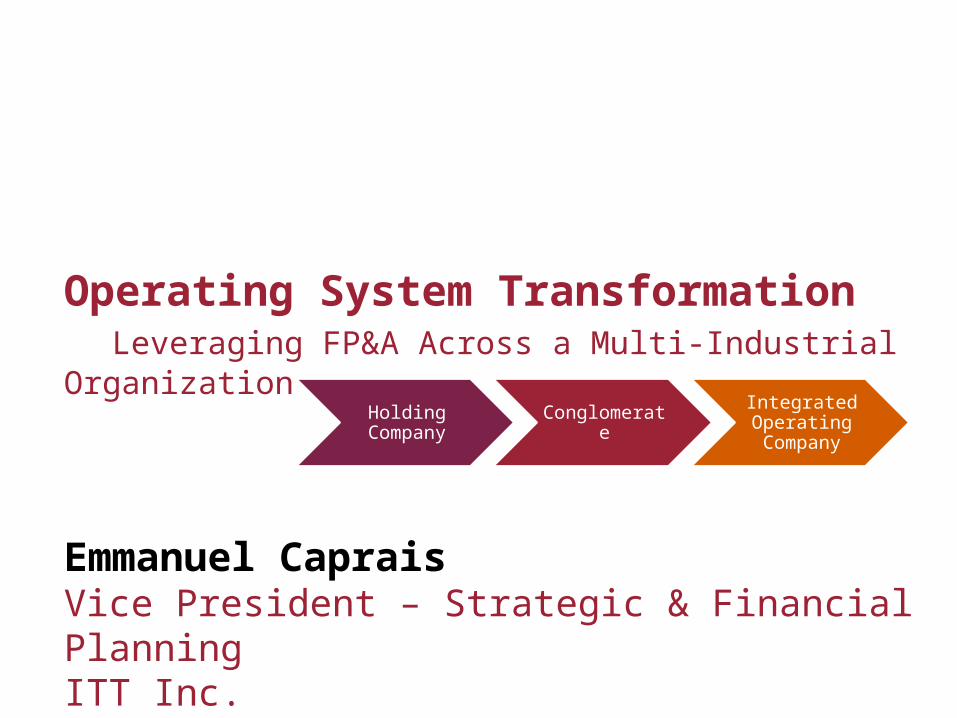
A Brief History of ITT• Founded in 1920
• Holding Company Mentality
• Diverse Set of Businesses
• Continuous Acquisitions…
• Divestitures and Spin-offs
• “New” ITT
From a Holding to an Integrated Operating Company
From a Holding to an Integrated Operating Company
New ITT – A 100-Year-Old Startup
• Organized Around 4 Value Centers
• Increased FOCUS
• Build on Strengths and Solid Foundation
• Drive Operational Improvement
• New Finance Operating System
Focus Areas to Turn Around Motion Technologies
1. Building the Finance Team for the Future
• Performance Management & Restructuring
• Promoting Hidden Jewels
• Recruiting Outside Talent With Proven Operational Skills
• Building Capabilities and Developing High Potentials
FP&A at the Heart of the Finance Operating System
FP&A Team Embedded in the Business & Focused on Efficient Decision-Making
FP&A at the Heart of the Finance Operating System
Focus Areas to Turn Around Motion Technologies
2. Making a Strong Friction Business Even Stronger
• Build On A Solid Growth Engine
• Leverage Worldwide Production Capabilities
• Supply Base Rationalization & Optimization
• Drive Efficient Processes Through a Waste Hunting Mindset
• Promote Accountability and Build a True Meritocracy
• Focus on Fixed Costs
Expand Margins By Profitable Growth and Lean Cost Structure
Focus Areas to Turn Around Motion Technologies
3. Turning a Shock Absorber Loss-Maker into a Growth Platform
• Improve Customer & Operational Metrics
• Address Cost Structure
• Improve Commercial Performance
• Drive Manufacturing & Administrative Efficiencies
• Continuously Restructure Even When Growing
FP&A at the Heart of the Finance Operating System
Expand Margins by Driving Efficiencies & Cost Structure
FP&A at the Heart of the Finance Operating System
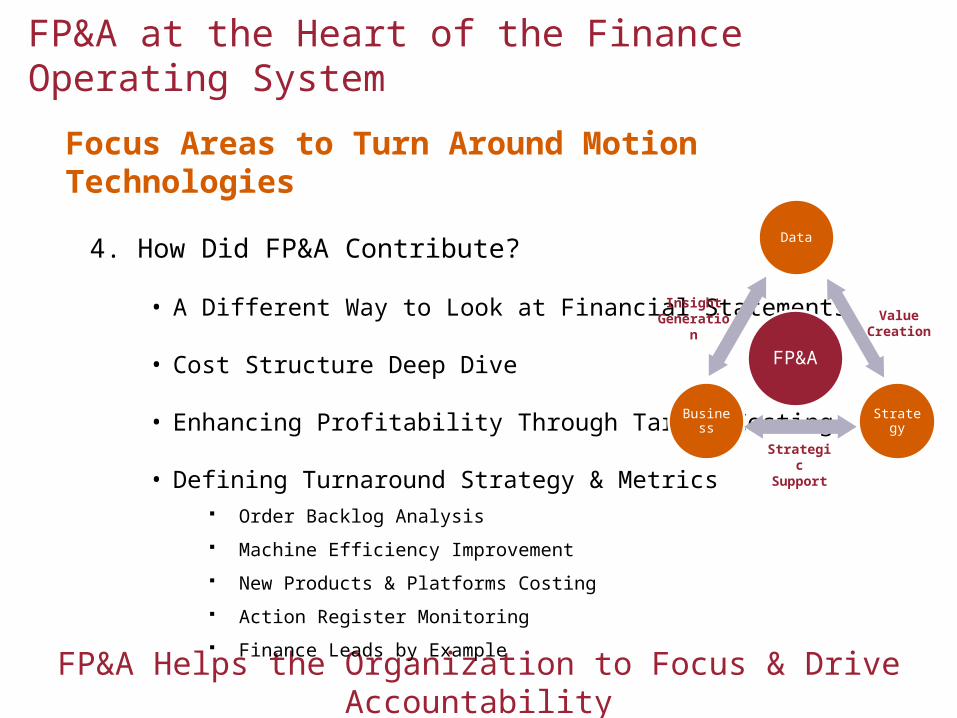
FP&A Helps the Organization to Focus & Drive Accountability
Focus Areas to Turn Around Motion Technologies
4. How Did FP&A Contribute?
• A Different Way to Look at Financial Statements
• Cost Structure Deep Dive
• Enhancing Profitability Through Target Costing
• Defining Turnaround Strategy & Metrics Order Backlog Analysis Machine Efficiency Improvement New Products & Platforms Costing Action Register Monitoring Finance Leads by Example
FP&A
Data
StrategyBusiness
Insight Generation Value
Creation
Strategic Support
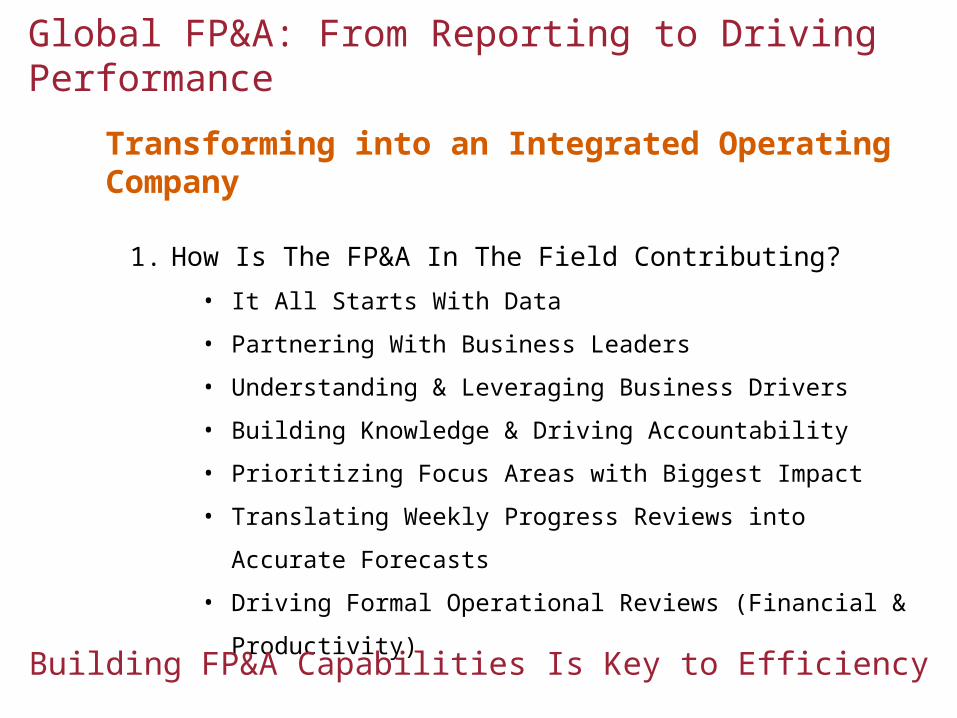
Global FP&A: From Reporting to Driving Performance
Transforming into an Integrated Operating Company
1. How Is The FP&A In The Field Contributing?• It All Starts With Data
• Partnering With Business Leaders
• Understanding & Leveraging Business Drivers
• Building Knowledge & Driving Accountability
• Prioritizing Focus Areas with Biggest Impact
• Translating Weekly Progress Reviews into Accurate Forecasts
• Driving Formal Operational Reviews (Financial & Productivity)
Building FP&A Capabilities Is Key to Efficiency
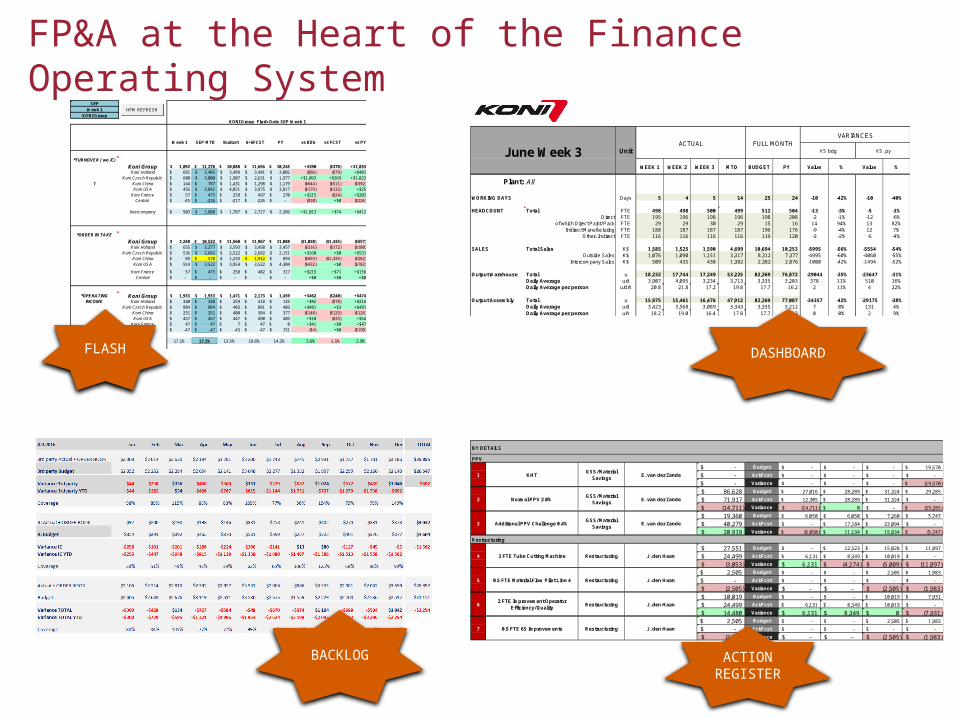
FP&A at the Heart of the Finance Operating SystemSEP
Week 1KONI Group
Week 1 SEP MTD Budget 6+6FCST PY vs BDG vs FCST vs PY
*TURNOVER ( wo IC)Koni Group 1,892$ 11,278$ 10,888$ 11,656$ 10,245$ +$390 ($378) +$1,033
Koni Holland 681$ 3,403$ 3,489$ 3,481$ 3,002$ ($86) ($79) +$401Koni Czech Republic 600$ 3,000$ 1,907$ 2,631$ 1,977$ +$1,093 +$369 +$1,023
1 Koni China 144$ 787$ 1,431$ 1,298$ 1,179$ ($644) ($511) ($392)Koni USA 456$ 3,842$ 4,021$ 3,975$ 3,817$ ($179) ($133) +$25
Koni France 57$ 473$ 258$ 497$ 270$ +$215 ($24) +$203Central -45 $ -226 $ -217 $ -226 $ -$ ($10) +$0 ($226)
Intercompany 503$ 2,800$ 1,787$ 2,727$ 2,389$ +$1,013 +$74 +$412
*ORDER IN TAKEKoni Group 2,248$ 10,532$ 11,560$ 11,967$ 11,088$ ($1,028) ($1,435) ($557)
Koni Holland 655$ 3,277$ 3,593$ 3,450$ 3,457$ ($316) ($172) ($180)Koni Czech Republic 536$ 2,682$ 2,522$ 2,682$ 2,151$ +$160 +$0 +$531
Koni China 85$ 578$ 1,233$ 1,912$ 859$ ($655) ($1,335) ($282)Koni USA 914$ 3,522$ 3,954$ 3,522$ 4,304$ ($432) +$0 ($782)
Koni France 57$ 473$ 258$ 402$ 317$ +$215 +$71 +$156Central -$ -$ -$ -$ -$ +$0 +$0 +$0
*OPERATING Koni Group 1,933$ 1,933$ 1,471$ 2,173$ 1,459$ +$462 ($240) +$474INCOME Koni Holland 340$ 340$ 259$ 418$ 125$ +$82 ($78) +$216
Koni Czech Republic 884$ 884$ 403$ 881$ 403$ +$481 +$3 +$481Koni China 251$ 251$ 400$ 384$ 377$ ($148) ($133) ($126)Koni USA 457$ 457$ 447$ 490$ 403$ +$10 ($33) +$54
Koni France 47$ 47$ 7$ 47$ 0$ +$41 +$0 +$47Central -47 $ -47 $ -43 $ -47 $ 151$ ($4) +$0 ($198)
OI% 17.1% 17.1% 13.5% 18.6% 14.2% 3.6% -1.5% 2.9%
KONI Group Flash Data SEP Week 1
BHFM REFRESH
WEEK 1 WEEK 2 WEEK 3 MTD BUDGET PY Value % Value %
WORKING DAYS Days 5 4 5 14 25 24 -10 -42% -10 -40%
HEADCOUNT Total FTE 498 498 500 499 512 504 -13 -3% -5 -1%Direct FTE 195 196 198 196 198 208 -2 -1% -12 -6%
of which Direct Paint/ Pack FTE 29 29 30 29 15 16 14 94% 13 82%Indirect Manufacturing FTE 188 187 187 187 196 176 -9 -4% 12 7%
Other. Indirect FTE 116 116 116 116 119 120 -3 -2% -5 -4%
SALES Total Sales K$ 1,585 1,525 1,590 4,699 10,694 10,253 -5995 -56% -5554 -54%Outside Sales K$ 1,076 1,090 1,151 3,317 8,312 7,377 -4995 -60% -4060 -55%
Intercompany Sales K$ 509 435 438 1,382 2,382 2,876 -1000 -42% -1494 -52%
Output Warehouse Total u 18,232 17,744 17,249 53,225 82,269 76,872 -29044 -35% -23647 -31%Daily Average u/d 3,907 4,095 3,234 3,713 3,335 3,203 378 11% 510 16%Daily Average per person u/d/h 20.8 21.8 17.2 19.8 17.7 16.2 2 11% 4 22%
Output Assembly Total u 15,975 15,461 16,476 47,912 82,269 77,087 -34357 -42% -29175 -38%
Daily Average u/d 3,423 3,568 3,089 3,343 3,335 3,212 7 0% 131 4%Daily Average per person u/h 18.2 19.0 16.4 17.8 17.7 16.3 0 0% 2 9%
June Week 3 UnitACTUAL FULL MONTH
VARIANCES
VS bdg VS. py
Plant: All
BY DETAILS
PPV-$ Budget -$ -$ -$ 19,570$
-$ Act/Fcst -$ -$ -$ -$
-$ Variance -$ -$ -$ (19,570)$
86,628$ Budget 27,016$ 28,289$ 31,324$ 29,285$
71,917$ Act/Fcst 12,305$ 28,289$ 31,324$ -$
(14,711)$ Variance (14,711)$ 0$ -$ (29,285)$
19,360$ Budget 6,050$ 6,050$ 7,260$ 5,747$
40,279$ Act/Fcst -$ 17,184$ 23,094$ -$
20,919$ Variance (6,050)$ 11,134$ 15,834$ (5,747)$ Restructuring
27,551$ Budget -$ 12,523$ 15,028$ 11,897$
24,499$ Act/Fcst 6,131$ 8,349$ 10,019$ -$
(3,053)$ Variance 6,131$ (4,174)$ (5,009)$ (11,897)$ 2,505$ Budget -$ -$ 2,505$ 1,983$
-$ Act/Fcst -$ -$ -$ -$
(2,505)$ Variance -$ -$ (2,505)$ (1,983)$ 10,019$ Budget -$ -$ 10,019$ 7,931$
24,499$ Act/Fcst 6,131$ 8,349$ 10,019$ -$
14,480$ Variance 6,131$ 8,349$ 0$ (7,931)$ 2,505$ Budget -$ -$ 2,505$ 1,983$
-$ Act/Fcst -$ -$ -$ -$
(2,505)$ Variance -$ -$ (2,505)$ (1,983)$
3 Additional PPV Challenge 0.4% GSS/ Material Savings E. van der Zande
4 3 FTE Tube Cutting Machine Restructuring J. den Haan
1 KHT GSS/ Material Savings E. van der Zande
2 Normal PPV 2.0% GSS/ Material Savings E. van der Zande
5 0.5 FTE Material Flow Pilot Line 4 Restructuring J. den Haan
6 2 FTE Improvement Operator Efficiency/ Quality Restructuring J. den Haan
7 0.5 FTE 6S Improvements Restructuring J. den Haan
FLASH DASHBOARD
ACTIONREGISTER
BACKLOG
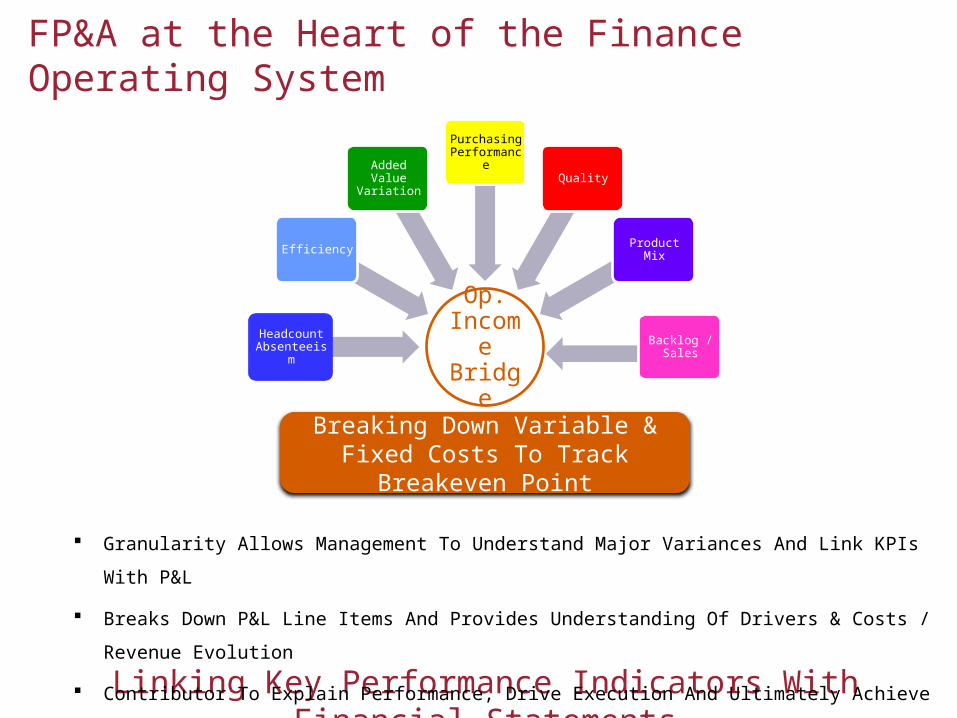
FP&A at the Heart of the Finance Operating System
Op. Income Bridge
Backlog / Sales
Product Mix
Quality
Purchasing Performance
Added Value Variation
Efficiency
Headcount Absenteeism
Breaking Down Variable & Fixed Costs To Track Breakeven Point
Linking Key Performance Indicators With Financial Statements
Granularity Allows Management To Understand Major Variances And Link KPIs With P&L
Breaks Down P&L Line Items And Provides Understanding Of Drivers & Costs / Revenue Evolution
Contributor To Explain Performance, Drive Execution And Ultimately Achieve Targets
Strategic Plan
Operating Plan Budget Forecasts
/ Outlooks
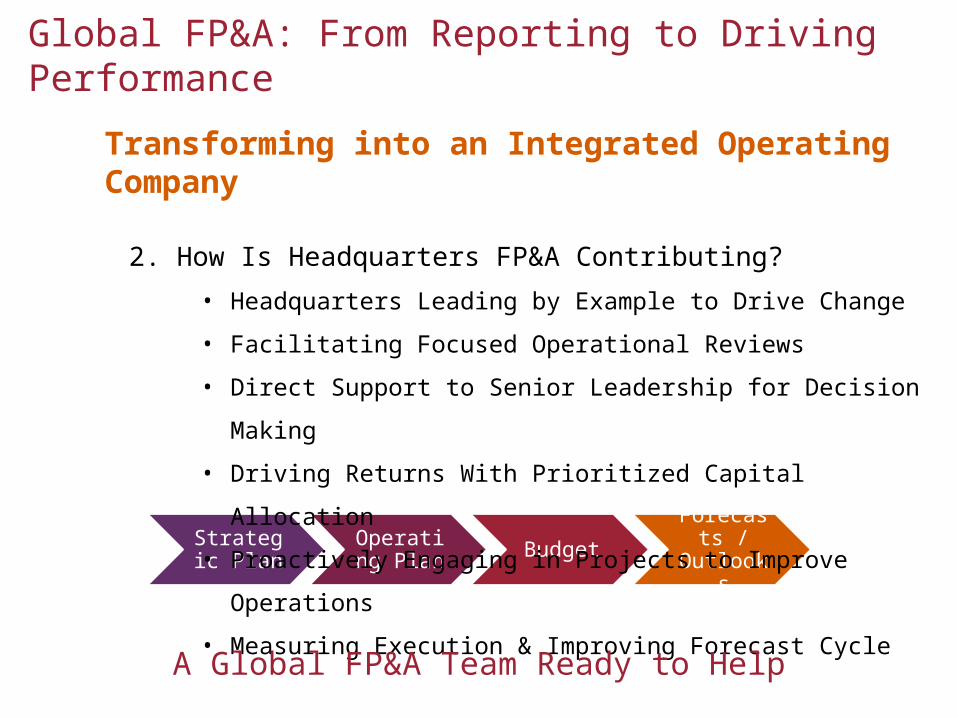
Global FP&A: From Reporting to Driving Performance
Transforming into an Integrated Operating Company
2. How Is Headquarters FP&A Contributing?• Headquarters Leading by Example to Drive Change
• Facilitating Focused Operational Reviews
• Direct Support to Senior Leadership for Decision Making
• Driving Returns With Prioritized Capital Allocation
• Proactively Engaging in Projects to Improve Operations
• Measuring Execution & Improving Forecast Cycle
A Global FP&A Team Ready to Help
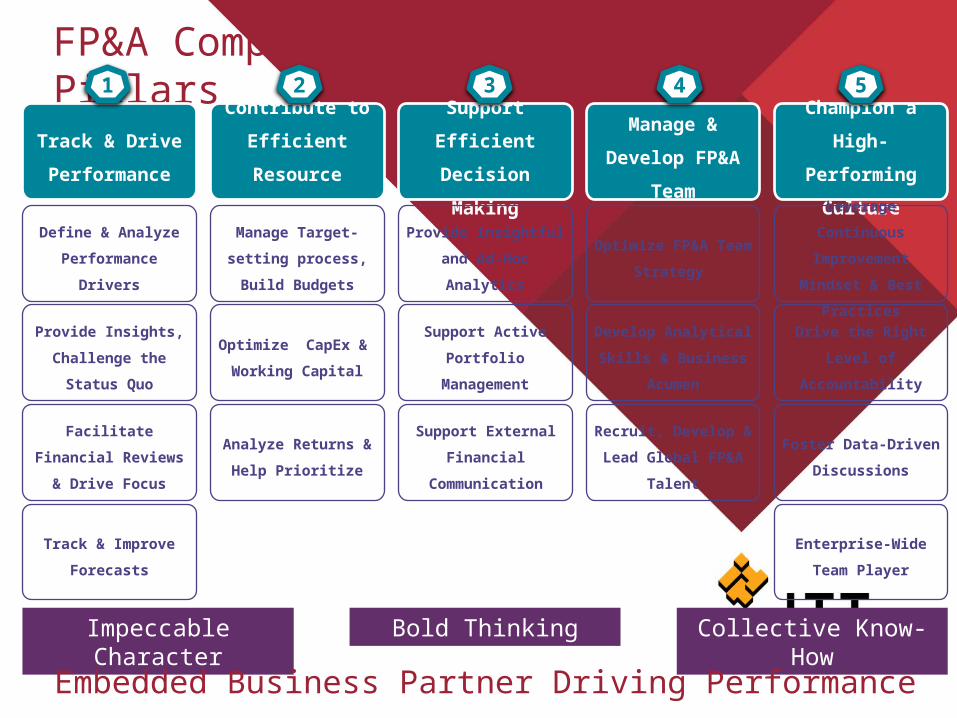
FP&A Compelling Vision - 5 Pillars
Track & Drive
Performance
Contribute to
Efficient
Resource
Allocation
Support Efficient
Decision Making
Manage &
Develop FP&A
Team
Champion a High-
Performing
Culture
Define & Analyze
Performance Drivers
Provide Insights,
Challenge the Status
Quo
Facilitate Financial
Reviews & Drive Focus
Track & Improve
Forecasts
Manage Target-setting
process, Build
Budgets
Optimize CapEx &
Working Capital
Analyze Returns &
Help Prioritize
Provide Insightful and
Ad-Hoc Analytics
Support Active
Portfolio Management
Optimize FP&A Team
Strategy
Develop Analytical
Skills & Business
Acumen
Recruit, Develop &
Lead Global FP&A
Talent
Leverage Continuous
Improvement Mindset
& Best Practices
Drive the Right Level
of Accountability
Foster Data-Driven
Discussions
Enterprise-Wide Team
Player
Impeccable Character Bold Thinking Collective Know-How
1 2 3 4 5
Support External
Financial
Communication
Embedded Business Partner Driving Performance
Partner
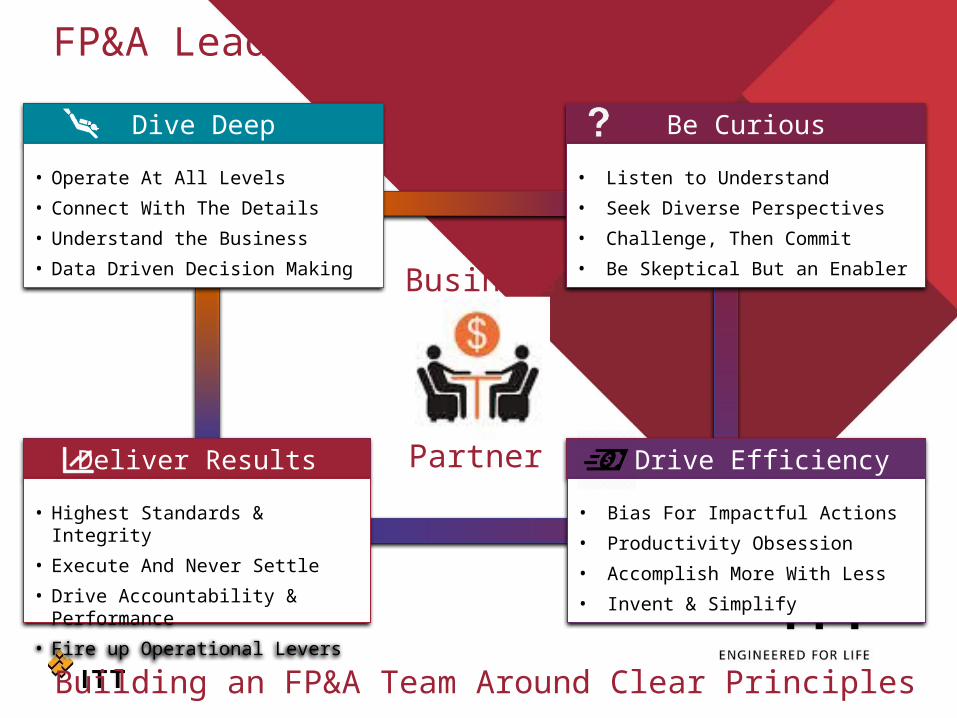
FP&A Leadership Principles
Dive Deep
• Operate At All Levels• Connect With The Details• Understand the Business• Data Driven Decision Making
Be Curious
• Listen to Understand• Seek Diverse Perspectives• Challenge, Then Commit• Be Skeptical But an Enabler
Deliver Results
• Highest Standards & Integrity• Execute And Never Settle• Drive Accountability & Performance• Fire up Operational Levers
Drive Efficiency
• Bias For Impactful Actions• Productivity Obsession• Accomplish More With Less• Invent & Simplify
Business
Building an FP&A Team Around Clear Principles

THANK YOU