Embed Size (px)
Citation preview

AF&PA Sustainability ReportAdvancing U.S. Paper and Wood Products Industry
Sustainability Performance
2016
Progress Toward Sustainability Goals 2
Paper Recovery for Recycling Goal 2
Energy Efficiency Goal 3
Greenhouse Gas Emissions Goal 4
Sustainable Forestry Goal 5
Worker Safety Goal 6
Water Use Goal 7
The Three Pillars of Sustainability 8
Economic 8
Contributions to GDP 8
Employment 8
Capital Spending 9
Trade Balance 1 0
Paper and Paperboard Production 1 0
Profits 1 0
Economic Impact on Local Communities 1 1
Environmental 1 2
Paper Recycling 1 2
Greenhouse Gas Emissions Reductions 1 3
Energy Production and Efficiency 1 4
Combined Heat and Power Production 1 5
Self-Generated Electricity 1 6
Forestry 1 7
Water 1 8
Doing More with Less 1 9
Social 2 0
Safety and Employee Well-Being 2 0
Promoting Our Workforce 2 1
Engaging Local Communities 2 2
Our Products 2 3
Printing and Writing Papers 2 3
Paper-Based Packaging 2 4
Pulp 2 5
Tissue 2 6
Wood Products 2 7
The AF&PA Sustainability Awards 2 8
In This Report:
DATA METHODOLOGY
AF&PA member companies are required to adhere to and report biennially on a set of Environmental, Health & Safety (EHS) and Sustainable Procurement principles.
The information in this report on member performance has been generated through our 2014 EHS performance verification survey of members. Other data is from other AF&PA or government agency sources, when indicated.
Better Practices, Better Planet 2020
Advancing U.S. Paper and Wood Products Industry Sustainability Performance
On behalf of the American Forest & Paper Association (AF&PA) and its members, we are proud to present our 2016 Sustainability Report. This report marks the halfway point in our ten-year journey to reach our 2020 goals.
AF&PA serves to advance a sustainable U.S. pulp, paper, packaging, tissue, and wood products manufacturing industry through fact-based public policy and marketplace advocacy. Our member companies produce essential products that are widely used every day and made from renewable and recyclable resources using sustainable manufacturing processes. AF&PA members represent
the spectrum of the paper and wood products manufacturing sector.
Through the Better Practices, Better Planet 2020 initiative, our members are successfully pursuing one of the most extensive sets of sustainability goals established for a U.S. manufacturing industry. Member efforts to increase efficiencies and further enhance sustainability performance within their companies resulted in the early achievement of our safety and greenhouse gas emission goals.
Our industry’s commitment to sustainability reaches far beyond fulfillment of the Better Practices, Better Planet 2020 goals. We work with our members, government agencies, communities, and other stakeholders to employ advanced sustainability
practices benefitting the economy, the environment and society, and transparently report on our performance.
We invite you to look closely at the performance summary presented in this biennial report and welcome your feedback on our journey.
Donna Harman President and CEO
1
Progress Toward Sustainability Goals
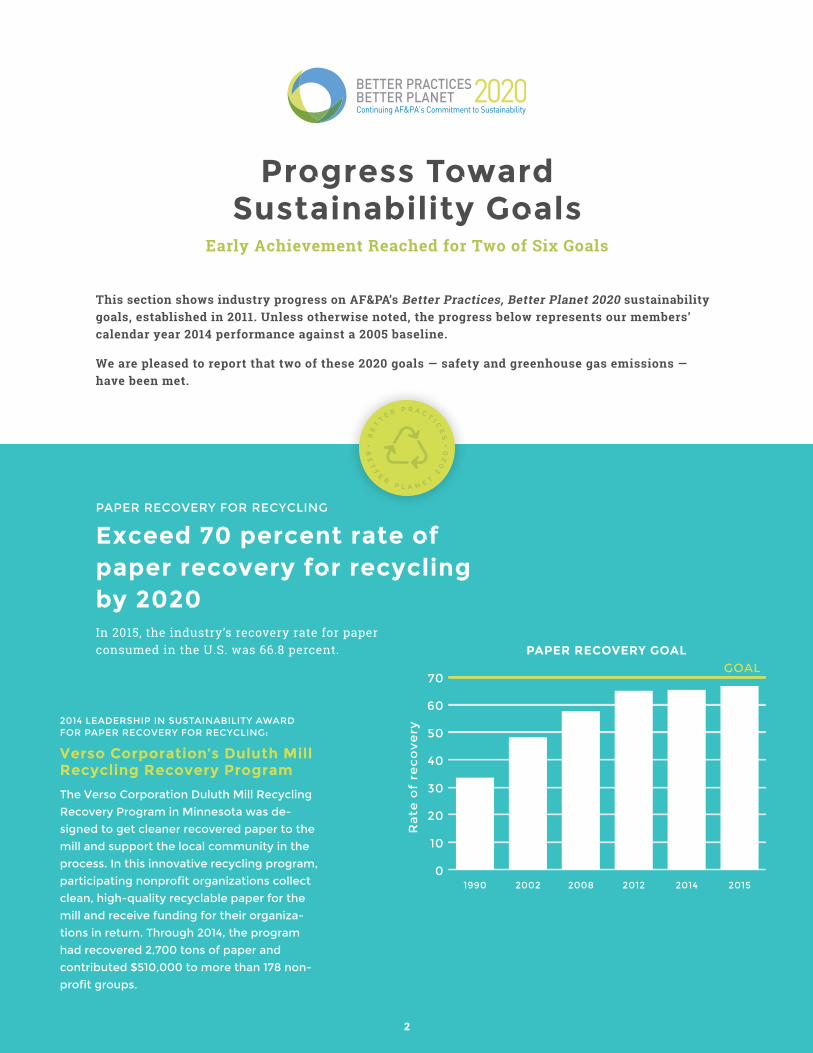
Early Achievement Reached for Two of Six Goals
This section shows industry progress on AF&PA’s Better Practices, Better Planet 2020 sustainability goals, established in 2011. Unless otherwise noted, the progress below represents our members’ calendar year 2014 performance against a 2005 baseline.
We are pleased to report that two of these 2020 goals — safety and greenhouse gas emissions — have been met.
PAPER RECOVERY FOR RECYCLING
Exceed 70 percent rate of paper recovery for recycling by 2020In 2015, the industry’s recovery rate for paper consumed in the U.S. was 66.8 percent.
0
10
20
30
40
50
60
70
Ra
te o
f re
co
ve
ry
201520142012200820021990
PAPER RECOVERY GOALGOAL
2014 LEADERSHIP IN SUSTAINABILITY AWARD FOR PAPER RECOVERY FOR RECYCLING:
Verso Corporation’s Duluth Mill Recycling Recovery Program
The Verso Corporation Duluth Mill Recycling
Recovery Program in Minnesota was de-
signed to get cleaner recovered paper to the
mill and support the local community in the
process. In this innovative recycling program,
participating nonprofit organizations collect
clean, high-quality recyclable paper for the
mill and receive funding for their organiza-
tions in return. Through 2014, the program
had recovered 2,700 tons of paper and
contributed $510,000 to more than 178 non-
profit groups.
• B
ET
T E R P R A C T I CE
S •
BE
TT
ER P L A N E T
20
20
2

ENERGY EFFICIENCY
At least a 10 percent increase in members’ purchased energy efficiency from 2005 to 2020 Member purchased energy use per ton of production was 8.1 percent lower in 2014 compared to the baseline year of 2005.
2015 LEADERSHIP IN SUSTAINABILITY AWARD FOR ENERGY EFFICIENCY / GREENHOUSE GAS REDUCTION:
Seaman Paper Company’s Soft Steps Forward Initiative
As part of the Soft Steps Forward Initiative,
Seaman Paper committed to decrease their
purchased fuel and electricity dependency.
Seaman Paper now produces 97 percent
of their steam requirements from carbon-
neutral biomass, and installed a backpressure
turbine that runs on steam to meet a portion
of their electricity needs. These measures
helped decrease Seaman Paper’s total energy
cost despite the sharp increases in oil and
electricity costs over the past decade.
10.5
11.0
11.5
12.0
12.5
13.0
13.5
Mill
ion
BT
Us
pe
r To
n P
rod
uct
ion
20142012201020082005 Baseline
PURCHASED ENERGY GOAL
GOAL
• B
ET
T E R P R A C T I CE
S •
BE
TT
ER P L A N E T
20
20
3
GREENHOUSE GAS EMISSIONS
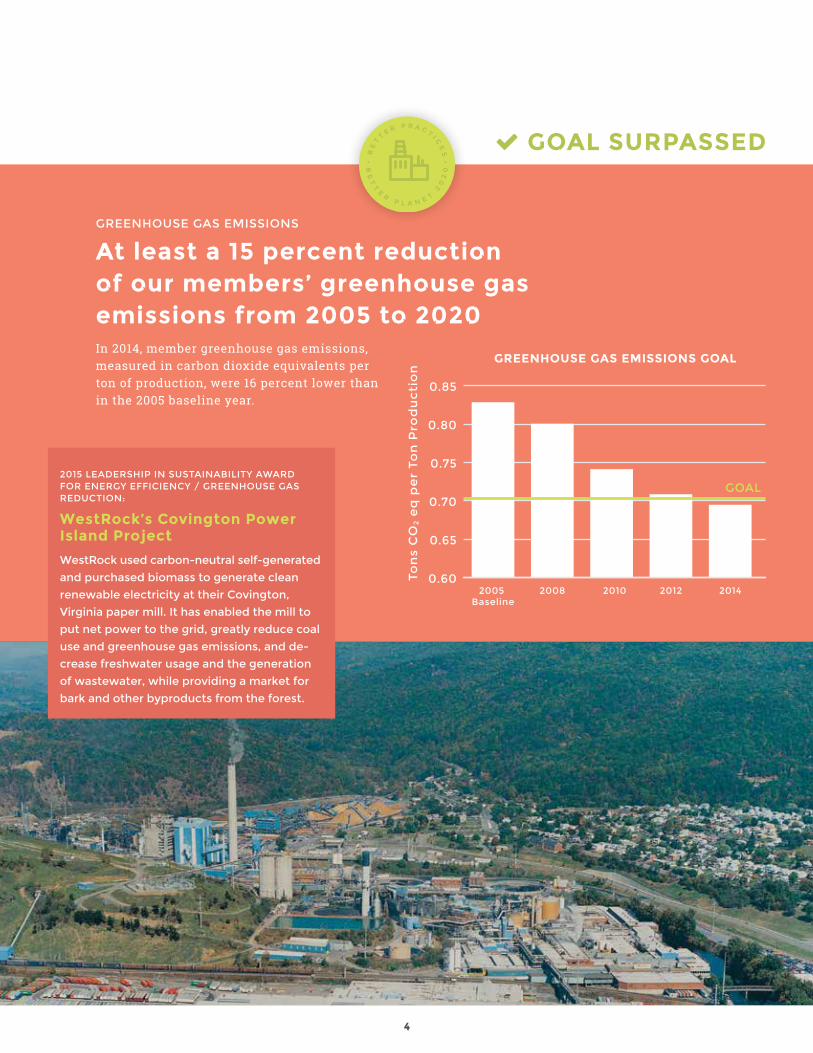
At least a 15 percent reduction of our members’ greenhouse gas emissions from 2005 to 2020In 2014, member greenhouse gas emissions, measured in carbon dioxide equivalents per ton of production, were 16 percent lower than in the 2005 baseline year.
0.60
0.65
0.70
0.75
0.80
0.85
To
ns
CO
2 e
q p
er
To
n P
rod
uc
tio
n
20142012201020082005 Baseline
GOAL
GREENHOUSE GAS EMISSIONS GOAL
2015 LEADERSHIP IN SUSTAINABILITY AWARD FOR ENERGY EFFICIENCY / GREENHOUSE GAS REDUCTION:
WestRock’s Covington Power Island Project
WestRock used carbon-neutral self-generated
and purchased biomass to generate clean
renewable electricity at their Covington,
Virginia paper mill. It has enabled the mill to
put net power to the grid, greatly reduce coal
use and greenhouse gas emissions, and de-
crease freshwater usage and the generation
of wastewater, while providing a market for
bark and other byproducts from the forest.
GOAL SURPASSED
BE
TT
ER P L A N E T
20
20
• B
ET
T E R P R A C T I CE
S •
4
SUSTAINABLE FORESTRY
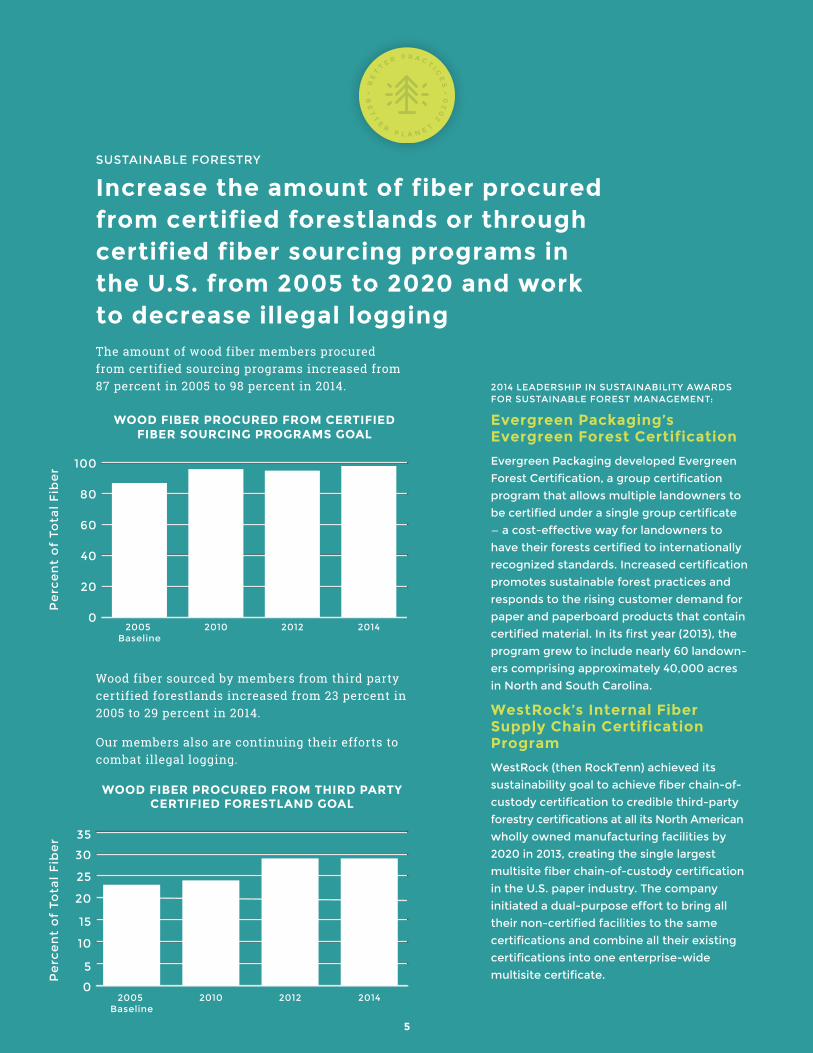
Increase the amount of fiber procured from certified forestlands or through certified fiber sourcing programs in the U.S. from 2005 to 2020 and work to decrease illegal logging
2014 LEADERSHIP IN SUSTAINABILITY AWARDS FOR SUSTAINABLE FOREST MANAGEMENT:
Evergreen Packaging’s Evergreen Forest Certification
Evergreen Packaging developed Evergreen
Forest Certification, a group certification
program that allows multiple landowners to
be certified under a single group certificate
— a cost-effective way for landowners to
have their forests certified to internationally
recognized standards. Increased certification
promotes sustainable forest practices and
responds to the rising customer demand for
paper and paperboard products that contain
certified material. In its first year (2013), the
program grew to include nearly 60 landown-
ers comprising approximately 40,000 acres
in North and South Carolina.
WestRock’s Internal Fiber Supply Chain Certification Program
WestRock (then RockTenn) achieved its
sustainability goal to achieve fiber chain-of-
custody certification to credible third-party
forestry certifications at all its North American
wholly owned manufacturing facilities by
2020 in 2013, creating the single largest
multisite fiber chain-of-custody certification
in the U.S. paper industry. The company
initiated a dual-purpose effort to bring all
their non-certified facilities to the same
certifications and combine all their existing
certifications into one enterprise-wide
multisite certificate.
0
20
40
60
80
100
Pe
rce
nt
of
Tota
l F
ibe
r
2014201220102005 Baseline
WOOD FIBER PROCURED FROM CERTIFIED FIBER SOURCING PROGRAMS GOAL
The amount of wood fiber members procured from certified sourcing programs increased from 87 percent in 2005 to 98 percent in 2014.
Wood fiber sourced by members from third party certified forestlands increased from 23 percent in 2005 to 29 percent in 2014.
Our members also are continuing their efforts to combat illegal logging.
0
5
10
15
20
25
30
35
Pe
rce
nt
of
Tota
l F
ibe
r
2014201220102005 Baseline
WOOD FIBER PROCURED FROM THIRD PARTYCERTIFIED FORESTLAND GOAL
• B
ET
T E R P R A C T I CE
S •
BE
TT
ER P L A N E T
20
20
5
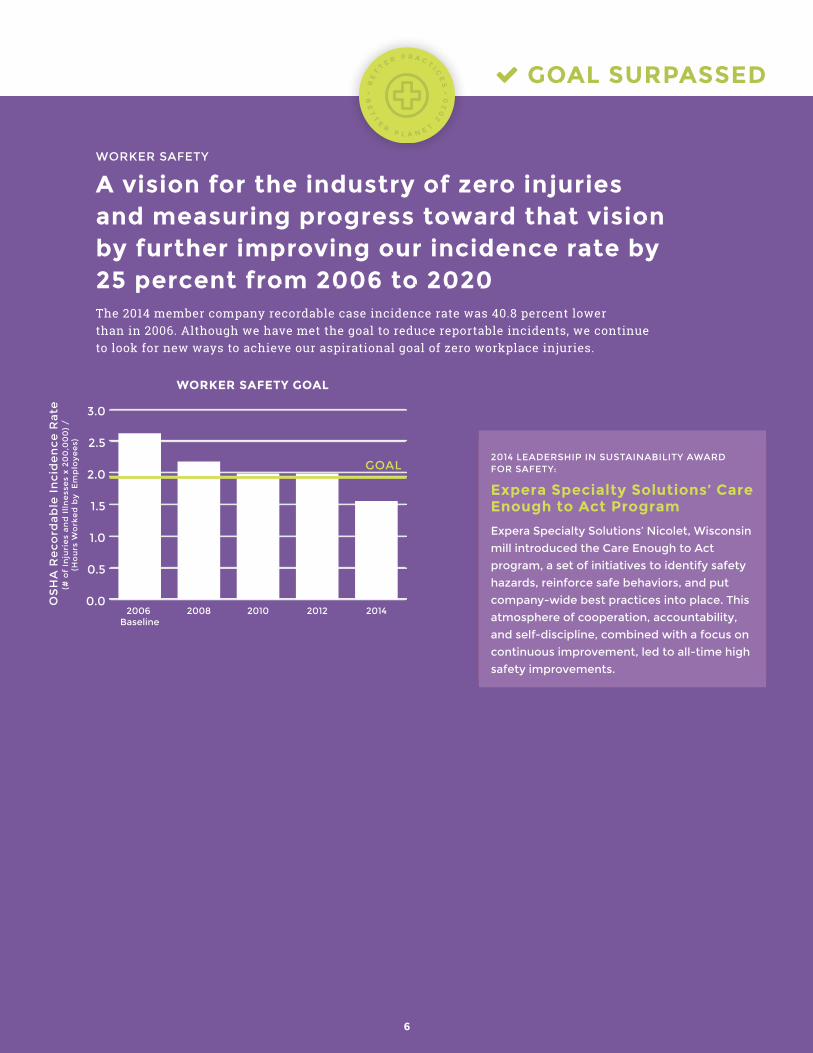
WORKER SAFETY
A vision for the industry of zero injuries and measuring progress toward that vision by further improving our incidence rate by 25 percent from 2006 to 2020The 2014 member company recordable case incidence rate was 40.8 percent lower than in 2006. Although we have met the goal to reduce reportable incidents, we continue to look for new ways to achieve our aspirational goal of zero workplace injuries.
0.0
0.5
1.0
1.5
2.0
2.5
3.0
20142012201020082006 Baseline
WORKER SAFETY GOAL
GOAL
OS
HA
Re
co
rda
ble
In
cid
en
ce
Ra
te(#
of
Inju
rie
s a
nd
Ill
ne
sse
s x
20
0,0
00
) /
(H
ou
rs W
ork
ed
by
E
mp
loy
ee
s)
GOAL SURPASSED
2014 LEADERSHIP IN SUSTAINABILITY AWARD FOR SAFETY:
Expera Specialty Solutions’ Care Enough to Act Program
Expera Specialty Solutions’ Nicolet, Wisconsin
mill introduced the Care Enough to Act
program, a set of initiatives to identify safety
hazards, reinforce safe behaviors, and put
company-wide best practices into place. This
atmosphere of cooperation, accountability,
and self-discipline, combined with a focus on
continuous improvement, led to all-time high
safety improvements.
• B
ET
T E R P R A C T I CE
S •
BE
TT
ER P L A N E T
20
20
6

WATER USE
A 12 percent reduction in members’ pulp and paper mills’ water use from 2005 to 2020AF&PA member pulp and paper mill water use in 2014 decreased by 6.5 percent below the 2005 baseline.
2014 LEADERSHIP IN SUSTAINABILITY AWARD FOR WATER:
Verso Corporation’s Escanaba Mill Water Reduction Initiative
The Verso Corporation Escanaba Mill in
Michigan carried out a comprehensive pro-
gram of repairs and optimization, resulting
in measurable water reductions throughout
the mill’s operations. These water conserva-
tion efforts also reduced costs required for
heating, pumping and treating water, and
support ongoing resource conservation
efforts at the mill.
2015 LEADERSHIP IN SUSTAINABILITY AWARD FOR WATER:
International Paper’s Pensacola Mill / Emerald Coast Utilities Authority (ECUA) Partnership Project
Through the partnership, International Paper’s
containerboard mill in Pensacola, Florida
receives treated effluent from ECUA that
it uses in its industrial processes. By using
reclaimed water to displace freshwater con-
sumption, International Paper is reducing its
water use at its Pensacola mill and protecting
the local ecosystem, while ECUA has found a
beneficial outlet for its treated effluent.
8000
9000
10000
11000
12000
Eff
lue
nt
Flo
w G
all
on
s p
er
Ton
Pro
du
cti
on
20142012201020082005 Baseline
WATER USE GOAL
GOAL
• B
ET
T E R P R A C T I CE
S •
BE
TT
ER P L A N E T
20
20
7
The Three Pillars of Sustainability
Economic, Environmental and Social
Economic
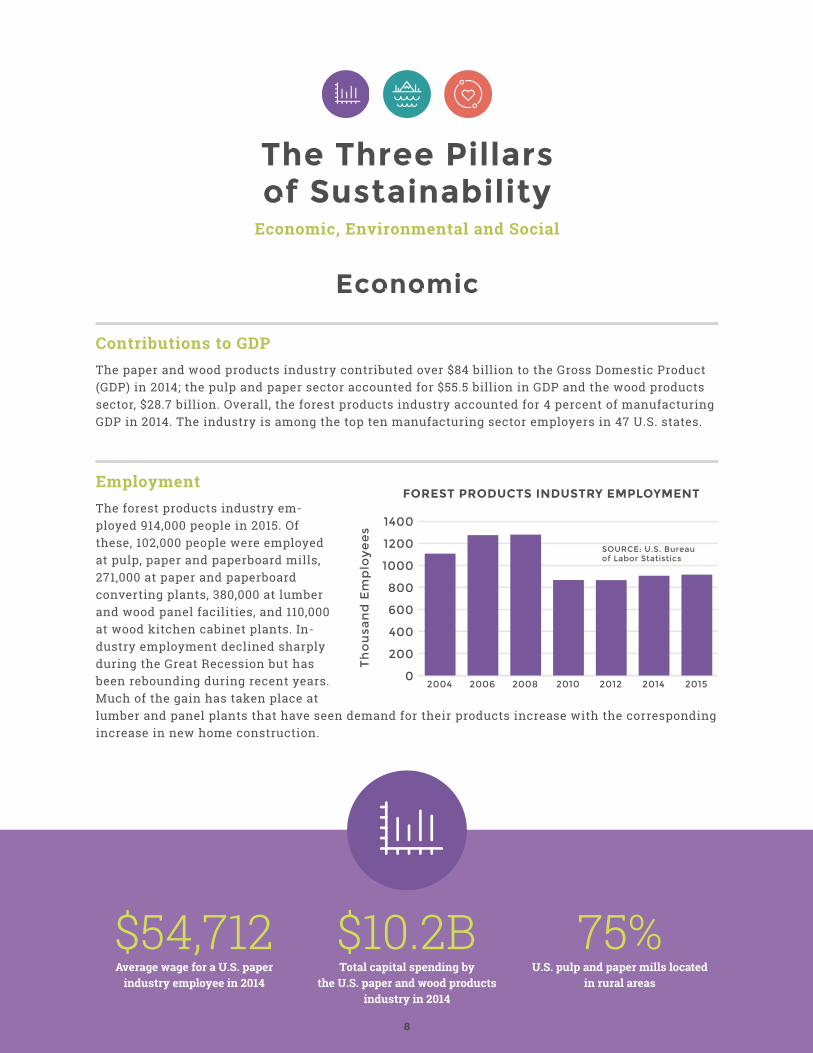
Contributions to GDPThe paper and wood products industry contributed over $84 billion to the Gross Domestic Product (GDP) in 2014; the pulp and paper sector accounted for $55.5 billion in GDP and the wood products sector, $28.7 billion. Overall, the forest products industry accounted for 4 percent of manufacturing GDP in 2014. The industry is among the top ten manufacturing sector employers in 47 U.S. states.
EmploymentThe forest products industry em-ployed 914,000 people in 2015. Of these, 102,000 people were employed at pulp, paper and paperboard mills, 271,000 at paper and paperboard converting plants, 380,000 at lumber and wood panel facilities, and 110,000 at wood kitchen cabinet plants. In-dustry employment declined sharply during the Great Recession but has been rebounding during recent years. Much of the gain has taken place at lumber and panel plants that have seen demand for their products increase with the corresponding increase in new home construction.
0
200
400
600
800
1000
1200
1400
Th
ou
san
d E
mp
loy
ee
s
2015201420122010200820062004
FOREST PRODUCTS INDUSTRY EMPLOYMENT
SOURCE: U.S. Bureau of Labor Statistics
$54,712Average wage for a U.S. paper
industry employee in 2014
$10.2BTotal capital spending by
the U.S. paper and wood products industry in 2014
75% U.S. pulp and paper mills located
in rural areas
8

Total forest products industry em-ployee compensation amounted to $51.4 billion in 2014. Paper industry employees were paid an average of $54,712 a year in 2014.1
Capital SpendingTotal capital spending by the paper and wood products industry rose to $10.2 billion in 2014, which marked its highest level since 2007. The 2014 level of spending was up from $6.2 billion in 2009, which was a recession year. In 2014, 89 percent of paper in-dustry capital expenditures went for equipment and the remaining 11 per-cent for structures. The correspond-ing percentages for wood products were 83 percent and 17 percent.
0 10 20 30 40 50 60
Billions of U.S. Dollars
TOTAL
Pulp, Paper,Paperboard and
Paper Converting
Wood Products
Logging
FOREST PRODUCTS INDUSTRY COMPENSATION
SOURCE: U.S. Bureau of Labor Statistics
0
2
4
6
8
10
12
Total Forest Products Pulp and PaperWood Products
201420132012201120102009200820072006
FOREST PRODUCTS INDUSTRYCAPITAL EXPENDITURES
SOURCE: U.S. Census Bureau
Bil
lio
n U
.S.
Do
lla
rs
1 U.S. Bureau of Labor Statistics
9

Trade BalanceDespite slow economic growth abroad and the strong dollar, the U.S. paper industry has maintained a trade sur-plus during recent years. The surplus first emerged in 2009 and expanded to 3.3 million tons in 2011. It subsequently contracted to 1.9 million tons by 2015, possibly due to the above-noted headwinds of weak economic growth abroad and the strong dollar.
Paper and Paperboard ProductionU.S. paper and paperboard production (exclusive of wet machine board and the construction grades) fell to a recession-induced low point of 78.3 million tons in 2009. It rebounded to 83 million
tons in 2010 and has declined grad-ually since then reaching 79 million tons in 2015. The average rate of decline for the five-year period from 2011 through 2015 was 1 percent a year.
ProfitsThe paper and wood products industry realized operating profits of $14 billion in 2015, which was above the industry’s long-term average annual level of $12.3 billion from 2002 through 2015. Operating profits fell to a low of $7.6 billion during the recession year of 2008; the high point occurred in 2005, when the industry’s operating profits exceeded $16 billion.
-10
-8
-6
-4
-2
0
2
4
Mil
lio
n T
on
s
20152014201320122011201020092008200720062005200420032002
PAPER INDUSTRY TRADE BALANCEIMPROVEMENT
SOURCE: U.S. Census Bureau
75
80
85
90
95
100
Mil
lio
n T
on
s
20152014201320122011201020092008200720062005200420032002
PAPER AND PAPERBOARD PRODUCTION
SOURCE: AF&PA Statistics
0
3
6
9
12
15
18
20152014201320122011201020092008200720062005200420032002
FOREST INDUSTRY PROFITS
SOURCE: Quarterly Financial Report,Manufacturing, Mining, Trade, and Selected Service Industry
Bil
lio
n U
.S.
Do
lla
rs
10

Economic Impact on Local Communities AF&PA member facilities are often located in rural communities where they frequently serve as the largest employer. In fact, more than 75 percent of all U.S. pulp and paper mills are located in counties that are more than 80 percent rural. As a result, local economies can be highly dependent on the economic sustainability of these facilities.
80% or more ruralLess than 80% rural
11
COUNTY LOCATIONS OF PULP AND PAPER MILLS
SOURCE: U.S. Census Bureau

Environmental
Paper RecyclingDue to voluntary industry initiatives and the millions of Americans who recycle at home, work, and school every day, the annual recovery rate has nearly doubled since 1990. In 2015, 52 million tons, or 66.8 percent of paper consumed in the U.S. was recovered for recycling. Achieving our goal to exceed 70 percent recovery will require maximizing existing sources of recovered fiber, like office buildings and smaller commercial establishments, to recover more office-type papers and reach-
ing out to new potential sources of recovered paper and packaging. AF&PA is developing new data on the drivers of recovered fiber flows to demonstrate how the recov-ered fiber stream is changing.
0
10
20
30
40
50
60
70
Pe
rce
nt
Re
cove
ry
Paper and Paperboard
Total Metals
SteelGlassAluminumPlastics
SOURCE: U.S. EnvironmentalProtection Agency
2013 PAPER RECYCLINGVS. OTHER MATERIALS
2015 LEADERSHIP IN SUSTAINABILITY AWARD FOR PAPER RECOVERY FOR RECYCLING:
Evergreen Packaging’s On-Packaging Recycle Logo Use Tracking Project
Surveys show that consumers look for a
recycle logo on a carton to determine wheth-
er it is recyclable. Given the importance of
on-package logo use, Evergreen Packaging
developed and implemented a recycle logo
tracking system for the cartons they produce.
This information is used to work with cus-
tomers to include the logo on their cartons
and communicate to consumers that those
cartons are recyclable, thereby increasing
recovery.
52MMTons of paper recovered for recycling in the U.S.
in 2015
67%U.S. pulp and paper mills’ energy needs provided by biomass and
renewable fuels, on average, in 2014
10 Number of times water is reused
in the U.S. pulp and paper industry before treatment and discharge,
on average
12

U.S. Environmental Protection Agency (EPA) data for 2013 shows that recovery of paper and paperboard from munic-ipal solid waste streams exceeds that of plastics (by nearly seven times), aluminum (by more than three times) and glass (by more than two times).
Greenhouse Gas Emission ReductionsAF&PA members’ early attainment of their Better Practices, Better Planet 2020 greenhouse gas (GHG) emission reduction goal comes as a result of efforts reaching back to at least 2000. Since 2000, total direct and indirect absolute GHG releases at member pulp, paper and wood products manufacturing facilities have decreased by 42.2 percent to 51 million tons carbon dioxide (CO2) equivalents. GHG emissions intensity, expressed as CO2 equivalents released per ton of product
produced, has decreased by 23.9 percent to 0.7 tons. These reductions have come about through member adoption of efficient manufacturing production measures, increased use of less carbon-intensive fossil fuels and carbon-neutral biomass-based energy sources.
These reductions and the perfor-mance we report to show progress against our Better Practices, Better Planet 2020 goal underestimate the actual AF&PA member GHG reduc-tions because of a conservative
0
10
20
30
40
50
60
Tons LandfilledTons Recovered
201520142012201020082006200420022000
U.S. PAPER RECOVERED VS. PAPER LANDFILLED
SOURCE: AF&PA Statistics
Mil
lio
n T
on
s
13
Recycled Fiber Reduces Greenhouse Gas Emissions
AF&PA members’ use of recovered fiber to make new paper products avoided more than 21 million metric tons of carbon dioxide equivalent greenhouse gas emissions in 2015.
0
20
40
60
80
100
Absolute
20142012201020082006200420022000
AF&PA MEMBER GREENHOUSE GAS EMISSIONREDUCTIONS (TOTAL DIRECT AND INDIRECT)
Mil
lio
n M
etr
ic T
on
s C
O2 e
q
0.4
0.6
0.8
1.0
Intensity
Ton
s CO
2 eq
pe
r Ton
Pro
du
ctio
n

convention we use in our calculations. Due to state Renewable Portfolio Standards, environmental regulations and market forces, the GHG intensity of purchased electricity has decreased 15 percent between 2005 and 2012. To make our measurements more comparable over time, however, we have held constant at 2005 levels national GHG emission factors associated with electricity2 and steam3 purchased by our mills and not reflected that decrease. If we adjust our reduction calculations to reflect the changes in the grid and to reflect the locations of our members’ mills, they would have achieved a 20.4 percent reduction from 2005 to 2014.4
Energy Production and EfficiencyAF&PA member manufacturing facilities obtain energy from a number of sources to support operations. These include biomass materials, fossil fuels, and purchased energy (electricity and steam), and members continually seek to use the energy more efficiently. In 2014, biomass and renewable fuels provided, on average, about 66.8 percent of pulp and paper mill energy needs, increasing slightly from 65.9 percent in 2012. At wood products facilities, on average, about 64.3 percent of energy needs were supplied by biomass and renewable fuels. If we did not use a conservative assumption in making our calcu-lations and instead took the actual renewable portion of the grid into account, the percentages increase to 67.7 percent for pulp and paper and 66.7 percent for wood products facilities.
2 “The Emissions & Generation Resource Integrated Database (eGRID), a comprehensive inventory of environmental attributes of electric power systems. eGRID is based on available plant-specific data for all U.S. electricity generating plants that provide power to the electric grid and report data to the U.S. government…..” U.S. EPA, eGRID FAQ, available at https://www.epa.gov/energy/egrid-faq.3 United States Department of Energy (USDOE). 2007. Instructions for Form EIA-1605. Voluntary reporting of greenhouse gases. Form EIA-1605. U.S. De-partment of Energy, Energy Information Administration. http://www.eia.doe.gov/oiaf/1605/pdf/EIA1605_Instructions_10-23-07.pdf.4 Our members’ reductions in absolute GHG releases from purchased electricity for the same period would be approximately 2.3 million metric CO2 eq. or 14 percent lower if these adjustments were made.
2014 LEADERSHIP IN SUSTAINABILITY AWARD FOR ENERGY EFFICIENCY / GREENHOUSE GAS REDUCTION:
Domtar’s Barge Unloading and Conveyor Project
Domtar’s Barge Unloading and Conveyor
Project achieves GHG reductions and im-
proves energy efficiency while transporting
resources from the banks of the Ohio River
straight into their Hawesville, Kentucky mill,
boosting productivity in the process. The
one-mile-long conveyor belt enables them to
directly deliver wood chips to the mill, elim-
inates 54,000 wood chip delivery truck trips
and drastically reduces truck traffic, related
congestion and pollution.
14
Member GHG Reductions Make a Difference
GHG releases from member facilities in 2014 were lower by 37 million tons CO2 equivalents when compared to emissions from member facilities in 2000. This provides the same reduction as taking 7.1 million typical passen-ger vehicles off the road for a year.
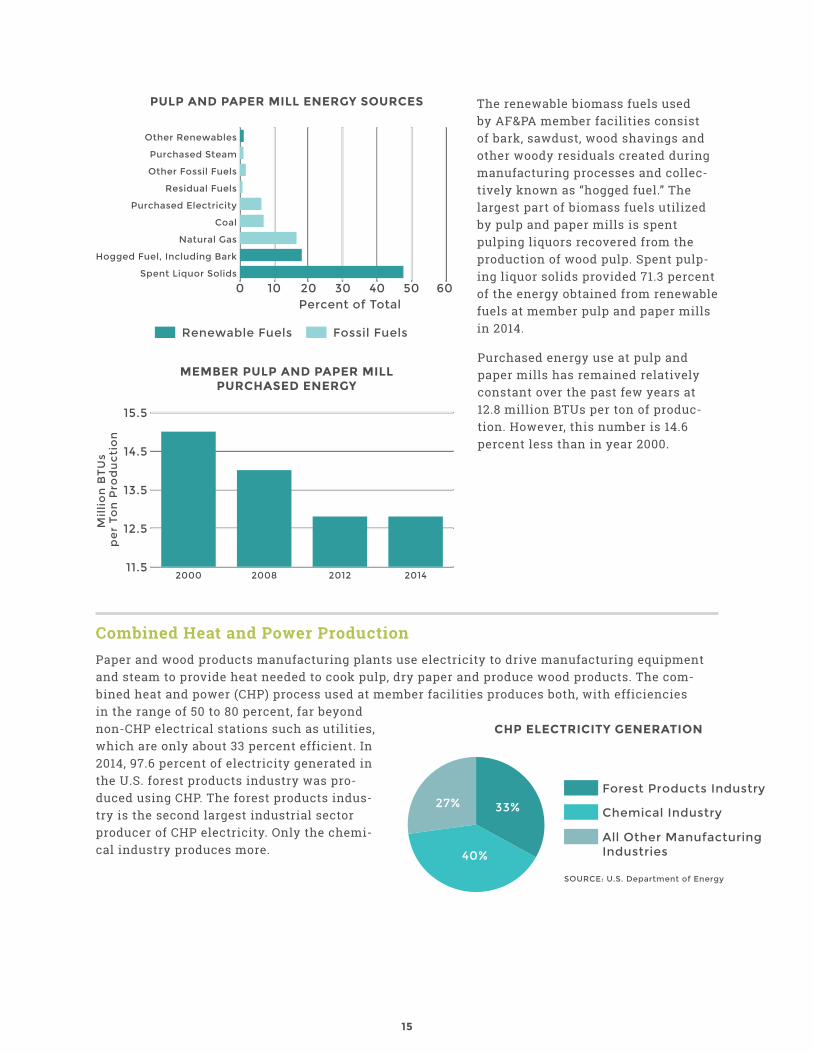
The renewable biomass fuels used by AF&PA member facilities consist of bark, sawdust, wood shavings and other woody residuals created during manufacturing processes and collec-tively known as “hogged fuel.” The largest part of biomass fuels utilized by pulp and paper mills is spent pulping liquors recovered from the production of wood pulp. Spent pulp-ing liquor solids provided 71.3 percent of the energy obtained from renewable fuels at member pulp and paper mills in 2014.
Purchased energy use at pulp and paper mills has remained relatively constant over the past few years at 12.8 million BTUs per ton of produc-tion. However, this number is 14.6 percent less than in year 2000.
Combined Heat and Power ProductionPaper and wood products manufacturing plants use electricity to drive manufacturing equipment and steam to provide heat needed to cook pulp, dry paper and produce wood products. The com-bined heat and power (CHP) process used at member facilities produces both, with efficiencies in the range of 50 to 80 percent, far beyond non-CHP electrical stations such as utilities, which are only about 33 percent efficient. In 2014, 97.6 percent of electricity generated in the U.S. forest products industry was pro-duced using CHP. The forest products indus-try is the second largest industrial sector producer of CHP electricity. Only the chemi-cal industry produces more.
PULP AND PAPER MILL ENERGY SOURCES
Renewable Fuels Fossil Fuels
0 10 20 30 40 50 60Percent of Total
Spent Liquor Solids
Hogged Fuel, Including Bark
Natural Gas
Coal
Purchased Electricity
Residual Fuels
Other Fossil Fuels
Purchased Steam
Other Renewables
11.5
12.5
13.5
14.5
15.5
Mil
lio
n B
TU
s p
er
Ton
Pro
du
cti
on
2014201220082000
MEMBER PULP AND PAPER MILLPURCHASED ENERGY
All Other Manufacturing Industries
Chemical Industry
Forest Products Industry
CHP ELECTRICITY GENERATION
33%
40%
27%
SOURCE: U.S. Department of Energy
15

Self-Generated Electricity AF&PA member pulp and paper mills self-generate the majority of electricity needed to run their facilities. In 2014, 56 percent of electricity needed to power member processes was self-generated. Forty-three percent of member mills generated more than half of their needed electricity. Eighteen percent of member mills also sold excess power to the grid. Much of this sold power was also renewable.
0 10 20 30 40 50 60
Percent
Self-generatedelectricity
Member millsgenerated more than
half of needs
Member mills sellingexcess power to grid
AF&PA MEMBER SELF-GENERATED ELECTRICITY
16
AF&PA Member Renewable Fuel Use Reduces Fossil Fuel Needs
Member facilities produced 1,155 trillion British Thermal Units of energy from renewable/carbon-neutral fuels in 2014. If this fuel source were unavailable it would be necessary to replace it with fossil fuels, producing 76 million additional metric tons of greenhouse gases from non-renewable fuels.
ForestryAs a condition of AF&PA membership, AF&PA members agree to abide by a set of sustainable procurement principles for the wood fiber they purchase, thereby creating an incentive for forest landowners to practice sustainable forest management. AF&PA members owning forestland also agree to conform to credible forest man-agement program standards. The Sustainable Forestry Initiative® (SFI®), the Forest Stewardship Council (FSC®) program, the American Tree Farm SystemTM (ATFS) and the Programme for the Endorsement of Forest Certifica-tion (PEFCTM) all qualify for this requirement.
Members work diligently to guard against procuring fiber from illegally-logged sources. Companies maintain documentation regarding fiber sources, require suppliers to sign agreements, and use third-party certification of chain-of-custody systems that require risk assessments on imported forest products and other forest management practices. AF&PA advocates for funding of Lacey Act im-plementation and Forest Service International programs to prevent illegal logging and the importation of illegally harvested forest products.
AF&PA members have been leaders in implementation of forest practices certification programs. 2015 marked the 20th anniversary of the development of SFI. Since the pro-gram began in 1995, more than 160,000 harvesters have been trained regarding water quality, biodiversity and other sustainable forest practice requirements. Nearly 10,000 harvesters were trained in 2015 alone. In 2014, almost all of the fiber delivered to SFI program participant mills was harvested by trained professionals. One hundred percent of harvest areas managed under SFI is reforested.5
2015 LEADERSHIP IN SUSTAINABILITY AWARD FOR SUSTAINABLE FOREST MANAGEMENT:
Domtar’s Marlboro FSC Partnership Project
FSC certification can be pricey for small
landowners, but paper companies often need
FSC-certified fiber to meet specific customer
demands. Through the Marlboro FSC Partner-
ship, Domtar covers certification costs and
pays a premium to receive certified fiber, and
landowners receive advice and support in
getting their wood certified. Through partner-
ships such as these, Domtar is getting closer
to its goal of using 20 percent FSC-certified
material in its pulp and paper mills by 2020.
2015 INNOVATION IN SUSTAINABILITY AWARD:
Verso Corporation’s Identifying and Mapping Vernal Pools on State Lands in Michigan’s Upper Peninsula Project
Verso Corporation engaged in a public-pri-
vate partnership to identify and map vernal
pools in Michigan’s Upper Peninsula, where
the company procures wood for its pulp and
paper production. Vernal pools are small,
shallow, temporary bodies of water that are
important for healthy forest ecosystems
because they provide food, water and habitat
for a number of animal and plant species.
Because vernal pools are small, isolated and
dry for part of the year, they can be difficult
to identify in the field, easily overlooked
and unintentionally damaged or destroyed.
The goal of the project was to enhance the
understanding of vernal pools’ distribution
and ecology in Michigan to more effectively
manage and conserve them.
5 SFI 2015 Progress Report, Growing our Future, 1995-2015: Celebrating 20 years of Leadership and Growth. Available at: www.sfiprogram.org/files/sfi-2015-progress-report/
17
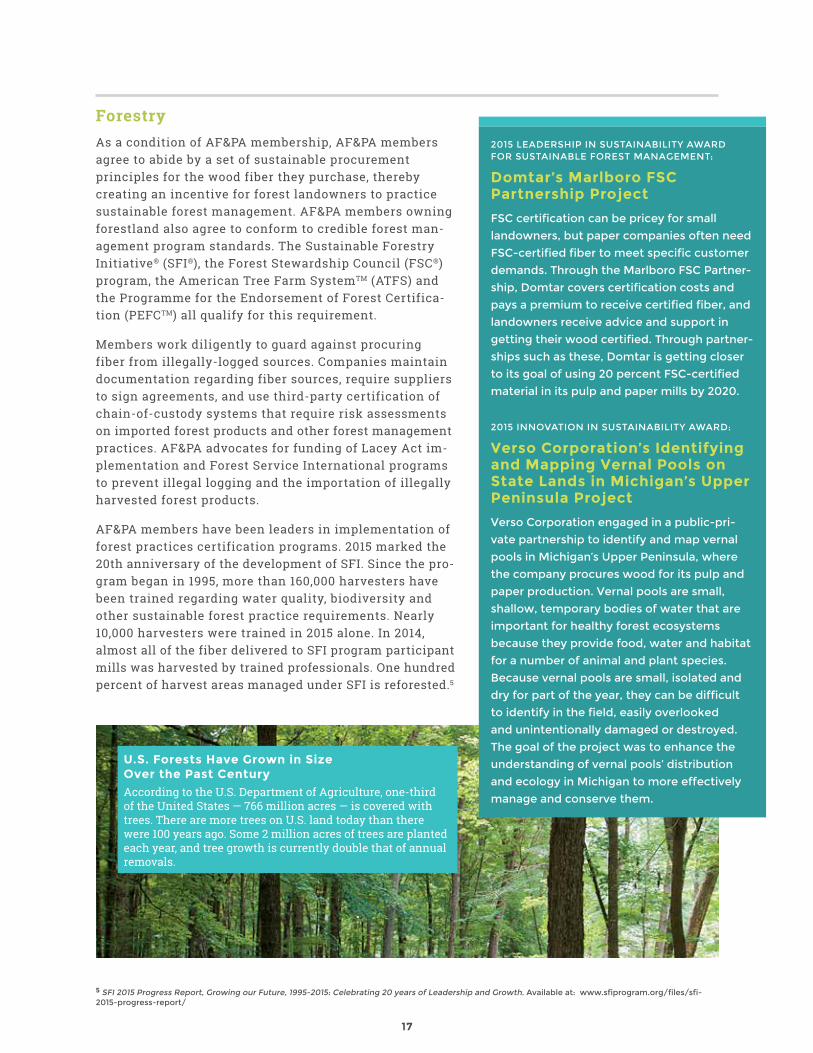
U.S. Forests Have Grown in Size Over the Past Century
According to the U.S. Department of Agriculture, one-third of the United States — 766 million acres — is covered with trees. There are more trees on U.S. land today than there were 100 years ago. Some 2 million acres of trees are planted each year, and tree growth is currently double that of annual removals.

WaterWater is essential for production of paper and wood products, and AF&PA members have taken import-ant steps to improve and preserve water resources. Between 2000 and 2010, AF&PA member pulp and paper mills reduced the amount of water needed to produce one ton of product by 15.2 percent. In 2011, members established a goal of further reducing water needed for paper production by 12 percent by 2020, based on a 2005 baseline. Reducing water use can lead to reduced energy demand and decreased GHG emissions.
Eighty-eight percent of the water used for production of paper and wood products is returned to the environment after treatment in a wastewater system, meaning that only 12 percent is “consumed” (water that evaporates during the manufacturing process or that is in products is considered “consumed”).6 The water that pulp and paper mills return to the environment is reused at least ten times in the mill before discharge.7
Since 2000, pulp and paper mills have reduced total suspended solids (TSS) and biochemical oxygen demand (BOD) released in treated effluents by 18.5 percent and 12.7 percent, respectively.
0
1
2
3
4
BODTSS
PULP AND PAPER MILL EFFLUENT DISCHARGES
0
4
8
12
16
Volume P
ou
nd
s p
er
Ton
Pro
du
cti
on
Th
ou
san
d G
allo
ns
pe
r Ton
Pro
du
ctio
n
20142012201020082006200420022000
18
6 Based on analysis of 2006 data by the National Council for Air and Stream Improvement (NCASI)7 Based on NCASI analysis
Pulp and Paper Mill Water Use Reductions are Substantial
At 2014 production and water use rates, the amount of water needed for papermaking was 130 billion gallons less than needed to produce the same quantity in year 2000. That amount of water would fill nearly 200,000 Olympic-sized swimming pools.

0.0
0.2
0.4
0.6
0.8
1.0
1.2
1.4
1.6
1.8
2.0
Greenhouse GasesTotal Energy
Total Reduced SulphurNitrogen Oxides Sulphur Dioxide
Adsorbable Organic Halides Biochemical Oxygen Demand
Total Suspended Solids
EffluentProduction
2014201220102008200620022000199519851975
Doing More with Less
Through the use of science and technology, AF&PA members strive for continuous improvements that “decouple” the demand for goods and services from the demand for natural resources and emissions. The graph below shows that, for decades, the industry’s production increased, while the amount of emissions and energy use is overall declining. As we get closer to background levels of emissions, it becomes much more challenging and costly to achieve continued reductions.
19
Pro
du
cti
on
/Im
pa
ct
Va
lue
In
de
x (
197
5 =
1)

Social
Safety and Employee Well-BeingThe safety of our workers is of paramount concern for our members. Injuries to employees are unacceptable, which is why the industry has a vision of zero injuries in the workplace. Our members continually work to develop innovative methods to realize this vision, such as developing protec-tive gear specially designed for potentially hazardous situations encountered by workers.
The industry recognizes that we still have further to go before we realize our vision of an injury- free workplace. AF&PA members have a variety of programs to promote the well-being of their
employees and the communities where they operate. In addition to required safety training for 100 percent of new employees and providing useful and timely safety updates, member companies offer employees health risk assessments and health promotion programs, as well as hosting on-site health fairs. Many of our members offer education on a variety of issues, including diet and weight management, high blood pressure and cholester-ol, smoking cessation, stress and substance abuse.
2015 LEADERSHIP IN SUSTAINABILITY AWARD FOR SAFETY:
Resolute Forest Products’ Working Towards Zero Incidents Project
A multi-disciplinary task force at Resolute
Forest Products took the initiative to design a
safer, watertight, more comfortable, breath-
able chemical protective suit that is appropri-
ate for all mill-related working requirements.
In addition, the new suits can be used for at
least a year, as opposed to the previous dis-
posable suits, of which employees used and
discarded many per month.
100%New AF&PA member employees
who received safety training in 2014
68%AF&PA members who offer
apprenticeships or internships to college students
64% AF&PA members who have either a charitable giving program or a corporate foundation to promote
philanthropic activities
20
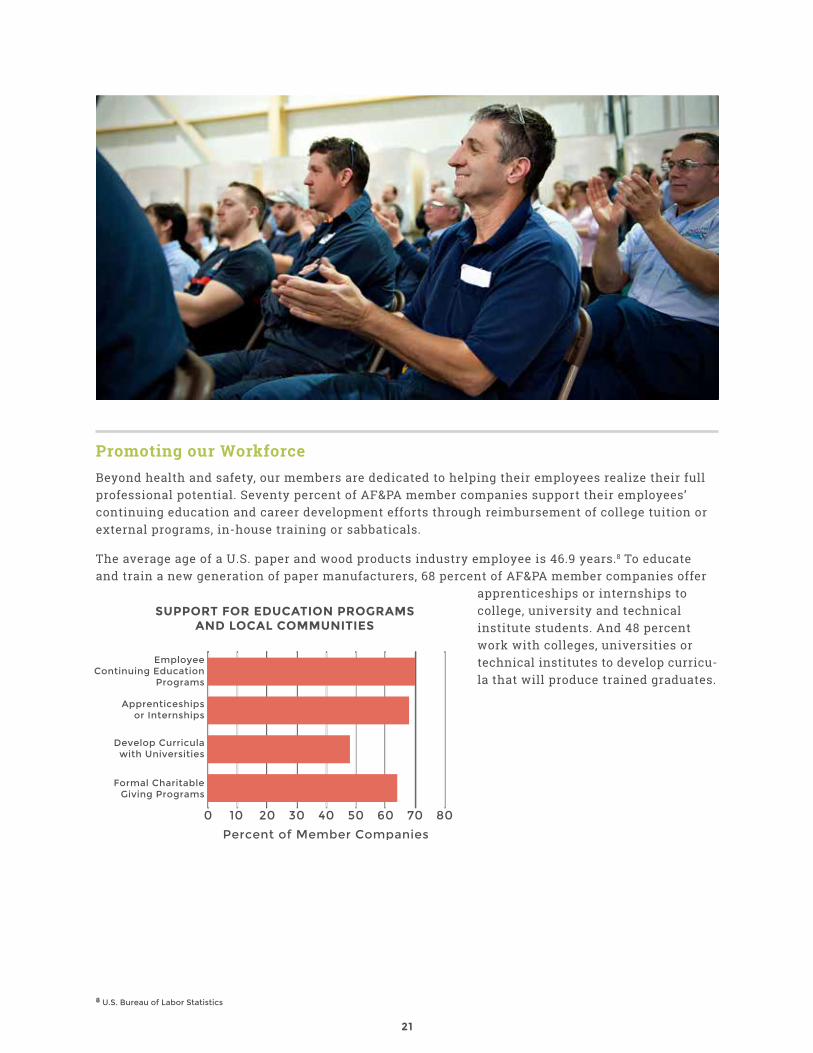
Promoting our WorkforceBeyond health and safety, our members are dedicated to helping their employees realize their full professional potential. Seventy percent of AF&PA member companies support their employees’ continuing education and career development efforts through reimbursement of college tuition or external programs, in-house training or sabbaticals.
The average age of a U.S. paper and wood products industry employee is 46.9 years.8 To educate and train a new generation of paper manufacturers, 68 percent of AF&PA member companies offer
apprenticeships or internships to college, university and technical institute students. And 48 percent work with colleges, universities or technical institutes to develop curricu-la that will produce trained graduates.
0 10 20 30 40 50 60 70 80
Percent of Member Companies
Formal CharitableGiving Programs
Develop Curriculawith Universities
Apprenticeshipsor Internships
EmployeeContinuing Education
Programs
SUPPORT FOR EDUCATION PROGRAMSAND LOCAL COMMUNITIES
21
8 U.S. Bureau of Labor Statistics

Engaging Local CommunitiesSixty-four percent of AF&PA member companies either have a charitable giving program or a corporate foundation to promote philanthropic activities. Below are some examples of ways in which our members are working to improve their communities.
Improving Water Transport, Improving Lives
Greif’s PackH2OTM backpacks answer the need for clean, easy-to-carry means of transporting and storing household water in regions where water must be transported by foot from source to home and disaster areas with limited access to clean water. Seven times lighter and seven times small-er than an average plastic jerrycan, PackH2OTM backpacks ease the burden of water transport for women and children, while reducing spills and waste and helping to keep water clean. At the end of 2014, PackH2OTM backpacks were present in 35 countries on four continents.
Employee Volunteerism and Community Giving to Improve the Environment
Clearwater Paper joined forces with the Palouse-Clearwater Environmental Institute on a multi-year restoration project at Lindsay Creek, Idaho, a highly visible area that had deteriorated over the years. Clearwater Paper donates an annual $10,000, and employees have volunteered hundreds of hours planting trees, weeding and providing general clean-up services for the Lindsay Creek
stream bank, helping to radically improve the wildlife habitat, water quality and the area’s visual appeal.
Transforming Communities, One Tree at a Time
Boise Paper, a division of Packaging Corporation of America, created Project UPTM, which turns abandoned urban spaces into neighborhood gathering places where families and individuals can come together, relax and thrive. Boise Paper provides the financial support for every Project UPTM park and partners with the Arbor Day Foundation, community leaders, and hundreds of dedi-cated volunteers to revitalize these neglected spaces into parks that help the planet, people and economy prosper.
Providing Insights and Exposure
At the local Conval Regional High School in Peterborough, New Hampshire, Monadnock Paper Mills participates in
a STEM program that helps to prepare students for occupations such as industrial manufacturing after they graduate. Monadnock opens their facilities to allow students to explore aspects of their operations like testing methods, capital process, and quality control.
Partnerships for Success
Sonoco executives participate on the boards of The Sonoco Institute of Packaging Design and Graphics at Clemson University and The Moore School of Business at the University of South Carolina. Through semester-long partnerships, students from these schools gain class credits through work with Sonoco on real-world business projects, providing experience to the students and fresh perspective and recruiting opportunities to Sonoco.
2015 INNOVATION IN SUSTAINABILITY AWARD:
Domtar’s Plymouth K-Lime Project
Domtar’s Plymouth, North Carolina mill
eliminated materials being sent to landfill by
creating K-Lime, a substitute for traditional
fertilizer that consists of byproducts of the
manufacturing process. K-Lime is all-natural
and works better than traditional fertilizer,
with farmers reporting increased crop yields.
Provided by Domtar to farmers at a third of
the cost, K-Lime proves that sustainability can
be simultaneously good for the environment
and the bottom line.
2222

OUR PRODUCTS
Printing & Writing PapersPrinting and writing papers play a key role in nearly all aspects of everyday
modern life. From promoting reading comprehension, information reten-
tion and learning, to communicating to individuals and wider audiences, to
providing personal and vital information, printing and writing papers have
adapted to fit the needs of each new generation throughout all sectors of
society and around the world.
Most official documents are paper-based and serve as proof of who we
are, what we have achieved and what we own, such as birth certificates,
passports, social security cards, high school and college diplomas, profes-
sional licenses, the deeds to our homes, and the titles to our cars.
Paper captures, documents and preserves milestones and memories in
baby books, artwork, personal diaries, handwritten letters and cards, and
photo albums.
23
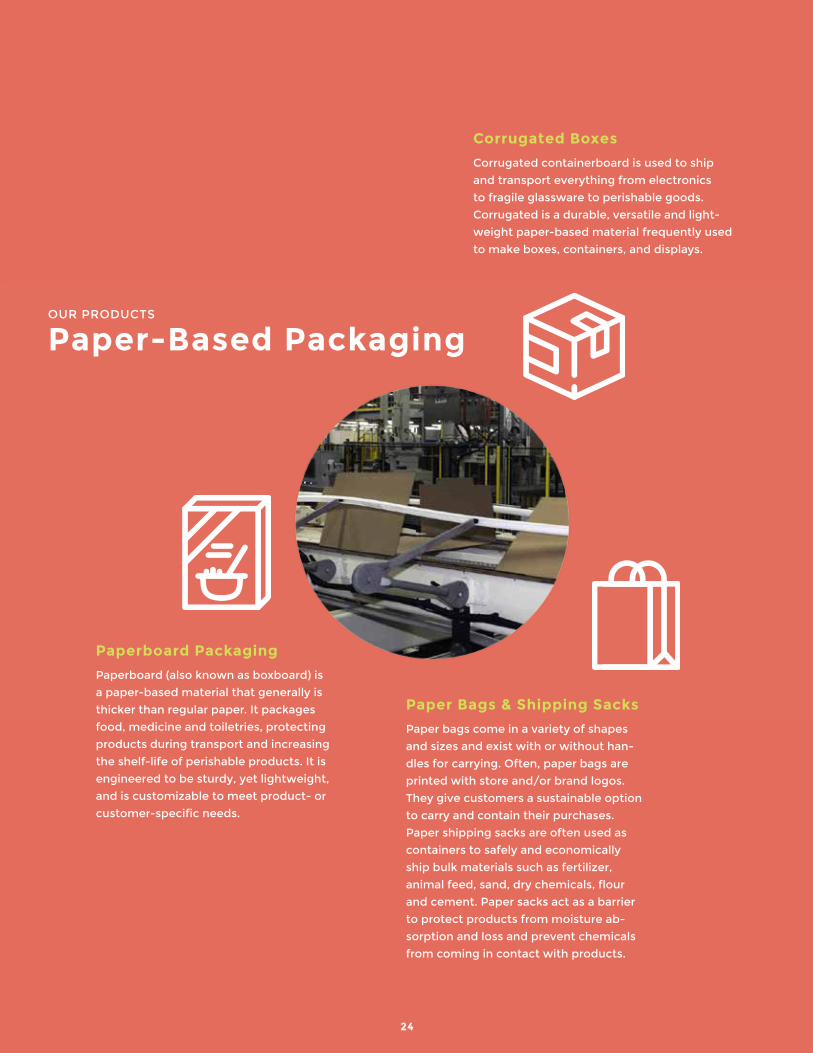
Corrugated Boxes
Corrugated containerboard is used to ship
and transport everything from electronics
to fragile glassware to perishable goods.
Corrugated is a durable, versatile and light-
weight paper-based material frequently used
to make boxes, containers, and displays.
Paperboard Packaging
Paperboard (also known as boxboard) is
a paper-based material that generally is
thicker than regular paper. It packages
food, medicine and toiletries, protecting
products during transport and increasing
the shelf-life of perishable products. It is
engineered to be sturdy, yet lightweight,
and is customizable to meet product- or
customer-specific needs.
Paper Bags & Shipping Sacks
Paper bags come in a variety of shapes
and sizes and exist with or without han-
dles for carrying. Often, paper bags are
printed with store and/or brand logos.
They give customers a sustainable option
to carry and contain their purchases.
Paper shipping sacks are often used as
containers to safely and economically
ship bulk materials such as fertilizer,
animal feed, sand, dry chemicals, flour
and cement. Paper sacks act as a barrier
to protect products from moisture ab-
sorption and loss and prevent chemicals
from coming in contact with products.
OUR PRODUCTS
Paper-Based Packaging
24

OUR PRODUCTS
PulpWood pulp is one of the most useful, versatile and abundant renewable
resources on the planet. Not only is it used in products the average
consumer is familiar with — paper, paper cups, tissue paper, cardboard
boxes — but over the years the industry has found additional applications
for different forms of pulp. It is present in specialty products as diverse
as LCD screens, home decor, food casings, and filters.
Dissolving Pulp
Dissolving wood pulp contains more than
90 percent pure cellulose. It is typically
not made into paper products but instead
is dissolved in a solvent or other solu-
tion and then spun into textile fibers like
rayon or Lyocell; chemically reacted to be
formed into fibers or films; or used as a
thickener for other products.
Fluff Pulp
Fluff pulp is a chemical pulp produced
from softwood trees like spruce, fir and
loblolly pine, which have fibers ideal for
absorbent and personal care items like
diapers, feminine hygiene and adult
incontinence products.
25

OUR PRODUCTS
TissueTissue products are a popular, growing market that includes bathroom
tissue (toilet paper), facial tissue, paper napkins, paper towels, wipes,
disposable baby diapers and adult incontinence products, feminine care
products, special sanitary papers (such as those used in the medical indus-
try), and decorative tissue papers, like crepe paper and laminated tissue
papers.
Tissue products have helped to create modern life. They contribute to
improved hygiene and convenience in our society, reducing the risks of
communicable diseases. Tissue products also are lauded for their strength,
ultra-light weight, and softness.
Advancements in manufacturing technology include more efficient fiber
use and improving the design of tissue products and the way they are dis-
pensed. These innovations allow the tissue sector to keep up with growing
consumer demand, improve existing products, and develop new products.
26
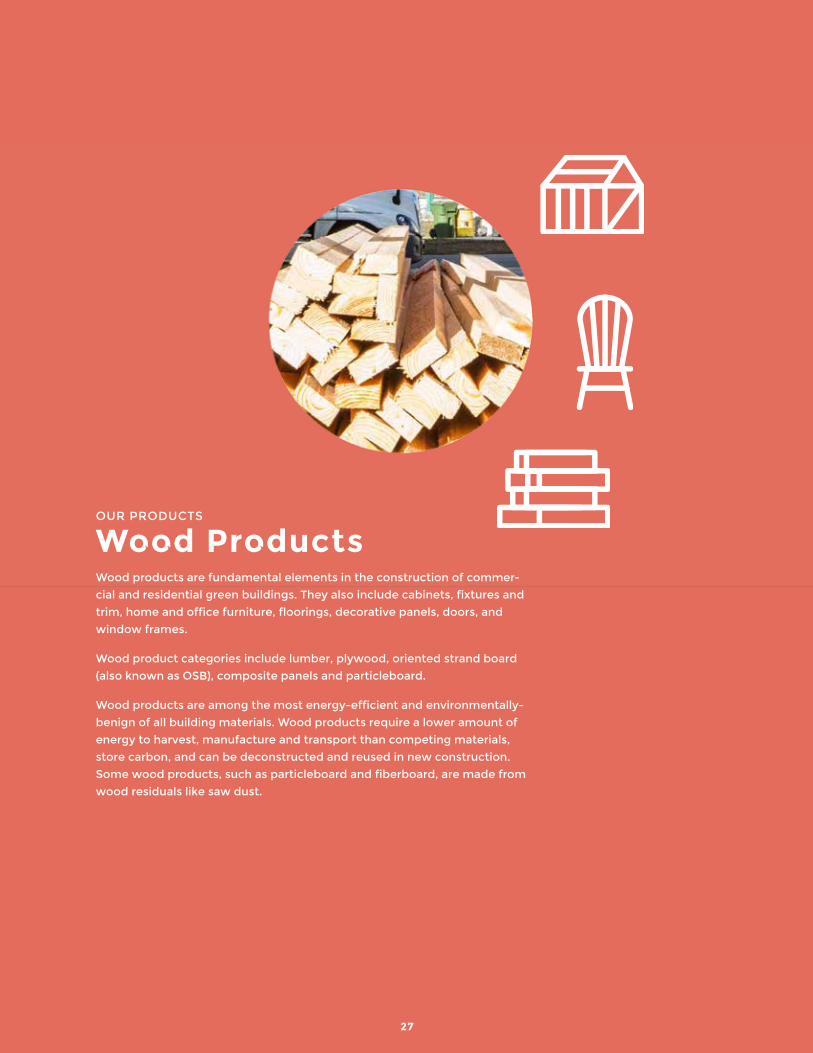
OUR PRODUCTS
Wood ProductsWood products are fundamental elements in the construction of commer-
cial and residential green buildings. They also include cabinets, fixtures and
trim, home and office furniture, floorings, decorative panels, doors, and
window frames.
Wood product categories include lumber, plywood, oriented strand board
(also known as OSB), composite panels and particleboard.
Wood products are among the most energy-efficient and environmentally-
benign of all building materials. Wood products require a lower amount of
energy to harvest, manufacture and transport than competing materials,
store carbon, and can be deconstructed and reused in new construction.
Some wood products, such as particleboard and fiberboard, are made from
wood residuals like saw dust.
27

The AF&PA Sustainability Awards
The annual AF&PA Sustainability Awards are designed to recognize AF&PA members’ exemplary sustainability programs and initiatives. Distributed throughout this report are summaries of member company programs that won awards in 2014 and 2015.
There are two categories of AF&PA Sustainability Awards. Leadership in Sustainability Awards highlight projects that support progress toward the Better Practices, Better Planet 2020 sustain-ability goals in one of five corresponding subcategories: Paper Recovery for Recycling, Energy
Efficiency/Greenhouse Gas Reduction, Sustainable Forest Management, Safety, and Water. Innovation in Sustain-ability Awards showcase projects that merit recognition for their contribution to sustainable business practices, not one of the goals specifically.
2014 INNOVATION IN SUSTAINABILITY AWARD:
Domtar’s BioChoice Lignin
Domtar’s BioChoice Lignin plant produces
new value streams out of existing resources,
offering a timely solution for those looking
to reduce their dependence on fossil fuels.
Domtar leveraged their Plymouth, North
Carolina mill’s existing infrastructure to start a
lignin separation plant – the first of its kind in
North America in over 25 years. Lignin is the
natural glue that holds wood fibers together.
While it is most commonly used as a carbon-
neutral source of fuel, modern technology
allows it to be made into a wide range of
sustainable products, including coatings,
natural binders, plastics and resins.
28


1101 K Street, NW, Suite 700, Washington, D.C. 20005 www.afandpa.org
10% total recycled fiber
http://sustainability.afandpa.org