Embed Size (px)
Citation preview

WP/14/143
Africa Rising:
Harnessing the Demographic Dividend
Paulo Drummond, Vimal Thakoor, and Shu Yu
© 2014 International Monetary Fund WP/14/143
IMF Working Paper
African Department
Africa Rising:
Harnessing the Demographic Dividend
Prepared by Paulo Drummond, Vimal Thakoor, and Shu Yu1
Authorized for distribution by Paolo Mauro
August 2014
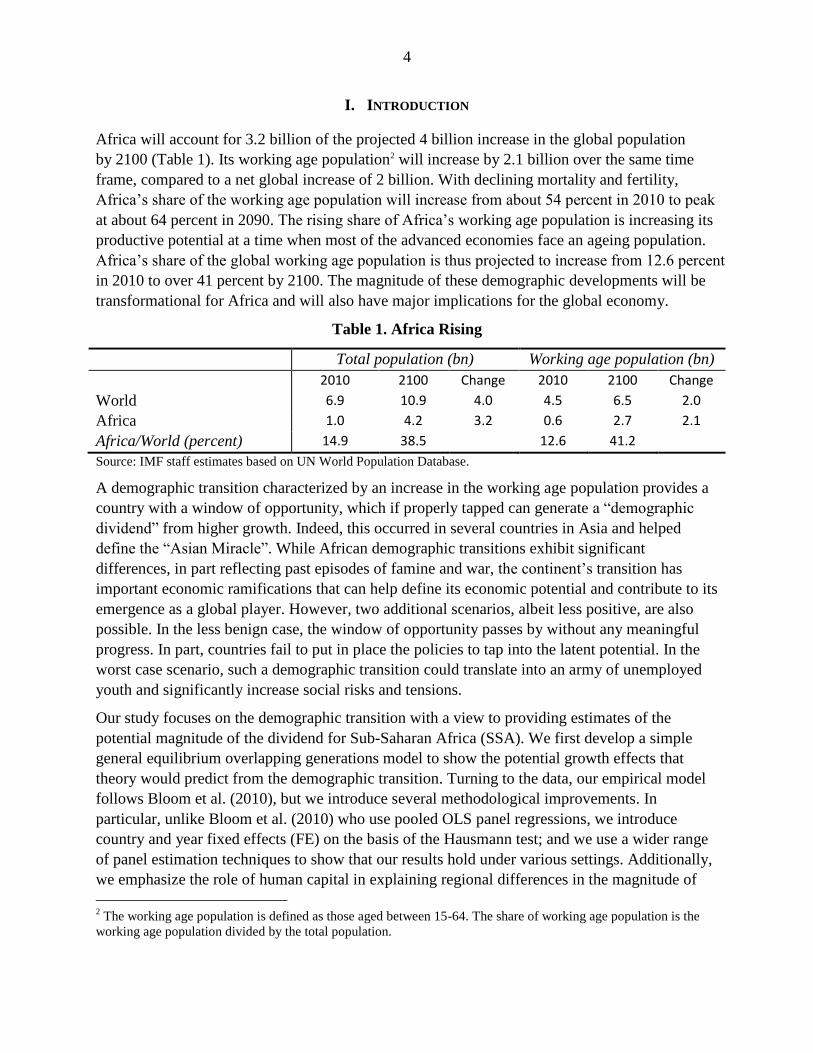
Abstract
Africa will account for 80 percent of the projected 4 billion increase in the global population
by 2100. The accompanying increase in its working age population creates a window of
opportunity, which if properly harnessed, can translate into higher growth and yield a
demographic dividend. We quantify the potential demographic dividend based on the
experience of other regions. The dividend will vary across countries, depending on such
factors as the initial working age population as well as the speed and magnitude of
demographic transition. It will be critical to ensure that the right supportive policies,
including those fostering human capital accumulation and job creation, are in place to
translate this opportunity into concrete economic growth.
JEL Classification Numbers: C23, J11, N17, O11
Keywords: Demographic Dividend, Economic Growth, Sub-Saharan Africa, Panel Estimates
Author’s E-Mail Addresses:[email protected]; [email protected]; [email protected]
1We would like to thank the participants at the AFR Seminar held in September 2013. We also thank Paolo Mauro
for comments which have vastly improved this paper and Roger Nord for general guidance. Fan Yang provided
excellent research assistance.
This Working Paper should not be reported as representing the views of the IMF.
The views expressed in this Working Paper are those of the authors and do not necessarily
represent those of the IMF or IMF policy. Working Papers describe research in progress by the
authors and are published to elicit comments and to further debate.
3
Contents
I. Introduction ............................................................................................................................4
II. A Brief Literature Review .....................................................................................................6
III. Stylized Facts .......................................................................................................................7
IV. An Economic Model of Demographic Transitions ..............................................................9
A. The model .......................................................................................................................9
B. Calibration .....................................................................................................................10
V. Empirical Estimates of Demographic Dividends ................................................................11
A. Methodology .................................................................................................................11
B. Initial Results.................................................................................................................13
C. Regional Differences and the Role of Human Capital ..................................................14
D. Robustness Checks ........................................................................................................16
VI. Estimates of Demographic Dividends for Sub-Saharan Africa .........................................17
VII. Conclusions ......................................................................................................................18
References ................................................................................................................................21
Figures
1. Global trends in working age population ...............................................................................7
2. Evolution of shares of working age population in Sub-Saharan Africa ................................8
3. Diverging experiences in Asia and Latin America: 1965-2010 .............................................9
4. Population growth and output ..............................................................................................11
5. Demographic dividend and development level ....................................................................17
6 (a). GDP growth in median SSA country .............................................................................18
6 (b). Demographic dividend and working age population .....................................................18
Tables
1. Africa rising ...........................................................................................................................4
2. Baseline results for 5-year growth .......................................................................................14
3. Demographic dividends by regions .....................................................................................15
4. Demographic dividends and threshold effects .....................................................................16
Appendix
Table 1: Summary statistics .....................................................................................................19
Table 2: Demographic dividend by regions .............................................................................19
Figure 1: Country specific demographic dividends in peak year ............................................20
4
I. INTRODUCTION
Africa will account for 3.2 billion of the projected 4 billion increase in the global population
by 2100 (Table 1). Its working age population2 will increase by 2.1 billion over the same time
frame, compared to a net global increase of 2 billion. With declining mortality and fertility,
Africa’s share of the working age population will increase from about 54 percent in 2010 to peak
at about 64 percent in 2090. The rising share of Africa’s working age population is increasing its
productive potential at a time when most of the advanced economies face an ageing population.
Africa’s share of the global working age population is thus projected to increase from 12.6 percent
in 2010 to over 41 percent by 2100. The magnitude of these demographic developments will be
transformational for Africa and will also have major implications for the global economy.
Table 1. Africa Rising
Total population (bn) Working age population (bn)
2010 2100 Change 2010 2100 Change
World 6.9 10.9 4.0 4.5 6.5 2.0
Africa 1.0 4.2 3.2 0.6 2.7 2.1
Africa/World (percent) 14.9 38.5 12.6 41.2
Source: IMF staff estimates based on UN World Population Database.
A demographic transition characterized by an increase in the working age population provides a
country with a window of opportunity, which if properly tapped can generate a “demographic
dividend” from higher growth. Indeed, this occurred in several countries in Asia and helped
define the “Asian Miracle”. While African demographic transitions exhibit significant
differences, in part reflecting past episodes of famine and war, the continent’s transition has
important economic ramifications that can help define its economic potential and contribute to its
emergence as a global player. However, two additional scenarios, albeit less positive, are also
possible. In the less benign case, the window of opportunity passes by without any meaningful
progress. In part, countries fail to put in place the policies to tap into the latent potential. In the
worst case scenario, such a demographic transition could translate into an army of unemployed
youth and significantly increase social risks and tensions.
Our study focuses on the demographic transition with a view to providing estimates of the
potential magnitude of the dividend for Sub-Saharan Africa (SSA). We first develop a simple
general equilibrium overlapping generations model to show the potential growth effects that
theory would predict from the demographic transition. Turning to the data, our empirical model
follows Bloom et al. (2010), but we introduce several methodological improvements. In
particular, unlike Bloom et al. (2010) who use pooled OLS panel regressions, we introduce
country and year fixed effects (FE) on the basis of the Hausmann test; and we use a wider range
of panel estimation techniques to show that our results hold under various settings. Additionally,
we emphasize the role of human capital in explaining regional differences in the magnitude of
2 The working age population is defined as those aged between 15-64. The share of working age population is the
working age population divided by the total population.
5
the demographic dividend; we investigate how the pace of transition and its magnitude matter for
growth; and we consider whether any thresholds exist, as regard income and education levels,
and how these matter for the dividend. To sum up, we also provide some initial estimates of the
dividend that African countries can expect as a result of the transition.
We report five main findings:
We confirm the unambiguous impact of demographic transitions on growth. A 1 percentage
point change in the working age population increases real per capita GDP growth by
0.5 percentage point, with the range varying between 0 and 1.1 percentage points
depending on the region. Our results are broadly similar to Bloom et al. (2010).
Both the magnitude and speed of the demographic dividend depend on the country’s initial
level of the working age share and its rate of change, as well as the income level. The faster
the increase in the working age share, the faster the accrual of the demographic dividends.
Investment in human capital is critical to harnessing the demographic dividend. Countries
with higher education levels benefit the most. We confirm the role of the demographic
variables and the contribution of education in explaining the Asian miracle.
Demographic factors contribute significantly to the dividend only up to a certain income
level (around US$5,100 per capita). We suggest this is due to the fact that middle income
countries’ changing economic structures rely less on labor intensive strategies than at lower
income levels. Our results also suggest that low income countries in Africa have the
potential to benefit the most from the nascent demographic transition.
The median African country with an initial per capita income level of around US$550 in
2010 can expect to benefit from a demographic dividend (beyond the growth that would
occur with an unchanged demographic structure) of about US$1,350 by 2100. The resulting
GDP per capita of US$3,865 is higher by about 56 percent compared with a scenario of an
unchanged share of working age population.
Translating Africa’s increased potential from the demographic transition into concrete dividends
will require appropriate policies. A comparison between Asia and Latin America suggest that
economic outcomes can differ significantly for broadly similar transitions. Asia’s more favorable
outcomes have been attributed to a stronger focus on human (education and health) and physical
capital. An initial emphasis on labor-intensive export-led growth created employment
opportunities and supported the transition into sectors with higher total factor productivity.
Increased employment opportunities and higher labor participation rates, including for women,
allowed Asia to maximize the benefits from the increase in labor force.
The paper is organized as follows. Section II reviews the literature. Section III reports stylized
facts. Section IV presents a simple OLG model with varying demographics to motivate the
discussion. Section V provides the estimation strategy. Section VI presents our estimates of
potential demographic dividends. Section VII concludes.
6
II. A BRIEF LITERATURE REVIEW
There is an increasing recognition that beyond a population’s3 overall size, its age structure is
of great economic significance (Williamson and Higgins, 2001; Bloom, Canning, and Sevilla,
2003). Most studies on this topic bring in the life cycle aspects in one form or another: an
increase in the share of the working age population increases the labor supply and growth
potential, thereby contributing to a demographic dividend. The increase in the working age
population can be considered as the outcome of a mechanical process driven by declining
mortality and fertility rates. The increase in working age population and resulting decline in
dependency ratio causes an increase in output, savings, and investment (Lee, 2003; Galor, 2005).
Such a demographic transition is often considered as a key driver of the Asian miracle (Bloom et
al., 2000; Mason, 2001). The fact that the transition is yet to take place in Africa has also been
provided as one of the reasons holding back growth in the region (Bloom and Sachs, 1998;
Bloom et al., 2003).
Galor and Weil (2000) characterize the demographic transition as going through stages. Before
the transition, population growth has a negative impact on economic growth. Once the transition
is underway, higher life expectancy accelerates growth by favoring human capital accumulation
and increasing total factor productivity4. The changing age structure favors savings, higher
female labor force participation, and lower fertility rates (Bloom et al., 2009; Soares and Falcao,
2008). Additionally, with declines in child mortality, children come to be seen as “consumption”
rather than “investment”, and parents prefer fewer children, but place greater emphasis on the
quality of education and health. This increases productivity (Rosenzweig, 1990; Soares, 2005).
Another strand of the literature characterizes demographic transitions as a window of opportunity
to earn a demographic dividend (Carvalho and Wong, 1999; Pool, 2007), if good policies are in
place (Bloom and Canning, 2000). Without proper policies, the increase in working age share
may lead to rising unemployment and fuel economic and social risks (Bloom et al., 2003, 2007;
Lorentzen et al., 2008). Some of the main policy variables considered in the literature include the
quality of governmental institutions, labor market regulation, macroeconomic management,
openness to trade and capital flows, and human capital. Efficiently channeling the savings from
the demographic transition and preparing for an aging population by making good use of pension
assets can also contribute to economic growth.
3 While the Malthusian view provided a dismal prospect for countries with an increasing population due to pressures
on limited resources, others (Kuznets, 1960; Simon, 1987) countered that countries with a growing population were
better able to develop and exploit knowledge, thereby avoiding the poverty trap. 4 Demographic transitions can also have international spillovers. Open economy models increasingly emphasize the
role of international capital flows as a complement to changes in savings behavior and capital accumulation. Ageing
countries with an excess capital can transfer resources to countries experiencing the demographic transition due to
differentials in capital returns (Brooks, 2003).
7
III. STYLIZED FACTS
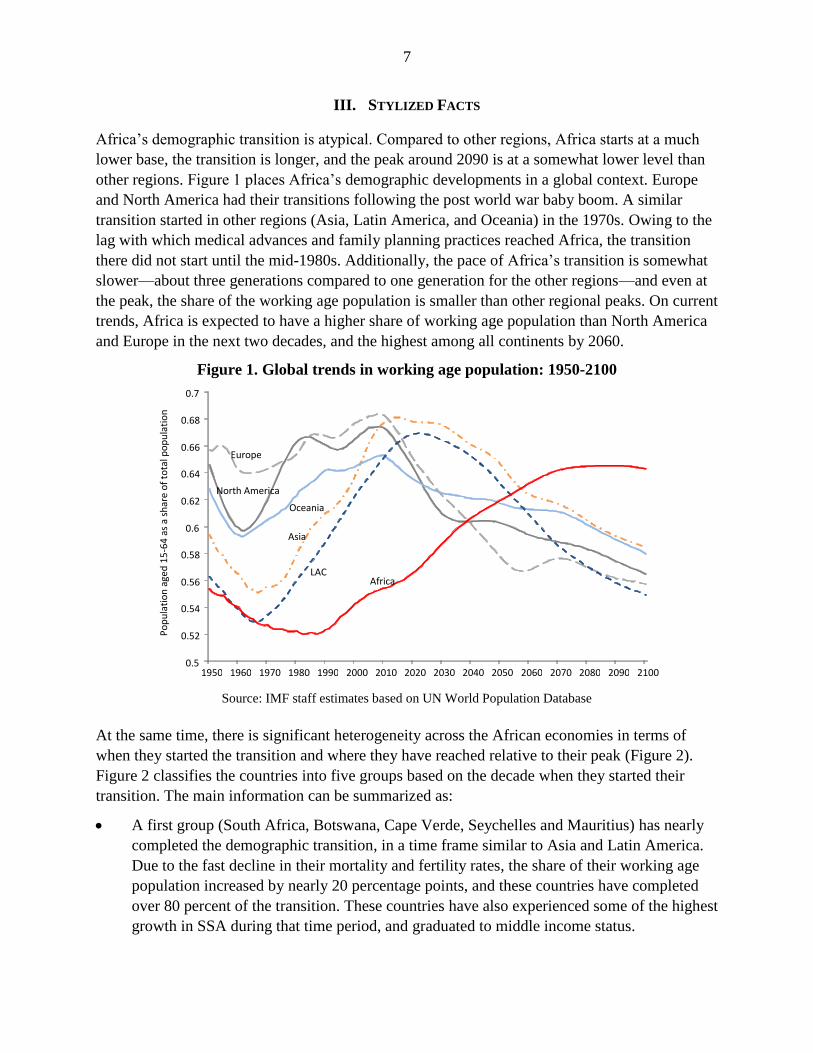
Africa’s demographic transition is atypical. Compared to other regions, Africa starts at a much
lower base, the transition is longer, and the peak around 2090 is at a somewhat lower level than
other regions. Figure 1 places Africa’s demographic developments in a global context. Europe
and North America had their transitions following the post world war baby boom. A similar
transition started in other regions (Asia, Latin America, and Oceania) in the 1970s. Owing to the
lag with which medical advances and family planning practices reached Africa, the transition
there did not start until the mid-1980s. Additionally, the pace of Africa’s transition is somewhat
slower—about three generations compared to one generation for the other regions—and even at
the peak, the share of the working age population is smaller than other regional peaks. On current
trends, Africa is expected to have a higher share of working age population than North America
and Europe in the next two decades, and the highest among all continents by 2060.
Figure 1. Global trends in working age population: 1950-2100
Source: IMF staff estimates based on UN World Population Database
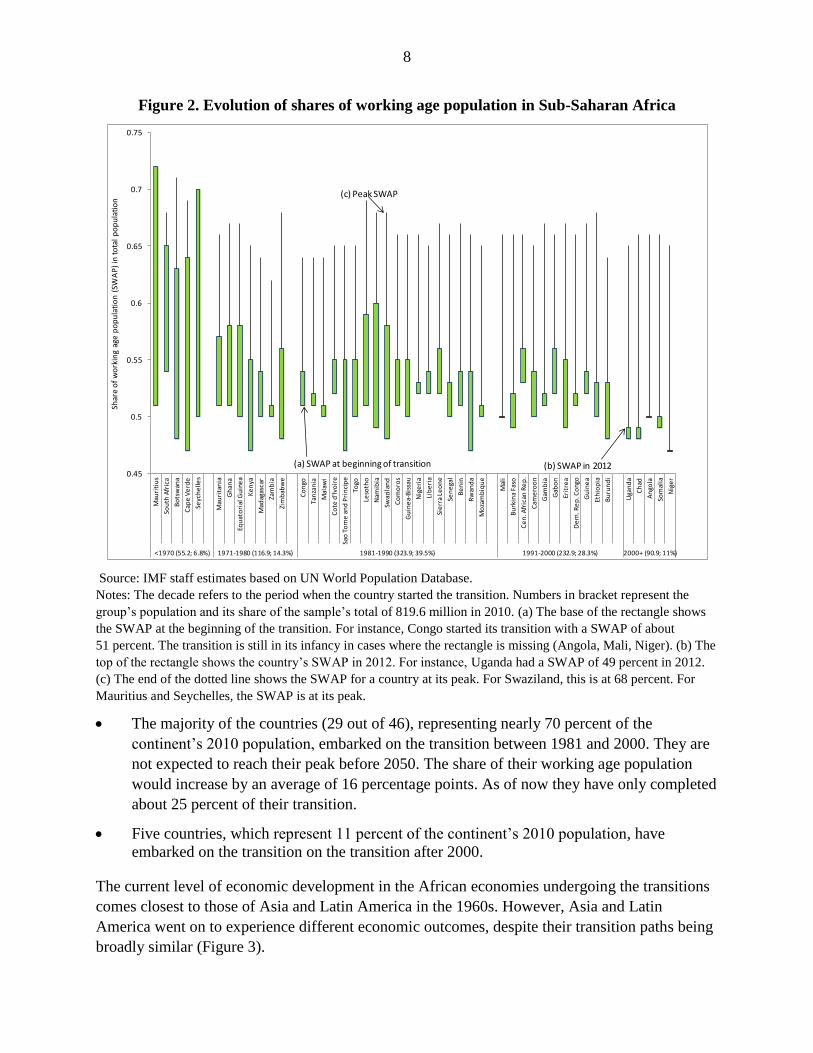
At the same time, there is significant heterogeneity across the African economies in terms of
when they started the transition and where they have reached relative to their peak (Figure 2).
Figure 2 classifies the countries into five groups based on the decade when they started their
transition. The main information can be summarized as:
A first group (South Africa, Botswana, Cape Verde, Seychelles and Mauritius) has nearly
completed the demographic transition, in a time frame similar to Asia and Latin America.
Due to the fast decline in their mortality and fertility rates, the share of their working age
population increased by nearly 20 percentage points, and these countries have completed
over 80 percent of the transition. These countries have also experienced some of the highest
growth in SSA during that time period, and graduated to middle income status.
North America
Europe
Asia
Oceania
LAC Africa
0.5
0.52
0.54
0.56
0.58
0.6
0.62
0.64
0.66
0.68
0.7
1950 1960 1970 1980 1990 2000 2010 2020 2030 2040 2050 2060 2070 2080 2090 2100
Po
pu
lati
on
age
d 1
5-6
4 a
s a
shar
e o
f to
tal p
op
ula
tio
n
8
Figure 2. Evolution of shares of working age population in Sub-Saharan Africa
Source: IMF staff estimates based on UN World Population Database.
Notes: The decade refers to the period when the country started the transition. Numbers in bracket represent the
group’s population and its share of the sample’s total of 819.6 million in 2010. (a) The base of the rectangle shows
the SWAP at the beginning of the transition. For instance, Congo started its transition with a SWAP of about
51 percent. The transition is still in its infancy in cases where the rectangle is missing (Angola, Mali, Niger). (b) The
top of the rectangle shows the country’s SWAP in 2012. For instance, Uganda had a SWAP of 49 percent in 2012.
(c) The end of the dotted line shows the SWAP for a country at its peak. For Swaziland, this is at 68 percent. For
Mauritius and Seychelles, the SWAP is at its peak.
The majority of the countries (29 out of 46), representing nearly 70 percent of the
continent’s 2010 population, embarked on the transition between 1981 and 2000. They are
not expected to reach their peak before 2050. The share of their working age population
would increase by an average of 16 percentage points. As of now they have only completed
about 25 percent of their transition.
Five countries, which represent 11 percent of the continent’s 2010 population, have
embarked on the transition on the transition after 2000.
The current level of economic development in the African economies undergoing the transitions
comes closest to those of Asia and Latin America in the 1960s. However, Asia and Latin
America went on to experience different economic outcomes, despite their transition paths being
broadly similar (Figure 3).
0.45
0.5
0.55
0.6
0.65
0.7
0.75
Mau
riti
us
Sou
th A
fric
a
Bo
tsw
ana
Cap
e V
erd
e
Seyc
he
lles
Mau
rita
nia
Gh
ana
Equ
ato
rial
Gu
ine
a
Ke
nya
Mad
agas
car
Zam
bia
Zim
bab
we
Co
ngo
Tan
zan
ia
Mal
awi
Co
te d
'Ivo
ire
Sao
To
me
an
d P
rin
cip
e
Togo
Leso
tho
Nam
ibia
Swaz
ilan
d
Co
mo
ros
Gu
ine
a-B
issa
u
Nig
eri
a
Lib
eri
a
Sie
rra
Leo
ne
Sen
ega
l
Be
nin
Rw
and
a
Mo
zam
biq
ue
Mal
i
Bu
rkin
a Fa
so
Ce
n. A
fric
an R
ep
.
Cam
ero
on
Gam
bia
Gab
on
Erit
rea
De
m. R
ep
. Co
ngo
Gu
ine
a
Eth
iop
ia
Bu
run
di
Uga
nd
a
Ch
ad
An
gola
Som
alia
Nig
er
<1970 (55.2; 6.8%) 1971-1980 (116.9; 14.3%) 1981-1990 (323.9; 39.5%) 1991-2000 (232.9; 28.3%) 2000+ (90.9; 11%)
Shar
e o
f w
ork
ing
age
po
pu
lati
on
(SW
AP
) in
to
tal
po
pu
lati
on
(c) Peak SWAP
(a) SWAP at beginning of transition (b) SWAP in 2012
9
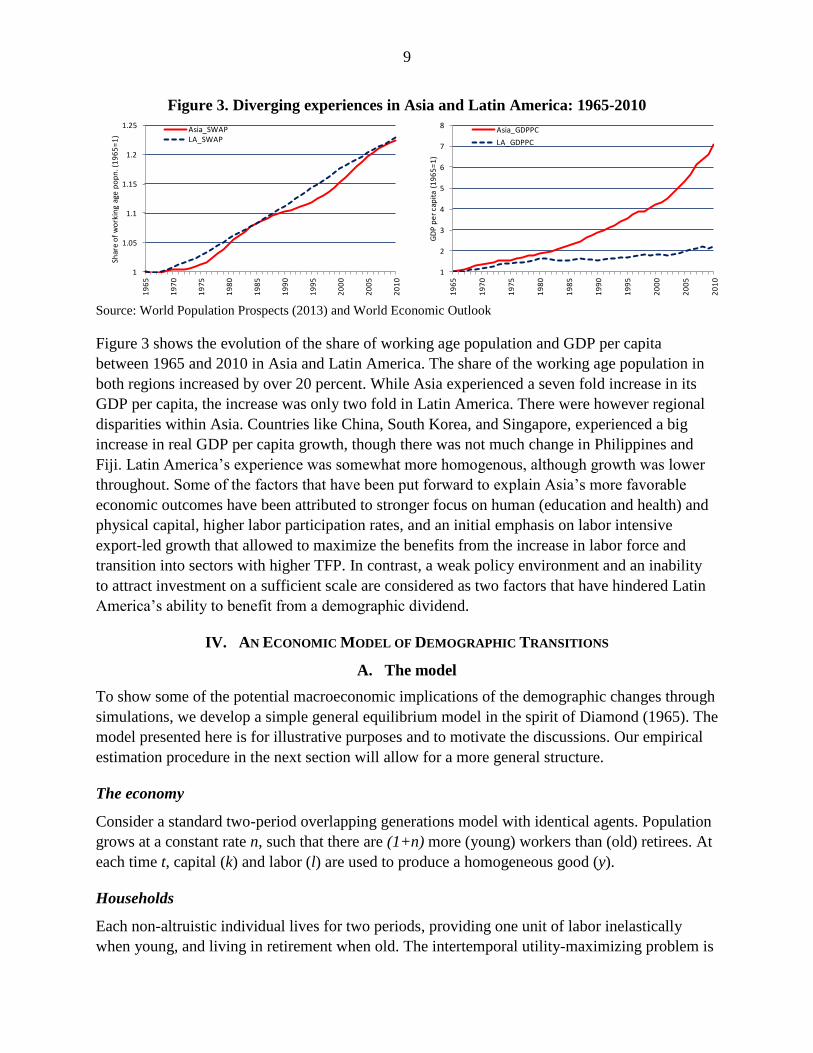
Figure 3. Diverging experiences in Asia and Latin America: 1965-2010
Source: World Population Prospects (2013) and World Economic Outlook
Figure 3 shows the evolution of the share of working age population and GDP per capita
between 1965 and 2010 in Asia and Latin America. The share of the working age population in
both regions increased by over 20 percent. While Asia experienced a seven fold increase in its
GDP per capita, the increase was only two fold in Latin America. There were however regional
disparities within Asia. Countries like China, South Korea, and Singapore, experienced a big
increase in real GDP per capita growth, though there was not much change in Philippines and
Fiji. Latin America’s experience was somewhat more homogenous, although growth was lower
throughout. Some of the factors that have been put forward to explain Asia’s more favorable
economic outcomes have been attributed to stronger focus on human (education and health) and
physical capital, higher labor participation rates, and an initial emphasis on labor intensive
export-led growth that allowed to maximize the benefits from the increase in labor force and
transition into sectors with higher TFP. In contrast, a weak policy environment and an inability
to attract investment on a sufficient scale are considered as two factors that have hindered Latin
America’s ability to benefit from a demographic dividend.
IV. AN ECONOMIC MODEL OF DEMOGRAPHIC TRANSITIONS
A. The model
To show some of the potential macroeconomic implications of the demographic changes through
simulations, we develop a simple general equilibrium model in the spirit of Diamond (1965). The
model presented here is for illustrative purposes and to motivate the discussions. Our empirical
estimation procedure in the next section will allow for a more general structure.
The economy
Consider a standard two-period overlapping generations model with identical agents. Population
grows at a constant rate n, such that there are (1+n) more (young) workers than (old) retirees. At
each time t, capital (k) and labor (l) are used to produce a homogeneous good (y).
Households
Each non-altruistic individual lives for two periods, providing one unit of labor inelastically
when young, and living in retirement when old. The intertemporal utility-maximizing problem is
1
1.05
1.1
1.15
1.2
1.25
19
65
19
70
19
75
19
80
19
85
19
90
19
95
20
00
20
05
20
10
Shar
e o
f w
ork
ing
age
po
pn
. (1
96
5=
1)
Asia_SWAPLA_SWAP
1
2
3
4
5
6
7
8
19
65
19
70
19
75
19
80
19
85
19
90
19
95
20
00
20
05
20
10
GD
P p
er
cap
ita
(19
65
=1
)
Asia_GDPPC
LA_GDPPC

10
taken to be additive and log-linear5. When young, the agents choose the levels of consumption
and savings which maximize their utility; when old, they live off their savings. β is the discount
factor applied to future consumption. Agents maximize utility by maximizing consumption
u (ct , ct+1) subject to their lifetime budget constraints: Max {ct, ct+1, st} u = ln ct + β ln ct+1
subject to: ct = wt – st and ct+1 = Rt+1 st .
Firms
Identical firms competitively produce a homogeneous good using a Cobb Douglas production
function: Y = AKαL
1-α, where α is the share of capital in production. In intensive form (dividing
by L), this production function reduces to: y = A kα.
Firms maximize profit by taking factor prices as given. The labor market clears such that labor
demand equals labor supply. The economy is endowed with an initial capital stock K0 > 0 and
capital depreciates fully from one period to the next. Technology is assumed to be constant. The
interest rate and wages are thus given by R = A α kα-1
and w = A (1– α) kα.
Competitive equilibrium
Given the objectives of the households and the firms, we can define a competitive equilibrium as
a sequence of {Kt, ct , ct+1,Rt, wt}t=0
, where {Rt, wt} t=0
are paid their marginal products,
households maximize their consumption according to the Euler equation, and capital markets
clear (St=Kt+1), while the economy’s resource constraint (y=ct+ct-1/(1+n) +(1+n)kt+1) is always
satisfied.
Given the above definition of competitive equilibrium, the intertemporal budget constraint of the
individual is: ct +ct+1/Rt+1= wt and the Euler equation, which dictates the optimal allocation of
consumption over the two periods of an agent’s lifetime, is: ct+1 = β Rt+1 ct .
The optimal consumption and savings of the agents can then be expressed as: ct = wt /(1+β),
ct+1 = β Rt+1 wt /(1+β), and st = β wt /(1+β).
Given that the savings of the young is converted into capital in the next period, the steady state
capital to labor ratio can then be expressed as: k*= [β(1– α) /(1+β)(1+n)]^[1/(1– α)].
It thus follows that an increase in n leads to a decrease in k*. This in turn will also lead to an
increase in the interest rate, while causing wages to fall. We focus on the effects of the
demographic changes on output in the simulations.
B. Calibration
We calibrate the model to generate an interest rate of around 5 percent per annum (in line with
actual data). We assume one period to equal 30 years and for capital to depreciate fully during
that period. In line with de la Croix and Michel (2002), we assume an initial population growth
5 The choices of the utility and production functions are driven by the ease of analytical tractability and model
predictability. In particular, the two period OLG model with Cobb Douglas technology and log preferences exhibits
a unique and globally stable capital to labor ratio k* for all k > 0.
11
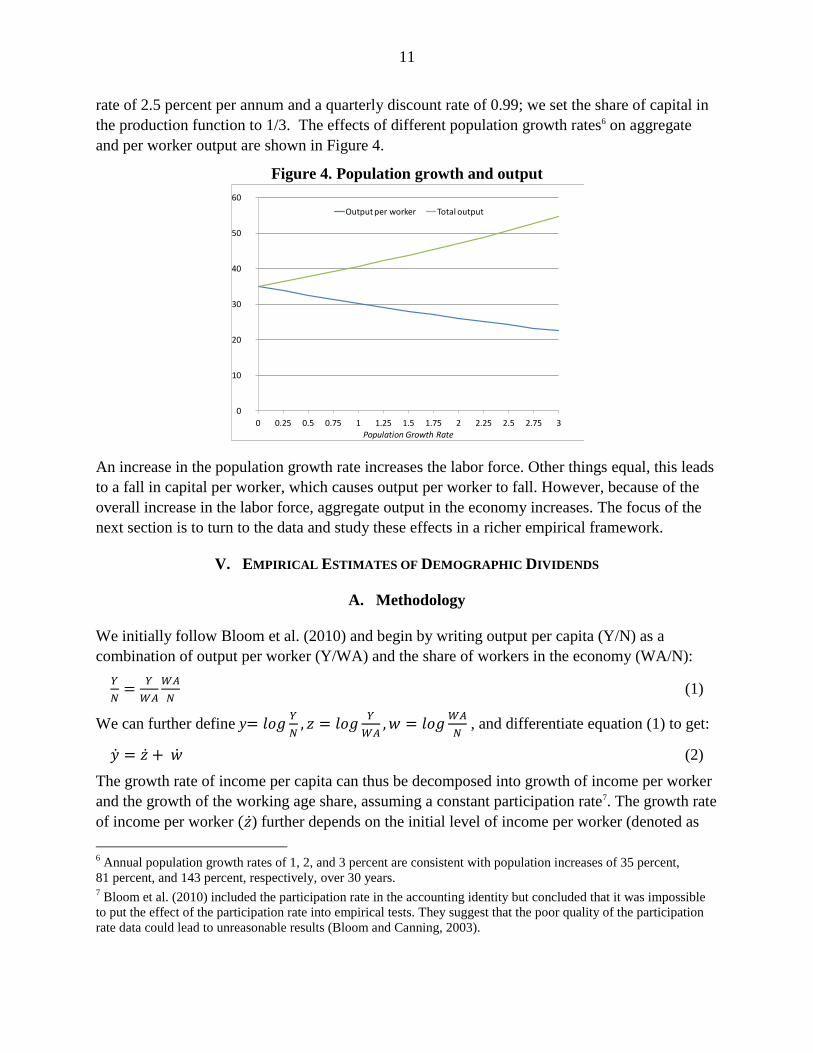
rate of 2.5 percent per annum and a quarterly discount rate of 0.99; we set the share of capital in
the production function to 1/3. The effects of different population growth rates6 on aggregate
and per worker output are shown in Figure 4.
Figure 4. Population growth and output
An increase in the population growth rate increases the labor force. Other things equal, this leads
to a fall in capital per worker, which causes output per worker to fall. However, because of the
overall increase in the labor force, aggregate output in the economy increases. The focus of the
next section is to turn to the data and study these effects in a richer empirical framework.
V. EMPIRICAL ESTIMATES OF DEMOGRAPHIC DIVIDENDS
A. Methodology
We initially follow Bloom et al. (2010) and begin by writing output per capita (Y/N) as a
combination of output per worker (Y/WA) and the share of workers in the economy (WA/N):
(1)
We can further define y
, and differentiate equation (1) to get:
(2)
The growth rate of income per capita can thus be decomposed into growth of income per worker
and the growth of the working age share, assuming a constant participation rate7. The growth rate
of income per worker ) further depends on the initial level of income per worker (denoted as
6 Annual population growth rates of 1, 2, and 3 percent are consistent with population increases of 35 percent,
81 percent, and 143 percent, respectively, over 30 years. 7 Bloom et al. (2010) included the participation rate in the accounting identity but concluded that it was impossible
to put the effect of the participation rate into empirical tests. They suggest that the poor quality of the participation
rate data could lead to unreasonable results (Bloom and Canning, 2003).
0
10
20
30
40
50
60
0 0.25 0.5 0.75 1 1.25 1.5 1.75 2 2.25 2.5 2.75 3
Population Growth Rate
Output per worker Total output
12
and its deviation from the steady-state level of income per worker (denoted as ). By letting
be the convergence speed, the growth rate of income per worker can be expressed as follows:
) (3)
Since the initial level of income per capita, , we have:
(4)
As is determined by a set of variables at the initial level ( , Eq (4) can be rewritten as:
(5)
Eq (5) motivates our empirical model. To explain the growth rate of real GDP per capita, we
include the initial level of the working age share ( ), its growth during the period
( ≡△WAS), the initial GDP level ( , and the set of growth determinants at the beginning of
the period ( We construct a panel of 172 countries that allows us to investigate the impact of
demographic developments on growth. Given the slow dynamic nature of demographic data, we
use 5 yearly data over the period 1960 to 2010. These are sourced from the World Development
Indicators (2012).
We specify our initial empirical model as:
(6)
where i is the country index and t is the period index. is country specific effect while is a
period dummy for time fixed effect. Among the two demographic variables, is the
initial working age share, while is the growth of working age share over the 5-year
period t. To avoid potential endogeneity problems, is taken from one year before
each 5-year period. is a vector of variables that affect the long-run equilibrium. These include
the initial GDP level (to control for convergence), trade openness (ratio of trade over GDP),
investment8 (investment over GDP), and sectoral transformation (share of agriculture in GDP)
among others. All control variables9, except sectoral change, are taken from one year before each
5-year period to ensure that they are predetermined. They will be referred as initial values.
We then depart from Bloom et al. (2010) in three ways. First, we do not include institutional
quality (bureaucratic quality) as this unnecessarily curtails the sample size. Second, education
level as proxied through years of schooling is highly correlated with income levels. Instead, we
use dummy variables to categorize countries by education levels.
We adopt a general to specific approach whereby we gradually drop variables that are not
significant and finally include only significant variables. We also undertake sensitivity tests to
check the robustness of our results. Bloom et al. (2010) used a pooled OLS (POLS). A random
effect (RE) estimator is more efficient than POLS when there is a country-specific effect.
8 The capital stock, such as the initial capital stock per capita (PWT 8.0), has a high correlation with initial GDP and
may lead to biased results due to multicollinearity. 9 The summary statistics are provided in Appendix Table 1.

13
However, given that both the RE and POLS lead to biased estimates when country-specific is
correlated with the explanatory variables, we apply the fixed effect (FE) on the basis of the
Hausmann test. We also include time period dummies in all model specifications to control for
common shocks across all countries within the sample. To account for the possibility that
is influenced by economic growth rate during one period, we also apply system GMM estimator
as a robustness check.
B. Initial Results
The findings are shown in Table 2 and the results are broadly in line with the literature. The
initial results are summarized in column 1. The two demographic factors, the initial size of the
working age group and the change in working age share, have positive impacts on growth and
are significant at the 1 percent level. It suggests that having a large working age population
increases the economy’s productive capacity from the outset. At the same time, a fast growing
working age population further speeds up the growth process. A 1 percentage point change in the
working age population increases real per capita GDP growth by 0.5 percentage point, with the
range varying between 0 and 1.1 percentage points depending on the region10. The initial GDP
per capita has the expected negative sign in line with the conditional convergence effect: more
developed economies have a lower growth rate so that less developed economies catch up. A
shift away from the agriculture sector leads to a higher growth rate.11 We initially include the
initial ratio of investment over GDP, but this variable is eventually dropped as part of the
general-to-specific approach.
To deal with potential endogeneity problems, especially for the sectoral change in agriculture
and , we apply system GMM estimator in column (2). We assume the sectoral change
in agriculture and to be endogenous and the remaining explanatory variables to be
predetermined. The results are largely in line with the FE estimates. They pass the Arellano-
Bond test and the Sargan/Hansen test of over-identification, indicating that the model
specification is appropriate. Both the initial level and remain positive and
significant at 1 percent level. The estimates from system GMM, while close to the estimates
from FE, are slightly higher. Given that GMM could lead to the problem of too many
instruments when there are many explanatory variables12, we maintain the FE results as our
baseline.
Given the perceived importance of human capital in harnessing the demographic dividend, we
include an education level dummy in column (3). Countries are categorized in two groups:
education level below the mean, and otherwise. The overall results remain unchanged, but the
10
The results by region are presented in Appendix Table 2. 11
Using the change in the agriculture sector may lead to endogeneity problem. We also tried the ratio of agricultural
output over GDP in one year before each 5-year period and the results do not change. We follow Bloom et al. (2010)
and use the change rather than initial level. 12
According to Roodman (2009), having many instruments can overfit endogenous variables, fail to expunge their
endogenous components, and bias the resulting coefficient estimates.
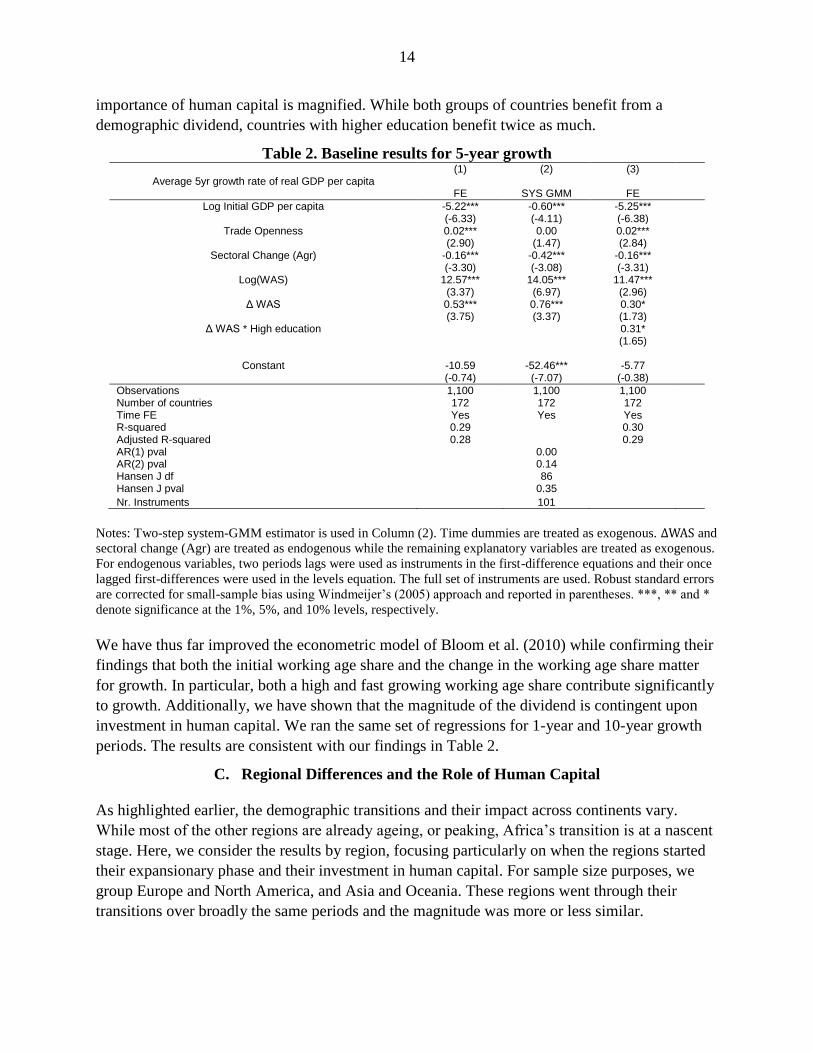
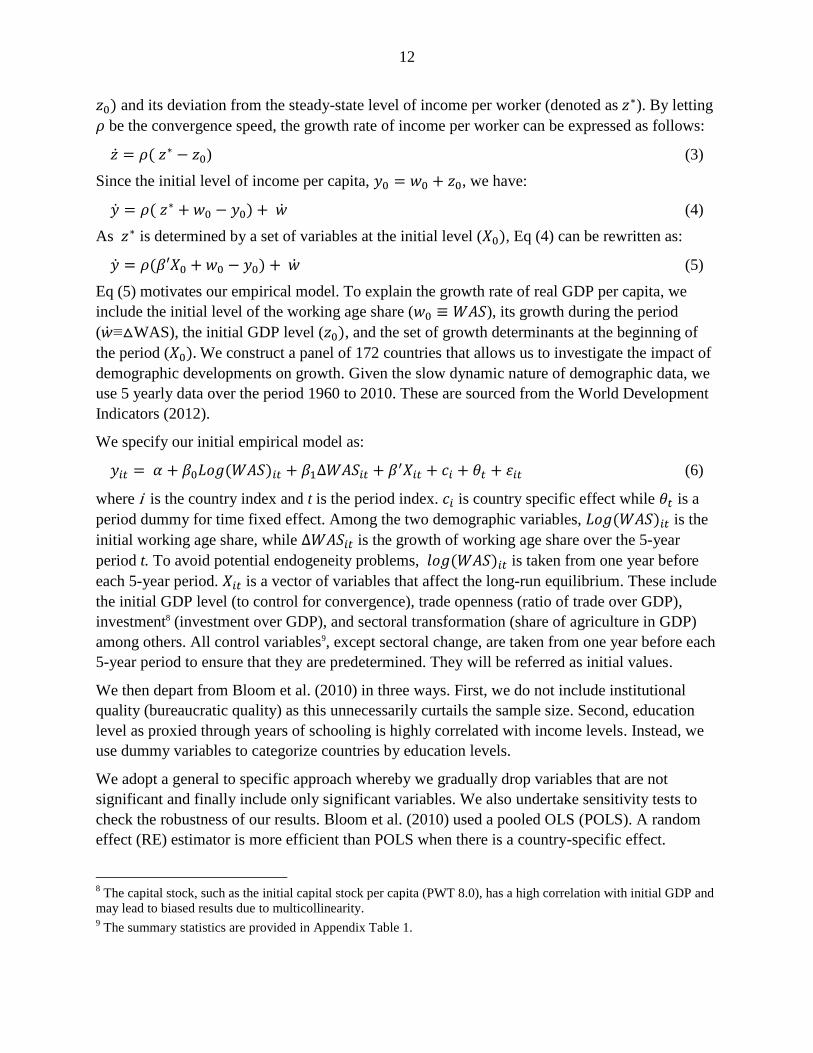
14
importance of human capital is magnified. While both groups of countries benefit from a
demographic dividend, countries with higher education benefit twice as much.
Table 2. Baseline results for 5-year growth (1) (2) (3)
Average 5yr growth rate of real GDP per capita FE SYS GMM
FE
Log Initial GDP per capita -5.22*** -0.60*** -5.25***
(-6.33) (-4.11) (-6.38)
Trade Openness 0.02*** 0.00 0.02***
(2.90) (1.47) (2.84)
Sectoral Change (Agr) -0.16*** -0.42*** -0.16***
(-3.30) (-3.08) (-3.31)
Log(WAS) 12.57*** 14.05*** 11.47***
(3.37) (6.97) (2.96)
Δ WAS 0.53*** 0.76*** 0.30*
(3.75) (3.37) (1.73)
Δ WAS * High education
0.31*
(1.65)
Constant -10.59 -52.46*** -5.77
(-0.74) (-7.07) (-0.38)
Observations 1,100 1,100 1,100 Number of countries 172 172 172 Time FE Yes Yes Yes R-squared 0.29
0.30
Adjusted R-squared 0.28
0.29 AR(1) pval
0.00
AR(2) pval
0.14 Hansen J df
86
Hansen J pval
0.35
Nr. Instruments 101
Notes: Two-step system-GMM estimator is used in Column (2). Time dummies are treated as exogenous. and
sectoral change (Agr) are treated as endogenous while the remaining explanatory variables are treated as exogenous.
For endogenous variables, two periods lags were used as instruments in the first-difference equations and their once
lagged first-differences were used in the levels equation. The full set of instruments are used. Robust standard errors
are corrected for small-sample bias using Windmeijer’s (2005) approach and reported in parentheses. ***, ** and *
denote significance at the 1%, 5%, and 10% levels, respectively.
We have thus far improved the econometric model of Bloom et al. (2010) while confirming their
findings that both the initial working age share and the change in the working age share matter
for growth. In particular, both a high and fast growing working age share contribute significantly
to growth. Additionally, we have shown that the magnitude of the dividend is contingent upon
investment in human capital. We ran the same set of regressions for 1-year and 10-year growth
periods. The results are consistent with our findings in Table 2.
C. Regional Differences and the Role of Human Capital
As highlighted earlier, the demographic transitions and their impact across continents vary.
While most of the other regions are already ageing, or peaking, Africa’s transition is at a nascent
stage. Here, we consider the results by region, focusing particularly on when the regions started
their expansionary phase and their investment in human capital. For sample size purposes, we
group Europe and North America, and Asia and Oceania. These regions went through their
transitions over broadly the same periods and the magnitude was more or less similar.
15
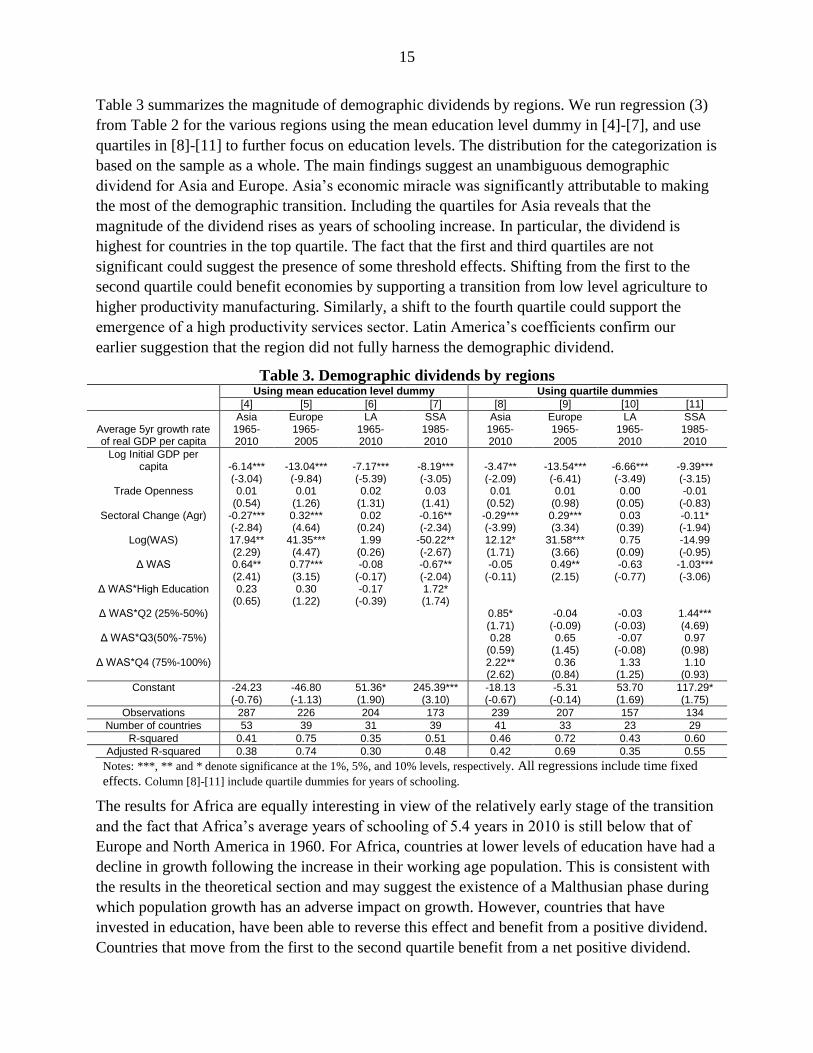
Table 3 summarizes the magnitude of demographic dividends by regions. We run regression (3)
from Table 2 for the various regions using the mean education level dummy in [4]-[7], and use
quartiles in [8]-[11] to further focus on education levels. The distribution for the categorization is
based on the sample as a whole. The main findings suggest an unambiguous demographic
dividend for Asia and Europe. Asia’s economic miracle was significantly attributable to making
the most of the demographic transition. Including the quartiles for Asia reveals that the
magnitude of the dividend rises as years of schooling increase. In particular, the dividend is
highest for countries in the top quartile. The fact that the first and third quartiles are not
significant could suggest the presence of some threshold effects. Shifting from the first to the
second quartile could benefit economies by supporting a transition from low level agriculture to
higher productivity manufacturing. Similarly, a shift to the fourth quartile could support the
emergence of a high productivity services sector. Latin America’s coefficients confirm our
earlier suggestion that the region did not fully harness the demographic dividend.
Table 3. Demographic dividends by regions
Using mean education level dummy Using quartile dummies
[4] [5] [6] [7] [8] [9] [10] [11]
Average 5yr growth rate of real GDP per capita
Asia 1965-2010
Europe 1965-2005
LA 1965-2010
SSA 1985-2010
Asia 1965-2010
Europe 1965-2005
LA 1965-2010
SSA 1985-2010
Log Initial GDP per capita -6.14*** -13.04*** -7.17*** -8.19*** -3.47** -13.54*** -6.66*** -9.39***
(-3.04) (-9.84) (-5.39) (-3.05) (-2.09) (-6.41) (-3.49) (-3.15)
Trade Openness 0.01 0.01 0.02 0.03 0.01 0.01 0.00 -0.01
(0.54) (1.26) (1.31) (1.41) (0.52) (0.98) (0.05) (-0.83)
Sectoral Change (Agr) -0.27*** 0.32*** 0.02 -0.16** -0.29*** 0.29*** 0.03 -0.11*
(-2.84) (4.64) (0.24) (-2.34) (-3.99) (3.34) (0.39) (-1.94)
Log(WAS) 17.94** 41.35*** 1.99 -50.22** 12.12* 31.58*** 0.75 -14.99
(2.29) (4.47) (0.26) (-2.67) (1.71) (3.66) (0.09) (-0.95)
Δ WAS 0.64** 0.77*** -0.08 -0.67** -0.05 0.49** -0.63 -1.03***
(2.41) (3.15) (-0.17) (-2.04) (-0.11) (2.15) (-0.77) (-3.06)
Δ WAS*High Education 0.23 0.30 -0.17 1.72*
(0.65) (1.22) (-0.39) (1.74)
Δ WAS*Q2 (25%-50%)
0.85* -0.04 -0.03 1.44***
(1.71) (-0.09) (-0.03) (4.69)
Δ WAS*Q3(50%-75%)
0.28 0.65 -0.07 0.97
(0.59) (1.45) (-0.08) (0.98)
Δ WAS*Q4 (75%-100%)
2.22** 0.36 1.33 1.10
(2.62) (0.84) (1.25) (0.93)
Constant -24.23 -46.80 51.36* 245.39*** -18.13 -5.31 53.70 117.29*
(-0.76) (-1.13) (1.90) (3.10) (-0.67) (-0.14) (1.69) (1.75)
Observations 287 226 204 173 239 207 157 134
Number of countries 53 39 31 39 41 33 23 29
R-squared 0.41 0.75 0.35 0.51 0.46 0.72 0.43 0.60
Adjusted R-squared 0.38 0.74 0.30 0.48 0.42 0.69 0.35 0.55
Notes: ***, ** and * denote significance at the 1%, 5%, and 10% levels, respectively. All regressions include time fixed
effects. Column [8]-[11] include quartile dummies for years of schooling.
The results for Africa are equally interesting in view of the relatively early stage of the transition
and the fact that Africa’s average years of schooling of 5.4 years in 2010 is still below that of
Europe and North America in 1960. For Africa, countries at lower levels of education have had a
decline in growth following the increase in their working age population. This is consistent with
the results in the theoretical section and may suggest the existence of a Malthusian phase during
which population growth has an adverse impact on growth. However, countries that have
invested in education, have been able to reverse this effect and benefit from a positive dividend.
Countries that move from the first to the second quartile benefit from a net positive dividend.
16
These results are not seen for the other quartiles, probably a reflection that most SSA countries
do not yet fit in those categories in terms of education levels.
The regional results have two significant implications. First, they confirm that for similar
demographic transitions, the final economic outcomes can differ significantly. Second, they
underscore the role of policies in ensuring the translation of potential growth into actual
dividends.
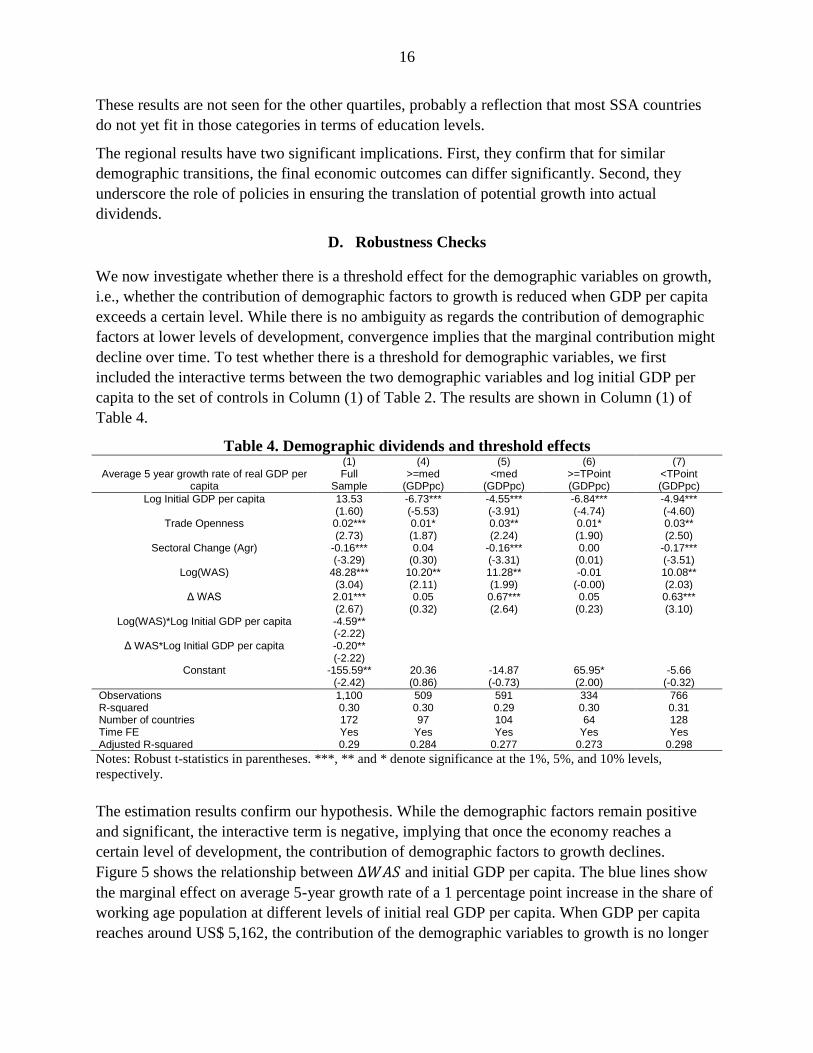
D. Robustness Checks
We now investigate whether there is a threshold effect for the demographic variables on growth,
i.e., whether the contribution of demographic factors to growth is reduced when GDP per capita
exceeds a certain level. While there is no ambiguity as regards the contribution of demographic
factors at lower levels of development, convergence implies that the marginal contribution might
decline over time. To test whether there is a threshold for demographic variables, we first
included the interactive terms between the two demographic variables and log initial GDP per
capita to the set of controls in Column (1) of Table 2. The results are shown in Column (1) of
Table 4.
Table 4. Demographic dividends and threshold effects
(1) (4) (5) (6) (7)
Average 5 year growth rate of real GDP per capita
Full Sample
>=med (GDPpc)
<med (GDPpc)
>=TPoint (GDPpc)
<TPoint (GDPpc)
Log Initial GDP per capita 13.53 -6.73*** -4.55*** -6.84*** -4.94***
(1.60) (-5.53) (-3.91) (-4.74) (-4.60)
Trade Openness 0.02*** 0.01* 0.03** 0.01* 0.03**
(2.73) (1.87) (2.24) (1.90) (2.50)
Sectoral Change (Agr) -0.16*** 0.04 -0.16*** 0.00 -0.17***
(-3.29) (0.30) (-3.31) (0.01) (-3.51)
Log(WAS) 48.28*** 10.20** 11.28** -0.01 10.08**
(3.04) (2.11) (1.99) (-0.00) (2.03)
Δ WAS 2.01*** 0.05 0.67*** 0.05 0.63***
(2.67) (0.32) (2.64) (0.23) (3.10)
Log(WAS)*Log Initial GDP per capita -4.59**
(-2.22)
Δ WAS*Log Initial GDP per capita -0.20**
(-2.22)
Constant -155.59** 20.36 -14.87 65.95* -5.66
(-2.42) (0.86) (-0.73) (2.00) (-0.32)
Observations 1,100 509 591 334 766 R-squared 0.30 0.30 0.29 0.30 0.31 Number of countries 172 97 104 64 128 Time FE Yes Yes Yes Yes Yes Adjusted R-squared 0.29 0.284 0.277 0.273 0.298
Notes: Robust t-statistics in parentheses. ***, ** and * denote significance at the 1%, 5%, and 10% levels,
respectively.
The estimation results confirm our hypothesis. While the demographic factors remain positive
and significant, the interactive term is negative, implying that once the economy reaches a
certain level of development, the contribution of demographic factors to growth declines.
Figure 5 shows the relationship between and initial GDP per capita. The blue lines show
the marginal effect on average 5-year growth rate of a 1 percentage point increase in the share of
working age population at different levels of initial real GDP per capita. When GDP per capita
reaches around US$ 5,162, the contribution of the demographic variables to growth is no longer
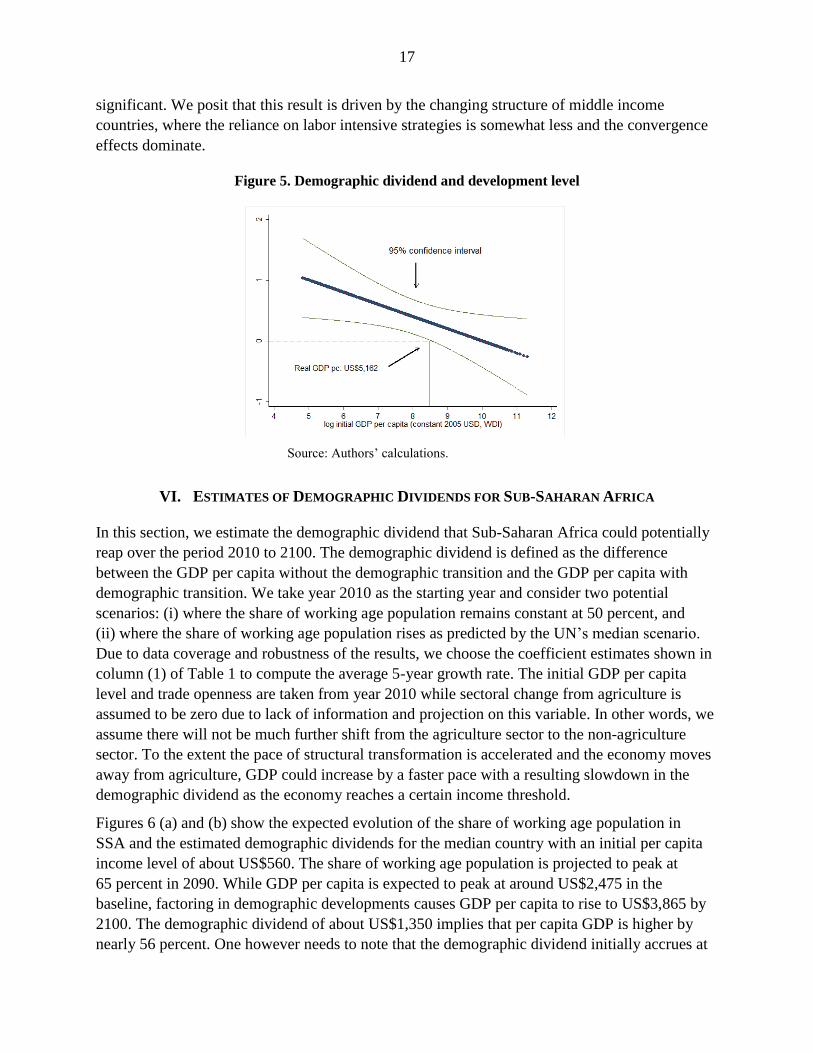
17
significant. We posit that this result is driven by the changing structure of middle income
countries, where the reliance on labor intensive strategies is somewhat less and the convergence
effects dominate.
Figure 5. Demographic dividend and development level
Source: Authors’ calculations.
VI. ESTIMATES OF DEMOGRAPHIC DIVIDENDS FOR SUB-SAHARAN AFRICA
In this section, we estimate the demographic dividend that Sub-Saharan Africa could potentially
reap over the period 2010 to 2100. The demographic dividend is defined as the difference
between the GDP per capita without the demographic transition and the GDP per capita with
demographic transition. We take year 2010 as the starting year and consider two potential
scenarios: (i) where the share of working age population remains constant at 50 percent, and
(ii) where the share of working age population rises as predicted by the UN’s median scenario.
Due to data coverage and robustness of the results, we choose the coefficient estimates shown in
column (1) of Table 1 to compute the average 5-year growth rate. The initial GDP per capita
level and trade openness are taken from year 2010 while sectoral change from agriculture is
assumed to be zero due to lack of information and projection on this variable. In other words, we
assume there will not be much further shift from the agriculture sector to the non-agriculture
sector. To the extent the pace of structural transformation is accelerated and the economy moves
away from agriculture, GDP could increase by a faster pace with a resulting slowdown in the
demographic dividend as the economy reaches a certain income threshold.
Figures 6 (a) and (b) show the expected evolution of the share of working age population in
SSA and the estimated demographic dividends for the median country with an initial per capita
income level of about US$560. The share of working age population is projected to peak at
65 percent in 2090. While GDP per capita is expected to peak at around US$2,475 in the
baseline, factoring in demographic developments causes GDP per capita to rise to US$3,865 by
2100. The demographic dividend of about US$1,350 implies that per capita GDP is higher by
nearly 56 percent. One however needs to note that the demographic dividend initially accrues at
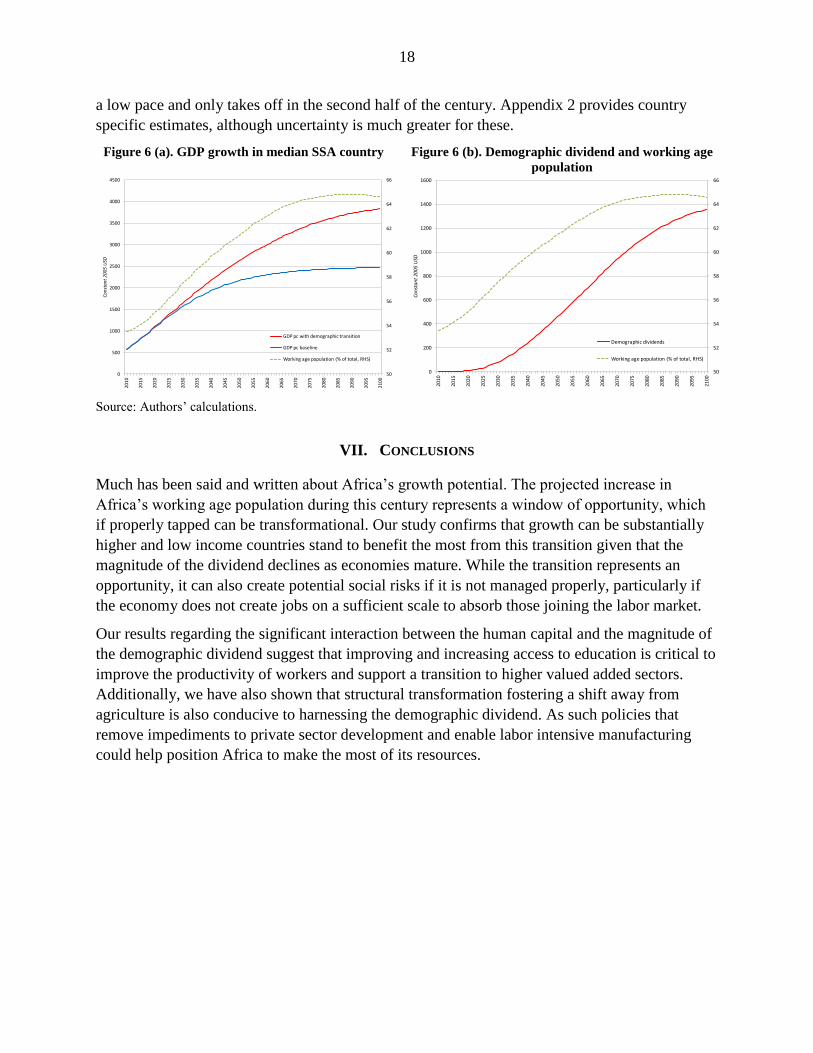
18
a low pace and only takes off in the second half of the century. Appendix 2 provides country
specific estimates, although uncertainty is much greater for these.
Figure 6 (a). GDP growth in median SSA country Figure 6 (b). Demographic dividend and working age
population
Source: Authors’ calculations.
VII. CONCLUSIONS
Much has been said and written about Africa’s growth potential. The projected increase in
Africa’s working age population during this century represents a window of opportunity, which
if properly tapped can be transformational. Our study confirms that growth can be substantially
higher and low income countries stand to benefit the most from this transition given that the
magnitude of the dividend declines as economies mature. While the transition represents an
opportunity, it can also create potential social risks if it is not managed properly, particularly if
the economy does not create jobs on a sufficient scale to absorb those joining the labor market.
Our results regarding the significant interaction between the human capital and the magnitude of
the demographic dividend suggest that improving and increasing access to education is critical to
improve the productivity of workers and support a transition to higher valued added sectors.
Additionally, we have also shown that structural transformation fostering a shift away from
agriculture is also conducive to harnessing the demographic dividend. As such policies that
remove impediments to private sector development and enable labor intensive manufacturing
could help position Africa to make the most of its resources.
50
52
54
56
58
60
62
64
66
0
500
1000
1500
2000
2500
3000
3500
4000
4500
2010
2015
2020
2025
2030
2035
2040
2045
2050
2055
2060
2065
2070
2075
2080
2085
2090
2095
2100
Cons
tant
200
5 U
SD
GDP pc with demographic transition
GDP pc baseline
Working age population (% of total, RHS)
50
52
54
56
58
60
62
64
66
0
200
400
600
800
1000
1200
1400
1600
2010
2015
2020
2025
2030
2035
2040
2045
2050
2055
2060
2065
2070
2075
2080
2085
2090
2095
2100
Cons
tant
200
5 U
SD
Demographic dividends
Working age population (% of total, RHS)
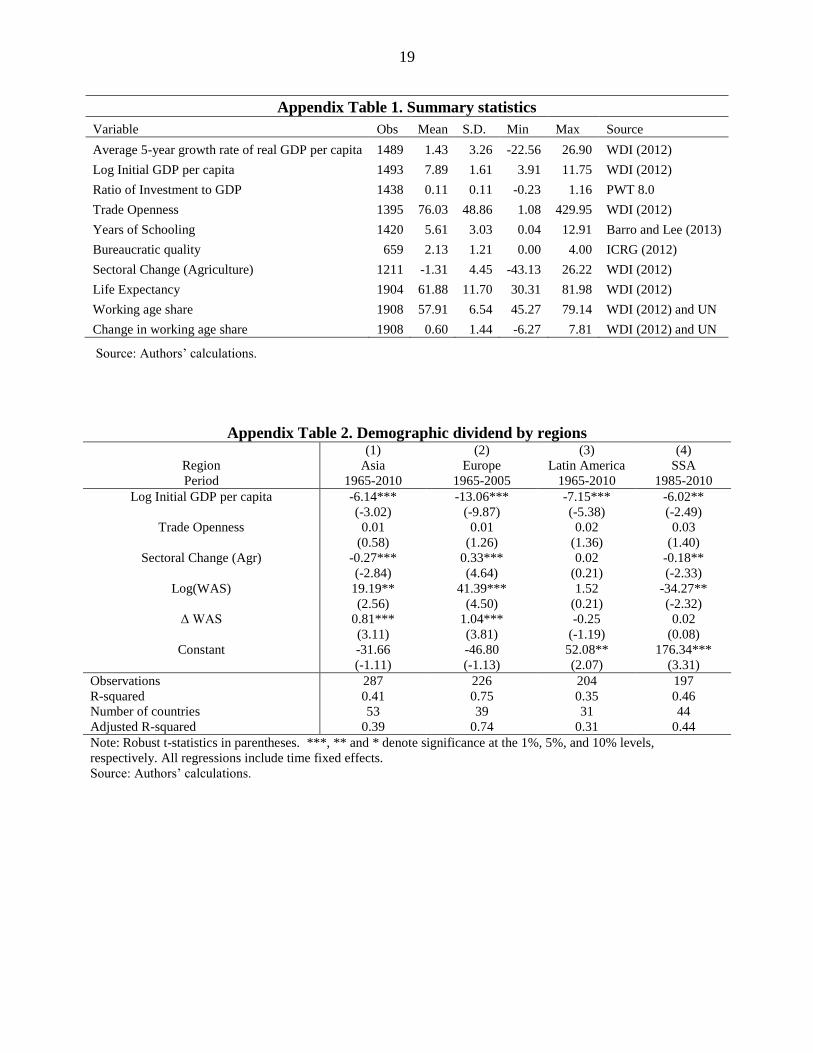
19
Appendix Table 1. Summary statistics
Variable Obs Mean S.D. Min Max Source
Average 5-year growth rate of real GDP per capita 1489 1.43 3.26 -22.56 26.90 WDI (2012)
Log Initial GDP per capita 1493 7.89 1.61 3.91 11.75 WDI (2012)
Ratio of Investment to GDP 1438 0.11 0.11 -0.23 1.16 PWT 8.0
Trade Openness 1395 76.03 48.86 1.08 429.95 WDI (2012)
Years of Schooling 1420 5.61 3.03 0.04 12.91 Barro and Lee (2013)
Bureaucratic quality 659 2.13 1.21 0.00 4.00 ICRG (2012)
Sectoral Change (Agriculture) 1211 -1.31 4.45 -43.13 26.22 WDI (2012)
Life Expectancy 1904 61.88 11.70 30.31 81.98 WDI (2012)
Working age share 1908 57.91 6.54 45.27 79.14 WDI (2012) and UN
Change in working age share 1908 0.60 1.44 -6.27 7.81 WDI (2012) and UN
Source: Authors’ calculations.
Appendix Table 2. Demographic dividend by regions
(1) (2) (3) (4)
Region Asia Europe Latin America SSA
Period 1965-2010 1965-2005 1965-2010 1985-2010
Log Initial GDP per capita -6.14*** -13.06*** -7.15*** -6.02**
(-3.02) (-9.87) (-5.38) (-2.49)
Trade Openness 0.01 0.01 0.02 0.03
(0.58) (1.26) (1.36) (1.40)
Sectoral Change (Agr) -0.27*** 0.33*** 0.02 -0.18**
(-2.84) (4.64) (0.21) (-2.33)
Log(WAS) 19.19** 41.39*** 1.52 -34.27**
(2.56) (4.50) (0.21) (-2.32)
Δ WAS 0.81*** 1.04*** -0.25 0.02
(3.11) (3.81) (-1.19) (0.08)
Constant -31.66 -46.80 52.08** 176.34***
(-1.11) (-1.13) (2.07) (3.31)
Observations 287 226 204 197
R-squared 0.41 0.75 0.35 0.46
Number of countries 53 39 31 44
Adjusted R-squared 0.39 0.74 0.31 0.44
Note: Robust t-statistics in parentheses. ***, ** and * denote significance at the 1%, 5%, and 10% levels,
respectively. All regressions include time fixed effects.
Source: Authors’ calculations.
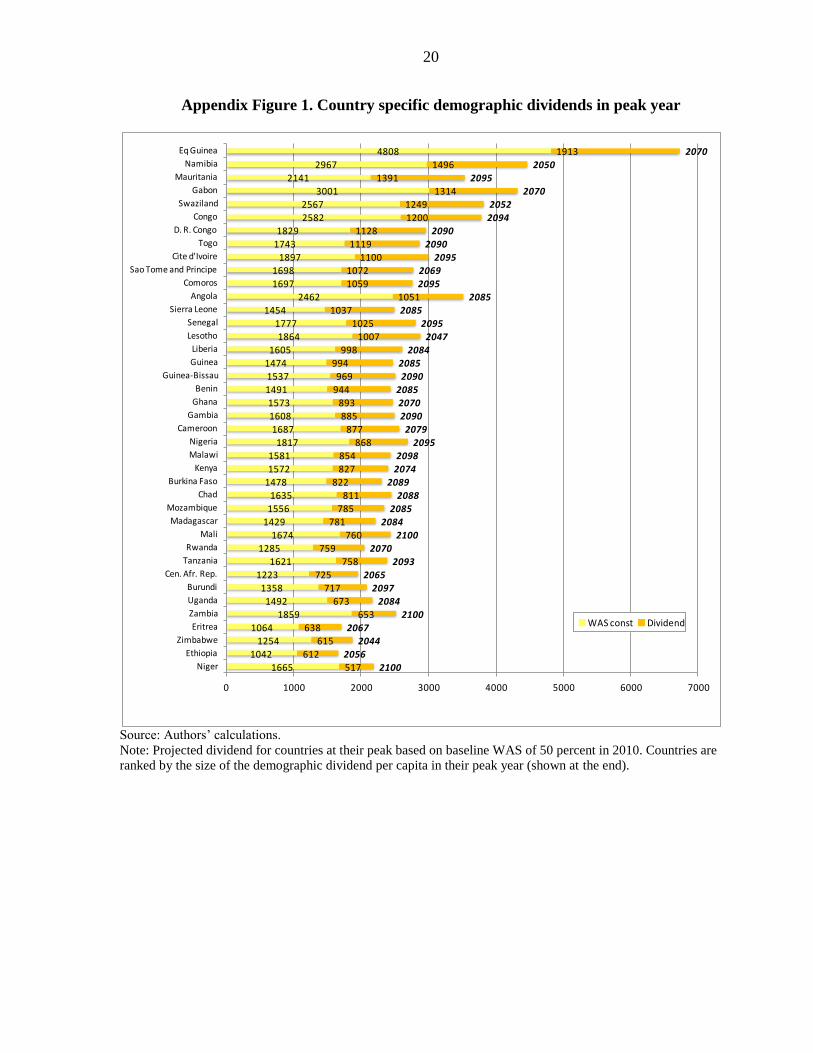
20
Appendix Figure 1. Country specific demographic dividends in peak year
Source: Authors’ calculations. Note: Projected dividend for countries at their peak based on baseline WAS of 50 percent in 2010. Countries are
ranked by the size of the demographic dividend per capita in their peak year (shown at the end).
1665
1042
1254
1064
1859
1492
1358
1223
1621
1285
1674
1429
1556
1635
1478
1572
1581
1817
1687
1608
1573
1491
1537
1474
1605
1864
1777
1454
2462
1697
1698
1897
1743
1829
2582
2567
3001
2141
2967
4808
517
612
615
638
653
673
717
725
758
759
760
781
785
811
822
827
854
868
877
885
893
944
969
994
998
1007
1025
1037
1051
1059
1072
1100
1119
1128
1200
1249
1314
1391
1496
1913
2100
2056
2044
2067
2100
2084
2097
2065
2093
2070
2100
2084
2085
2088
2089
2074
2098
2095
2079
2090
2070
2085
2090
2085
2084
2047
2095
2085
2085
2095
2069
2095
2090
2090
2094
2052
2070
2095
2050
2070
0 1000 2000 3000 4000 5000 6000 7000
Niger
Ethiopia
Zimbabwe
Eritrea
Zambia
Uganda
Burundi
Cen. Afr. Rep.
Tanzania
Rwanda
Mali
Madagascar
Mozambique
Chad
Burkina Faso
Kenya
Malawi
Nigeria
Cameroon
Gambia
Ghana
Benin
Guinea-Bissau
Guinea
Liberia
Lesotho
Senegal
Sierra Leone
Angola
Comoros
Sao Tome and Principe
Cìte d'Ivoire
Togo
D. R. Congo
Congo
Swaziland
Gabon
Mauritania
Namibia
Eq Guinea
WAS const Dividend
References
Barro, Robert, and Jong-Wha Lee (2013), "A New Data Set of Educational Attainment in the
World, 1950-2010." Journal of Development Economics, 104, 184-198.
Bloom David E., and J. D. Sachs (1998). “Geography, Demography, and Economic Growth
in Africa,” Brookings Papers on Economic Activity, 2, 207–295.
Bloom, David E., and Canning, D. (2000). “The Health and Wealth of Nations,” Science,
287, 1207–1209.
Bloom, David E., and David Canning, and Pia N. Malaney (2000). “Population Dynamics
and Economic Growth in Asia,” Population and Development Review, 26, 257-290.
Bloom, David E., and David Canning (2003). “Contraception and the Celtic tiger”. The
Economic and Social Review, 34, 229–247.
Bloom, David E., David Canning and Jaypee Sevilla (2003). “The Demographic Dividend: A
New Perspective on the Economic Consequences of Population Change”, RAND.
Bloom, David E., David Canning, Gunther Fink, and Jocelyn Finlay (2007). “Realizing the
Demographic Dividend: Is Africa any different?”, PGDA Working Paper No. 23.
Bloom, David E., David Canning, Guenther Fink and Jocelyn E. Finlay (2009). “Fertility,
Female Labor Force Participation, and the Demographic Dividend,” Journal of
Economic Growth, 14(2), 79-101.
Bloom, David E., David Canning, Linlin Hu, Yuanli Liu, Ajay Mahal, Winnie Yip (2010).
“The contribution of population health and demographic change to economic growth
in China and India”, Journal of Comparative Economics, 38, 17–33
Brooks, R. (2003), “Population Aging and Global Capital Flows in a Parallel Universe,” IMF
Staff Papers, 50 (2), 200-221.
De Carvalho, J., and L. Wong (1999). “Demographic and Socioeconomic Implications of
Rapid Fertility Decline in Brazil: A Window of Opportunity,” in Reproductive
Change in India and Brazil, 208-240, eds. by Martine, G., Das Gupta, M. and L.,
Chen. Oxford: Oxford University Press.
De la Croix, D., and Michel, P., (2002). A Theory of Economic Growth: Dynamics and
Policy in Overlapping Generations. Cambridge University Press, Cambridge
Diamond, Peter (1965), “National Debt in a Neoclassical Growth Model”, American
Economic Review, 55(5), 1126-1150.
Galor, O. (2005). “From Stagnation to Growth: Unified Growth Theory,” in Handbook of
Economic Growth, eds. by P. Aghion, and S. Durlauf, Chapter 4, Elsevier Science
B.V., Amsterdam.
Galor, O., and D. N. Weil (2000). “Population, Technology and Growth: From the
Malthusian Regime to the Demographic Transition,” American Economic Review,
110, 806-828.
22
Kuznets, S. (1960). "Population Change and Aggregate Output," NBER Chapters, in:
Demographic and Economic Change in Developed Countries, pages 324-351
National Bureau of Economic Research, Inc.
Lee, R. (2003). “The Demographic Transition: Three Centuries of Fundamental Change,”
Journal of Economic Perspectives, 17(4), 167-190.
Lorentzen, P., and J. McMillan, and R. Wacziarg (2008). "Death and development," Journal
of Economic Growth, 13(2), 81-124.
Mason, Andrew (2001). "Population, Capital, and Labor," in Population Change and
Economic Development in East Asia: Challenges Met, Opportunities Seized, eds. by
Mason A., Chapter 8, Stanford: Stanford University Press.
Pool, I. (2007). “Demographic Dividends: Determinants of Development or Merely
Windows of Opportunity,” Ageing Horizons, 7, 28-35.
Roodman, D. (2009). "How to do xtabond2: An introduction to difference and system GMM
in Stata," Stata Journal, StataCorp LP, 9(1), 86-136.
Rosenzweig, Mark R. (1990). "Population Growth and Human Capital Investments: Theory
and Evidence," Journal of Political Economy, 98(5), 38-70.
Simon, B. (1987). “Systematization and Segmentation in Education: the Case of England,” in
The Rise of the Modern Educational System, eds. by Muller, D., Ringer, F., and
Simon, B. Cambridge University Press, Cambridge, MA.
Soares, R. R. (2005). “Mortality Reductions, Educational Attainment, and Fertility Choice,”
American Economic Review, 95(3), 580-601.
Soares, Rodrigo R., and Bruno L. S. Falcao (2008). "The Demographic Transition and the
Sexual Division of Labor," Journal of Political Economy, 116(6), 1058-1104.
Williamson, J.G., and M. Higgins (2001). “The Accumulation and Demography Connection
in East Asia,” in Population Change and Economic Development in East Asia:
Challenges Met, Opportunities Seized, eds. by Mason A., Chapter 5, Stanford:
Stanford University Press.
Windmeijer, F. (2005). "A finite sample correction for the variance of linear efficient two-
step GMM estimators," Journal of Econometrics, 126(1), 25-51.