Embed Size (px)
Citation preview

African American Reading CRCTNumber of Students
3rd Grade 4th Grade 5th Grade 0
5
10
15
20
25
41
4
11
8
16
5
5
1
Exceeds Meets Does Not Meet

African American ELA CRCTNumber of Students
3rd Grade 4th Grade 5th Grade 0
5
10
15
20
25
41 2
15
7
16
1
6
3
Exceeds Meets Does Not Meet

African American Math CRCTNumber of Students
3rd Grade 4th Grade 5th Grade 0
5
10
15
20
25
6
2 1
9
7
13
5
5
7
Exceeds Meets Does Not Meet

African American Science CRCTNumber of Students
3rd Grade 4th Grade 5th Grade 0
5
10
15
20
25
6
2
6
10
7
11
4
5
4
Exceeds Meets Does Not Meet

African American Social Studies CRCTNumber of Students
3rd Grade 4th Grade 5th Grade 0
5
10
15
20
25
52
7
13
10
14
3
2
0
Exceeds Meets Does Not Meet

Multi Racial Reading CRCTNumber of Students
3rd Grade 4th Grade 5th Grade 0
1
2
3
4
5
6
7
8
9
10
4
0
3
7
02
Exceeds Meets Does Not Meet

Multi Racial ELA CRCTNumber of Students
3rd Grade 4th Grade 5th Grade 0
1
2
3
4
5
6
7
8
9
10
4
0
3
7
02
Exceeds Meets Does Not Meet

Multi Racial Math CRCTNumber of Students
3rd Grade 4th Grade 5th Grade 0
1
2
3
4
5
6
7
8
9
10
3
0
37
1
2
Exceeds Meets Does Not Meet

Multi Racial Science CRCTNumber of Students
3rd Grade 4th Grade 5th Grade 0
1
2
3
4
5
6
7
8
9
10
4
1
3
6
02
Exceeds Meets Does Not Meet

Multi Racial Social Studies CRCTNumber of Students
3rd Grade 4th Grade 5th Grade 0
1
2
3
4
5
6
7
8
9
10
4
0
3
6
03
Exceeds Meets Does Not Meet

Hispanic Reading CRCTNumber of Students
3rd Grade 4th Grade 5th Grade 0
1
2
3
4
5
6
7
8
9
24
1
2
3
4
1
1
1Exceeds Meets Does Not Meet

Hispanic ELA CRCTNumber of Students
3rd Grade 4th Grade 5th Grade 0
1
2
3
4
5
6
7
8
9
3 32
1
4
2
1
1
2 Exceeds Meets Does Not Meet

Hispanic Math CRCTNumber of Students
3rd Grade 4th Grade 5th Grade 0
1
2
3
4
5
6
7
8
9
3 32
1
4
2
1
1
2 Exceeds Meets Does Not Meet

Hispanic Science CRCTNumber of Students
3rd Grade 4th Grade 5th Grade 0
1
2
3
4
5
6
7
8
9
35
3
1
2
11
1
2 Exceeds Meets Does Not Meet

Hispanic Social Studies CRCTNumber of Students
3rd Grade 4th Grade 5th Grade 0
1
2
3
4
5
6
7
8
9
2 23
2
52
1
1
1Exceeds Meets Does Not Meet

White Reading CRCTNumber of Students
3rd Grade 4th Grade 5th Grade 0
10
20
30
40
50
60
70
80
90
100
12 6 5
4037
62
32 44
24
Exceeds Meets Does Not Meet

White ELA CRCTNumber of Students
3rd Grade 4th Grade 5th Grade 0
10
20
30
40
50
60
70
80
90
100
15 6 6
4853 52
21 28 33
Exceeds Meets Does Not Meet

White Math CRCTNumber of Students
3rd Grade 4th Grade 5th Grade 0
10
20
30
40
50
60
70
80
90
100
2210 8
2931 37
34 46 46
Exceeds Meets Does Not Meet

White Science CRCTNumber of Students
3rd Grade 4th Grade 5th Grade 0
10
20
30
40
50
60
70
80
90
100
19 11 12
38
2032
2856
47
Exceeds Meets Does Not Meet

White Social Studies CRCTNumber of Students
3rd Grade 4th Grade 5th Grade 0
10
20
30
40
50
60
70
80
90
100
13 17 11
3746 60
3524
20
Exceeds Meets Does Not Meet
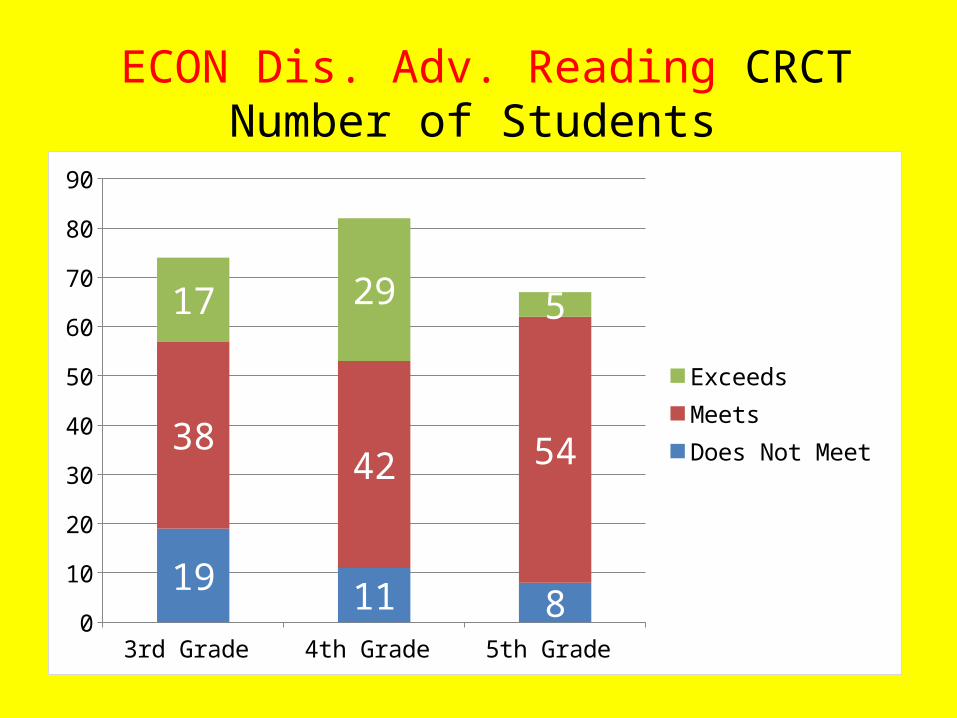
ECON Dis. Adv. Reading CRCTNumber of Students
3rd Grade 4th Grade 5th Grade 0
10
20
30
40
50
60
70
80
90
19 11 8
3842 54
17 29 5
Exceeds Meets Does Not Meet

ECON Dis. Adv. ELA CRCTNumber of Students
3rd Grade 4th Grade 5th Grade 0
10
20
30
40
50
60
70
80
90
219 8
4451 46
9 2213
Exceeds Meets Does Not Meet

ECON Dis. Adv. Math CRCTNumber of Students
3rd Grade 4th Grade 5th Grade 0
10
20
30
40
50
60
70
80
90
2813 7
2242
38
2427
22Exceeds Meets Does Not Meet

ECON Dis. Adv. Science CRCTNumber of Students
3rd Grade 4th Grade 5th Grade 0
10
20
30
40
50
60
70
80
90
2617 15
34
26 25
1439
27Exceeds Meets Does Not Meet

ECON Dis. Adv. Social Studies CRCTNumber of Students
3rd Grade 4th Grade 5th Grade 0
10
20
30
40
50
60
70
80
90
19 17 15
3851
46
1714
6
Exceeds Meets Does Not Meet

Total number of students by ethnicity per grade
Ethnicity 3rd Grade 4th Grade 5th Grade White 85 87 91Multi 7 9
Hispanic 5 8 6African
American 20 14 21
SWD 15 14 11EIP 17 14 6

Second Grade Pre and Post Test DataELA/Reading Math
Pre Test Post Test Pre Test Post Test
Unit 1
Unit 2
Unit 3
Unit 4
Unit 5
Unit 6
End of year Totals

First Grade Pre and Post Test DataELA/Reading Math
Pre Test Post Test Pre Test Post Test
Unit 1
Unit 2
Unit 3
Unit 4
Unit 5
Unit 6
End of year Totals

Third Grade Pre and Post Test DataELA/Reading Math
Pre Test Post Test Pre Test Post Test
Unit 1
Unit 2
Unit 3
Unit 4
Unit 5
Unit 6
End of year Totals

Fourth Grade Pre and Post Test DataELA/Reading Math
Pre Test Post Test Pre Test Post Test
Unit 1
Unit 2
Unit 3
Unit 4
Unit 5
Unit 6
End of year Totals

Fifth Grade Pre and Post Test DataELA/Reading Math
Pre Test Post Test Pre Test Post Test
Unit 1
Unit 2
Unit 3
Unit 4
Unit 5
Unit 6
End of year Totals

Kindergarten Grade Pre and Post Test DataELA/Reading Math
Pre Test Post Test Pre Test Post Test
Unit 1
Unit 2
Unit 3
Unit 4
Unit 5
Unit 6
End of year Totals

BES student Attendance Students missing 15 days or more
Aug. Sept. Oct. Nov. Dec. Jan. Feb. Mar. Apr. May
PK
K
1
2
3
4
5

BES student Attendance Students missing 10 days or more
Aug. Sept. Oct. Nov. Dec. Jan. Feb. Mar. Apr. May
PK
K
1
2
3
4
5

Faculty Missing 8 days or moreAug. Sept. Oct. Nov. Dec.
Certified
Classified
Totals
Jan. Feb. Mar. Apr. May
Certified
Classified
Totals

Student Behavior Referrals Aug Sept Oct Nov Dec Jan Feb Mar Apr May
Class
Bus
Total

Certified Staff Attendance
19
26
Number of Faculty Members
8 Days or moreless than 8

Classified Staff Attendance
1515
# of faculty memebers
More than 8 DaysLess than 8 days

School Nutrition
Series10
10
20
30
40
50
60
70
80
90
100
43.8
88.8
70Breakfast Partic-ipationLunch Participa-tionFree and Re-duced eligible

Staff Certification Levels
Bachelors Masters Specialist Doctorate 0
5
10
15
20
25
30
12
26
10
1
14
23
11
1
20132012
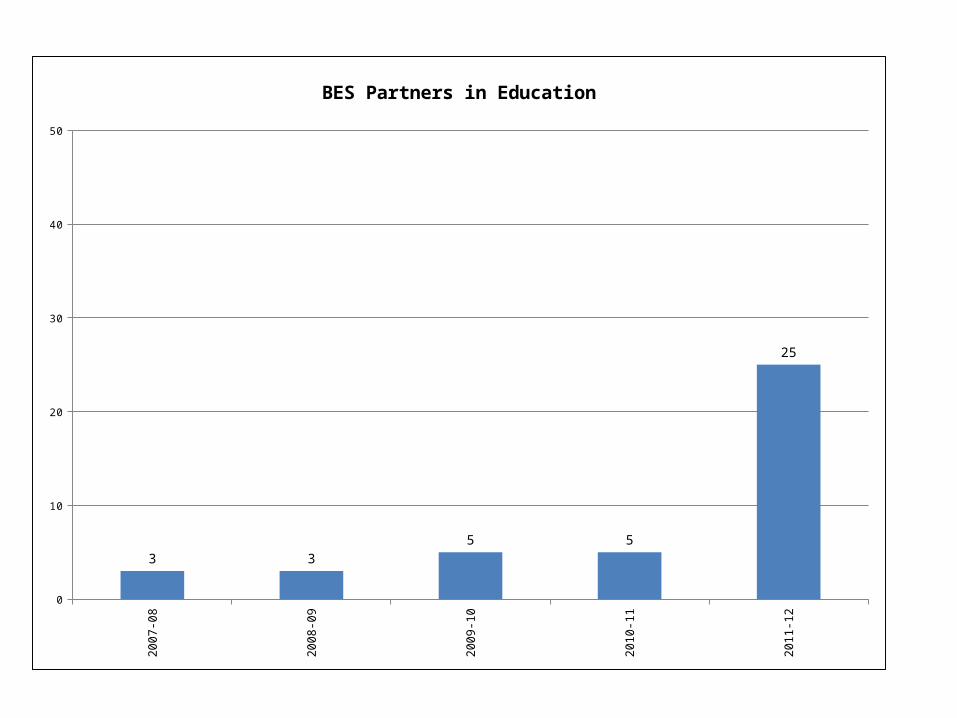
2007
-08
2008
-09
2009
-10
2010
-11
2011
-12
0
10
20
30
40
50
3 35 5
25
BES Partners in Education

BES Partners in Education
2008-2009 2009-2010 2010-2011 2011-2012 2012-20130
5
10
15
20
25
30
35
35 5
23
31