Embed Size (px)
Citation preview

African Conference:
Transformative Agenda for Official Statistics
Session 1:
Coordination at and between the global, (sub-) regional and national statistical
systems, communication, and advocacy
Mr. Pali Lehohla, Director General, Statistics South Africa
Libreville, Gabon
November 2015

The South Africa I know, the home I understand
Transformative Agenda for Statistics in Africa powered by NDPs, Agenda 2063 and SDGs
Pali Lehohla
Statistician-General South Africa
21 November 2015
Gabon

The South Africa I know, the home I understand
Africa’s Challenge
The heights by great men reached and kept
were not attained by sudden flight, but
they, while their companions slept,
were toiling upward in the night
The South Africa I know, the home I understand
Outline
Environment
Role of Statistics
Embracing the transformative agenda
Attendant risks
Conclusions

The South Africa I know, the home I understand
National Development Plan
Indicators on progress in the implementation on the NDP at present done through:MTSF(2014-2019) indicators Departmental indicatorsProvincial indicators
Implementation of NDP currently tracked through Programme of Action for Government (POA)
Agenda 2063:
A forward looking continental framework
Agenda 2063 anchored on the AU vision of “a shared strategic framework for inclusive growth and sustainable development ‘ and based on 7 aspirations derived from consultations
Sustainable development goals –A world that counts
Premised on the notion of ‘leave no one behind’
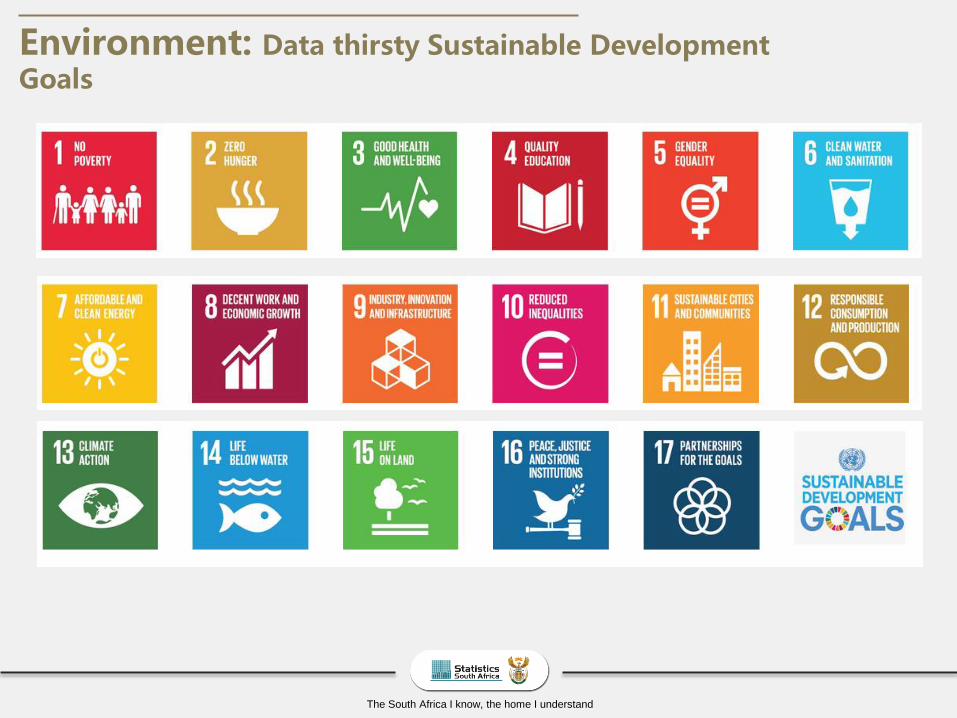
Transition from MDGs to SDGs means moving From 8 to 17 Goals, from 20 to 169 targets and from 60 to a minimum of 302 indicators
Environment: Demanding data – Post 2015 development agenda
Agenda 2063:
Fostering and Promoting Innovation to fill data gaps
Mobilizing resources to overcome data inequalities between developing and developed countries
Enhancing leadership and coordination to ensure that data revolution achieves fulfilment of sustainable development goals
The South Africa I know, the home I understand
Environment: Data thirsty Sustainable Development Goals
The South Africa I know, the home I understand
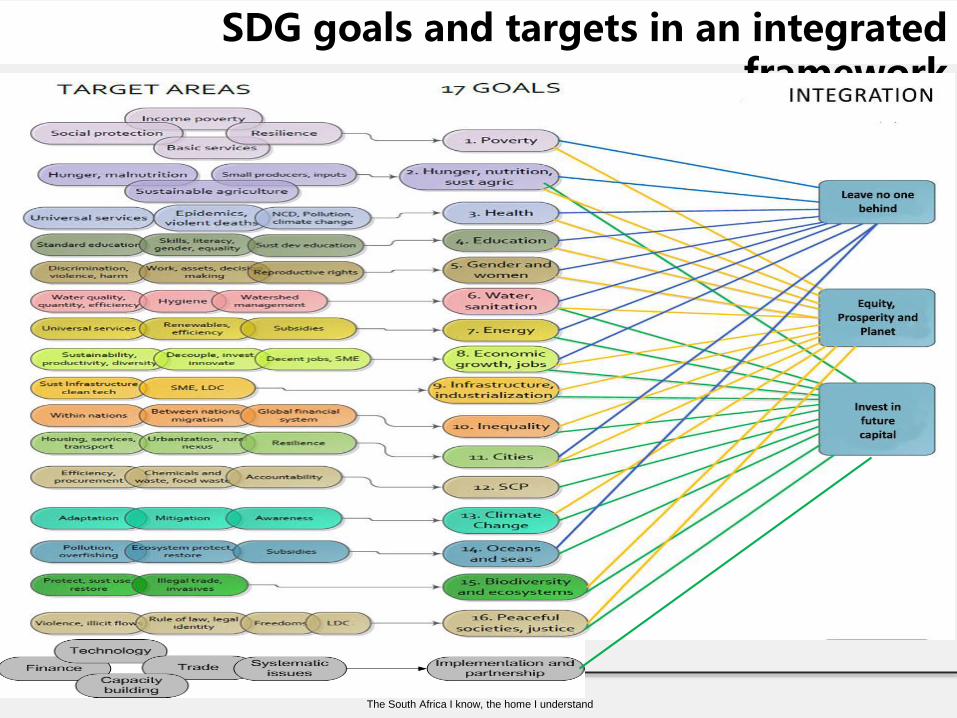
SDG goals and targets in an integrated framework
The South Africa I know, the home I understand
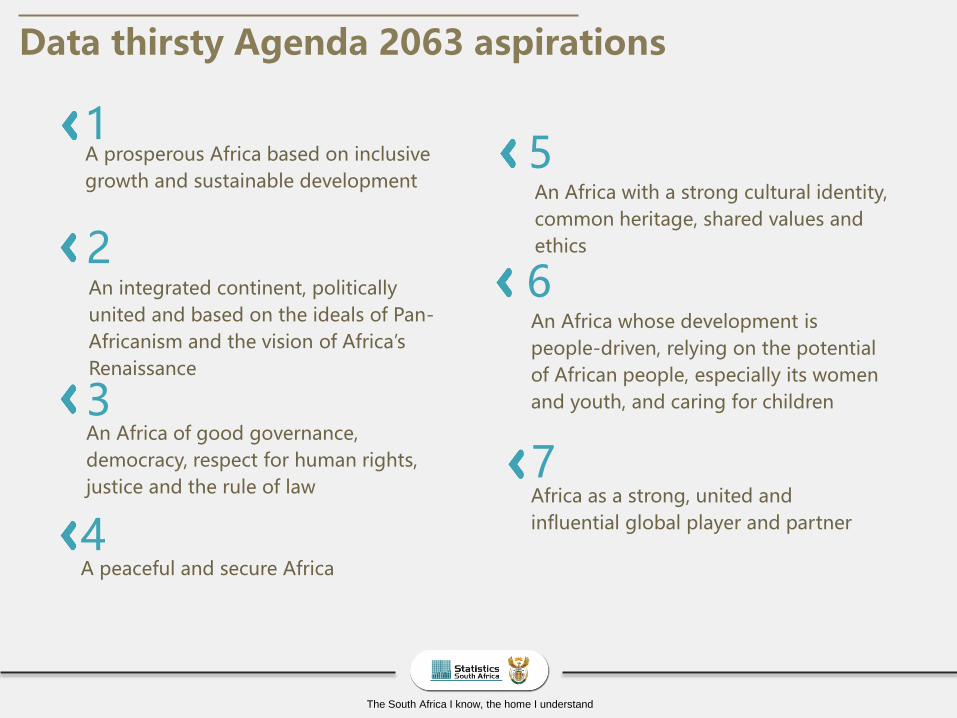
An integrated continent, politically
united and based on the ideals of Pan-
Africanism and the vision of Africa’s
Renaissance
2
An Africa of good governance,
democracy, respect for human rights,
justice and the rule of law
3
A peaceful and secure Africa
4
An Africa with a strong cultural identity,
common heritage, shared values and
ethics
5
An Africa whose development is
people-driven, relying on the potential
of African people, especially its women
and youth, and caring for children
6
Africa as a strong, united and
influential global player and partner
7
A prosperous Africa based on inclusive
growth and sustainable development
1
Data thirsty Agenda 2063 aspirations
The South Africa I know, the home I understand
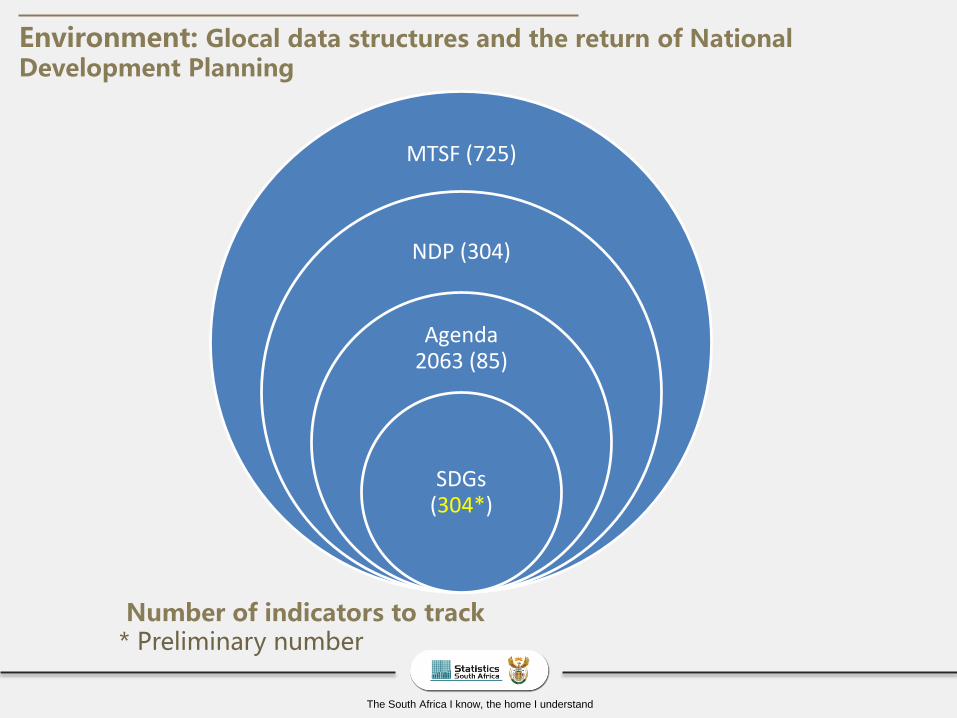
MTSF (725)
NDP (304)
Agenda 2063 (85)
SDGs (304*)
Number of indicators to track* Preliminary number
Environment: Glocal data structures and the return of National Development Planning
The South Africa I know, the home I understand
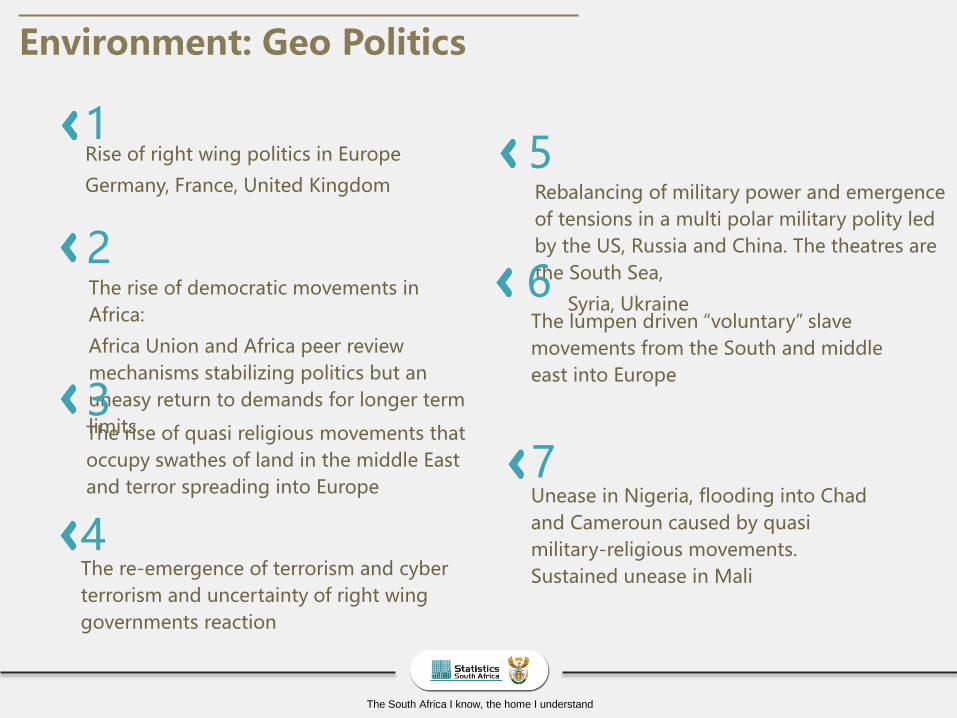
The rise of democratic movements in
Africa:
Africa Union and Africa peer review
mechanisms stabilizing politics but an
uneasy return to demands for longer term
limits
2
The rise of quasi religious movements that
occupy swathes of land in the middle East
and terror spreading into Europe
3
The re-emergence of terrorism and cyber
terrorism and uncertainty of right wing
governments reaction
4
Rebalancing of military power and emergence
of tensions in a multi polar military polity led
by the US, Russia and China. The theatres are
the South Sea,
Syria, Ukraine
5
The lumpen driven “voluntary” slave
movements from the South and middle
east into Europe
6
Unease in Nigeria, flooding into Chad
and Cameroun caused by quasi
military-religious movements.
Sustained unease in Mali
7
Rise of right wing politics in Europe
Germany, France, United Kingdom
1
Environment: Geo Politics
The South Africa I know, the home I understand
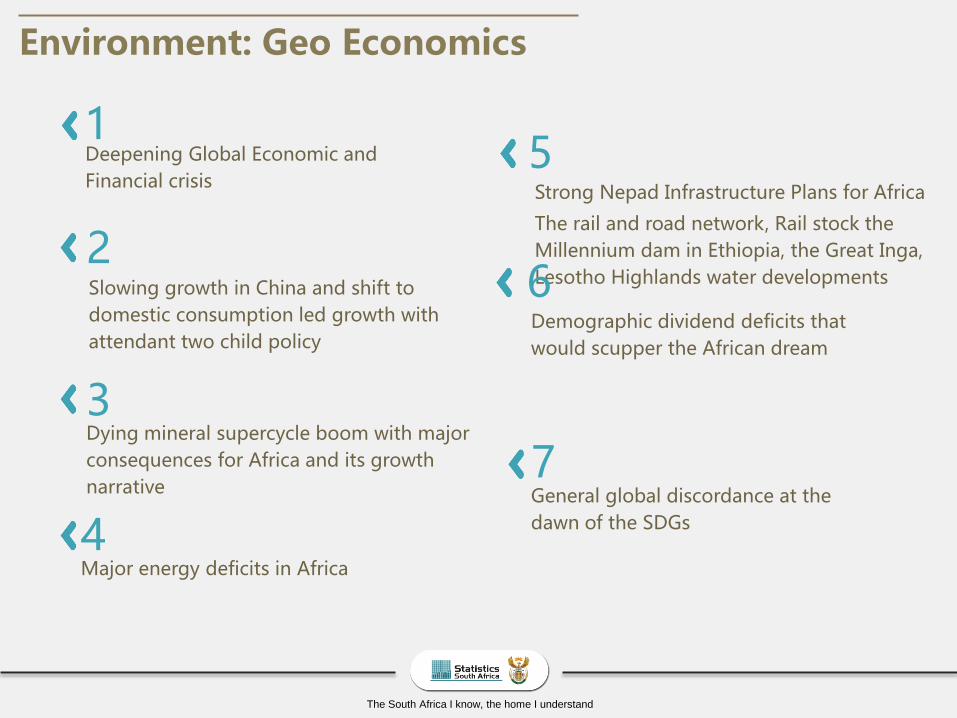
Slowing growth in China and shift to
domestic consumption led growth with
attendant two child policy
2
Dying mineral supercycle boom with major
consequences for Africa and its growth
narrative
3
Major energy deficits in Africa
4
Strong Nepad Infrastructure Plans for Africa
The rail and road network, Rail stock the
Millennium dam in Ethiopia, the Great Inga,
Lesotho Highlands water developments
5
Demographic dividend deficits that
would scupper the African dream
6
General global discordance at the
dawn of the SDGs
7
Deepening Global Economic and
Financial crisis
1
Environment: Geo Economics

The South Africa I know, the home I understand
Culmination of formation of Global Forum
for Data without official statisticians
2
Clumsy attempts by official statisticians to
claim World Data Forum
3
Poor and undefined governance mechanisms
for open data
4
Unstrategic and insular tactics by official
statisticians to cling to the power of numbers
5
Unguided possession of public data
holdings by mobi technologists
6
State capture through an unholy
alliance of data technology and money
and the destruction of the democracy
project
7
Emergent opportunistic coalitions of
technology, money, facilitators,
statistics and NGOs
1
Environment: IT, Money and Statistics capturing the state

The South Africa I know, the home I understand
Understanding that the Chief Statistician is
the Chief Statistician is the Chief
Communications Officer
2
Political clarity of mission both at country
and globally
3
Management excellence of resources
4
Clarity of running complexity of a public good
5
Competency and leading in subject
matter
6
Grasping the role of statistics and the
leadership challenge
1
Leadership: The Statistics Systems and their Role

The South Africa I know, the home I understand
SDG INDICATORS
• Common Africa
position on SDGs and
indicators
• Common Africa
Strategy based
costing of SDG
indicators
• A revised set of
indicators discussed in
Bangkok in October
• Inputs being
consolidated
• Final list to be
approved by UNSC in
March next year
AGENDA 2063
• Proposed list of
indicators to be
discussed and
finalised in Gabon
• Costing for
sustainable data
sources will be done
• Presentation of
proposed indicators
and costing document
to African Ministers in
January 2016
• Domestication of
Agenda 2063
NDP/MTSF
• MTSF indicators and
NDP
• DPME and Stats SA to
work together on
tracking indicators
• SDG/Agenda2063/ND
P/MTSF indicators
framework alignment
in progress
Africa Embracing the transformative agenda
The South Africa I know, the home I understand
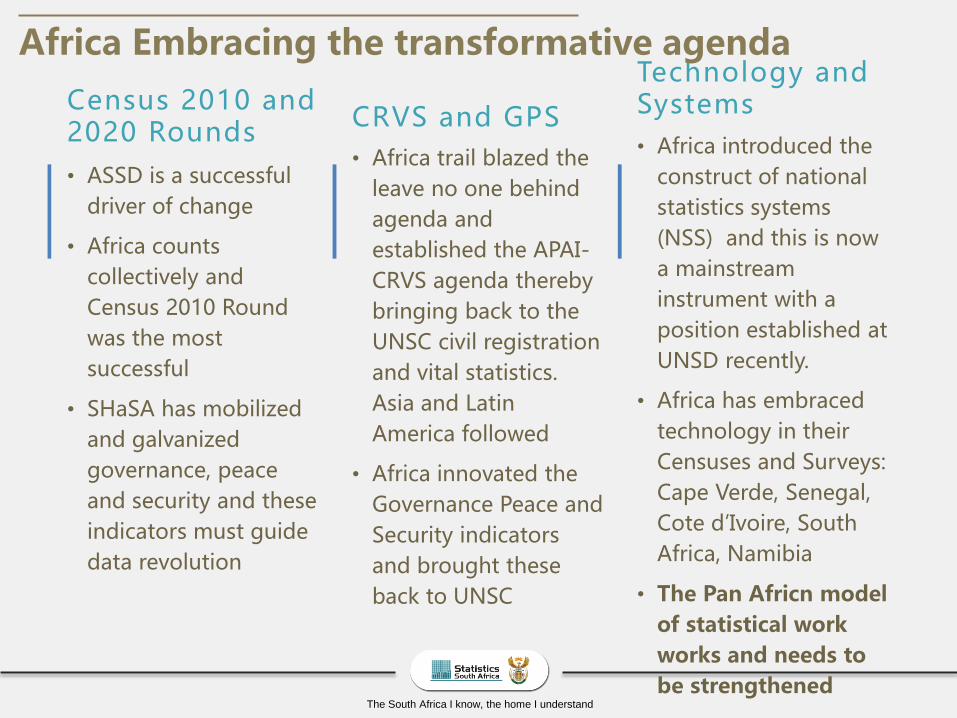
Census 2010 and 2020 Rounds
• ASSD is a successful
driver of change
• Africa counts
collectively and
Census 2010 Round
was the most
successful
• SHaSA has mobilized
and galvanized
governance, peace
and security and these
indicators must guide
data revolution
CRVS and GPS
• Africa trail blazed the
leave no one behind
agenda and
established the APAI-
CRVS agenda thereby
bringing back to the
UNSC civil registration
and vital statistics.
Asia and Latin
America followed
• Africa innovated the
Governance Peace and
Security indicators
and brought these
back to UNSC
Technology and Systems
• Africa introduced the
construct of national
statistics systems
(NSS) and this is now
a mainstream
instrument with a
position established at
UNSD recently.
• Africa has embraced
technology in their
Censuses and Surveys:
Cape Verde, Senegal,
Cote d’Ivoire, South
Africa, Namibia
• The Pan Africn model
of statistical work
works and needs to
be strengthened
Africa Embracing the transformative agenda
The South Africa I know, the home I understand
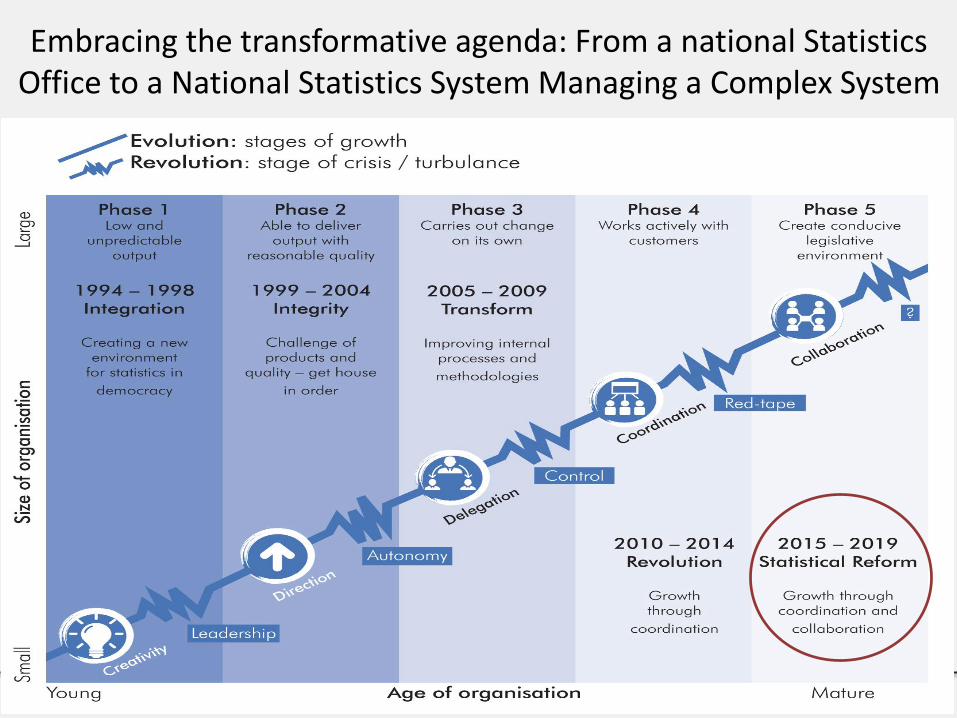
Embracing the transformative agenda: From a national Statistics Office to a National Statistics System Managing a Complex System
The South Africa I know, the home I understand
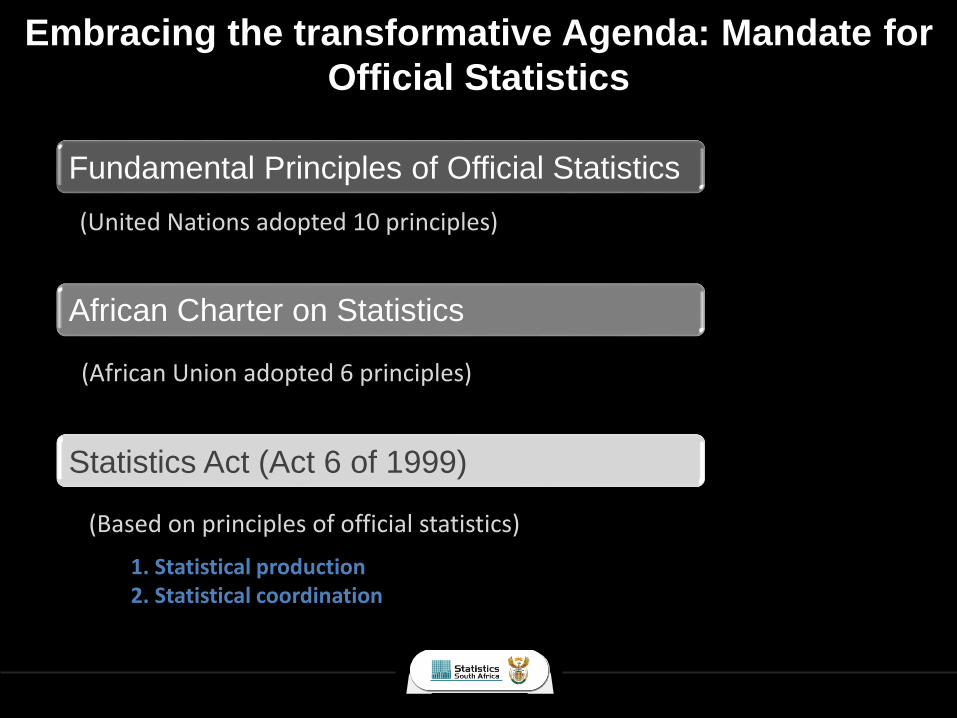
Embracing the transformative Agenda: Mandate for
Official Statistics
(United Nations adopted 10 principles)
African Charter on Statistics
Statistics Act (Act 6 of 1999)
Fundamental Principles of Official Statistics
(Based on principles of official statistics)
1. Statistical production2. Statistical coordination
(African Union adopted 6 principles)
The South Africa I know, the home I understand
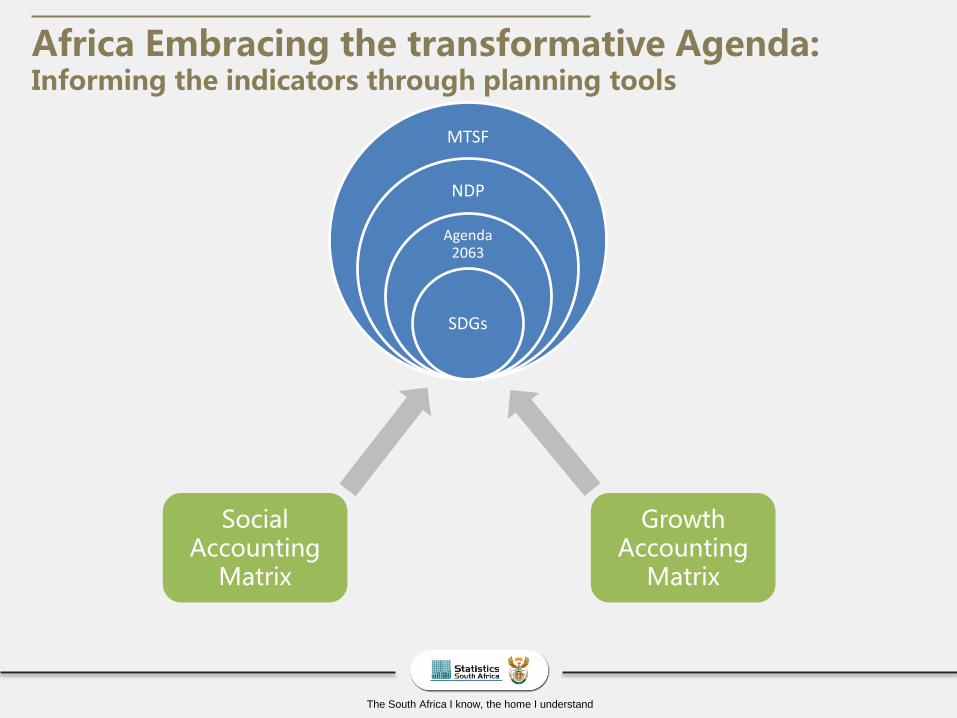
Social Accounting
Matrix
Growth Accounting
Matrix
Africa Embracing the transformative Agenda: Informing the indicators through planning tools
MTSF
NDP
Agenda 2063
SDGs
The South Africa I know, the home I understand
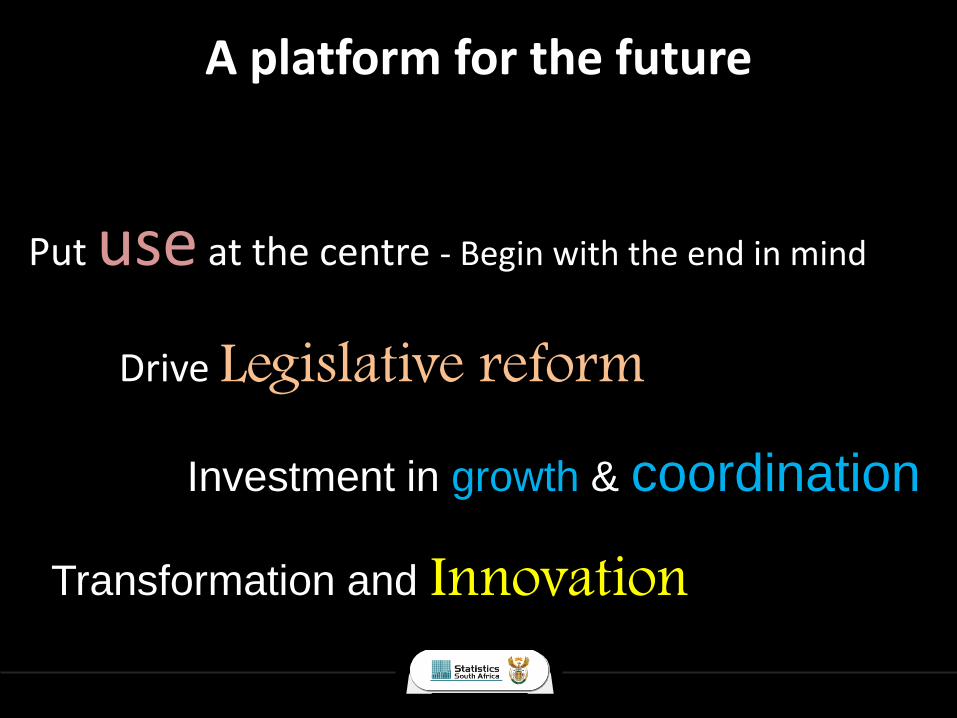
A platform for the future
Put use at the centre - Begin with the end in mind
Investment in growth & coordination
Transformation and Innovation
Drive Legislative reform
The South Africa I know, the home I understand
PR
OC
ESSE
SIN
PU
TSO
UTC
OM
EP
RO
DU
CTS
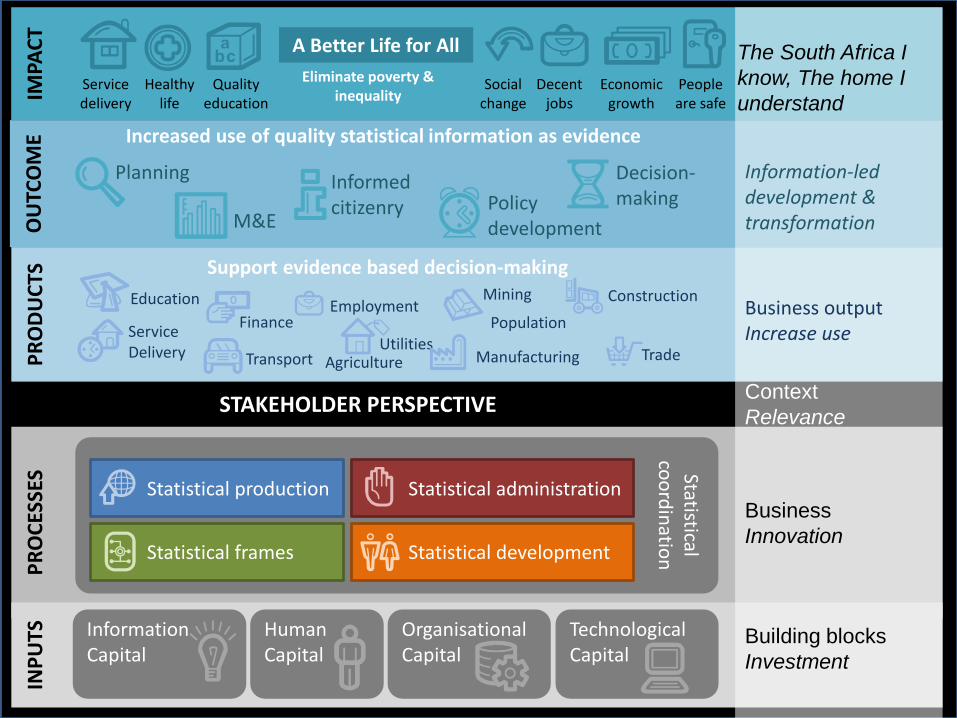
IMPA
CT
Information Capital
Human Capital
Organisational Capital
Technological Capital
Building blocks
Investment
Statistical co
ord
inatio
nStatistical development
Statistical administration
Statistical frames
Statistical productionBusiness
Innovation
A Better Life for All
Economic growth
Decent jobs
Healthy life
People are safe
The South Africa I
know, The home I
understandService delivery
Quality education
Eliminate poverty & inequality
Social change
Increased use of quality statistical information as evidence
Planning
Policy developmentM&E
Decision-making
Information-led development & transformation
Informed citizenry
Employment
Manufacturing
ServiceDelivery
Construction
Transport Agriculture Trade
Finance
Mining
UtilitiesPopulation
Education Business outputIncrease use
Support evidence based decision-making
STAKEHOLDER PERSPECTIVEContext
Relevance
The South Africa I know, the home I understand
Planning tools:Social Accounting
Matrix
The South Africa I know, the home I understand
What is a Social Accounting Matrix?
Provides a comprehensive picture of the
economic transactions of an economy,
including the interactions with the
household sector
The South Africa I know, the home I understand
• Integrates supply and use tables (SU-tables) and institutional
sector accounts into a single matrix format
• It is a presentation of the 2008 System of National Accounts
(2008 SNA) in a matrix format focusing on issues that are of
special interest in a country
• For example, an analysis of interrelationships between structural
features of an economy and the distribution of income and
expenditure among households groups
What is a Social Accounting Matrix? It ensures that no one is left behind

The South Africa I know, the home I understand
• Represents the link between two, often distinct, fields of
statistics, namely, economic and social statistics
• Provides a framework that ensures consistency across a range of
social statistics from different sources. Ensures consistency not
only between social statistics in the matrix, but also between
these social statistics and national accounts
What is a Social Accounting Matrix?

The South Africa I know, the home I understand
Main SAM matrix (examples):
• Trade and transport margins (27 products and services)
• Intermediate consumption (27 industries and 27 products and
services)
• Household final consumption expenditure (4 population groups,
12 percentile expenditure groups and 27 products and services)
• Imports and Exports (27 products and services)
• Total Output (27 industries and 27 products)
What does the SAM measure?
The South Africa I know, the home I understand
Main SAM matrix (examples):
• Generation of income (salaries and wages) (also from RoW)
(27 industries, 4 population groups, 11 occupational groups, 4
skill levels)
• Property income (4 institutional sectors)
• Current taxes on income and wealth (4 institutional sectors)
• Net disposable income (4 population groups, 12 percentile
expenditure groups )
• Net lending (by 10 financial institutions)
What does the SAM measure?
The South Africa I know, the home I understand
• Formal modelling, including feedbacks from non-monetary to
monetary variables (National Treasury, Non-governmental
organisations, researchers)
• Describe inequalities amongst household groups in SA society
• Pinpoint gaps in the available data sets and discrepancies in the
survey concepts
What does the SAM do?
The South Africa I know, the home I understand
National Development
Plan 2030

The South Africa I know, the home I understand
A responsive labour market
Improving labour market matching and transitions
Chapter 3: Economy and employment
National Development Plan 2030
The South Africa I know, the home I understand
SAM matrix 3.2a – Generation of income
Disaggregation of generation of labour
income (compensation of employees
(salaries and wages) into:
• 27 industries
• 4 Population groups
• 11 Occupational groups
• 4 skill levels
Chapter 3: Economy and employment
National Development Plan 2030
The South Africa I know, the home I understand
Extended SAM with Labour Accounts
Adds 3 external matrices (the Labour Accounts) to the main SAM
matrix:
1. Industry by highest level of education by population group
and gender (number of employees)
2. Industry by area of study by population group and gender
(number of employees)
3. Industry by highest level of education by population group
and gender (R million) (salaries and wages)
Chapter 3: Economy and employment
National Development Plan 2030
The South Africa I know, the home I understand
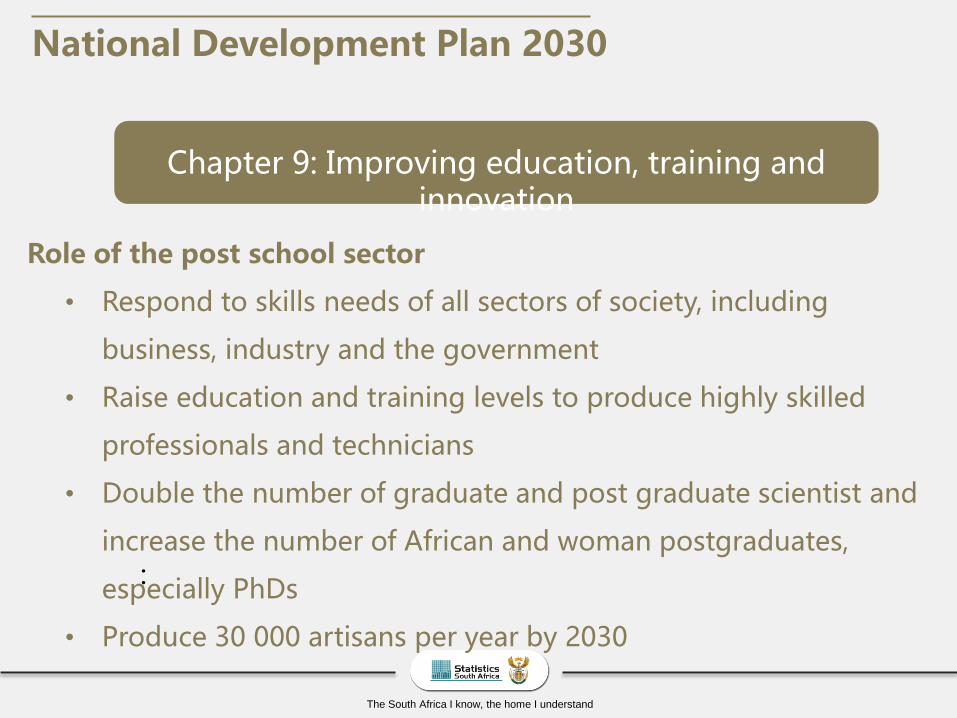
Role of the post school sector
• Respond to skills needs of all sectors of society, including
business, industry and the government
• Raise education and training levels to produce highly skilled
professionals and technicians
• Double the number of graduate and post graduate scientist and
increase the number of African and woman postgraduates,
especially PhDs
• Produce 30 000 artisans per year by 2030
:
Chapter 9: Improving education, training and innovation
National Development Plan 2030
The South Africa I know, the home I understand
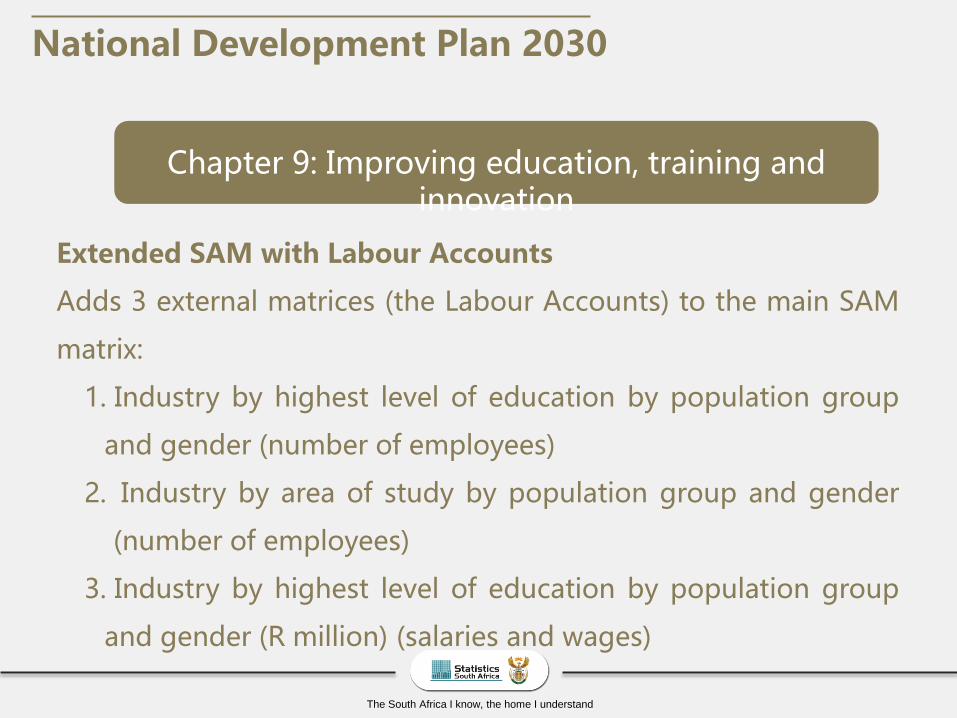
Chapter 9: Improving education, training and innovation
National Development Plan 2030
Extended SAM with Labour Accounts
Adds 3 external matrices (the Labour Accounts) to the main SAM
matrix:
1. Industry by highest level of education by population group
and gender (number of employees)
2. Industry by area of study by population group and gender
(number of employees)
3. Industry by highest level of education by population group
and gender (R million) (salaries and wages)
The South Africa I know, the home I understand
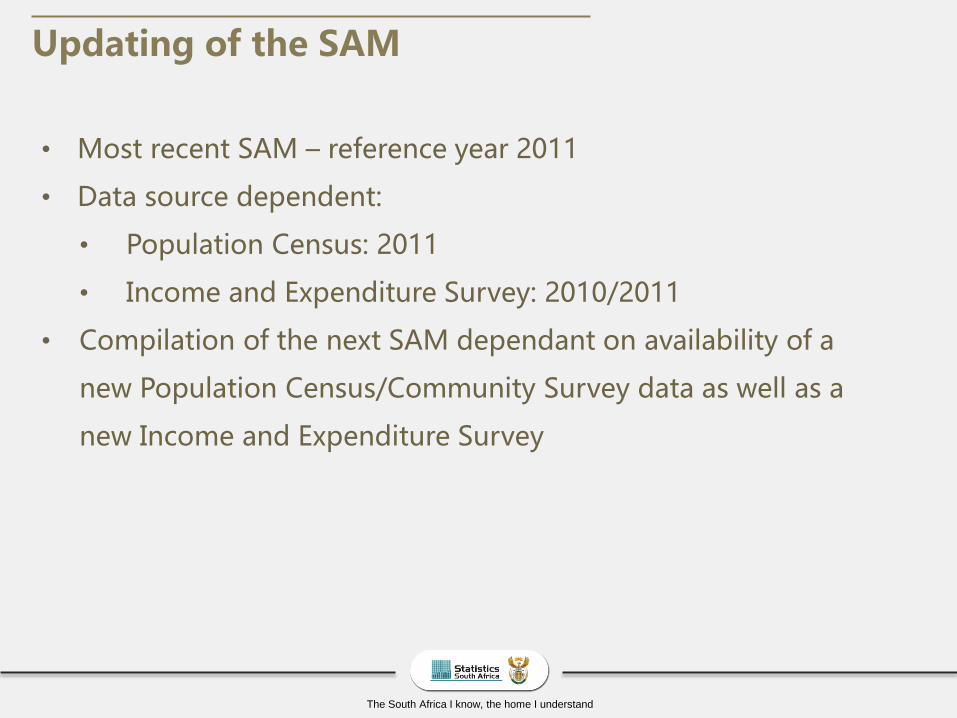
• Most recent SAM – reference year 2011
• Data source dependent:
• Population Census: 2011
• Income and Expenditure Survey: 2010/2011
• Compilation of the next SAM dependant on availability of a
new Population Census/Community Survey data as well as a
new Income and Expenditure Survey
Updating of the SAM
The South Africa I know, the home I understand
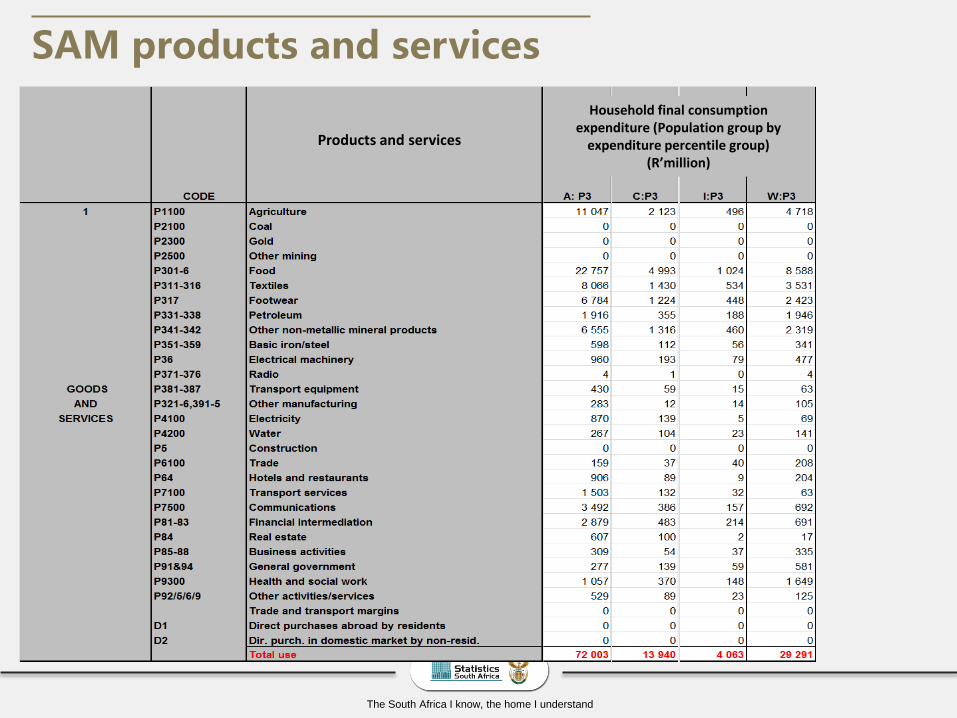
SAM products and services
Household final consumption expenditure (Population group by
expenditure percentile group)(R’million)
Products and services
The South Africa I know, the home I understand
Planning tools:Growth
Accounting Matrix
The South Africa I know, the home I understand
37
• A framework for the measurement of living standards by decomposing income per capita by its driving sources and their respective contributing factors
• Sources: total factor productivity, capital accumulation, demographic dividend, participation rate, and employment rate
• It is an analytical tool for analysing short to medium term developments in real incomes and the factors influencing them, thus also helping to assess what growth in potential output might look like
• It is empirically motivated and does not really on assumption theorising unless made to do so
• By design, it does not explain the underlying causes influencing incomes because it looks at the symptomatic factors associated with them
What is GAF?
The South Africa I know, the home I understand
38
• Interest in the framework is motivated by two policy issues:
• Comparison and benchmarking of economic growth performance as part of identifying the factors by which this performance can be improved, especially in achieving employment objectives;
• The extent to which technological progress must be nurtured as a primary ingredient for economic growth, with the view to improving the understanding on the role of skills in the labour force, which impacts education and social protection objectives
What is GAF?

The South Africa I know, the home I understand
39
• Stats SA has developed GAF for South Africa. Its key strength is its ability to probe economic growth performance and its drivers sub-nationally
• The Stats SA GAF illustrates how this growth and its drivers shape within and across provinces covering the last 20 years of SA’s economic landscape, as well as looking ahead until 2019 as per the Medium-term Strategic Framework (MTSF)
• The Stats SA GAF is ongoing in nature, being updatable every year together with a 5-year outlook, as evidence from official and national statistics on incomes, production, population, prices, tax collection, poverty, employment, and skills becomes available
• The Stats SA GAF is designed to be flexible such that it can accommodate improvements to its formulation and its measurement, which is something which will strengthen and mature with time
GAF for South Africa by Stats SA
The South Africa I know, the home I understand
40
• The Stats SA GAF gives strategic information on what policies could produce balanced economic growth, and how different factors can be paired for different growth scenarios according to their likelihood
• The Stats SA GAF decomposes the incomes per capita within and across provinces by their contributions from total productivity, capital accumulation, demographic development, work participation, and employment prospects, simultaneously with accounting for how these contributions are shaped by their respective drivers
• These drivers include the different dependency ratios from young to elderly, the changes in the make-up of employment between the working poor and the gainfully employed, the development of demographic forces as per the evolution of the labour force and those of working age, and the respective changes to capital generation brought by the trade-offs between labour productivity and the rates of return from capital investments
GAF for South Africa by Stats SA

The South Africa I know, the home I understand41
• The GAF is an analytical information tool that supports evidence-based decision-making by giving a birds-eye view of economic development sub-nationally at provincial level
• It is a tracking device for the monitoring of the employment, GDP growth, and terms of trade objectives of Chapter 3 of the NDP
• Likewise, it is a tracking device for the monitoring of the of MTSF 2014-2019 outcomes of decent employment through inclusive growth, and a capable workforce to support an inclusive growth path
• It is a strategic device for identifying and tracking the economic growth contributors for achieving the Agenda 2063 aspiration for inclusive growth and sustainable development
• It is a signalling device on the progress made on the Sustainable Development Goals of halving poverty (Target 1.2), growing the incomes of the poor at a rate higher than the National average (Target 10.1), and achieving gainful, i.e. productive employment for everyone in the labour force (Target 8.5)
Decision-making with the SA GAF
The South Africa I know, the home I understand42
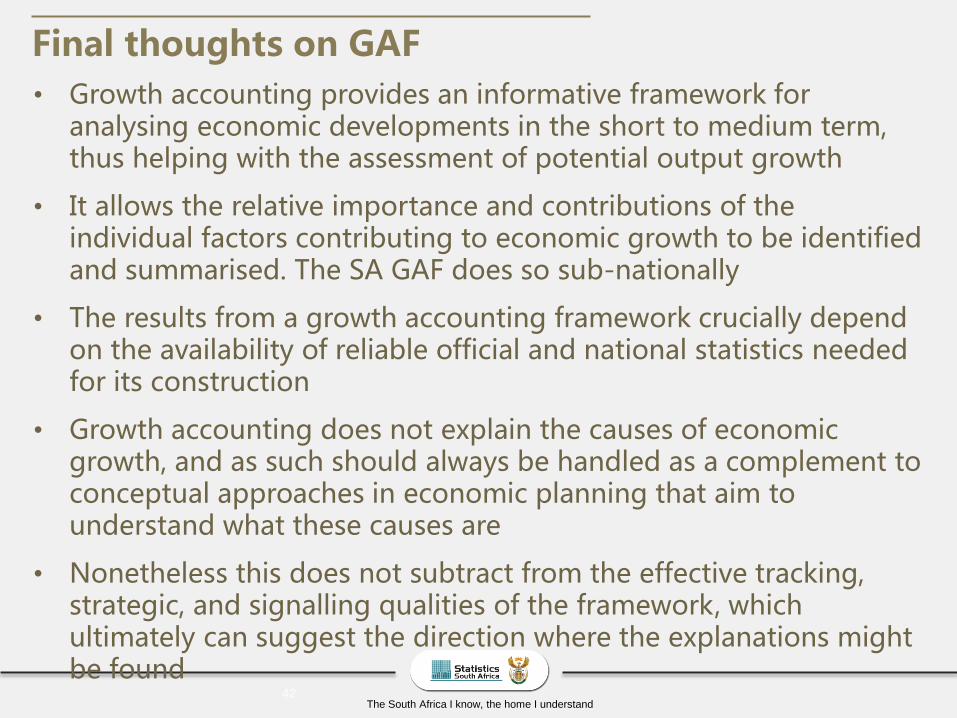
• Growth accounting provides an informative framework for analysing economic developments in the short to medium term, thus helping with the assessment of potential output growth
• It allows the relative importance and contributions of the individual factors contributing to economic growth to be identified and summarised. The SA GAF does so sub-nationally
• The results from a growth accounting framework crucially depend on the availability of reliable official and national statistics needed for its construction
• Growth accounting does not explain the causes of economic growth, and as such should always be handled as a complement to conceptual approaches in economic planning that aim to understand what these causes are
• Nonetheless this does not subtract from the effective tracking, strategic, and signalling qualities of the framework, which ultimately can suggest the direction where the explanations might be found
Final thoughts on GAF
The South Africa I know, the home I understand
ICP

The South Africa I know, the home I understand44
Nominal Expenditures Per Capita in U.S. Dollars, ICP 2011Selected African countries
The South Africa I know, the home I understand45
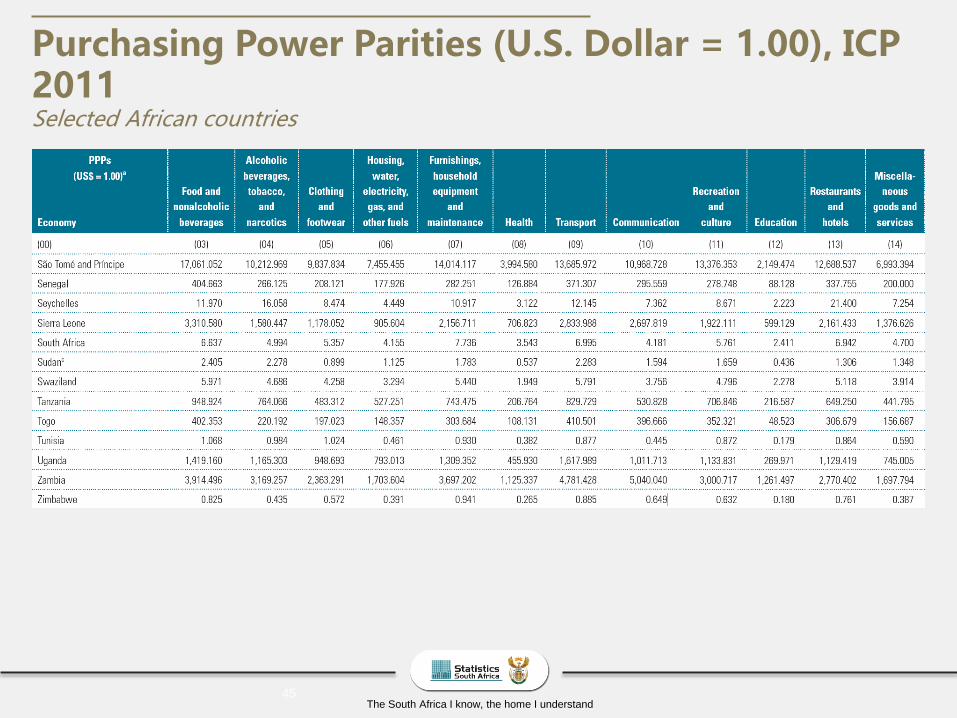
Purchasing Power Parities (U.S. Dollar = 1.00), ICP 2011Selected African countries
The South Africa I know, the home I understand46
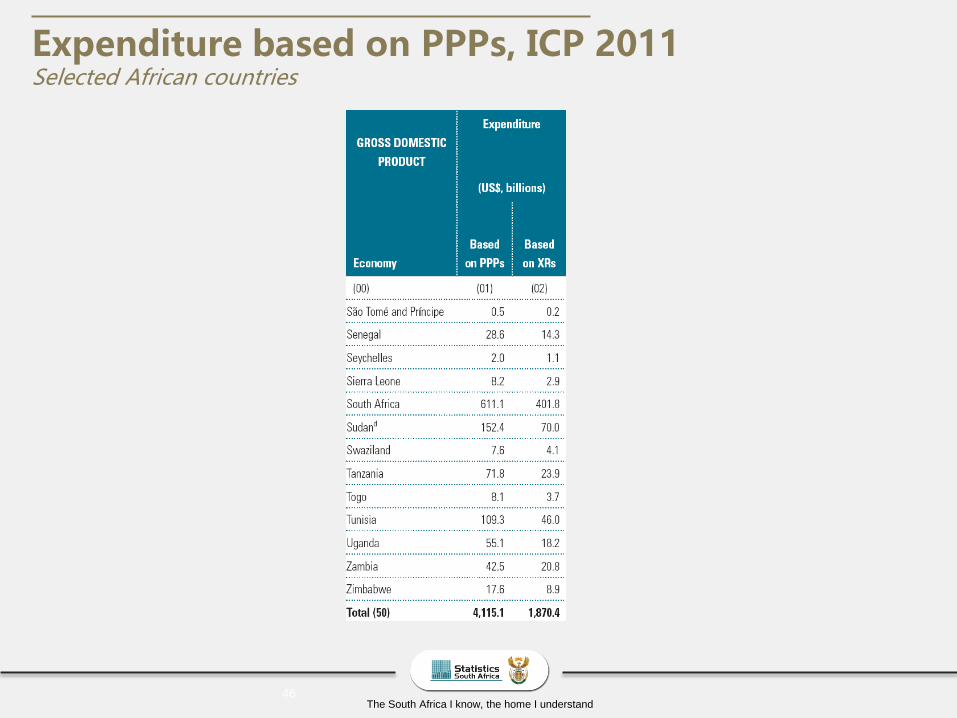
Expenditure based on PPPs, ICP 2011Selected African countries
The South Africa I know, the home I understand
T
S
T
AR
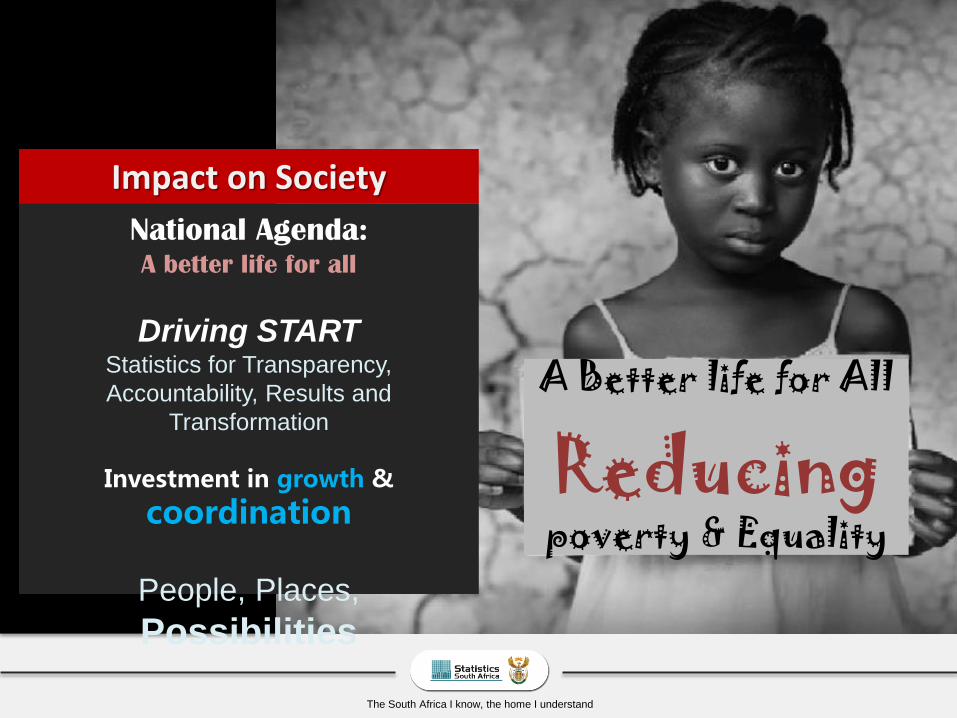
National Agenda:A better life for all
Driving STARTStatistics for Transparency,
Accountability, Results and
Transformation
Investment in growth &
coordination
People, Places,
Possibilities
Impact on Society
A Better life for All
Reducing poverty & Equality
The South Africa I know, the home I understand
Africa’s Challenge
The heights by great men reached and kept
were not attained by sudden flight, but
they, while their companions slept,
were toiling upward in the night